november - white rose university consortiumetheses.whiterose.ac.uk/12064/1/(final thesis)- rafid...
TRANSCRIPT

Analysis of the wear of oil wells drill bits
By
Rafid Kadhim Abbas
Submitted in accordance with the requirements for the degree of
Doctor of Philosophy
The University of Leeds
School of Chemical and Process Engineering
November
The candidate confirms that the work submitted is his own, except where work which
has formed part of jointly authored publications has been included. The contribution of
the candidate and the other authors to this work has been explicitly indicated below.
The candidate confirms that appropriate credit has been given within the thesis where
reference has been made to the work of others.
This copy has been supplied on the understanding that it is copyright material and that
no quotation from the thesis may be published without proper acknowledgment.
© 2015 The University of Leeds and Rafid Abbas

Section 3.1 of chapter three of this thesis has already been published in Onepetro
website (Abbas et al., 2014). The analyses, discussions and conclusions were all done
by Rafid Abbas. Other authors of this publication provided feedback and guidance.
Abbas, R. K., Hassanpour, A., Hare, C., & Ghadiri, M. (2014, November 12).
Instantaneous Monitoring of Drill Bit Wear and Specific Energy as a Criteria for the
Appropriate Time for Pulling Out Worn Bits. Society of Petroleum Engineers.
doi:10.2118/172269-MS.

P a g e | i
Acknowledgments
First of all I would like to thank my supervisors, Dr. Ali Hassanpour, Colin Hare and
Professor Mojtaba Ghadiri for their support as well as kindly providing me valuable
feedback and information. I would like to express my gratitude to Mr Stuart
Micklethwaite for his kind help and notes regarding using the facilities of the scanning
electron macrograph in Lemas at the University of Leeds.
I must here express my deep thanks and appreciation to my sponsor (The Ministry of
Higher Education and Scientific research in Iraq) for granting the opportunity to do my
PhD at the University of Leeds. A special word of thanks is given to Mr. Adrian Eagles
for helping me to use the instruments of surface profilemeter at the Institute of Medical
and Biological Engineering. Great acknowledgment is given to my colleagues from the
Institute of Particle Science and Engineering, especially Jabbar Gardy, Ahmed Al-
Saadi, Ali Mohammed, Mohammad Afkhami, Sandra, Rodrigo, Akinola, Amin, Dr.
Faiz Mahdi (Postdoc.) and Mohammadreza. Special word of thanks is given to Dr.
Umair Zafar (Postdoc.) in Ghadiri group for his assistance in carrying out nano-scratch
tests. Furthermore, I must not forget the precious information given by Prof. Ben Beake
(Micromaterials, UK) for his help regarding the nano-scratch test.
I am indebted to my beloved parents for their support and encouragement during my
whole life and specifically throughout my study. I would like to mention the
immeasurable support from my wife and from my children Younis, Zainab, Fatima and
my adorable daughter Ghadir.
Finally, I have to thank members of Ghadiri group who gave me valuable feedback
during my presentations and I extend my compliments to all who participated in this
work that I forgot to mention his or her name.

P a g e | ii
This work is dedicated to my loving parents and my
beloved family
For their infinite support and always being with me

P a g e | iii
Abstract
Predicting the wear of drill bits is essential for all oil companies to maximise drilling
efficiency and reduce loss in money and time. Typically, this problem has been dealt
with by evaluating the specific energy of the drill bits at drilling formation intervals.
Although this technique sometimes provides a good indication of the bit tooth wear, a
number of phenomena such as bit balling and high vibration of the drill bit might give
misleading results that affect the reliability of these techniques. Therefore, it is
necessary to develop an effective predictive tool for the bit tooth wear rate by both
experimental and theoretical approaches.
A case study is presented for the evaluation of the specific energy combined with
dimensionless drilling parameters method as indicating tools for monitoring the wear of
the roller-cone bits. The results were compared with the qualitative tooth wear index of
the bits and an agreement was found for limited cases. The case study did not include
the mechanical properties of the materials that form the bit, therefore a wear model was
needed to combine the drilling parameters with the mechanical properties of the
materials forming the bit under the phenomena of three body abrasion where the drill
bits are in reality facing this effect. The new formula for quantifying the bit tooth wear
is presented and compared with the qualitative bit tooth wear index, where close
matching was obtained.
Experimental studies were carried out on polycrystalline diamond compact cutters from
two manufacturers. The mechanical properties were determined by micro-indentation as
well as nano-indentation testing on the diamond and the substrate layers of the cutters.
Microstructural properties of the materials forming the PDC cutters found to be
effective on the mechanical properties and consequently on the amount of wear. The
volume of wear for the PDC cutters was determined experimentally using micro and
nano-scratch tests of PDC cutters. The experimental wear was compared with the
predicted wear based on current approaches in the literature. The results show that the
wear of both layers of PDC cutters in this work can be predicted by the material
mechanical properties and the applied load on the indenter. The analytical study based
on various scanning electron microscopy techniques revealed that the main dominant
wear mechanism for the substrate and the diamond layers is abrasive wear in the format
of ploughing and cutting.
Keywords: bit tooth wear; PDC bits; roller-cone bits; micro-scratch testing; nano-
scratch testing.

P a g e | iv
Table of Contents
Acknowledgments .............................................................................................................. i
Abstract ............................................................................................................................ iii
List of Figures ................................................................................................................ viii
List of Tables................................................................................................................... xv
Nomenclature ................................................................................................................ xvii
Latin Characters ...................................................................................................... xvii
Greek Characters .................................................................................................... xxii
Chapter 1 Introduction ......................................................................................................
Wear of oil and gas drill bits ................................................................................
1.2 Objectives of the thesis ..........................................................................................
Chapter 2 Literature Review on Oil and Gas Drill Bit Wear ............................................
2.1 An overview of wear mechanisms of oil and gas drill bits .................................
2.1.1 Wear mechanisms of roller-cone bits ...............................................................
2.1.2 Wear mechanism of PDC bits ...........................................................................
2.2 Drill bit testing .....................................................................................................
2.2.1 Roller-cone bit testing .....................................................................................
2.2.1.1 Abrasion testing .......................................................................................
2.2.1.2 Scratch testing ..........................................................................................
2 Testing of PDC bits........................................................................................
2.2.2.1 Destructive testing ....................................................................................
2.2.2 .2 Semi-destructive testing ..........................................................................
2.2.2 .3 Non-destructive testing ...........................................................................
2.2.2.4 Analytical study .......................................................................................
Theoretical background on wear quantification ..............................................
2.3.1 The aim of the theoretical background ...........................................................
2.3.2 Quantification methods of bit wear ................................................................
2.3.2.1 Specific energy (SE) technique ................................................................
2.3.2.2 Wear and Measurements While Drilling (MWD) ....................................
2.3.2.3 Other quantification methods of wear ......................................................
2.3.3 Wear quantification using simulation methods ..............................................
2.3.3.1 Finite Element Analysis (FEA) ................................................................
2.3.3.2 Discrete Element Method (DEM) ............................................................
2.4 Novel methods for improving roller-cone and PDC drill bits .........................

P a g e | v
2.4.1 Enhanced inserts .............................................................................................
Co-Composition and various grain size graded cemented carbides ...............
2.4.3 Honeycomb structured polycrystalline diamond and Double Cemented
tungsten carbide (DC) ..............................................................................................
2.4.4 New Steel PDC bits (NSPDC) ........................................................................
2.4.5 Diamond Enhanced Inserts or Cutters (DEI) ..................................................
2.4.6 Thermostable PDC (TSPD) cutters.................................................................
2.4.7 Selection of binder with additives ..................................................................
2.5 Discussion .............................................................................................................
2.6 Conclusions ..........................................................................................................
Chapter 3 Case Study ......................................................................................................
3.1 Real-time monitoring of drill bit wear and specific energy as a criteria for the
appropriate time for pulling out worn bits .............................................................
3.1.1 Introduction .....................................................................................................
3.1.2 Objectives .......................................................................................................
3.1.3 Data acquisition ..............................................................................................
3.1.4 Analysis of the results and discussion ............................................................
3.1.5 Conclusions .....................................................................................................
3.2 A New Approach for Predicting the Wear of Roller-Cone Bits using the
Concept of Three Body Abrasion .............................................................................
3.2.1 Introduction .....................................................................................................
3.2.2 Objectives .......................................................................................................
3.2.3 Classification of the bit tooth wear .................................................................
3.2.4 IADC dull bit grading .....................................................................................
3.2.5 Theory .............................................................................................................
3.2.6 Results and discussion ....................................................................................
3.2.7 Conclusions .....................................................................................................
Chapter 4 Experimental Work (Indentation Testing) ......................................................
4.1 Samples preparation ...........................................................................................
4.1.1 Surface roughness test (before polishing) .......................................................
4.1.2 Polishing process ............................................................................................
4.1.3 Surface roughness test (after polishing)..........................................................
4.2 Indentation testing ...............................................................................................
4.2.1 Nano-indentation test ......................................................................................
4.2.1.1 Nanoindentation of tungsten carbide – cobalt layer (WC-Co) ................

P a g e | vi
4.1.1.2 Nanoindentation of diamond table layer ................................................
4.2.2 Analytical study of the samples after nano-indentation test .........................
4.2.3 Micro-indentation test ...................................................................................
4.2.3.1 Vickers micro-indentation ......................................................................
4.2.3.1.1 Vickers microindentation of the substrate layer ........................
4.2.3.1.2 Vickers microindentation of the diamond layer .........................
4.2.3.2 Knoop microindentation ........................................................................
4.2.3.3 Fracture toughness measurements..........................................................
4.2.3.3.1 Fracture toughness measurements of WC-Co ............................
4.2.3.3.2 Fracture toughness measurements of diamond layer ...............
4.3 Micro-structural properties and cobalt content of PDC cutters ...................
4.4 Conclusions ........................................................................................................
Chapter 5 Experimental Scratch Testing.......................................................................
5.1 Micro-scratch testing ........................................................................................
5.1.1 Micro-scratch test of the substrate layer of the PDC samples using Vickers
indenter ..................................................................................................................
5.1.2 Micro-scratch test of the diamond layer of the PDC samples using Vickers
indenter ..................................................................................................................
5.1.3 Micro-scratch test of the substrate layer of the PDC samples using a
spheroconical indenter ...........................................................................................
5.1.4 Micro-scratch test of the diamond layer of the PDC samples using
spheroconical indenter ...........................................................................................
5.1.5 Analytical study ............................................................................................
5.1.5.1 Substrate layer ........................................................................................
5.1.5.2 Diamond layer ........................................................................................
Nano-mechanical testing (Scratch test) ...........................................................
5.2.1 Nano-scratch of the substrate layer ...............................................................
5.2.2 Nano-scratch of the diamond layer ...............................................................
5.3 Normalisation of the wear.................................................................................
5.4 Conclusions ........................................................................................................
Chapter 6 Conclusions and Recommended Future Work .............................................
6.1 Conclusions ........................................................................................................
6.2 Contribution to the Knowledge ........................................................................
6.3 Recommended Future Work ............................................................................
References .....................................................................................................................
Appendix A (Derivations of Equations) ............................................................................ I

P a g e | vii
A-Derivation of the Mechanical Specific Energy (MSE) equation of Teale (1965)
and the Specific Energy (SE) equation of Rabia (1985) ............................................ I
B- Hook’s law derivation of the net stiffness of the sample .................................... II
C-Derivation of the area of the worn material after micro-scratch test with
conical indenter .......................................................................................................... III
Appendix B (Further Figures of Chapter Three).............................................................. V
Appendix C (Further Figures of Chapter Four) ............................................................ VII
Appendix D (Further Figures of Chapter Five) ............................................................... X

P a g e | viii
List of Figures Figure Shematic diagram of the work plan .............................................................................
Figure SEM images of wear scars formed by the process of micro-ploughing ......................
Figure SEM images for large wear particle formed by micro-cutting ....................................
Figure 2.3 Typical failure modes of PDC inserts for rock drill bit ...............................................
Figure Smooth wear on the diamond layer (after Tze-Pin et al., ..................................
Figure 2.5 Microchipping damage at the edge of the PDC insert .................................................
Figure 2.6 Schematic image of the microchipping failure of the PDC cutter ...............................
Figure 2.7 Delamination failure mode of PDC cutter (Tze-Pin et al., ................................
Figure 2.8 Schematic image of the microfracturing failure (Zacny, 2012) ...................................
Figure 2.9 An example of microfracturing failure (Zacny, 2012) ................................................
Figure 2.10 Schematic image of the macrofracturing failure (Zacny, 2012) ................................
Figure 2.11 An example of macrofracturing failure of the PDC cutter ........................................
Figure Schematic image of gross fracturing failure mode (Zacny, 2012) .............................
Figure 2.13 Gross fracturing failure of the PDC insert (Zacny, 2012) .........................................
Figure 2.14 Schematic image of ultimate fracturing failure mode (Zacny, 2012) ......................
Figure 2.15 Ultimate fracturing in PDC cutter (Zacny, 2012) ....................................................
Figure 2.16 Mass loss of bit materials when abraded against sandstone (Mouritz and Hutchings,
...........................................................................................................................................
Figure 2.17 Mass loss of bit materials when abraded against limestone ....................................
Figure 2.18 Abrasion testing of a PDC cutter using a vertical lathe ...........................................
Figure Spalled cutters after impact testing (Bellin et al., 2010 b) ......................................
Figure 2.20 Spallation chart of impacted PDC inserts (Bellin et al., 2010 b) .............................
Figure 2.21 Load–displacement curves measured during nanoindentation of NPD, CBN and
PCD samples (Couvy et al., ..............................................................................................
Figure 2.22 Microscopic image of the scratches produced by micro-scratch test ......................
Figure 2.23 (a) C-scan test to detect flaws in the diamond of the PDC cutter (Bellin et al., 2010
b) (b) Acoustical emissions toughness test (Varel International, 2010). ....................................
Figure 2.24 Raman shift of poor wear resistance of a TSDC sample .........................................
Figure 2.25 Raman spectrum of high wear resistance of a TSDC specimen ..............................
Figure 2.26 3D X-ray image of a poor wear resistance PDC cutter showing the intrusions of WC
–substrate (blue colour) to the outer surface (Boland and Lee, 2010) ........................................
Figure Drilling efficiencies of tungsten-carbide roller cone and PDC bits .........................
Figure Rabinowicz model for abrasive wear (Rabinowicz, 1996) ......................................
Figure 2.29 Simple scheme of finite element modelling (Budinski, 2007) ................................
Figure FEA simulation results showing the stress distribution at the diamond-to-substrate
interface (Bellin et al., 2010 b) ...................................................................................................
Figure 2.31 A simplified DEM model of a drill cutter removing a cutting by the means of
breaking the bonds between the particles (Favier, 2007) ............................................................
Figure 2.32 Rock cutting process using DEM model (Akbari et al., ................................
Figure 2.33 Cross section of enhanced inserts (Sneddon and Hall, 1988) ..................................
Figure Honeycomb structured polycrystalline diamond (Fang et al., ......................
Figure 2.35 Optical micrograph image of conventional and DC carbides ..................................
Figure 2.36 Chipping resistance and durability of a rock drill bit insert enhanced with the
honeycomb structured PDC/WC-Co. (Fang et al., ...........................................................
Figure 2.37 Comparison of rock bit inserts with DC carbide and conventional WC-Co. after
field test (Fang et al., ........................................................................................................

P a g e | ix
Figure 2.38 New Steel PDC (NSPDC) bit, (6-1/8") with 7 interchangeable nozzles .................
Figure Dullness condition of the NSPDC bit after drilling .................................................
Figure Using the technology of heel row inserts (Cobb et al., .................................
Figure Progression of damages on diamond enhanced inserts ............................................
Figure Comparison between 1st
nd and 3
rd generations of diamond heels, where each
generation has been applied in a cone within the same roller- bit ..............................................
Figure Starting and finishing stages of HPHT sintering process ........................................
Figure Two types of TSPD bits used in the run test, ISM-AP-214, 3C type on the left and
ISM-AP-165, 1C type on the right (Osipov et al., ............................................................
Figure Location of main oil fields in southern Iraq (Abeed et al., .............................
Figure Southern Iraq Stratigraphic column for main oil fields in Basrah region ..................
Figure Specific energy vs. depth for well A ........................................................................
Figure Qualitative tooth dullness vs. depth for well A (Provided from bit records obtained
from the section of Petroleum Engineering of South Oil Company) ..........................................
Figure 3.5 Cross plot of dimensionless torque (TD) with dimensionless square root of
penetration rate (RD) for well A .................................................................................................
Figure 3.6 Comparison between dimensionless bit tooth flatness (FD) and the actual tooth wear
versus depth for well A ..............................................................................................................
Figure 3.7 Specific energy vs. depth for well B ........................................................................
Figure Bit tooth flatness (FD) compared to the qualitative bit tooth wear ............................
Figure 3.9 Specific energy vs. depth for well B ........................................................................
Figure Bit tooth flatness and qualitative bit tooth wear versus depth for well B ...............
Figure .11 Specific energy vs. depth for well A ......................................................................
Figure Comparison between tooth flatness (FD) and qualitative tooth wear versus depth for
well A ........................................................................................................................................
Figure Specific energy vs. depth for well B ......................................................................
Figure Tooth dullness compared to the qualitative bit tooth wear versus depth for well B
....................................................................................................................................................
Figure Classification of roller-cone bits according to IADC ..............................................
Figure IADC grading system for drill bits (McGehee et al., 1992 b) .................................
Figure IADC grading system for drill bits (Rashidi et al., .......................................
Figure Differences between (a) two-body abrasion and (b) three-body abrasion ...............
Figure Suggested model for abrasive wear (based on Rabinowicz, 1996) .........................
Figure 3.20 Force balance on the bit and the teeth (Nguyen, 2011) ...........................................
Figure 3.21 Schematic sketch of the cone in contact with the surface of the rock (a) insert in
contact with rock (b) ...................................................................................................................
Figure Schematic geometry of the bit (a) (Erno, 2014) and schematic sketch of the legs of
the cones (b) ................................................................................................................................
Figure Real-time predicted bit tooth wear rate from different power indices of the modified
Rabinowicz equation compared to the real-time qualitative bit wear rate for well A in the south
of Iraq ..........................................................................................................................................
Figure Comparison between the predicted wear from the new model (power 2.5) and the
dimensionless bit tooth wear along with recorded field bit wear ................................................
Figure Real-time predicted tooth wear rate obtained from power index 2.5 compared with
the real-time recorded tooth wear rate for well B ......................................................................
Figure Real-time predicted tooth wear rate obtained from power index 2.5 compared with
the real-time recorded tooth wear rate for well B ......................................................................

P a g e | x
Figure Real-time predicted tooth wear rate compared with the real-time recorded wear rate
for well A ...................................................................................................................................
Figure Real-time predicted tooth wear rate compared with the real-time recorded wear rate
for well B ...................................................................................................................................
Figure Oil PDC cutters manufactured by two different manufacturers ................................
Figure Selected positions 1 and 2 on the surface of the PDC sample ...................................
Figure Surface profile measurement of the diamond layer for the PDC insert at .................
Figure Surface profile measurement of the diamond surface for the PDC cutter at position 2
before polishing ..........................................................................................................................
Figure Surface profile measurement of the substrate layer for the PDC insert at position 1
before polishing ..........................................................................................................................
Figure Surface profile measurement of the tungsten-carbide layer for the PDC insert at
position 2 before polishing ..........................................................................................................
Figure Metaserv 250 Grinder-Polisher on the left and the circular silicon carbide polishing
papers used with the polishing machine on the left. ...................................................................
Figure Diamond compound paste for finishing ....................................................................
Figure Two Dimensional Surface profile measurement of the diamond layer for the PDC
cutter after polishing ...................................................................................................................
Figure Two Dimensional Talysurf graph of the substrate layer at position 1after polishing
....................................................................................................................................................
Figure NanoTest equipment by Micro Materials Ltd. UK ..................................................
Figure Schematic diagram of the indentation action (Beake et al., ..........................
Figure Schematic relationship of the relationship between the applied load and the
displacement (Oliver and Pharr, 1992) .......................................................................................
Figure Applied force against displacement for tungsten carbide-cobalt .............................
Figure Load versus penetration curve for tungsten carbide-cobalt ...................................
Figure Force- displacement curve for tungsten carbide-cobalt .........................................
Figure Obtained nanoindentation hardness versus applied loads for the tungsten carbide-
cobalt layer along with the reported literature values ...............................................................
Figure Young’s modulus results against applied force for the tungsten carbide-cobalt
substrate within the reported previous values ...........................................................................
Figure Measured Young’s modulus vs hardness for the substrate ...................................
Figure Load versus the indentation depth for the PDC-Co layer in test 1 at fixed load of 50
mN ............................................................................................................................................
Figure Displacement – load graph of the diamond layer in test 2 .....................................
Figure Typical graph of test 3 for the diamond table in PDC samples .............................
Figure Load – penetration curve for the diamond layer ....................................................
Figure Indentation hardness for various zones in PDC layer within the reported previous
values obtained from Dubrovinskaia 2006 , Ndlovu 2009 and Osipov 2010 ..........................
Figure Young’s modulus for different zones in PDC layer within the reported previous
values obtained from Osipov 2010 and Ndlovu 2009 ...............................................................
Figure Measured Young’s modulus vs hardness for the PDC layer ................................
Figure Modes of signals interaction in a sample (Krumeich, 2011) .................................
Figure Interface section of diamond table and tungsten carbide substrate .......................
Figure SEM micrograph (a) backscattered image (b) for the tungsten carbide-cobalt layer
(substrate) of the PDC samples .................................................................................................
Figure SEM image (a) and BSE image (b) for the diamond layer of the PDC cutter .......

P a g e | xi
Figure Backscaterred micrographs and a coloured X-ray map of the PDC layer displaying
three spectrum points ................................................................................................................
Figure EDS spectroscopy at point 3 on the diamond layer of the PDC cutter ..................
Figure Spectrum at point 4 on the diamond layer of the PDC insert ................................
Figure EDS spectroscopy at point 7 on the diamond layer of the PDC specimen ............
Figure Backscattered electron images showing selected spectrum spots with X-ray map of
the tungsten carbide layer .........................................................................................................
Figure EDS spectroscopy at point 33 on the substrate layer of the PDC specimen ..........
Figure Spectroscopy graph and mineral composition at points 35 of the tungsten carbide
layer ..........................................................................................................................................
Figure EDS spectrum at point 36 of the substrate layer of the PDC cutter .......................
Figure 4.39 Instron 5566 equipment (a) and Vickers indenter (b) ............................................
Figure 4.40 PDC samples mounted on a threaded base and marked ........................................
Figure BSE image shows Vickers imprints on the substrate layer ...................................
Figure 4.42 Indents left after applying 100 N on the substrate surface for the sample M1313
Figure Micro-indentation of tungsten-carbide and machine compliance for 100 N applied
load for sample M1313 .............................................................................................................
Figure Imprint of a Vickers indenter on diamond layer at 300N applied load .................
Figure Microindentation of diamond layer at 300N applied load using Vickers indenter for
sample M1313 ...........................................................................................................................
Figure Knoop indents on diamond-cobalt layer at 20 N load for the sample M1313 .......
Figure Geometries of cracks generated by Vickers indentation. (a) Pamlqvist crack and (b)
radial/median (half penny) (Niihara, 1983) ..............................................................................
Figure Cracks occurring when applying 170 N load on WC substrate .............................
Figure Fracture toughness for the substrate layer from different models for the substrate
layer of sample K1908 ..............................................................................................................
Figure Fracture toughness versus applied loads for the substrate layer ............................
Figure Crack lengths when applying 30 N load on the diamond layer for the sample K1908
..................................................................................................................................................
Figure Crack lengths when applying 50 N load on the diamond layer .............................
Figure Fracture toughness for the diamond coating of the PDC inserts obtained from
various approaches ....................................................................................................................
Figure Processing cycle of Image J software used for analysing SEM images in the study
for particles size determination .................................................................................................
Figure BSD images (a) sample M1313 (b) sample K1908 of the diamond layer displaying
the diamond grains (black) and the cobalt (white) ....................................................................
Figure Diamond particle size distribution of sample M1313 (a) ......................................
Figure BSD images (a) sample M1313 (b) sample K1908 of the substrate layer displaying
the tungsten-carbide particles (grey) and the cobalt (blue) .......................................................
Figure Substrate grain size distribution (a) specimen M1313 (b) specimen K1908 .........
Figure EDX maps (a-e) and the corresponding mineral content for the diamond layer of
sample M1313 ...........................................................................................................................
Figure EDX maps (a-e) and the corresponding element content for the diamond layer of
specimen K1908........................................................................................................................
Figure 4.61 Electron images and the corresponding element weight percentage for the substrate
layer of sample M1313 .............................................................................................................

P a g e | xii
Figure EDX images and the corresponding element content for the tungsten-carbide-cobalt
layer of sample K1908 ..............................................................................................................
Figure Longitudinal cobalt content across the interface of samples M1313 and K1908 ..
Figure Scratch test using a sharp indenter (Budinski, 2007) ...............................................
Figure Tungsten-carbide layer after a scratch test with a Vickers indenter under 200 N load
..................................................................................................................................................
Figure Two dimensional Talysurf profilemeter showng the depth of scratch occurred on the
substrate layer after applying 100 N for sample M1313 ...........................................................
Figure 5.4 Schematic sketch of the tip of Vickers indenter showing ........................................
Figure Wear calculated from different techniques for the substrate of sample M1313 ......
Figure 5.6 Scratch obtained with Vickers probe at 20 N for the diamond layer of the sample
M1313 .......................................................................................................................................
Figure 5.7 Experimental and predicted wear calculated for the diamond-cobalt layer for the
sample M1313 ...........................................................................................................................
Figure Damaged tip of the Vickers indenter after scratching the diamond layer of sample
M1313 at 20 N applied load ......................................................................................................
Figure 5.9 Spheroconical probe used in the micro-scratch testing (a), SEM image of the tip of
the spheroconical indenter (b) ...................................................................................................
Figure 5.10 Scratch obtained at load 75 N on the substrate layer of the sample M1313 due to
micro-scratching with spheroconical probe ..............................................................................
Figure Groove obtained using spheroconical indenter at 50 N load for the WC-Co layer of
the sample K1908 .....................................................................................................................
Figure Two-dimensional Talysurf profilemeter of a scratch occurred on the substrate layer
after applying 50 N for the sample K1908 using spheroconical probe .....................................
Figure 5.13 Schematic geometry of the worn material using spheroconical indenter during
micro-scratch testing .................................................................................................................
Figure 5.14 Sketch of the circular segment of the spheroconical indenter tip that indents the
layer of the sample ....................................................................................................................
Figure 5.15 Experimental wear compared to the literature wear models ..................................
Figure 5.16 Wear comparison for the substrate layer of sample K1908 using spheroconical
indenter .....................................................................................................................................
Figure 5.17 BSE image illustrates a groove obtained when applying 5 N load on the diamond
layer of sample M1313 .............................................................................................................
Figure 5.18 BSE image shows a scratch obtained when applying 2.5 N load on the diamond
layer of sample K1908 ..............................................................................................................
Figure 5.19 Two-dimensional Talysurf profilemeter of a groove obtained after applying load of
2.5 N using spheroconical indenter on the diamond layer of the sample K1908 ......................
Figure 5.20 Experimental and predicted wear of the diamond layer of the sample M1313 .....
Figure 5.21 Predicted wear compared to the experimental one of the diamond layer of the
sample K1908 ...........................................................................................................................
Figure 5.22 SEM image of the tip of the spheroconical indenter shows undamaged tip ..........
Figure (a) X-ray maps of microscrtaches on the substrate layer using Vickers indenter of
the sample M1313, (b) Spectroscopy of main minerals along the scratch on the substrate for the
sample M1313 ...........................................................................................................................
Figure 5.24 X-ray maps of a scratch on the WC-Co layer after applying 100 N for sample
K1908 ........................................................................................................................................
Figure 5.25 EDS spectra of the groove produced after applying 25 N on the substrate layer of
sample K1908 ...........................................................................................................................

P a g e | xiii
Figure 5.26 Three- dimensional image shows the scratch test after applying 300 N load on the
tungsten-carbide layer for sample M1313 with Vickers indenter .............................................
Figure 5.27 Coloured X-ray map of a groove on the diamond layer as a result of micro-
scratching using Vickers indenter of sample M1313 at 15 N load ...........................................
Figure Coloured X-ray maps of three scratches obtained after applying various loads (a)
10N, (b) 15N and (c) 20N on the diamond layer of sample M1313 .........................................
Figure EDX maps of the main minerals in and around the scratch on the diamond layer
after applying 10 N for the sample K1908 ................................................................................
Figure EDS spectra of the groove produced after applying 30 N on the diamond layer of
sample K1908 ...........................................................................................................................
Figure 5.31 nano- spheroconical probe with a tip of 25 µm radius ..........................................
Figure Groove obtained from nano-scratch testing on the WC-Co layer of .....................
Figure Multi-pass nano-scratch test on substrate layer of sample K1908 .........................
Figure Wear and cumulative wear of the substrate layer of the sample K1908 ................
Figure Multi-pass nano-scratch test on substrate layer of sample M1313 ........................
Figure 5.36 Nano-wear of the substrate layer of sample M1313 ..............................................
Figure Trendlines of wear for the substrate layer of sample K1908 using spheroconical
probe .........................................................................................................................................
Figure Wear trendlines for the substrate layer of sample M1313 using spheroconical
indenter .....................................................................................................................................
Figure 5.39 Optical microscope image shows the nano-scratch obtained ................................
Figure 5.40 Scans of multi-pass scratch test of the diamond layer ...........................................
Figure 5.41 Wear results after nano-scratch testing on the diamond layer ...............................
Figure 5.42 Scan of scratch tests of the diamond layer.............................................................
Figure 5.43 Results of wear obtained from nano-scratch test of the diamond layer .................
Figure Experimental nano-wear compared to various wear models for the diamond layer of
sample K1908 using spheroconical probe ................................................................................
Figure Trendlines of wear for the diamond layer of sample M1313 using spheroconical
indenter .....................................................................................................................................
Figure 5.46 Wear normalised for sliding distance and hardness for sample M1313 ................
Figure Wear normalised for sliding distance and hardness for sample K1908 .................
Figure Specific wear rate comparison for the WC-Co layer for .......................................
Figure 5.49 Specific wear rate comparison for the diamond layer for ......................................
Figure Predicted wear versus the function F(A) ...............................................................
Figure B. 1 Bit record of an oil well in the south of Iraq .............................................................. V
Figure B. 2 Cross plot of dimensionless torque (TD) with dimensionless square root of
penetration rate (RD) for well B ................................................................................................... V
Figure B. 3 Cross plot of dimensionless torque (TD) with dimensionless square root of
penetration rate (RD) for well B .................................................................................................. VI
Figure B. 4 Cross plot of dimensionless torque (TD) with dimensionless square root of
penetration rate (RD) for well A .................................................................................................. VI
Figure B. 5 Cross plot of dimensionless torque (TD) with dimensionless square root of
penetration rate (RD) for well B .................................................................................................. VI
Figure C.1 EDX maps of the interface of the PDC insert shows the mineral distribution through
diamond and substrate layers ...................................................................................................... VII
Figure C.2 X-ray map of the interface between diamond layer and tungsten carbide ............... VIII

P a g e | xiv
Figure C.3 Energy dispersive spectroscopy maps for the major minerals ................................. VIII
Figure C.4 Energy dispersive spectroscopy maps for other minerals form the PDC insert ......... IX
Figure D.1 Micro-scratch obtained when applying 100 N on the tungsten-carbide layer of the
sample M1313 ............................................................................................................................... X
Figure D.2 Micro-scratch produced when applying 300 N on the substrate layer of the sample
M1313 with Vickers indenter ....................................................................................................... X
Figure D.3 Scratch obtained after applying 10N on the diamond layer on the sample M1313
using Vickers indenter ................................................................................................................. XI
Figure D.4 Scratch produced after applying 15N on the diamond layer of the sample M1313
using Vickers indenter ................................................................................................................. XI
Figure D.5 Scratch obtained on the substrate layer of the sample K1908 .................................. XII
Figure D.6 Scratch obtained on the WC-Co layer of the sample K1908 at load 200 N using
spheroconical indenter ................................................................................................................ XII
Figure D.7 Groove obtained on the substrate layer of sample K1908 at load 25 N using
spheroconical indenter ............................................................................................................... XIII
Figure D.8 Groove obtained on the substrate layer of sample K1908 at load 75 N using
spheroconical indenter ............................................................................................................... XIII
Figure D.9 Groove obtained when applying 50 N on the WC-Co layer of sample M1313 using
spheroconical indenter ............................................................................................................... XIV
Figure D.10 Scratch obtained when applying 65 N on the substrate layer of sample M1313
using spheroconical indenter ...................................................................................................... XIV
Figure D.11 Scratch obtained when applying 20 N on the diamond layer of sample K1908 using
spheroconical indenter ................................................................................................................ XV
Figure D.12 Scratch obtained when applying 10 N on the diamond layer of sample K1908 using
spheroconical indenter ................................................................................................................ XV
Figure D.13 scratch obtained when applying 7.5 N on the diamond layer of sample M1313
using spheroconical indenter ...................................................................................................... XVI
Figure D.14 Groove produced when applying 7.5 N on the diamond layer of sample K1908
using spheroconical indenter ...................................................................................................... XVI

P a g e | xv
List of Tables Table 2.1 Composition of minerals and anticipated values of hardness for sandstone ...............
Table 2.2 Mechanical properties and wear coefficients of PDC and natural diamond
(Dubrovinskaia et al., .......................................................................................................
Table 2.3 Bit wear quantification models ...................................................................................
Table Comparison of the mechanical properties between conventional PDC and TSPD
cutters (Osipov et al., ........................................................................................................
Table Sample of bit record data and computations for well A ............................................
Table Intercepts and slopes obtained from the cross plot of the dimensionless torque with
the dimensionless penetration rate for five wells in southern Iraq ..............................................
Table Calculated values of adjusted mechanical specific energy compared to the unconfined
compressive formations for well A ............................................................................................
Table Comparison of adjusted mechanical specific energy with unconfined compressive
strength (UCS) for well B ..........................................................................................................
Table Computed adjusted mechanical specific energy compared to the unconfined
compressive strength (UCS) for well B .....................................................................................
Table 3.6 Adjusted mechanical specific energy compared to the unconfined compressive
strength (UCS) for well A ..........................................................................................................
Table Adjusted mechanical specific energy and unconfined compressive strength (UCS) for
well B .........................................................................................................................................
Table Hardness of the main rock formations being excavated in the study (Mouritz and
Hutchings, 1991 and Gokhale, 2010)..........................................................................................
Table Drill bits used to excavate well A south of Iraq ........................................................
Table Drilling parameters of well A southern Iraq and the corresponding rock hardness
Table Mean Absolute Percentage Error of the volume of wear using various power indices
values for wells A , B , B , A and B ........................................................................................
Table Dimensions of the PDC specimens .............................................................................
Table Roughness average with the corresponded grade number of roughness as known in
industry (Bhushan, 2001) ............................................................................................................
Table Surface roughness parameters for various PDC inserts ..............................................
Table Measured nanoindentation hardness and Young’s modulus for tungsten carbide-cobalt
(substrate layer) of the PDC cutters ..........................................................................................
Table Final results of the nanoindentation tests of the PDC-Co layer of the samples ........
Table Results of the nano-indentation of ceramic before and after testing PDC-Co layer for
the purpose of checking the status of the indenter ....................................................................
Table 4.7 Mechanical properties along with the diagonal indents length for tungsten-carbide
layer resulted from Vickers indentation for the sample M1313 ...............................................
Table Mechanical properties for the substrate layer of the sample K1908 using Vickers
probe .........................................................................................................................................
Table Mechanical properties and diagonal indents length of the diamond-cobalt layer
resulted from Vickers microindentation for the sample M1313 ...............................................
Table Mechanical properties of the diamond layer for the sample K1908 after Vickers
microindentation .......................................................................................................................
Table Mechanical properties and diagonal indents length for diamond layer ..................
Table Results of fracture toughness calculated from different methods for WC substrate for
samples K1908 and M1313. .....................................................................................................
Table Fracture toughness calculated by various methods for the diamond layers of samples
M1313 and K1908 ....................................................................................................................

P a g e | xvi
Table Overall results of the microindentation testing for the substrate and the diamond
layers of the PDC samples ........................................................................................................
Table Structural properties of PDC inserts from different manufacturers ........................
Table Results of the scratch test of the tungsten-carbide layer of the sample M1313 ........
Table 5.2 Micro- scratch test results of the diamond layer of the sample M1313 ....................
Table 5.3 Results of micro-scratch testing of the substrate layer using spheroconical indenter for
the sample M1313 .....................................................................................................................
Table 5.4 Results of micro-scratch testing of the substrate layer using spheroconical probe for
the sample K1908 .....................................................................................................................
Table 5.5 Results of micro-scratch testing of the diamond layer using spheroconical indenter for
the sample M1313 .....................................................................................................................
Table 5.6 Results of micro-scratch testing of the diamond layer using spheroconical indenter for
the sample K1908 .....................................................................................................................

P a g e | xvii
Nomenclature
Latin Characters
A projected indentation area (nm )
Ab cross- sectional area of the tooth, (m )
Abit surface area of the bit (in )
A circular sector area of the circular sector (µm )
Ap area of the particle (µm )
A segment area of the circular segment (µm )
A triangle area of the triangle (µm )
AETT acoustical emissions toughness test
a half length of the diagonal indent (m)
a empirical constant
a empirical constant
ac chord length (µm)
BSE back scattered electrons
b width of the scratch (µm)
DC double cemented tungsten carbide
DEI diamond enhanced inserts
DEM discrete element method
d , db bit diameter (in)
da average length of the indent diagonals (mm)
dl length of the longest indent diagonal (µm)
C crack length (m)
C Carbon (diamond phase)
CED circular equivalent diameter (µm)
Co cobalt (binder)
CTL composite-transition layer
E Young’s modulus (N/m , mN/nm
, GPa)

P a g e | xviii
EF correction efficiency factor (-)
En energy
Er reduced modulus (mN/nm , GPa)
ED bit drilling efficiency (-)
EDS energy dispersive spectroscopy
EDX energy dispersive x-ray
F applied load (mN, N)
F(A) function of load , sliding distance and hardness
FD dimensionless tooth flatness (-)
FEA finite element analysis
G-ratio grinding ratio (-)
H hardness of the material (N/m , mN/nm
, GPa)
Ha hardness of the abrasive body (N/m , GPa)
(Ha/Hm) ratio of the abrasive hardness to the material hardness (-)
Hw hardness of the abraded body (N/m , GPa)
HK Knoop hardness (GPa)
HPHT high pressure and high temperature
HV Vvickers hardness number
h height of the volume removed , depth of the scratch (µm , m)
hb height of the worn insert (m)
hp projected depth (nm)
IADC international association of drilling contractors
i referring to the indenter
JSA available junk slot area of the bit (in )
K constant for the system or wear coefficient (-)
KIC fracture toughness of the material (MPa.m
)
L interval being drilled or sliding distance (ft, µm ,m)
MAPE mean absolute percentage error (%)

P a g e | xix
MSE mechanical specific energy (psi)
MSEadj adjusted mechanical specific energy (psi)
N,Nb speed rotation of the bit (rpm)
Ncone speed rotation of the cone of the bit (rpm)
Nleg speed rotation of the leg of the bit (rpm)
NbC niobium carbide
NSPDC new steel polycrystalline diamond compact bit
n power of the ratio (HR/Hb) or index of incremental area and
sliding distance (dimensionless)
PDC polycrystalline diamond compact
Pmax maximum applied load (mN)
PR rate of penetration (ft/hr), (m/hr)
PRD dimensionless rate of penetration
Ra average surface roughness (µm)
Rc radius of the circle (µm)
RKu kurtosis roughness (-)
Rq root mean square roughness (µm)
Rsk surface skewness (-)
RS raman spectroscopy
r bit radius (mm), (in.), (m)
rcone radius of the cone of the bit (in), (m)
ri radius of the insert (m), (cm)
rleg radius of the leg of the bit (in), (m)
rt height of the triangle (µm)
S stiffness of the material (mN/nm)
Sa arc length of the sector (µm)
Sm stiffness of the machine without the sample (N/mm)
Snet net stiffness of the sample (mN/nm)

P a g e | xx
Stotal stiffness of the sample plus the stiffness of the machine (N/mm)
s referring to the sample
SE specific energy (psi)
SEavg. average specific energy (psi)
SEM scanning electron microscope
SEI secondary electron image
SHN scratch hardness number (GPa)
SiC silicon carbide
T measured torque (lb.ft)
TD dimensionless torque
TaC tantalum carbide
TC tungsten-carbide
TCI tungsten carbide inserts
TSDC thermally stable diamond composites
TSPD thermostable polycrystalline diamond compact
UCS unconfined compressive strength (MPa, psi)
Vb , Vw volume of material removed from the bit or the material (µm ,
mm , m
)
Vcone linear velocity of the cone of the bit (m/min)
Vi volume of the material removed from the insert, (m )
Vleg linear velocity of the lege of the bit (m/min)
VR volume of the of rock removed (m )
Vwt total volume of nanowear (µm ), (mm
)
VTL vertical turret lathe
VV bit face void volume (in )
W weight on bit (lb , Kg.)
WD dimensionless weight on bit
WH wear resistant coefficient (-)
WC tungsten carbide

P a g e | xxi
WCo-B ternary borides
ws scratch width (µm)
X sliding distance (µm)
XRD x-ray diffraction

P a g e | xxii
Greek Characters
αp half angle of the abrasive particles (degree)
Δx distance change in Hook's law (mm, µm)
θ abrasion angle or the angle opposing the segment of the circle
(degree)
θc , α attack angle (degree)
µ bit coefficient of friction (-)
ν Poisson's ratio (dimensionless)
ω angular velocity (rpm)

Chapter One: Introduction
P a g e |
Chapter 1 Introduction
Wear of oil and gas drill bits
Drilling for oil and gas is still very demanding in many areas around the world.
Rotary drilling is the most common technique for drilling oil and gas and since the
invention of rotary drilling two types of drill bits have been used: roller-cone and
Polycrystalline Diamond Compact (PDC) bits. Roller cone bits or tricone bits have three
rotating cones with each one rotating on its own axis during drilling, while PDC bits are
fixed cutter bits with no moving parts. Drilling occurs due to the compression and
rotation of the drill string. Tricone bits are used in general to drill a wide variety of
rocks, from soft to extremely hard. PDC bits are used to drill various sorts of
formations, especially at harsh environments (formations of high pressure and high
temperature). Since the wear of drill bits is considered an intrinsic cost, significant
savings can be achieved by effective control and minimisation of bit wear. Real-time
monitoring of the status of the bit wear is crucially important to increase the rate of
penetration and determining the right time to pull out the bit due to its wear. Drilling
with worn bits might cause losing the bit and consequently bit fishing is required that
would add additional cost beside the overall drilling costs as well as delaying the
drilling operations.
Objectives of the thesis
- The overall aim of this PhD is to develop a new original wear model for
predicting the bit tooth wear for drill bits. Theoretical and experimental work
were carried out to obtain a wear model using state of the art technologies for
wear testing such as micro-indentation and micro-scratch test along with nano-
indentation and nano-scratch tests.
- The literature survey presented in Chapter demonstrates the main failure
modes and wear mechanisms of oil drill bits and studying the destructive and
non-destructive bit testing techniques. Previous models for wear quantification
are presented and described individually.
- Predicting the real-time bit tooth wear using a combination of specific energy
and dimensionless drilling parameters. Developing a new theoretical model for
bit wear monitoring based on three body abrasion. A case study is presented to
show the implication of the new model (Chapter 3).

Chapter One: Introduction
P a g e |
- Experimental work includes nano and microindentation testing carried out on
Polycrystalline Diamond Compact (PDC) inserts from different sources to
measure the mechanical properties of the materials forming these inserts. These
properties include hardness, Young's modulus and fracture toughness (chapter
.
- Using state of the art technology for wear testing experimentally (micro and
nano-scratch testing). The aim of these tests is determine the volume of wear of
the PDC samples based on the geometry of the removed material. An original
proposed formula was presented to quantify the wear of the PDC specimens.
Analytical study carried out in the experimental work using SEM, BSE, EDX
and 2-D surface roughness measurements to investigate the mechanism of wear
of the PDC cutters (chapter 5).
A general work plan is summarised in Figure 1.1 to illustrate the stages of the
research process.
Figure . Shematic diagram of the work plan

Chapter Two: Literature Review on Oil and Gas Drill Bit Wear
P a g e |
Chapter 2 Literature Review on Oil and Gas Drill Bit Wear
This chapter deals with assessing wear analysis methods for drill bits, where bit wear
mechanisms have been clarified to give a better understanding of the failure modes of
roller-cone and PDC bits. In addition, state of the art of manufacturing processes of
synthesising manufacture oil drill bits is reviewed. The wear mechanisms were
explained by applying various laboratory tests. Abrasion and scratch tests are applied on
roller-cone bits, whereas destructive and non-destructive tests are used for PDC bits.
Micro-ploughing and micro-cutting behaviour in roller-cone and PDC bits were the
dominant format of abrasive wear, however further scratch test analysis is needed for
PDC bits for further clarification. Wear in drill bits is influenced by many factors
related to drilling and rock properties, as well as the properties of materials that form the
bit. The type and amount of wear is dependent on several complicated factors that need
to be considered in anticipating the rates of wear in field and laboratory conditions such
as the geometry of the bit as well as the drilling parameters along with the mechanical
properties of the materials forming the drill bit.
Numerous quantification technologies of bit wear have been described. Each method
depends on the available measured data and on wise interpretation to estimate the bit
wear condition. Furthermore, each approach has assumptions that limit its applicability.
However, diverse quantification techniques have been applied for understanding the bit
performance of the bit and when to pull out the bit due to the wear, they should be used
in conjunction with the conventional techniques of wear detection like bit records and
well logging methods. Modelling and simulation are advanced approaches to give a
better understanding of the bit behaviour and its design, which consequently leads to the
optimum bit performance as well as predicting the wear rate of drill bits.
The main objective of this review is to investigate the wear mechanisms of the oil drill
bits. Furthermore, previous methods for wear quantification were discussed and also
apply a suggested approach for estimating the torque of the bit which consequently can
be used for calculating dimensionless drilling parameters, to be used as indications for
monitoring bit wear.
Chapter Two: Literature Review on Oil and Gas Drill Bit Wear
P a g e |
An overview of wear mechanisms of oil and gas drill bits
.1 Wear mechanisms of roller-cone bits
Wear of drill bits is defined as macroscopic or microscopic removal or fracture of
material, particularly at the cutter surface, or more general as, any degradation that
reduces bit life. Mouritz and Hutchings (1991) investigated the wear rates of the
materials used in the teeth of the rotary drill bits and the abrasive wear mechanisms of
these materials. The teeth of the rotary drill bits contain three layers. The external layer
consists of a WC-Co hardfacing layer, the second layer is made from high-carbon
martensitic steel and the third layer is the core of the tooth that consists of low-carbon
martensitic steel. Small cylindrical specimens manufactured from materials similar to
those used in the teeth of rotary drill bits were used in the investigation by Mouritz and
Hutchings (1991). The abrasive rocks like sandstones and non-abrasive rocks such as
limestone, representing the most common rock formations encountered in oil drilling
were used in the tests.
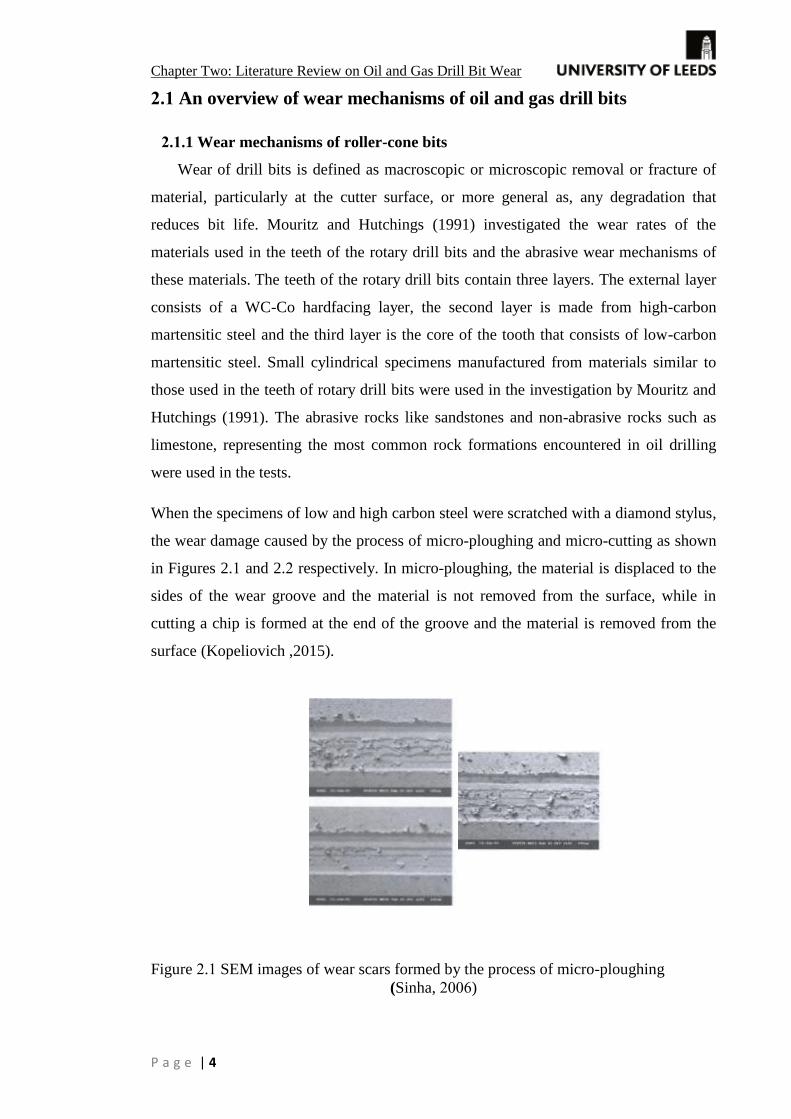
When the specimens of low and high carbon steel were scratched with a diamond stylus,
the wear damage caused by the process of micro-ploughing and micro-cutting as shown
in Figures 2. and 2. respectively. In micro-ploughing, the material is displaced to the
sides of the wear groove and the material is not removed from the surface, while in
cutting a chip is formed at the end of the groove and the material is removed from the
surface (Kopeliovich ,2015).
Figure . SEM images of wear scars formed by the process of micro-ploughing
(Sinha, )

Chapter Two: Literature Review on Oil and Gas Drill Bit Wear
P a g e |
Figure . SEM images for large wear particle formed by micro-cutting
(Fujiwara,
Mouritz and Hutchings (1991) observed that abrasion against limestone causes small
wear by the mechanism of ploughing for low and high carbon steel, while no evidence
of severe damage to the hardfacing layer of WC-Co was observed due to the high
hardness of the hardfacing layer compared to low hardness of limestone rocks.
Osburn (1969) and Perrott (1979) illustrated the strong influence of rock hardness on
the wear of the rotary drill bit tools made of tungsten-carbide with cobalt as a binder.
Abrasion was found to be worse under high temperatures (hot abrasion) causing thermal
fatigue. Osburn (1969) also added that the WC grains during the manufacturing of the
roller-cone insert bits must be structured perfectly to gain maximum fracture resistance.
Larsen-Basse (1973) explained that the main modes of failure for roller-cone insert drill
bits are as the follows:
- impact fracturing, 2- thermal fatigue, 3- abrasive wear and 4- mechanical
fatigue due to overloads.
Reshetnyak, and Kuybarsepp (1994) studied the abrasive erosion of hard metals such as
WC-Co alloys that form the roller-cone insert bits. The extent of wear was evaluated
and indicated, that the hardness of the material cannot be the only dominant property
causing the abrasive erosion wear. The wear is attributed to other properties, such as the
compressive strength and the fracture toughness.
. .2 Wear mechanism of PDC bits
Polycrystalline Diamond drill bits are known to be more efficient than
conventional roller cone bits, especially in soft rock formations. For a better
understanding of bit efficiency, bit-rock interaction of the worn tool should be studied
in detail. It has been deduced that more than 50% of the energy of drilling by PDC bits
is dissipated by the wear of cutters under normal drilling conditions, when assuming a

Chapter Two: Literature Review on Oil and Gas Drill Bit Wear
P a g e |
steady- motion, and avoiding excessive heating, therefore studying the wear mechanism
of PDC is highly essential (Geoffroy, 1999).
Ortega and Glowka (1984) illustrated the main categories of PDC cutters failure as: 1-
delaminiation near the interface of the diamond and the substrate layers 2- plastic
deformation of the diamond and table and the substrate 3- chipping at the edge of
cutting and 4-chipping at the diamond table and dislodging of the diamond grains 5-
abrasive wear and 6- thermal fatigue.
Dunn and Lee (1979) believed that the main reason of the PDC failure is due to the
tensile stresses arising after the sintering process inducing cracks, which propagate
throughout the diamond table and substrate. PDC bits in general suffer from several
additional problems which including: (1) chipping of the diamond layer, (2) bit balling,
(3) stud breakage in hard rocks, (4) abrasive wear, (5) poor hydraulics, (6) insufficient
cleaning efficiency,. (7) deflection of the bit when applying high weight on bit, (8)
scratching the composite layer of the cutters due to poor bonding of tungsten carbide
stud, (9) distribution of cutters on the bit and (10) thermal failure. The improvements of
synthesising manufacture methods of PDC bits to withstand both failure and impact
have been investigated by many researchers (Fang et al. However, an important
step for the improvement is to understand the failure mechanisms and modes of PDC
bits. Fang et al. (2001) illustrated the main failure modes of PDC cutters are due to
frictional heat and the high abrasiveness of the rock, as shown in Figure 2. .
Figure . Typical failure modes of PDC inserts for rock drill bit
(Fang et al.,
Tze-Pin et al. (1992) and Zacny (2012) postulated four primary failure modes of PDC
cutters according to the type of wear mechanism:
- smooth wear 2- microchipping 3- gross fracturing or (spalling) and 4-
delamination.

Chapter Two: Literature Review on Oil and Gas Drill Bit Wear
P a g e |
Tze-Pin et al. (1992) and Zacny (2012) attributed smooth wear to the individual
diamond crystals being polished away due to mechanical and thermal loads. This type
of failure is less significant than other failure mechanisms, because the wear is not
severe and the material removal of the PDC cutters is trivial (Figure 2.
Figure . Smooth wear on the diamond layer (after Tze-Pin et al.,
Microchipping failure occurs along the edge of the diamond table of the PDC cutter or
insert. The main reason of this failure is due to the action of the bit cutting forces
besides thermomechanical fatigue (Figures . and . ).
Figure . Microchipping damage at the edge of the PDC insert
(Tze-Pin et al.,
Figure . Schematic image of the microchipping failure of the PDC cutter
(Zacny,
Gross fracturing, or fatigue represents the most severe type of failure causing the
damage of PDC cutters and subsequently, reducing the bit life. This failure is attributed
to the impact load of the drill bit on the bottom of the wellbore. This failure usually
occurs in hard formations with high hardness, causing greater stress on the PDC cutters.

Chapter Two: Literature Review on Oil and Gas Drill Bit Wear
P a g e |
Delamination of both diamond and WC layers is attributed to the mismatch between the
thermal expansion coefficients of the two layers. Tze-Pin et al. (1992) stated that this
type of failure is caused by the high impact loading of the bit on the bottomhole. Figure
shows delamination failure mode, indicated by dark arrows.
Figure . Delamination failure mode of PDC cutter (Tze-Pin et al.,
Zacny (2012) divided fracturing in general into four categories according to the
dimensions, shape, size and distribution of the occurred fractures as follows:
Microfracturing, Macrofracturing , Gross fracturing , and Ultimate fracturing.
In microfracturing, the fractures are very thin having a thickness of a few micrometers.
For this category the fractures are parallel to the diamond table and the width and length
of the individual fracture planes does not exceed 3 mm. Figures 2. and 2. illustrate a
schematic and SEM micrographs of microfracturing under SEM, respectively.
Figure . Schematic image of the microfracturing failure (Zacny,
Figure . An example of microfracturing failure (Zacny,
In macrofracturing, the thickness of the fractures is greater than 0.1 mm. The length and
width of the fracture are about 5 mm and 8 mm respectively. The fractures are parallel
Delamination
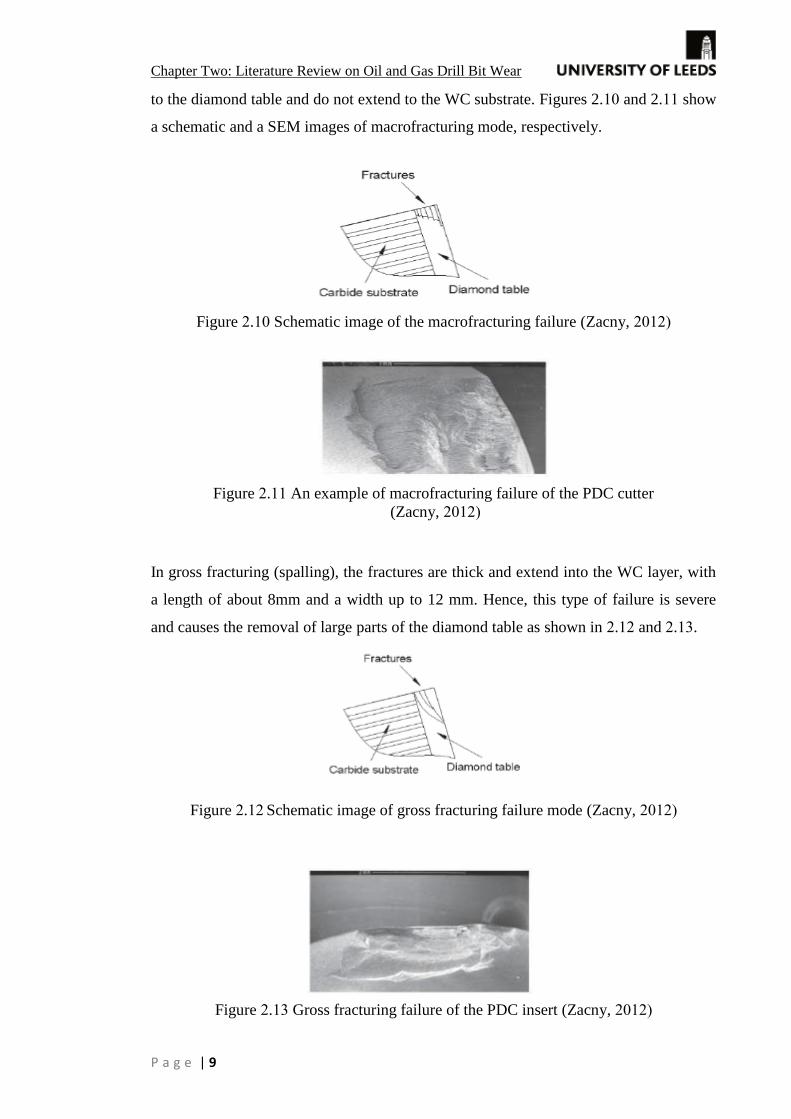
Chapter Two: Literature Review on Oil and Gas Drill Bit Wear
P a g e |
to the diamond table and do not extend to the WC substrate. Figures 2. and 2. show
a schematic and a SEM images of macrofracturing mode, respectively.
Figure . Schematic image of the macrofracturing failure (Zacny,
Figure . An example of macrofracturing failure of the PDC cutter
(Zacny,
In gross fracturing (spalling), the fractures are thick and extend into the WC layer, with
a length of about 8mm and a width up to 12 mm. Hence, this type of failure is severe
and causes the removal of large parts of the diamond table as shown in . and . .
Figure . Schematic image of gross fracturing failure mode (Zacny,
Figure . Gross fracturing failure of the PDC insert (Zacny,

Chapter Two: Literature Review on Oil and Gas Drill Bit Wear
P a g e |
Ultimate fracturing is the most detrimental, because spalls can include more than half of
the diamond table with a considerable part of the WC layer as shown in Figures .
and . .
Figure . Schematic image of ultimate fracturing failure mode (Zacny,
Figure . Ultimate fracturing in PDC cutter (Zacny,
It is worth mentioning that, other kinds of wear such as adhesive wear has minor effect
on oil drill bits, while impact wear affect the drill bits, especially when applying
excessive loads on the bits as mentioned by Wirojanupatump and Shipway (1999). In
drill bits, when fluids are present, the influence of corrosion is considered negligible
when compared to the wear where the material forming the drill bit is being physically
removed. The corroding effect is neglected since the abrasive wear take action on the
surface of the material forming the drill bit before oxidization.
2.2 Drill bit testing
Roller-cone bit testing
Two types of tests were performed within the studying of the wear mechanisms by
Mouritz and Hutchings (1991):-
Abrasion testing: the specimens of the teeth materials were abraded against
sandstone and limestone disks for a total period time of 300 seconds. Mass loss
measurements illustrated that the materials used in the cutting teeth of roller-cone bits
suffered wear rates almost 140 times more when abraded against sandstone as compared
to limestone. Figures 2.1 and 2. demonstrate the difference in the mass loss of the
bit materials with time, or sliding distance when abraded with sandstone and limestone
respectively.

Chapter Two: Literature Review on Oil and Gas Drill Bit Wear
P a g e |
Figure . Mass loss of bit materials when abraded against sandstone (Mouritz and
Hutchings, 1991)
Mouritz and Hutchings (1991) concluded that the hardness of the metal samples
increased as the following order: Low-carbon steel < high-carbon steel < WC-Co alloy.
The above conclusion comes from the principle that abrasive wear rate of any material
depends on the ratio of its hardness (Hm) to the hardness of the abrasive (Ha).
Figure . Mass loss of bit materials when abraded against limestone
(Mouritz and Hutchings,
When Ha/Hm< 1, this means that the abrasive cannot easily scratch the material and the
wear rate is extremely low. However, when (Ha/Hm) >1.2, the abrasive is much more
capable of scratching the material and hence causes high wear rates (Richardson 1968).
The hardness values of the three materials used in the test were: - 460 HV, 700 HV and
1320 HV for low-carbon steel, high-carbon steel and WC-Co alloy, respectively.

Chapter Two: Literature Review on Oil and Gas Drill Bit Wear
P a g e |
Table 2.1 shows the mineral composition and expected hardness values for the
sandstone. It can be seen that most of the minerals in the sandstone are considered hard,
while the limestone is mainly consists of calcite with a hardness of 110 HV which is
less than the hardness of the specimens.
Abrasion tests of the specimens against limestone disk showed that wear resistance
increased with hardness. Therefore, it is safe to say that during drilling sandstone
formations, the WC-Co alloy of the bit teeth external layer will wear away slowly due
to its high hardness , however when this layer is damaged the teeth will face severe
wear.
Table . Composition of minerals and anticipated values of hardness for sandstone
(Mourtiz and Hutchings,
Scratch testing: This test is carried out to simulate the types of wear obtained by
a hard mineral particle as it slides over a drill bit. This test is performed by sliding a
sharp diamond stylus across polished bit materials. The attack angle (θc) defined as the
angle between cutting face of the stylus and surface of specimen. Various attack angles
are chosen during the abrasion. The selected attack angles in Mouritz and Hutchings’
(1991) work, ranged from 6 to 86 . The scratched surfaces of the specimens were
examined by a scanning electron microscope (SEM).
. Testing of PDC bits
Various tests have been carried out on PDC bits to assess their performance and
applicability in diverse drilling conditions including harsh environments such as high
Mineral Content Hardness (HV)
Quartz
Rock Fragments
Feldspars
Fossils
Mica Trace
Heavy minerals Trace
Quartz-bearing clay Trace

Chapter Two: Literature Review on Oil and Gas Drill Bit Wear
P a g e |
bottom hole temperature conditions. The tests are broadly divided into, destructive and
non-destructive methods (Bellin et al a).
Destructive testing
In these tests the cutters of the bit are destroyed without possibility of reusing. The aim
of this test is to simulate downhole conditions in order to assess the behaviour of the
cutters under these conditions. Two types of destructive tests are implemented by the
companies providing PDC cutters and PDC bits, namely abrasion and impact tests.
A- Abrasion test: Abrasion resistance is the capability of the cutter to survive when
abraded against abrasive rocks. The abrasion resistance depends mainly on the hardness
of the minerals in the rock. Highly abrasive rocks like granite or hard sandstone are
normally considered for the test.
The Vertical Turret Lathe (VTL) abrasion test is mainly implemented by the PDC cutter
manufacturers (Figure 2.18). In this method the cutter is fixed on a VTL with a rock
sample placed beneath the cutter. The rock sample is rotated at fixed rotational velocity
as the cutter indents the rock sample at a certain depth, usually less than 1 mm, and is
moved laterally from the outer circumference of the rock to the axis in a spiral mode. A
range of rotation rates are possible. Modern VTLs are computerised to control the
applied slide velocity.
During a dry VTL test, the cutter is not cooled and consequently most of the frictional
heat enters the cutter and the transformation process of diamond to graphite is
accelerated. The test assesses the stability of PDC cutters under elevated temperatures
and the durability of these cutters against wear. The cutter is tested until the wear
progresses into the WC substrate or the test is terminated at the point when the
graphitisation occurs, as indicated by a black ring left on the rock.
Figure . Abrasion testing of a PDC cutter using a vertical lathe
(Bellin et al., b)

Chapter Two: Literature Review on Oil and Gas Drill Bit Wear
P a g e |
t atmospheric pressure the conversion of diamond to graphite starts at C
Evans and James However when PDC cutters used to drill abrasive and hard
roc s the performance of these cutters decreased at near C as it is believed that the
diamond layer of the PDC cutter converts to graphite due to the frictional heat. When
temperature increases, this transformation of diamond to graphite accelerates.
As PDC cutters have cobalt as a binding material, the presence of this binder accelerates
the transformation of diamond to graphite. The acceleration of the graphitisation
phenomena is occurred due to the significant difference of the thermal expansion
coefficients between cobalt and diamond that led to the breakage of the strong bonds
between the diamond to diamond grain that give the diamond high hardness forming
hexagonal sheets of carbon atoms. This is the reason that PDC converts to graphite
more quickly than diamond that has no binder. When facing elevated temperature, the
graphitisation of polycrystalline diamond embedded in cobalt becomes the main
dominant mechanism (Bellin et al., 2010 b). Graphitisation of diamond to graphite
causes the deterioration (wear) of the PDC cutters which is attributed to the allotropic
(crystal structure) convert from the diamond to the non-diamond (graphite) phase with
the presence of frictional heat.
The cooled or wet VTL test (with air or water) is conducted to evaluate the life of the
cutters under moderate temperatures. In this case the abrasion wear occurred will be
mainly due to the abrasiveness of the rock as thermal effects are minimised. In this
method wear is measured by the weight loss of the cutter.
The intrinsic goal of the VTL test is to study the resistance of diamond grains against
micro-chipping and gouging when abraded against hard rock such as granite or hard
sandstone.
The grinding ratio (G-ratio): G-ratio is an industrial term defined as the dimensionless
number that represents the volume of rock removal per unit wear volume of the cutter.
A large, G-ratio means a greater amount of rock will be removed for a certain amount of
volumetric wear of the PDC cutter, and is therefore desirable. The G-ratios have been
increased from 1 for the first PDC cutter generation to 15 for the most recent ones,
which indicate the substantial improvements of abrasion resistance of recent PDC
cutters.

Chapter Two: Literature Review on Oil and Gas Drill Bit Wear
P a g e |
B- Impact test: In this test, the cutter is impacted at a given inclined angle varying from
to 25 from a given height. At least ten samples of cutters are tested under different
heights, giving varying impact energies up to 100J. Each cutter sample is dropped three
to seven times at a given energy level. Figure 2.19 illustrates the comparison of damage
due to impact for different cutters under various energy levels.
Figure . Spalled cutters after impact testing (Bellin et al., b)
Figure 2.20 shows the results of 22 cutters tested under increments of impact energy
varied from 20 J up to 100 J. Only six cutters survived and the test showed 0%
spallation and the rest exhibited 60% to 80% spallation with an average overall
spallation of For most cases the acceptable spallation limit was ˂ hence the
cutters failed to pass the test. However, the impact test measures the impact resistance
under very low or zero vibration conditions, while in the drilling field the cutters are
under a high level of vibration. Therefore, the impact test could have limitations since it
does not replicate true process conditions (Bellin et al. b).
Figure . Spallation chart of impacted PDC inserts (Bellin et al., b)
Semi-destructive testing
Micro and nano-indentation tests as well as micro and nano-scratch tests on WC-Co
ceramics , diamond and materials like diamond were investigated by many researchers

Chapter Two: Literature Review on Oil and Gas Drill Bit Wear
P a g e |
to measure the hardness and Young’s modulus However there is limited work on
micro and nano tests in the literature conducted on PDC samples, particularly those with
WC-Co as a substrate coated with polycrystalline diamond embedded in cobalt as a
binder. Further investigation of micro and nanoindentations as well as micro and
nanoscratch testing is essential to measure the mechanical properties of the PDC cutters
and to reveal the main wear mechanisms of the PDC inserts .
Ndlovu et al. (2007) performed micro and nanoindentation tests on different tungsten-
carbides embedded in cobalt to measure the mechanical properties of WC-Co and to
correlate the obtained results with the effect of the microstructure of the grains. The
differences in the samples based on various cobalt content as well as different grain size
of WC. The wear of the hard metal was investigated in microscratch testing, where
various deformation mechanisms were observed. A smaller WC grain size produced a
lower scratch width and depth; therefore, better scratch resistance compared to coarser
WC grains.
Xie and Hawthrone ) investigated different WC-Co ceramics by using micro-
scratch testing to monitor the plastic deformation and failure of such materials. The
scratched areas were described and correlated the wear characteristics with a number of
materials based on the material loss measurement .
Sawa and Tanaka (2002) carried out experiments on natural diamond indentation to
measure the Young's modulus. The produced curves were showing high degree of
elastic recovery. The obtained load-displacement curves were corrected for the effect of
machine compliance to adjust the obtained results. The final recorded value of Young's
modulus of the tested natural diamond was (1090-1217) GPa.
The hardness of the nano-polycrystalline diamond was measured by the
microindentation method using mainly the Knoop indenter (Sumiya and Irifune, 2004).
Vickers indenter was also used for the indentation test, while the nanoindentation test
was also attempted with Berkovich probe, where a large amount of elastic recovery was
observed. The wreckage of Vickers indenter during microindentation and Berkovich
indenter during nanoindentation tests were encountered. Couvy et al. reported on
the nanoindentation hardness and Young's modulus of hard materials:
Nanopolycrystalline Diamond (NPD) ; Cubic Boron Nitrite (CBN) and Polycrystalline

Chapter Two: Literature Review on Oil and Gas Drill Bit Wear
P a g e |
Compact Diamond (PCD). The PCD sample consists of diamond grains in micron scale
embedded in silicon-carbide as a binder with a volume of 25%. The obtained results of
nanohardness of the PCD sample were (8-19) ± 2 GPa and Young's modulus was (86-
168) ± 24 GPa. Figure 2.21 shows the nanoindentation curves for the samples
investigated.
Figure . Load–displacement curves measured during nanoindentation of NPD, CBN
and PCD samples (Couvy et al.
Lu et al. (2012) performed micro-scratch testing on specimens made of WC-Co coated
with a thin layer of diamond. The cobalt content of the substrate was 6% and the
thickness of the diamond layer was around 4 µm. The micro-scratch test was conducted
with a Rockwell diamond indenter with a tip radius of 50 µm. The micro-scratch test
was carried out with various loads of 10, 15, 20, 25 and 30 N. The aim of the test was to
investigate the delamination of diamond thin coatings on WC-Co materials. The
delamination was noted to be more worse when increasing the load. The width of the
diamond coating after delamination increases with increasing load. It was found that,
the critical load for the tested diamond coatings was between 4 and 6 N. Figure 2.22
illustrates the microscratch test of the sample and the grooves obtained at various loads.
Figure . Microscopic image of the scratches produced by micro-scratch test
(Lu et al.

Chapter Two: Literature Review on Oil and Gas Drill Bit Wear
P a g e |
Semi-destructive testing using state of the art technologies opens the door for further
study relevant to wear analysis and quantification rather than using traditional
techniques that based on the measurement of the mass loss, especially with PDC
samples that have cobalt or nickel as a binder. Micro and nano-scratch testing are the
most approaches could this task.
Non-destructive testing
In this method, a part of the cutter is examined in order to detect any voids and flaws,
particularly at the interface of diamond to carbide. Visual and microscopic testing as
well as C-scan techniques are the most common methods for detecting the flaws. The
latter approach is used to detect delamination and voids in the diamond table by using
ultrasonic waves ranging from 0.2 to 800 MHz (Bellin et al. b). Small flaws and
defects can be detected down to 5- µm and the determination of their location is also
possible. The test is achieved by placing the cutter into a tank of water, which is
scanned using an acoustic microscope. An image of the inner diamond table and the
diamond to substrate interface is produced. This is useful when flaws, cavities voids
cannot be detected by visual or microscopic examination (Bellin et al., b). Figure
a illustrates examples of the flaws discovered by C-scan test. Furthermore, the
Acoustical Emissions Toughness Test (AETT) can be quantitatively applied to PDC
cutters to evaluate the impact strength of the bonds between diamond - diamond grain
created during the sintering process under High Pressure and High Temperature
(HPHT). The test includes applying loads by a diamond indenter on the PDC inserts at
constant rate. Meanwhile, acoustic emissions caused by micro-cracks are detected by
special acoustic sensor and the crack length determined. As such this technique gives a
measure of fracture toughness as shown in Figure 2.23b (Varel International, 2010).
Figure . (a) C-scan test to detect flaws in the diamond of the PDC cutter (Bellin et
al., b) (b) Acoustical emissions toughness test (Varel International, 2010).
a b

Chapter Two: Literature Review on Oil and Gas Drill Bit Wear
P a g e |
Analytical study
Boland and Lee (2010) showed the use of analytical techniques for studying the
Thermally Stable Diamond Composites (TSDC) that are used widely in the
manufacturing of Thermostable PDC bit cutters (explained in section 4.6). The
analytical approaches include Scanning Electron Microscope (SEM), Energy Dispersive
Spectroscopy (EDS), X-ray Diffraction (XRD) and Raman Spectroscopy (RS). The
latter was used by Kromka et al. (2005) to distinguish between poor and good quality
TSDC samples. This comparative study was based on the variation of Raman
spectrums; where low wear resistance or poor quality TSDC samples, showed a broad
peak between 1350 and 1550 cm-
, which is related to graphite or non-diamond material
(Figure 2. ). On the other hand, good quality TSDC inserts displayed a sharp unique
peak close to 1332 cm-
, which is characteristic of diamond, with no evidence of the
graphite peak, as shown in Figure 2.2 .
Figure . Raman shift of poor wear resistance of a TSDC sample
(Boland and Lee,
Figure . Raman spectrum of high wear resistance of a TSDC specimen
(Boland and Lee,

Chapter Two: Literature Review on Oil and Gas Drill Bit Wear
P a g e |
Boland and Lee (2010) compared PDC cutters of various qualities using X-ray imaging.
The study revealed the flaws within a projected image produced from X-ray source. The
3D X-ray images displayed the intrusions of the substrate (blue colour) into the
diamond layer, forming cracks that some of which extend to the outer surface (Figure
. ). The cracks were found to be generated during the manufacturing process of the
PDC inserts. PDC samples that contain such cracks showed poor wear resistance
compared to good wear resistance quality PDC cutters that showed fewer flaws
(cracks).
Figure . 3D X-ray image of a poor wear resistance PDC cutter showing the
intrusions of WC –substrate (blue colour) to the outer surface (Boland and Lee,
Theoretical background on wear quantification
Bit performance, defined as the service duration of bit tooth and the bearings, is affected
by many factors according to the drilling operation. The effect of rotary speed on drill
rate and bit performance has been widely studied, with most of the research dedicated to
a better understanding of the parameters involved in bit performance. It has been
illustrated that tooth wear increases with rotary speed and thus, allowing increasing of
bearing revolutions that increase the possibility of bearing's failure. Increased the tooth
wear negatively affects the drilling efficiency and consequently decreases the
penetration rate.
.1 The aim of the theoretical background
The objective of the theoretical background is to explain and describe empirical multi
models developed by several researchers. The focus will be on the expressions,
formulas and the applications.

Chapter Two: Literature Review on Oil and Gas Drill Bit Wear
P a g e |
Quantification methods of bit wear
Specific energy (SE) technique
Many authors aimed at finding the best optimum method to detect the wear of the
drill bits to determine the life of the bit. Bit performance is intrinsically affected by
wear, thus the efficiency of the drill bit could be determined by using the specific
energy technique (SE).
Several attempts have been made to study the principle of specific energy, also referred
to mechanical specific energy (MSE) and its effect on bit performance. Teale (1965)
defined the concept of specific energy in rotary drilling as the energy required removing
a unit volume of rock. Teale indicated that SE is inversely proportional to fragment size
of rock excavated and as such minimum value of SE corresponds to the unconfined
compressive strength of the rock, which is a fundamental property. Teale (1965)
presented the following equation for the MSE determination:
where W is the weight on bit (lb) , Abit is the surface area of the bit (in ) , N is the rotary
speed (rpm) , T is the torque at bit (lb.ft) and PR is the penetration rate (ft/hr). The unit
of MSE in the above equation is in lb.in/in or psi. The full derivation of Equation (2-1)
is shown in Appendix A.A.
Pessier and Fear (1992) developed an energy balanced model for drilling under
hydrostatic pressure rather than atmospheric pressure as used in previous models in
order to make improvements more applicable to the drilling field. The output results
were correlated with the field data and there was a close agreement. Two key indices
were used for bit performance and bit monitoring: mechanical specific energy and bit
coefficient of sliding friction. Both of these indices provide a good indication of bit
performance, thus leading to optimum bit selection, diagnosis of failure of the teeth and
bearing of the bit, as well as the real time monitoring of the drilling process. Another SE
equation was introduced - depends on drilling parameters such as rate of
penetration, weight on bit and torque at bit. Penetration rate is the distance (depth
interval) being drilling in a certain period of time by the bit. It is obtained practically
from dividing the interval being penetrated over the required time for this penetration.

Chapter Two: Literature Review on Oil and Gas Drill Bit Wear
P a g e |
When torque at bit is not measured while drilling, Pessier and Fear (1992) derived an
empirical equation for the estimation of torque as follows:
where T is the measured torque (lb.ft) and μ is the bit coefficient of sliding friction
(dimensionless number). μ values have been obtained from laboratory measurements
and varied from 0.21 for roller-cone bits up to 0.84 for PDC bits, depending on the
formation being drilled and the bit type.
Pessier and Fear (1992) reformulated Equation (2-1) as follows:
(
)
A dramatic increase in SE values could be a warning indication of short bearing life and
low PR. The same interpretation happens when μ values (bit coefficient) increase
sharply from the normal increasing trend line.
MSE values obtained from Teale’s equation could be used for lithology prediction as the
specific energy corresponds to the uniaxial compressive strength of the rock. Dupriest
and Koederitz (2005) found that during drilling, the highest efficiency the drill bit
reaches is 30- 0%, and consequently the MSE from Teale (1965) has to be corrected by
multiplying with a factor ranging from 0.3 - 0.4 before it can be compared with the
formation strength. The adjusted Mechanical Specific Energy MSEadj is obtained as
follows (Dupriest and Koederitz 2005):
where MSE is the raw Mechanical Specific Energy (psi) from Teale’s equation EF is
the correction Efficiency Factor (dimensionless) and MSEadj. is the corrected mechanical
specific energy (psi).
In most petroleum drilling applications, 0.35 is used as an average value for EF
regardless of drill bit type (Dupriest and Koederitz 2005). Figure . shows the
mechanical efficiencies of the two main kinds of drill bits used in oil and gas drilling. It

Chapter Two: Literature Review on Oil and Gas Drill Bit Wear
P a g e |
illustrates that when the weight on bit (W) and the obtained depth of cut increase, the bit
finally reaches its highest efficiency i.e. 35-40% for roller-cone (insert) bit and 30-35%
for PDC bit. Efficiency is typically determined by comparing the actual energy
consumed by the bit with the theoretical energy required to excavate a specific volume
of rock. Bits in general tend to transport only 30-40% of their energy into the process of
rock destruction, even when running at maximum performance. However, if depth of
cut is insufficient, the performance of energy transport decreases even below 30-40%
causing very low rate of penetration (PR).
Figure . Drilling efficiencies of tungsten-carbide roller cone and PDC bits
(Dupriest and Koederitz,
Waughman et al. (2002, 2003) described a methodology for measuring specific energy
(SE) for every section drilled with checking the current formation type (lithology) with
the benefit of gamma ray (GR) readings to indicate bit performance and wear. The main
disadvantage of this technique is that it requires measuring the bit torque which it is not
always measured during drilling. Consequently, many authors attempted to develop
methods for computing SE without torque values.
Rabia (1982) and Rabia et al. (1986) simplified the specific energy equation of Teale so
that torque was no longer included. The torque in Teale’s equation was replaced by an
approximation that torque is directly proportional to weight on bit and bit diameter.
Rabia (1982), Rabia et al. (1986) and Farrelly and Rabia (1987) applied their modified
specific energy formula on the actual field drilling as follows:
where W is the weight on bit (lb) , d is the diameter of the bit (in) , N is the rotary speed
(rpm), PR is the penetration rate (ft/hr) and SE is expressed in lb.in/in or psi.

Chapter Two: Literature Review on Oil and Gas Drill Bit Wear
P a g e |
Equation ( - ) is used specially for roller-cone bits when drilling various rock
formations as postulated by Rabia (1985). The derivation of Equation (2- ) is shown in
Appendix A.A.
Farrelly and Rabia (1987) stated that when drilling a homogenous interval, the specific
energy shows a gradual slow rise, an indication of continuous bit wear. However,
dramatic increases of SE values correspond to severe bit wear, lithology change, drill
string vibration or even sometimes due to bit balling which occurs when shale particles
accumulate on the face of the drill bit. These multiple conditions could cause the
specific energy to rise, due to a number of reasons, resulting misleading interpretation
(Dupriest and Koederitz 2005).
SE values were calculated based on field data for different bits and for various
formations. Farrelly and Rabia (1987) concluded that SE controls the bit performance,
where the lowest values of SE refer to optimum bits to be used in drilling operation and
consequently reduced drilling costs. SE values provide a reasonable indication of bit
performance during drilling. SE depends on bit type, bit wear, cuttings removal, rock
type and rock properties (Farrelly and Rabia 1987). Specific energy gives an indication
of lithology changes and how to choose the optimum bit for drilling a certain formation.
However, the SE technique is not totally reliable and should be used in conjunction with
other methods during bit selection to give a better understanding of bit performance.
The following approaches could be used in conjunction with SE:
1- Cost per foot assessment 2-Bit wear assessment 3-Bit records analysis 4- Coding of
International Association of drilling contractors (IADC) 5- Well logs and geophysical
analysis 6- Geological information.
Wear and Measurements While Drilling (MWD)
Measurement While Drilling (MWD) tools were introduced in 1981 to measure some
of the important drilling parameters, particularly related to bit wear such as weight on
bit, rotary speed, penetration rate and bit torque. The bit information can be obtained by
computing parameters from the MWD. Warren (1984), Burgess (1985), Falconer and
Normore (1987) as well as Kuru and Wojtanowicz (1992) investigated a torque model
to show the effects of tooth wear on drilling. The method is based on a Mechanical

Chapter Two: Literature Review on Oil and Gas Drill Bit Wear
P a g e |
Efficiency Log (MEL) which used data of penetration rate, rotation speed and MWD
values of torque and weight on bit.
The following dimensionless drilling equations were defined:
√
where TD is the dimensionless torque, PRD is the dimensionless penetration rate (see
Equation 2- , a and a are the drilling torque constants and they varied with lithology
and bit wear. Wear of the bit affects mainly a accordingly Equation (2-6) can be written
as follows (Burgess 1985):
√
where ED is the bit drilling efficiency, which is a function of bit wear (dimensionless)
and ranges from for a new sharp bit to near zero for completed worn bit. When ED
equals 1, Equation (2-7) would be same as Equation (2- Rearranging Equation (2-7)
leads to Equation (2-
√
where T is the measured torque (lb.ft), W is the weight on bit (lb) and d is the bit
diameter (in).
where PRD is the dimensionless rate of penetration, PR is the rate of penetration (ft/hr),
N is the bit rotary speed (rpm) and d is the diameter of the bit (in).
FD is another dimensionless parameter representing flatness and can be determined from
ED values. Flatness of the bit tooth refers to the wear of the cutting parts of the bit (tooth
for roller-cone bits or inserts for PDC bits).
where WD is the dimensionless weight on bit.

Chapter Two: Literature Review on Oil and Gas Drill Bit Wear
P a g e |
When applying this approach, calculations of the dimensionless drilling parameters i.e.
Equations (2-7)-(2-12) should be done for each depth interval.
The values of drilling torque constants a and a could be determined by plotting TD vs.
square root of PRD where a being the intercept of the TD axis and a being the slope of
the time through the plotted points.
By using this model, it could become possible to anticipate the wear of milled tooth bits
in real time from MWD measurements. When wear occurs, ED decreases from one to
zero, while FD values behave in a reverse way; FD is equal to zero for a sharp new bit
and when wear occurs FD values start to increase.
In this case during the course of drilling, the bit could be pulled and replaced when the
bit efficiency (ED) falls sharply. With MWD technique, a drill bit could be used to the
full extent of its useful life, and so maximize the drilling operation and decrease drilling
costs.
Other quantification methods of wear
Abrasive wear is the dominant type of wear occurring in oil well drilling due to the
drilling mechanism of the bit cutters against rock formation. This type of wear causes
serious damage to the drill bit, therefore, many tribologists and lubrication engineers
have assessed means of wear quantification to understand the materials resistance
against it and how it can be minimised. Various wear models have been postulated,
however most are only relevant for specific cases.
Rabinowicz (1996) developed an abrasive wear model to improve the quantification of
the two body abrasive wear (Figure . ). This model describes the process of an
abrasive grain sliding over a distance (X) while the grain is pressed upon a given surface
with a force (F). Rabinowicz ) derived the following equation of wear through
two body abrasive for soft rock formation:

Chapter Two: Literature Review on Oil and Gas Drill Bit Wear
P a g e |
where Vw is the volume of material removed, F is applied load (N), X is the sliding
distance (m), θ is the abrasion angle , Ha is the hardness of the abrasive material
(N/m ) and Hw is the hardness of the abraded material (N/m
).
Figure . Rabinowicz model for abrasive wear (Rabinowicz,
However, application of Equation ( - ) is limited to soft rock formation, Rabinowicz
postulated the following equation for wear determination against intermediate rock
formations in the case of three body abrasive wear, where the hardness of the abrasive
and the abraded material are included.
Hutchings (199 ) also investigated abrasive wear involving the removal of material by
plastic deformation. This model is based on assuming that the abrasive particle is
represented as a cone of semiangle (αp) being dragged across the surface of the material
under indentation pressure. Hutchings (199 ) suggested this abrasive wear model is as
follows:
( )
where Vw is the volume of wear (m ), F is the applied load (N), X is the sliding distance
(m), Hw is the hardness of the abraded material (N/m ) and αp is the half angle of the
abrasive particle
The main difference between Rabinowicz and Hutchings models is that Rabinowicz
assumed that the projected area of the cone would be a whole circle, while Hutchings
assumed that that the normal load is supported over only half of the circular projected
area of the cone. In addition, the relation between the abrasive angle (θ) and the
semiangle (αp) that represents the half angle of the abrasive particle is as follows:
θ - αp , and tan(θ)= 1/tan(αp).

Chapter Two: Literature Review on Oil and Gas Drill Bit Wear
P a g e |
Accordingly, the expected wear volume values obtained from Hutchings would be
double values of Rabinowicz.
Element six Ltd, one of the largest companies that manufacture PDC cutters,
investigated an empirical formula of abrasive wear of polycrystalline diamond cutters
developed by Dubrovinskaia et al. (2006), which is as follows:
where WH is wear resistant coefficient or the reciprocal of wear coefficient
(dimensionless), KIC is the fracture toughness (MPa .m
), E is the Young’s modulus
(GPa) and H is the hardness (GPa). Equation (2- suggests that increasing the value of
hardness or fracture toughness of the material makes it more resistant to wear. However,
since this equation is empirically derived, no mechanistic interpretation is offered to
explain the proposed relationships with mechanical properties.
Table 2. shows mechanical properties and wear coefficients of various PDC products
manufactured by different companies alongside natural diamond (PDC cutters
manufactured by Element six Ltd. are referred to ADNRs). However, it is not clear how
the mechanical properties were determined.
Table . Mechanical properties and wear coefficients of PDC and natural diamond
(Dubrovinskaia et al.,
Budinski (2007) demonstrated the implication of Archard wear model as shown
in Equation ( - ):
Property Syndrill
Syndite
Sundax3 Natural
Diamond
ADNRs
Fracture
toughness
(MPa.m
)
- ±
Knoop
hardness
(GPa)
- ±
Young’s
modulus
(GPa)
±
Wear
resistant
coefficient
- ±

Chapter Two: Literature Review on Oil and Gas Drill Bit Wear
P a g e |
where K is a constant, or wear coefficient of the system which needs to be determined
experimentally, F is the force pressing bodies together, X is the sliding distance and H is
the hardness of the softer solid of the two interacting solid surfaces rchard’s equation
suggests that wear increases with increased force (F) and sliding distance, while the
wear decreases when the hardness of the material increases.
Budinski (2007) modified Archard equation by including the conical angle of the
abrasive object:
where B = 2.cot / and represents the conical angle of the abrasive object. K is a
constant. Equation ( - ) is used widely for erosive wear and functionalised for wear
prediction by simulation.
Ning and Ghadiri (2006) developed a wear model for materials under shear loading. The
surface damage in consideration here is the elastic-plastic damage by the propagation of
lateral cracks as particles are loaded and slid against each other by shearing.
The new developed model (Equation - ) shows that the fracture toughness has a
stronger influence on the volume loss than the particle hardness.
(
)
where Vw is the wear or the volume loss by surface damage assuming plastic
deformation, F is the applied load, X is the sliding distance, H is the hardness and Kc is
the fracture toughness of the particle Ning and Ghadiri’s equation is applied to semi-
brittle materials. This model could be applied on tungsten-carbide ceramics and
polycrystalline diamond as they have a brittle part which is diamond embedded in a
ductile material (cobalt) and the same with WC (Ndlovu, 2009, Xu, 2008 and Donald,
. However, the equation includes the fracture toughness which is difficult to
determine, especially for polycrystalline diamond (Lin et al . Determination of
fracture toughness of the diamond layer experimentally was constrained when using

Chapter Two: Literature Review on Oil and Gas Drill Bit Wear
P a g e |
conventional approaches and there is limited work in the literature. Overall, Table 2.3
illustrates the main models used for wear quantification and the parameters required for
the determination of wear.
Table . Bit wear quantification models
Wear quantification using simulation methods
1 Finite Element Analysis (FEA)
FEA can be defined as a process of computer simulation or modelling interactions
between contacting surfaces by setting a two or three dimensional mesh on surfaces,
taking into account all the relevant material properties (Budinski, 2007). FEA is useful
for predicting the distribution of the stresses within contacting solids. Figure . shows
a simple scheme of finite element modelling; indentation of a flat surface by a sphere,
where the nodes of the mesh in the contacting area are deformed depending on
parameters such as modulus of elasticity and Poisson’s ratio The distribution of stress
or deflection map is shown in Figure . . However, it should be noted that the
accuracy of this approach depends on the accuracy and resolution of the mesh, and the
material properties input into the mode.
Figure . Simple scheme of finite element modelling (Budinski,
Wear
Model
Applied
Load
Hardness
of the
Abrasive
Material
Hardness
of the
Abraded
Material
Sliding
Distance
Fracture
Toughness
Angle of
Abrasion
Young's
Modulus
Rabinowicz
(1996) √ √ √ √
× √ ×
Hutchings
(1992) √ × √ √ × √ ×
Ning &
Ghadiri
(2006) √ × √ √ √ × ×
Archard
(1953) √ × √ √ × √ ×
Element six
Ltd. (2006) × × √ × √ × √

Chapter Two: Literature Review on Oil and Gas Drill Bit Wear
P a g e |
Figure . FEA simulation results showing the stress distribution at the diamond-to-
substrate interface (Bellin et al., b)
Furthermore, for modelling wear processes, plastic behaviour of the material should
also be taken into account. Finite element modelling is considered a novel technique for
analysing cutter behaviour and cutter advancements (Bellin et al., b). FEA has
been used for PDC bits and on virtual cutters to simulate the sintering conditions and to
anticipate stress distribution in the diamond table and the diamond to substrate interface,
in particular the residual tensile stress responsible for fragility in the diamond table, as
shown in Figure . . The use of FEA allows a numerical matrix solution, mapping the
physical properties such as stress and strain of the material at different locations within
the cutter which provides enough knowledge for minimising the wear of PDC cutters
under various drilling circumstances. The stress and strain can then be optimised using
certain design features built into the cutter. The use of FEA has allowed the
advancement of new cutter technologies with improved performance. Further study is
needed in this field to demonstrate how FEA can be used to quantify wear in drill bits
and particularly for determining the optimum suitable model for wear quantification.
Many FEA models have been used in the design and determination of thermal
behaviour of PDC bits. Continuous refinement of complex FEA models has led to the
development of PDC bits, taking into account many factors that might affect the
manufacturing of the PDC bits (Ziaja and Miska, 1982). However, several assumptions
are typically applied, which limit the practical application of the simulation models to
predicting the performance of PDC bits (Ziaja, 1985).

Chapter Two: Literature Review on Oil and Gas Drill Bit Wear
P a g e |
.3.2 Discrete Element Method (DEM)
In the last decade the broad use of the discrete element method has progressed
and been deployed widely for various applications. DEM considers a number of
particles that move independently following Newton’s laws of motion with particle
contacts following a force-displacement law. Currently its application is mainly on
various particle processing problems as a means of determining information that cannot
be found experimentally. Favier (2007) suggested two issues that can limit the
implementation of DEM:
- The determination of the DEM model, i.e. the determination of the model
parameters that must be included in the model and their values.
- The limitations of the DEM model such as the assumed element size and
numbers being used.
However, if the DEM model is chosen for the optimum solution of the problem, the real
challenge is to determine the best model for the material with respect to the conditions
within the process. DEM can be used to determine the loads exerted by granular
material on various structures. The DEM model can be effectively combined with finite
element analysis (FEA) to provide load information for structural analysis. DEM has
been used to model the fracturing of rock and cemented materials (Favier 2007). The
fracture features of the rock are controlled by the strength of the bonds between
particles, the particle properties and size distribution of the particles (Favier 2007).
Mendoza et al. (2010) employed DEM to model rock cutting as represented by
laboratory scratch tests, showing a good agreement with experiments.
Figure . illustrates the cutter of a bit drilling through the bonded particle bed. The
study shows that this approach could be applied to simulate the drilling of rock by drill
bits to evaluate the wear of the materials that form the bit. Akbari et al. (2011) used
DEM to simulate the loads affecting PDC cutters and their interaction with the rock
formation. Boundary conditions such as pressure, temperature, velocity, humidity,
friction coefficient, etc. were assumed in order to study the friction forces and the rate
of penetration with the optimum weight on bit to gain maximum rock cutting as shown
in Figure . .

Chapter Two: Literature Review on Oil and Gas Drill Bit Wear
P a g e |
Figure . A simplified DEM model of a drill cutter removing a cutting by the means
of breaking the bonds between the particles (Favier,
Figure . Rock cutting process using DEM model (Akbari et al.,
Novel methods for improving roller-cone and PDC drill bits
.1 Enhanced inserts
Sneddon and Hall (1988) introduced a new technique of Composite-Transition
Layer (CTL) to ameliorate PDC bits, to rectify the problematic drilling conditions
against hard abrasive formations, such as granite and quartz. This new step of
synthesising manufacture PDC bits provides better resistance to impact and wear
damage. In this approach, the transition layers of the cutter consist of PDC and sintered
WC-Co particles bonded with each other. The process is achieved by mixing individual
crystals of man-made diamond and cemented carbide particles. This process is called
High Pressure, High temperature (HPHT) technology for sintering PDC. Figure 2.
shows the cross- section of an enhanced insert CTL technology (Sneddon and Hall,
1988). The outer layer of the insert cutter is completely PDC, then the concentration of
WC-Co increases towards the inner layers until the last inner layer, which consists of

Chapter Two: Literature Review on Oil and Gas Drill Bit Wear
P a g e |
WC-Co. According to the tests of the new enhanced PDC bits, several advantages
appeared by using this technique. Firstly, each composite layer enhances the layer
below it forming a great coat against abrasion. Secondly, manufacturing of Composite
PDC-WC-Co layers leads to a rounded or curved shape of the cutters, thus allowing
more impact resistance as compared to the planed conventional cutters. The rounded
shapes provide improved toughness and reduced contact area.
Figure . Cross section of enhanced inserts (Sneddon and Hall,
.2 Co-Composition and various grain size graded cemented carbides
Mori et al. (2003) studied the development of materials that are highly resistant
against wear and chipping to prolong the life of the roller cone insert bits during drilling
hard abrasive rocks. Their design is Co-composition graded cemented carbides. First of
all the efficiency of the inserts (cutters) could be ameliorated by manufacturing them in
a conical shape. Test results showed that these manufactured insert samples achieved
more than eight times the wear resistance of traditional inserts. The semi round design
of the inserts achieved over twenty times the wear resistance of traditional ones. It is
concluded that using cemented carbides with extra coarse WC grains (above 5 µm)
gives a lower hardness and greater toughness, whereas using medium coarse grains of
WC (2.1-3.4µm) provides better hardness and lower toughness (Sandvik Hard Material,
2009). A mixture of fine and coarse grains of WC provides a compromise of both
hardness and toughness in the same material. Bellin et al. (2010b) showed that using
sintered grains of fine diamond provide more resistance against abrasion and gives a
lower wear rate, while coarse grains of this material have better toughness against
impact and higher wear rate. Yahiaoui et al. ( confirmed that the PDC cutters that
Chapter Two: Literature Review on Oil and Gas Drill Bit Wear
P a g e |
have small diamond grains are the most abrasive resistant compared with coarse grain
ones. Yahiaoui et al. 5 a) concluded that when increasing the WC grain size led to
increase the acoustic emission energy leads to rise the fracture toughness. Cobalt
content has a great effect on the wear of the WC-Co alloys. Modulating the hardness
when cobalt is used as a binder will add ductility to the WC which is brittle led to an
improvement of WC-Co alloys against crack propagation.
3 Honeycomb structured polycrystalline diamond and Double Cemented
tungsten carbide (DC)
Chipping breakage and wear are the primary signs of failure for the materials which
formed the roller-cone bits. Chipping and fracture resistance could be mitigated, but on
sacrificing wear resistance and hardness of bit materials. This problem halts the
advancement of producing hard materials that can withstand both wear and chipping.
Fang et al. (2001) described two methods to tackle the encountered challenges:
- Honeycomb structured PDC: This approach appeared to address the previous
difficulties by designing composite materials used in the manufacturing of the roller-
cone bits. An example for this approach is a honeycomb structured composite of
polycrystalline diamond (PDC) and WC-Co for the synthesising manufacture diamond
enhanced inserts for roller-cone bits. The PDC/WC-Co composite exhibits improved
with super wear resistance, because of the diamond, and simultaneously, ameliorates
chipping and fracture resistance. Hence, PDC forms the core of the unit cell, whereas
WC-Co constitutes the web cell boundaries, i.e. each single PDC cell is completely
isolated by WC-Co. Figure 2. illustrates the microstructure of honeycomb PDC/WC-
Co composite. The role of WC-Co boundary is to deflect and disrupt crack and fracture
propagation processes due to the high toughness of the WC-Co as compared to the core
of the cell (PDC). On the other hand, this design does not compromise the wear
resistance, due to the high resistance of diamond against wear.
- Double Cemented Tungsten Carbide (DC): it consist of very high amount of cobalt
resulting in a fracture toughness about 50% greater than traditional cemented tungsten
carbide, while maintaining wear resistance by using large, hard phase granules of
tungsten carbide. Figure 2. demonstrates the microstructure of DC compared to
conventional WC-Co materials.

Chapter Two: Literature Review on Oil and Gas Drill Bit Wear
P a g e |
The two designs of the tungsten carbide bits have been tested under both laboratory and
field conditions (Fang et al., It was found that no damage occurred to the inserts
of honeycomb structural PDC of the bit. On the other hand, 57% of the standard PDC
inserts were chipped or spalled on the outer layer of diamond and the WC substrate was
also worn.
Figure . Honeycomb structured polycrystalline diamond (Fang et al.,
Figure . Optical micrograph image of conventional and DC carbides
(Fang et al.,
WC-6% Co
Conventional WC 27% Co
DC carbide with 27% Co
WC-6% Co
Cobalt matrix
A honeycomb PDC/WC –
Co-Composite
Standard PDC with 20% Co.
Cell boundary consists of
standard WC-11% Co

Chapter Two: Literature Review on Oil and Gas Drill Bit Wear
P a g e |
Figure 2. shows the extent of chipping in honeycomb structured PDC/WC-Co
composite inserts as compared to the standard ones. A DC carbide bit was also used in
drilling hard dolomite formation at depths between 4700 and 5200 ft. The compressive
strength of the dolomite formation ranges from 5000-30000 psi (34.47-206.85 MPa) ,
which led to insert breakage of the standard bits in this interval. However, the new DC
bits drilled the total interval with no significant insert breakage. Figure 2. compares
DC carbide inserts with the conventional-WC-Co-inserts.
Figure . Chipping resistance and durability of a rock drill bit insert enhanced
with the honeycomb structured PDC/WC-Co. (Fang et al.,
Figure . Comparison of rock bit inserts with DC carbide and conventional WC-Co.
after field test (Fang et al.,
Standard PDC Honeycomb PDC/WC-
Conventional WC-Co
DC carbide
Conventional WC-Co
DC carbide
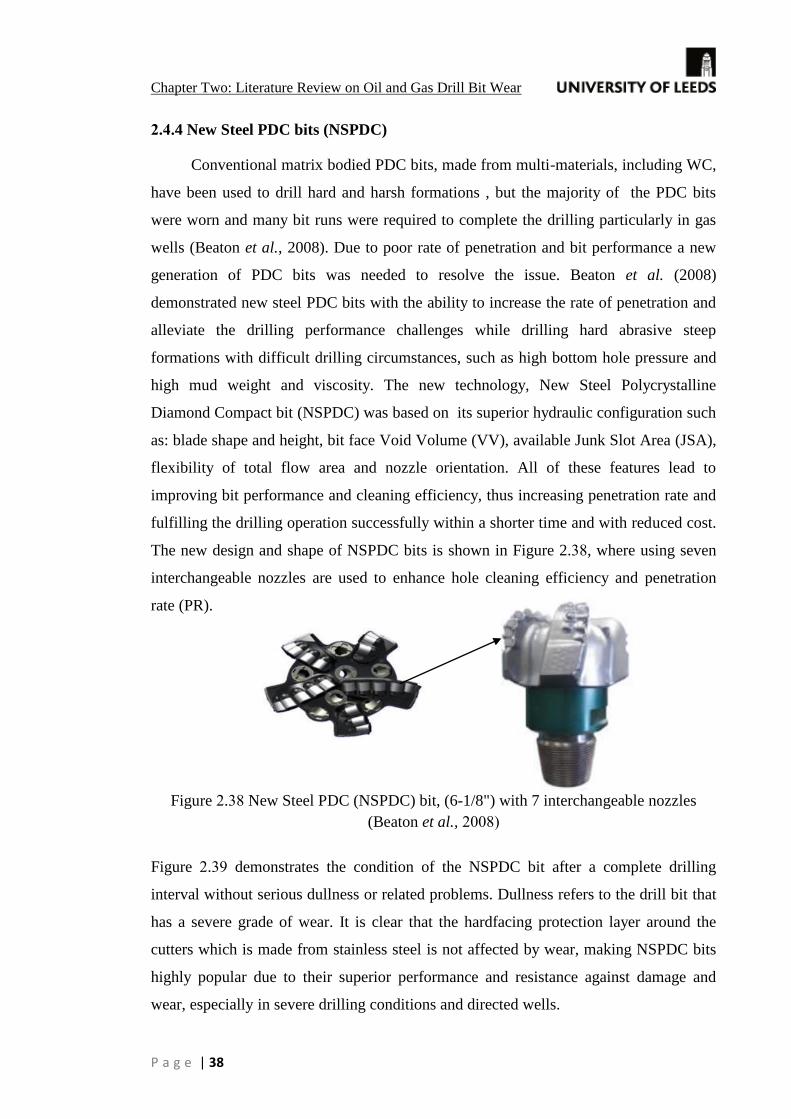
Chapter Two: Literature Review on Oil and Gas Drill Bit Wear
P a g e |
.4 New Steel PDC bits (NSPDC)
Conventional matrix bodied PDC bits, made from multi-materials, including WC,
have been used to drill hard and harsh formations , but the majority of the PDC bits
were worn and many bit runs were required to complete the drilling particularly in gas
wells (Beaton et al., 2008). Due to poor rate of penetration and bit performance a new
generation of PDC bits was needed to resolve the issue. Beaton et al. (2008)
demonstrated new steel PDC bits with the ability to increase the rate of penetration and
alleviate the drilling performance challenges while drilling hard abrasive steep
formations with difficult drilling circumstances, such as high bottom hole pressure and
high mud weight and viscosity. The new technology, New Steel Polycrystalline
Diamond Compact bit (NSPDC) was based on its superior hydraulic configuration such
as: blade shape and height, bit face Void Volume (VV), available Junk Slot Area (JSA),
flexibility of total flow area and nozzle orientation. All of these features lead to
improving bit performance and cleaning efficiency, thus increasing penetration rate and
fulfilling the drilling operation successfully within a shorter time and with reduced cost.
The new design and shape of NSPDC bits is shown in Figure 2. , where using seven
interchangeable nozzles are used to enhance hole cleaning efficiency and penetration
rate (PR).
Figure . New Steel PDC (NSPDC) bit, (6-1/8") with 7 interchangeable nozzles
(Beaton et al.,
Figure . demonstrates the condition of the NSPDC bit after a complete drilling
interval without serious dullness or related problems. Dullness refers to the drill bit that
has a severe grade of wear. It is clear that the hardfacing protection layer around the
cutters which is made from stainless steel is not affected by wear, making NSPDC bits
highly popular due to their superior performance and resistance against damage and
wear, especially in severe drilling conditions and directed wells.

Chapter Two: Literature Review on Oil and Gas Drill Bit Wear
P a g e |
Figure . Dullness condition of the NSPDC bit after drilling
the entire interval in one run (Beaton et al.,
.5 Diamond Enhanced Inserts or Cutters (DEI)
Cobb et al. (2011) discussed the new technology of Diamond Enhanced Inserts (DEI),
where the inserts are made from composite polycrystalline diamond, but applied for
roller-cone bits. This technique has been tested in two case studies in abrasive and
directional sections and the results were encouraging to alleviate bit wear during drilling
harsh conditions. The diamond enhanced cutters have the following applications:
- First generation of Diamond Enhanced Inserts (DEI):
In this generation heel inserts were used to enhance the protection of the bit against the
remaining rock ridges that might wear the sealing area of the bit, as shown in Figure
. . Furthermore, this new generation of drill bits improves the rate of penetration and
increases the durability of the bit using rounded bit inserts. This type of bits lead to
three to four times more wear resistance compared to Tungsten Carbide Inserts (TCI).
The first generation of DEI improved the drilling operation, however still it could not
tackle all the encountered problems, such as the short durability of the inserts.
Figure . Using the technology of heel row inserts (Cobb et al.,

Chapter Two: Literature Review on Oil and Gas Drill Bit Wear
P a g e |
- Second generation of the Diamond Enhanced Inserts (DEI):
Combination of DEI and TCI specifications led to the second generation of Diamond
Enhanced Insert heels. This new design involves diamond inserts heels of curved shape.
The new improvement reduced the overall wear and the inserts were more aggressive
with moderate durability.
- Third generation of the Diamond Enhanced Inserts (DEI):
During drilling abrasive and directional sections, the bits are prone to abrasive wear and
impact. With the use of rounded heel inserts with high quality allows less frictional heat
is produced at the contact area. However, abrasion resistance was increased, and impact
durability was reduced; causing the inserts to lose the diamond layer. Figure .
demonstrates the chipping problem in DEI, where the crack on the diamond's surface
layer leads to the loss of diamond coating and consequently reduces effectiveness of
inserts.
.
Figure . Progression of damages on diamond enhanced inserts
(Cobb et al.,
Several attempts have been made to remedy the difficulties of the second generation
DEI bits. Cobb et al. (2011) developed a novel DEI bit by using a tougher diamond
layer that could overcome the problems of the previous generations of DEI bits, i.e.
chipping and diamond loss. Many bit runs were done with this new technique to test
their performance and durability. Figure . illustrates the comparison among three
generations of DEI used in three cones within the same bit.
Overall, this approach enabled the roller-cone bits with DEI in the heel row to be more
durable against wear and impact as compared to conventional WC inserts. In addition,
the new technique improved the bit life and consequently reduced costs and time for
drilling abrasive and directional sections.

Chapter Two: Literature Review on Oil and Gas Drill Bit Wear
P a g e |
Figure . Comparison between 1st
nd and 3
rd generations of diamond heels, where
each generation has been applied in a cone within the same roller- bit
(Cobb et al.,
2.4.6 Thermostable PDC (TSPD) cutters
The use of traditional PDC bits at elevated temperature conditions, particularly 700C
and higher, is not effective due to the occurrence of thermal and abrasive wear. For this
purpose, Thermally Stable Polycrystalline Diamond (TSPD) cutters have been
developed. The TSPD cutters consist of three layer composite materials. The upper
layer consists of a diamond –silicon carbide (SiC) structure with a strong chemical bond
in the interface between diamond and silicon carbide grains, while the middle layer is
the sintered polycrystalline diamond and the lower one consists of a WC/Co-substrate.
The process of sintering is done under high pressure and high temperature (HPHT).
Figure 2. shows this process (Osipov et al.,
Figure . Starting and finishing stages of HPHT sintering process
(Osipov et al.,
A comparison between conventional PDC and TSPD cutters is shown in Table ,
clearly showing better compressive strength and fracture toughness for PDC inserts, as
compared to TSPD ones. However, the latter is distinguished with a combination of
high wear resistance and high thermostability.

Chapter Two: Literature Review on Oil and Gas Drill Bit Wear
P a g e |
Table . Comparison of the mechanical properties between conventional PDC and
TSPD cutters (Osipov et al.,
TSPD cutters have been tested for their stability during drilling high abrasive rocks
under high temperature conditions. The results showed increasing temperatures up to
C for 3 minutes gives a total deterioration or wear of the diamond layer for
conventional PDC cutters, whereas heating up to 1100C for 3 minutes leads to only a
slight change in the diamond–SiC layer of the TSPD cutters. Two types of TSPD bits
were run to drill certain formations. Figure . illustrates the two kinds of TSPD bits
that were used throughout the test run (which are commercially known as ISM-AP-214,
3C type and ISM-AP-165, 1C type), however the properties of these bits are not
disclosed.
The field test used various bits with conventional PDC and TSPD cutters to drill
different formations. The results of the field test showed that the TSPD bit (ISM-AP-
214, 3C) achieved a better performance than the traditional PDC cutters, especially
when drilling moderate to hard formations, where a higher rate of penetration was
achieved (0.98 m/hr) and the entire interval (406 m) was drilled using just one TSPD bit
during (413) hours compared to other standard PDC bit that drilled the same well, but
the interval being excavated was only 152 m and the penetration rate was (0.4 m/hr) at
(380) working hours. TSPD bits show to be more effective than normal PDC bits when
used for drilling moderate to hard formations.
Property Standard
PDC
inserts
Thermally
stable
PDC
inserts
Synthetic
monocrystalline
diamond
Cemented tungsten-
carbide (WC/15
mass.%Co)
Density, g/cm - - - -
Knoop
microhardness,
(GPa)
- - - -
Compressive
strength,
(GPa)
- - - -
Fracture
toughness,
MPa.m
- - - -
Young’s
modulus,
(GPa)
- - - -
hermal
sta ilit

Chapter Two: Literature Review on Oil and Gas Drill Bit Wear
P a g e |
Figure . Two types of TSPD bits used in the run test, ISM-AP-214, 3C type on the
left and ISM-AP-165, 1C type on the right (Osipov et al.,
2.4.7 Selection of binder with additives
Katiyar et al. (2016) indicated that abrasive and erosive wear are the most modes of
wear occurring in Tungsten-Carbide (TC) bits and they could overcome by lowering the
content of the binder (cobalt or nickel) as well as using very fine grains of WC. This
combination led to a substrate with high hardness high wear rate resistance. Using
nickel as a binder for the WC alloy led to better corrosion resistance with more
durability for the TC drill bits compared to cobalt binder. Adding some additives to the
WC alloy such as tantalum carbide (TaC) and niobium carbide (NbC) lead to increase
the softening temperature of the binder (cobalt or nickel) and consequently improve the
thermal properties of the binder.
Yahiaoui et al. (2015 b) mentioned the new processes for manufacturing the WC-Co
alloys (reactive coating, imbibition and reactive imbibition). Each process led to a
special grade of WC-Co alloy. These new processing techniques control the migration
of cobalt. Using boride (B) during the manufacturing processes led to the diffusion of
boride into the WC-Co more deeper forming WCo-B (ternary borides) causing the
reduction of the free cobalt left in the composite matrix. This improvement led to
increase the hardness and the fracture toughness of the WC-Co inserts. The existence of
the boride phase decreases the wear rate by strengthening the active surface and limiting
the effect of cobalt content.
Discussion
Field rock samples should be used in abrasion tests in order to give a better
representation of the encountered rocks while drilling for oil and gas, since otherwise

Chapter Two: Literature Review on Oil and Gas Drill Bit Wear
P a g e |
the testing rock samples may not show similar features to these of oil field. Impact
laboratory tests for PDC bits are fulfilled under low vibrations, typically less than 1 Hz.
In contrast, under drilling conditions, PDC bits exhibit axial vibrations with frequencies
ranging from 2 to 6 Hz. As impact tests provide an indication of impact resistance. It is
more useful for assessing the quality of the diamond and diamond-WC substrate, rather
than impact resistance measurements that replicate the conditions experienced whilst
drilling. Grinding ratio technique provides crucial information about the quality of the
PDC and it could be used for the evaluation of PDC samples against wear as well as a
quality index criterion.
The progress in PDC cutter technology which achieved by various famous manufacture
companies led to the advancement of the testing instruments and techniques. Some of
the current testing methods need significant time for completion. In addition, the current
impact test which is used by many companies require a significant number of cutters to
be tested for each run to gain reliable results. However, Varel International Company
has recently developed the new technique of Acoustical Emission Toughness Testing
(AETT).
Specific energy as well as all other wear quantification methods should be compared
simultaneously with conventional bit record data and penetration rate logs to avoid any
noise data or misleading interpretation produced from one or more of the wear
quantification methods.
If theoretical wear models are applied to quantify the wear of the drill bits,
comprehensive comparison between the qualitative bit wear and the theoretical
predicted wear must be made in order to evaluate the reliability of the wear models .
Residual stress is the main cause of delamination of the PDC cutters. The big difference
of the thermal expansion coefficient between the diamond and the binder (cobalt) as
well as between the diamond layer and the substrate induces a significant internal stress
that cause cracks in the diamond layer. The residual stress between the diamond layer
and the substrate is increased in the PDC inserts upon cooling after sintering. The
sintering process is performed at high pressure and high temperature (HPHT). The
substrate tends to have tensile stress, while the diamond layer has compressive stress
causing shear stress to be increased significantly near the edge at the interface between

Chapter Two: Literature Review on Oil and Gas Drill Bit Wear
P a g e |
the diamond and the substrate layer. The occurred shear stress is detrimental that leads
to fracturing (crack propagation) within the diamond table causing chipping as well as
delamination at the interface between the diamond and the substrate layer.
FEA simulation techniques should be used to analyse the residual stresses in roller-cone
cutters and PDC cutters as well to provide a better understanding of the behaviour of the
material during the sintering process and how to avoid the reported problems
encountered within the synthesising manufacture. Furthermore, DEM simulations could
be very useful for determining the torque, especially when torque data is missing, which
is a crucial parameter for quantifying the bit dullness. The rapid progress of PDC will
benefit from the deployment of numerical simulations for bit design. However, further
work is needed to simulate the wear of PDC and roller-cone bits.
As described above, past research gave an understanding of the manufacturing methods
of oil drill bits and how to improve the overall features of them.
Conclusions
It is concluded that abrasion wear is the dominant type of wear occurring in roller-cone
bits, which is caused by the process of ploughing when the abrasive rocks are soft like
limestone, while the process of micro-ploughing and micro-cutting are the main cause
of abrasive wear of roller-cone bits when abraded against hard formations such as
granite or hard sandstone.
The most common types of wear occurring in PDC bits during drilling are abrasion and
impact. Abrasive wear is mainly caused by thermal degradation when PDC bits are used
to drill in harsh environments of elevated temperature, causing the transformation of
diamond to graphite (graphitisation).
Overall, the major cause of wear for drill bits is abrasion when the drill bit is mostly
abraded against rock formations that are mainly consisting of silica (SiO ) such as
sandstone. However, another destructive form of wear occurring in oil drill bits is
fatigue or gross fracturing. Fatigue occurs due to the repeated excessive drilling loads
when impacting against rocks. The properties of the rock such as the particle size of the
grains, the content of the cemented material and the abrasiveness of the grains influence
the wear rate of the bit. Hence, studying the characteristics of rocks would be helpful to
select the optimum drill parameters (rate of penetration, weight on bit, etc.) and to

Chapter Two: Literature Review on Oil and Gas Drill Bit Wear
P a g e |
choose the most appropriate type of drill bit for a certain rock formation and
consequently this will prolong the bit life and reduce the drilling costs. Rocks that have
a coarse grain size and contain larger angular particles cause increased wear rates. The
wear rates of the materials forming the drill bit decrease as their hardness increases.
Using a combination of state of the art instruments for bit cutters testing (micro and
nano-scratch) will give better knowledge of the durability of roller-cone teeth and PDC
cutters under various drilling conditions. Chapters 4 and 5 in this thesis illustrate the
application of state of the art technologies of micro and nano indentation and scratch
testing which are available at the Institute of Particle Science and Engineering (IPSE) at
the University of Leeds. PDC samples are imported from two different manufacturers
for the above testing techniques.
Field tests on TSPD bits showed that these bits are highly resistant to wear, especially in
elevated temperatures. In comparison, TSPD bits exhibit better performance than
conventional PDC bits, especially when drilling intermediate to hard formations which
represent the most difficult sections encountered during drilling.
Characterisation of the mechanical properties of the materials forming the bit such as
hardness, Young's modulus and fracture toughness is crucially important to quantify the
wear of the drill bits, as all wear models discussed here require the determination of
these properties.
Wear models of Rabinowicz , Hutchings (1992) and Ning and Ghadiri (2006)
could be used for wear prediction of the drill bits and comparing their results with the
proposed experimental wear model to verify the results, while Archards'
technique is used for the determination of the coefficient of wear, while Element six
Ltd. model is discarded as insufficient explanation was provided about the parameters
used in this empirical model.
Developing a wear model which uses the concept of three body abrasion would be
useful to improve the wear prediction of the drill bits as drill bits are susceptible to three
abrasion wear rather than two abrasion wear.

Chapter Three: Case Study
P a g e |
Chapter 3 Case Study
Real-time monitoring of drill bit wear and specific energy as a
criteria for the appropriate time for pulling out worn bits
3.1.1 Introduction
Current techniques for deciding when to pull out the worn bits are based on speculation
rather than reliable engineered methods. Two concepts have been previously reported in
the literature as shown in sections 2.3.2.1 and 2.3.2.2 to incorporate the effects of
drilling parameters on forecasting the life of drill bits. Bit tooth flatness and specific
energy approaches were used for assessing the bit tooth wear and predicting the rock
formation and its properties being drilled (Pessier and Fear , and Burgess , ).
However, drilling shale formations or encountering a surface of erosion especially
unconformities as well as not taking into account the properties of the rocks and the bit,
reduces the reliability of these methods.
In the following case study, recently drilled oil wells from southern Iraq are analysed
for bit wear, where a modified technique based on specific energy and bit dullness is
presented as mentioned in sections 2.3.2.1 and 2.3.2.2 and assessed as trending tools for
determining the status of the drill bit in cases where drill torque data is unavailable.
Estimated results of bit wear for each bit run are correlated with the qualitative bit tooth
wear obtained from the field bit record. Detecting bit wear by monitoring real-time bit
flatness (FD) would be useful for obtaining information regarding tooth wear or tooth
failure while drilling and when to decide appropriately to pull out the bit.
Literature values of unconfined compressive strength (UCS) of the drilled formations
are compared with the computed Mechanical Specific Energy (MSE).
3.1.2 Objectives
During drilling in many producing oil wells in southern Iraq, the bit torque values were
missing due to the lack of the measurement while drilling logs (MWDL) and tools. The
application of the previous mentioned techniques for bit tooth wear prediction such as
Specific Energy (SE) and dimensionless drilling parameters are not possible unless
torque values are known. Using Equation (2-2) to calculate the torque is also
unattainable as the coefficient of friction values (µ) were unknown. Torque
measurements can be performed only by Measurements While Drilling Logs (MWDL),
and these instruments are not always available during the drilling operation, or are not

Chapter Three: Case Study
P a g e |
used due to the high costs of such devices. There is no accurate equation for torque
determination, except that developed empirical equation found by Warren (1984).
Warren (1984) suggested an equation for torque prediction based on laboratory studies.
Warren (1984) obtained the following equation for torque determination:
( √
) [
]
where T is the torque (lb. ft), W is the weight on bit (lb) , d is the diameter of the bit (in)
, N is the rotary speed (RPM) , PR is the penetration rate (ft/hr) and L is the interval
drilled by the bit (ft).
In the present work Equation (3- is applied to obtain the dimensionless drilling torque
(TD) which is needed for the calculation of dimensionless tooth flatness (FD) and also
for the determination of the specific energy as shown in further calculations.
3.1.3 Data acquisition
The data used in further calculations of this case study were collected mainly from bit
records of various wells in southern Iraq and are referred to as A , A , B , B and B .
All of these wells are located at the province of Basrah in southern Iraq. The selection
of the wells being studied based upon the availability of the bit records, therefore five
wells were chosen from two different oil fields that have the necessary data needed for
the further calculations. Figure B.1 in Appendix-B shows a sample of a bit record
obtained for a well being drilled in the South of Iraq, where drilling parameters are
shown along the status of the bits used for drilling the well. Figure 3.1 illustrates the
main largest oil field in southern Iraq. Lithology of the wells of interest is obtained from
bit records, offset wells and from the study of Al-Ameri et al. ), as shown in
Figure 3. , which indicates the main rock formations being excavated.
Figure . Location of main oil fields in southern Iraq (Abeed et al.,

Chapter Three: Case Study
P a g e |
Figure . Southern Iraq Stratigraphic column for main oil fields in Basrah region
(Al- Ameri et al.,
Qualitative bit tooth wear obtained from bit records. International Association of
Drilling Contractors (IADC) classified the severity of the bit tooth wear or dullness of
the PDC cutters as a fraction of 8. For instance,1/8, 2/8 up to 8/8 , where 1/8 refers to
that just one part out of eight (overall length) of the teeth or insert is damaged. 8/8 or 1
means that the teeth or insert is completely worn.
Analysis of the results and discussion
Drilling data variables such as bit diameter, weight on bit, rotary speed, and penetration
rate with respect to depth were used to calculate the Specific Energy (SE), Mechanical
Specific Energy (MSE), average Specific Energy (SEavg), and adjusted values of
Mechanical Specific Energy (MSEadj). SE values are computed using Equation (2- ),
and since the provided bit records did not include the measured torque, therefore, the
mechanical specific energy (MSE) (Equation 2- cannot be calculated. However, it
should be pointed that torque values can be estimated using Warren's approach
(Equation 3.1) that has uncertainty of about 10% of the real torque (Warren 1984).
According to the study of Pessier and Fear (1992) it was observed that bit coefficient of
friction (μ) values are within the range of 0.21 for roller-cone to 0.84 for PDC bits, and

Chapter Three: Case Study
P a g e |
in this work it was approximately as all drill bits used in the five selected wells are
roller-cone bits. MSE values are calculated by using Equation (2- ) based on the
calculation of torque from Equation ( - ). SEavg represents the average values of MSE
and SE obtained from Equations (2-1) and (2-5) respectively, while MSEadj is the
adjusted value of MSE according to Equation ( - ). SE, MSE, SEavg and MSEadj values
are plotted versus depth in Figures 3.3, 3. 9, 3.11and 3.13 respectively to observe
their trends as compared with the qualitative tooth wear of the oil drill bit obtained from
bit records.
The second part of the calculations is computing the dimensionless torque (TD) and
dimensionless rate of penetration (PRD), using Equations ( -9) and ( -10), respectively.
It is worth mentioning that, these calculations should be done for each depth interval
being drilled to monitor the real-time parameters with depth. By plotting TD versus PRD
and fitting the best linear trend line across the points, the intercept of the line a and the
slope a of Equation ( -6) are determined. Next, the bit efficiency (ED) is computed
using Equation ( -8). Finally, Equations ( -12) and ( -11) are used to compute
dimensionless weight on bit (WD) and the bit tooth flatness (FD), respectively. A
comparison is needed between the anticipated tooth flatness trend (FD) and the
qualitative bit tooth wear to assess the reliability of this technique as an indicator for bit
tooth wear. Bit records were provided with the bit tooth wear according to the
International Association of Drilling Contractors (IADC) classification. Figure B.1 in
Appendix- B illustrates an example of a bit record.
Well A
Well A lies in one of the largest oil fields in southern Iraq along with many other oil
producing wells nearby. A sample of bit record data is illustrated in the upper part of
Table 3. which display that the well was drilled by various bits at different depth
intervals. For instance, the first bit (SS5) drilled an interval of 38 m (i.e. from the
surface till depth 38 m) and the second bit penetrates from depth 38 m to depth 660 m.
The lower part of the table shows the calculation of the dimensionless parameters.
Torque (T) is determined from Equation (3- while the mechanical coefficient of
friction (μ) is calculated from Equation (2-4) and finally the dimensionless parameters
are calculated through Equations (2-9) to (2-11). The obtained results are used later to
produce Figures . to .6 for well A .

Chapter Three: Case Study
P a g e |
Table . Sample of bit record data and computations for well A (Data are provided
from bit records obtained from the section of Petroleum Engineering of South Oil
Company)
Figure shows the specific energy plotted versus depth, while Figure illustrates
the observed qualitative bit tooth wear versus depth. It is clearly shown from Figure
that the specific energy values of all types are increased steadily with depth from the
first bit run till a depth of 947 m, which could mean that the dullness or the wear of the
teeth is rising gradually. However, Figure shows a reduction in tooth wear values
from a depth of 660 m to about 947 m, while the specific energy values at the same
depth interval rose steadily. This contradiction is continued for further depths.
Depth (m) Bit Dia.
(inch)
Drill bit
Commercial
Name (code)
Bit Area
(inch2)
WOB
( ton)
Distance
Drilled
(m)
Rotary
Speed(rpm)
ROP
(m/hr)
ROP
(ft/hr)
0-38 26 SS5 530.660 10 38 100 6.33 20.762
38-660 17 ½ R1 240.406 10 622 100 5.78 18.958
660-947 12 1/4 X3A 117.799 18 287 70 4.94 16.203
947-1440 12 1/4 MSS 117.799 18 493 75 6.36 20.861
1440-1530 12 1/4 M44NF 117.799 18 90 75 4.5 14.760
1530-1721 12 1/4 X3A 117.799 18 191 90 2.19 7.183
1721-1925 12 1/4 JD4 117.799 18 204 90 2.45 8.036
1925-2074 8 ½ J4 56.716 15 147 100 3.5 11.480
2074-2440 8 ½ S84F 56.716 15 366 60 3.5 11.480
Depth (m) µ Torque (lb.ft.) TD TD*10^3 RD Sq(RD)*10^3 FD Bit tooth
wear (0-8)
0-38 0.193 2788.605 0.064 64.352 0.002 39.964 -0.805 2
38-660 0.146 1417.530 0.049 48.601 0.002 46.548 3.194 4
660-947 0.193 2365.806 0.064 64.376 0.004 61.475 -0.416 2
947-1440 0.179 2198.652 0.060 59.827 0.005 67.388 2.311 4
1440-1530 0.211 2582.809 0.070 70.281 0.003 56.684 -2.209 2
1530-1721 0.170 2080.115 0.057 56.602 0.001 36.098 0.169 3
1721-1925 0.171 2098.304 0.057 57.097 0.001 38.181 0.180 3
1925-2074 0.197 1393.456 0.066 65.574 0.003 51.973 -1.069 4
2074-2440 0.192 1357.608 0.064 63.887 0.005 67.097 0.244 2

Chapter Three: Case Study
P a g e |
Figure . Specific energy vs. depth for well A
Figure . Qualitative tooth dullness vs. depth for well A (Provided from bit records
obtained from the section of Petroleum Engineering of South Oil Company)
From depth 1530 m to 1721m, the trend of specific energy matches the trend of the
actual tooth dullness. Furthermore, from depth 1721 m to 1925 m both specific energy
and the bit tooth wear are decreased. For further depths there is no agreement.
The second attempt for predicting the bit tooth wear is by using dimensionless drilling
parameters, specifically the bit tooth flatness parameter (FD) which is relevant to bit
0
500
1000
1500
2000
2500
3000
0 1 2 3 4 5
De
pth
(m
)
Qualitative bit tooth wear (0-8 ) , unitless
0
500
1000
1500
2000
2500
0 100 200 300 400 500 600 700 800
De
pth
(m
)
SE MSE SE avg (MSE)adj
Specific energy
Kpsi MPa

Chapter Three: Case Study
P a g e |
wear. Dimensionless torque (TD) and dimensionless rate of penetration (PRD) can be
calculated through Equations ( -9) and ( - for each depth interval. Due to the linear
relation between square root of PRD and TD in Equation ( - ), a cross plot is drawn
between √ and TD for well A to obtain the intercept and slope of the best fit line
through the plotted points as shown in Figure .
Figure . Cross plot of dimensionless torque (TD) with dimensionless square root of
penetration rate (RD) for well A
The same cross plot is performed for the rest of the wells. Figures B.2-B.5 in Appendix-
B show the same cross plot for wells B , B , A and B respectively. Table 3.
illustrates the obtained values of the intercepts and the slopes for five wells in the south
of Iraq.
Table . Intercepts and slopes obtained from the cross plot of the dimensionless torque
with the dimensionless penetration rate for five wells in southern Iraq
Well Name Intercept (a ) Slope (a )
A
B
B
A
B
y = 0.2114x + 50.244
0
10
20
30
40
50
60
70
80
30 35 40 45 50 55 60 65 70
Dim
en
sio
nle
ss t
orq
ue
*1
0-0
3
Dimensionless square root of penetration rate *10-03

Chapter Three: Case Study
P a g e |
The obtained values of a and a were used to calculate the dimensionless bit tooth
flatness (FD) by using Equations ( - -12) and ( -11). The predicted tooth flatness is
compared to the actual bit tooth wear to assess its behaviour and trend. Both the
predicted tooth flatness and the actual qualitative tooth dullness versus depth are plotted
in Figure .
Figure . Comparison between dimensionless bit tooth flatness (FD) and the actual
tooth wear versus depth for well A
It was surprisingly observed that the two curves are matching from the first bit run at
depth 38 m to depth 1925 m. In spite of the good agreement, divergence is revealed
from depth 1925 m onwards.
The interpretation for this difference might be attributed to shale formations where bit
balling could occur. This likelihood is confirmed with the lithology of most wells lies in
Basrah oils fields which provided from the study of Al-Ameri et al. ( ) indicating
that beyond a depth of 1925 m, shale formations are present as either the dominant or
the second- most dominant formation as shown in Figure 3.2. Figure 3. illustrates the
existence of shale formations at depths close to 1925 m which match the study of Al-
Ameri et al. (2011). Bit tooth flatness method is likely to be more efficient predicting
tool than the specific energy technique, thus it will be applied for another four wells to
observe its efficiency and reliability as a trending tool for predicting the bit tooth
dullness.
Well B
Well B lies in a huge oil field that consists of many other wells being drilled for the
-3 -2 -1 0 1 2 3 4
0
500
1000
1500
2000
2500
3000
0 1 2 3 4 5
Dimensionless bit tooth dullness (FD)
De
pth
(m
)
Qualitative tooth wear (0-8), dimensionless
Tooth wear FD

Chapter Three: Case Study
P a g e |
case of oil production. The same procedure of computations was performed for this well
to make a clear understanding of bit tooth dullness while drilling. Figures and
demonstrate this principal.
Figure . Specific energy vs. depth for well B
Again, specific energy seems to suggest that the teeth of the bit are beginning to wear
from the first bit run, while the actual bit dullness is rather different (see Figure 3.7)
where it shows a decreasing trend from a depth of 660 to 1000 m, after which it to rises
again. The dramatic increase in the specific energy trend from the normal increasing
line is clearly shown at a depth of 1850 m, which could indicate a sharp wear of the bit
teeth. This agrees with the rising trend of the qualitative bit wear as shown as the red
curve in Figure 3.8. Maximum bit wear occurred at a depth of 2051 m, while the highest
peak of specific energy exists at depth 2296 m, which means that the approach of
specific energy is not always a precise approach for predicting the bit tooth wear,
therefore it should be applied in conjunction with other techniques such as gamma ray
and sonic logs to avoid any misleading conclusions.
Figure . illustrates the matching in trends for dimensionless bit flatness and
qualitative bit tooth wear from the first bit run till a depth of 2000 m, where the
dimensionless bit tooth flatness is equal to 3.87 a depth 460 m and the corresponding
qualitative bit tooth wear is 4 ,but from depth 2000 m onwards, there is an uncertainty
0
500
1000
1500
2000
2500
0 100 200 300 400 500 600 700 800
De
pth
(m
)
SE MSE SE avg (MSE)adj
Specific energy Kpsi MPa

Chapter Three: Case Study
P a g e |
of the bit flatness technique. For example at depth 2051 m, the dimensionless flatness
(FD) is -0.887, whereas the corresponding qualitative bit tooth wear at that depth is 6.
This discrepancy is a lot and after investigation of the lithology for this well at depth
2000 m onwards revealed that shale formations (and associated bit balling) exist and
might cause the uncertainty from that depth onwards (Al-Ameri et al., ). It is worth
noting that it is not realistically possible to get a negative value for the dimensionless bit
tooth flatness (FD), however this parameter is used as a wear indicator of the bit. In
general, the results emphasized the fact that dimensionless bit flatness approach is more
applicable in forecasting the bit teeth wear as compared to the specific energy method.
To confirm the reliability of this technique, all above computations are done for three
other wells.
Figure . Bit tooth flatness (FD) compared to the qualitative bit tooth wear
for well B
Well B
In this well, as shown in Figure . the specific energy increased gradually from the
first bit run till depth 1000 m which agreed with the qualitative bit tooth wear which
shown as the red curve in Figure 3. , however, from depth 1000 m till depth 1058 m,
the qualitative bit tooth wear decreased dramatically from 6 to 2 and went back to 4 as
seen from Figure . , while the specific energy started to reduce sharply at depth 1058
m till depth 1756 m. The rest bit runs show similar behaviour for the specific energy
compared to the actual tooth wear except at depth 2561 m where the specific energy
increased rapidly and reached the peak, while the bit tooth wear increased sharply at
depth 2722 m.
-10 -5 0 5 10
0
500
1000
1500
2000
2500
0 2 4 6 8
Dimensionless tooth flatness (FD)
De
pth
(m
)
Qualitative bit tooth wear ( 0-8) , unitless
Bit tooth wear FD

Chapter Three: Case Study
P a g e |
Figure . Specific energy vs. depth for well B
As a quick glance comparison between the trends of the specific energy and the
qualitative bit tooth wear, it seems that there is a good agreement between the two.
However, the escalation or reduction of the specific energy when compared to the
qualitative bit tooth wear is not at the same depth. For example, from depth 340 m to
depth 1004 m there is an increasing trend for the qualitative bit tooth wear and started to
decrease after 1004 m, while specific energy increased from depth 340 m to depth 1058
m and after that depth the specific energy displayed reduction in trend. The same
finding was found at the rest depths of this well. Therefore, another comparison
technique is needed to overcome this issue.
Figure . illustrates that the predicted bit tooth flatness behaves similarly to the trend
of the qualitative bit tooth wear in all bit runs except for slight insignificant discrepancy
at some depths which means that tooth flatness approach shows the ability to forecast
the wear status of the drill bits efficiently.
0
500
1000
1500
2000
2500
3000
3500
0 200 400 600 800 1000
De
pth
(m
)
SE MSE SE avg (MSE)adj
Specific energy Kpsi MPa

Chapter Three: Case Study
P a g e |
Figure . Bit tooth flatness and qualitative bit tooth wear versus depth for well B
Well A
Figure . demonstrates the gradual increase of the specific energy with depth from the
first bit run till depth 1920 m., whereas the behaviour of the qualitative bit tooth
dullness showed in Figure . is rather different, where it starts to decrease from the
first bit run to depth 919 m and starts to rise afterwards to depth 1920 m. From depth
1920 m to 2220 m of the wellbore, there is a good agreement between the trend of the
specific energy and the qualitative bit wear. However, Figure . shows the agreement
in behaviour between the actual tooth wear and the predicted one (FD) at most depths.
Figure . Specific energy vs. depth for well A
-5 0 5 10 15 20 25
0
500
1000
1500
2000
2500
3000
3500
0 2 4 6 8
Dimensionless tooth flatness (FD)
De
pth
(m
)
Qualitative bit tooth wear (0-8) , dimensionless
Bit tooth wear Tooth flatness
0
500
1000
1500
2000
2500
0 100 200 300 400 500 600 700 800
De
pth
(m
)
SE MSE SE avg (MSE)adj
Specific energy Kpsi MPa

Chapter Three: Case Study
P a g e |
Figure . Comparison between tooth flatness (FD) and qualitative tooth wear versus
depth for well A
Well B
Figure . shows for well B , the specific energy method alone does not seem to
indicate the bit wear efficiently when compared to the qualitative bit tooth wear shown
in Figure 3.14, where there is a disagreement at many depths which reduces the
reliability of the specific energy technique, whereas bit tooth flatness technique (FD)
agrees with the actual wear trend nicely at most depths as shown in Figure . and it is
likely to be considered a reliable method to predict the tooth wear rather the traditional
specific energy method.
In general, comparison of the dimensionless bit tooth flatness (FD) and. the qualitative
bit tooth wear versus depth for wells A , B and A show that at depth 2000 m onward,
there is an incompatibility between the predicted bit tooth flatness behaviour and the
actual bit wear. After analysing the offset wells and the lithology at depth 2000 m
onward, shale formation is encountered and that might affect the results of the predicted
bit wear due to the influence of shale on the bit i.e. bit balling.
Furthermore, unconformities might occur at depth 2000 m for some wells between
Khasib and Mishrif formations and at depth 2850 m between Nahr-Umr and Shuaiba
formations as clearly seen from Figure . represented by a wavy line rather than
straight lines.
-4 -2 0 2 4
0
500
1000
1500
2000
2500
0 2 4 6 8
Dimensionless tooth dullness
De
pth
(m
)
Qualitative bit tooth wear (0-8), unitless
Tooth wear FD

Chapter Three: Case Study
P a g e |
Figure . Specific energy vs. depth for well B
Figure . Tooth dullness compared to the qualitative bit tooth wear versus depth for
well B
Analysis of the unconfined compressive strength (UCS) of the rock formation:
According to Teale (1965) the minimum specific energy values could be correlated with
values of unconfined compressive strength (UCS). In this study, the adjusted
mechanical specific energy MSEadj using Equation (2- ) would give the minimum value
for the specific energy which could correspond to the UCS values of the rock from the
work of Zhao (2007). Tables 3. to 3. illustrate the calculated values of MSEadj for five
-0.15 -0.1 -0.05 0 0.05 0.1
0
500
1000
1500
2000
2500
3000
3500
0 2 4 6 8
Dimensionless bit tooth dullness (FD)
De
pth
(m
)
Qualitative tooth wear (0-8), dimensionless
Tooth wear FD
0
500
1000
1500
2000
2500
3000
3500
0 250 500 750 1000 1250 1500
De
pth
(m
)
SE MSE SE avg (MSE)adj
Specific energy
Kpsi MPa

Chapter Three: Case Study
P a g e |
wells in southern Iraq and the corresponding values of (UCS) according to the
investigation of Zhao (2007). The lithology of the five selected wells is taken from the
previous work of Al-Ameri et al. (2011) as shown in Figure .2, while other lithological
information is taken from bit records and offset wells. It was observed that adjusted
mechanical specific energy values were within the range of the estimated values of the
unconfined compressive strength of the corresponded formations, except for a few cases
where some formations are influenced by the occurrence of shale that cause bit balling
phenomena.
Table . Calculated values of adjusted mechanical specific energy compared to the
unconfined compressive formations for well A
Depth
(m)
Rock
formation
Mechanical
specific energy
(Eq. 2-
(MSE) ,psi
Adjusted
mechanical specific
energy (Eq. 2-
(MSEadj) , psi
Adjusted
mechanical
specific energy
(MSEadj) , MPa
Unconfined
compressive rock
strength (UCS), MPa
(After Zhao 2010)
- Conglomer-
ate
30-230 for
Conglomerate.
- Limestone 30-250 for Limestone.
-
Limestone 30-250 for Limestone.
-
Dolomite 20-120 for Dolomite.
-
Limestone 30-250 for Limestone.
-
Shale
+Lime.
30-250 for Lime. and 5-
100 for Shale.
-
Limestone 30-250 for Limestone.
-
Shale+ bit
of Lime. 5-100 for Shale.
-
Marl
+Shale
+Lime.
30-250 for Lime. and 5-
100 for Shale

Chapter Three: Case Study
P a g e |
Table . Comparison of adjusted mechanical specific energy with unconfined
compressive strength (UCS) for well B
Table . Computed adjusted mechanical specific energy compared to the unconfined
compressive strength (UCS) for well B
Depth (m) Rock
formation
Adjusted
mechanical
specific energy
(MSEadj) , MPa
Unconfined compressive rock
strength (UCS) , MPa
(After Zhao 2010)
- Anhydrite +Marl 30-250 for Limestone and 5-
100 for Shale
- Limestone 30-250 for Limestone.
- Dolomite 20-120 for Dolomite
- Limestone +
Marl 30-250 for Limestone
- Limestone 30-250 for Limestone.
- Limestone + bit
of Shale
30-250 for Limestone and 5-
100 for Shale
- Limestone +
Shale
30-250 for Limestone and 5-
100 for Shale
- Shale 5-100 for Shale
- Marl +Shale
+Limestone
30-250 for Lime. and 5-100 for
Shale.

Chapter Three: Case Study
P a g e |
Table . Adjusted mechanical specific energy compared to the unconfined
compressive strength (UCS) for well A
Table . Adjusted mechanical specific energy and unconfined compressive strength
(UCS) for well B
Tables 3.3-3.7 show the comparison between the calculated unconfined compressive
strength (UCS) from the mechanical specific energy equation with UCS from the
Depth (m) Rock
formation
Adjusted mechanical
specific energy
(MSEadj) , MPa
Unconfined compressive rock
strength (UCS) , MPa
(After Zhao 2010)
- Limestone+
Anhydrite 30-250 for Limestone.
- Dolomite 20-120 for Dolomite.
- Dolomite 20-120 for Dolomite.
- Limestone 30-250 for Limestone.
- Limestone 30-250 for Limestone.
- Shale + bit of
Limestone 5-100 for Shale and 30-250 for Lime.
- Limestone
+bit of Shale 5-100 for Shale and 30-250 for Lime.
- Limestone
+Marl 30-250 for Limestone.
- Marl + Shale+
Limestone 5-100 for Shale and 30-250 for Lime.
Depth (m) Rock
formation
Adjusted mechanical
specific energy (MSEadj)
, MPa
Unconfined compressive rock
strength (UCS) , MPa
(After Zhao 2010)
-
Conglomerate+
Anhydrite
+Lim.
30-230 for Conglomerate and
30-250 for Lime.
- Anhydrite
+Marl -----------
- Dolomite 20-120 for Dolomite
- Limestone 30-250 for Lime.
- Shale +Lime. 5-100 for Shale and 30-250 for
Limestone.
- Shale +Lime. 5-100 for Shale and 30-250 for
Limestone.
- Lime. +Shale 30-250 for Lime. and 5-100 for
Shale.
- Shale 5-100 for Shale.
- Sandstone +
Shale
20-170 for Sandstone and 5-100
for Shale.

Chapter Three: Case Study
P a g e |
laboratory work of Zhao (2010) to predict the type of rock formation being excavated.
The mentioned values of UCS after Zhaos' work show a range values and cannot
represent the exact value of the corresponding rock formation, therefore, in order to
obtain more reliable values of UCS. It is necessary to run experimental UCS tests on
real rock samples collected from the field corresponded to the formation being studied.
1.5 Conclusions
Dimensionless parameters methods suggested by many researchers could be useful to
quantify bit tooth wear, when only the measured values of torque are known. However,
in most cases, the data of torque are not available. In this study an approach based on
the dimensionless bit tooth flatness was used as a real-time monitoring "trending tool"
of the dullness of the bit teeth. All studied wells in this research showed good
agreement between trends of the qualitative bit wear and the predicted bit tooth wear,
excluding the regions of shale accumulations. When drilling shale formations, the drill
bit will suffer from the phenomena of bit balling, which means that the sticky shale
particles will accumulate at the face of the bit, thus causing high values of torque and
consequently high value of specific energy, so special care is needed when using the
specific energy technique during drilling shale formations.
Unconformities within the rock formations also cause misleading results, hence specific
energy and dimensionless drilling parameter techniques cannot always be reliable tools
for monitoring the wear of the teeth unless other methods are used simultaneously such
as well logs combined with geological information.
The predicted values of the Unconfined Compressive Strength of the rock (UCS) were
determined from the adjusted mechanical specific energy values based on the study of
Teale (1965) as the minimum specific energy is corresponded to the unconfined
compressive strength (UCS). The calculated adjusted mechanical specific energy values
give only an indication on what type of the formation is being drilled i.e. lithology, but
it is not a precise method for measuring (UCS) of the rock. Laboratory UCS
measurements of the penetrated rock formation samples is needed for this validation.
Nevertheless, all the above findings are based on empirical approaches which require
field data to predict the wear of the drill bit when drilling various formations. It is
essential to come up with a unique methodology to predict wear based on the
mechanical properties of the drill bit such as hardness, Young’s modulus and fracture

Chapter Three: Case Study
P a g e |
toughness as well as those of rocks along with the drilling parameters such as weight on
bit , rotation speed , bit diameter and rate of penetration.
The previous methods for determining the wear are based on empirical equations based
on two body abrasive wear, while it is worthy to present a new approach based on the
concept of three body abrasive wear, as introduced by Rabinowicz (197 ). The drill bit
is typically exposed to three body abrasive wear as the cuttings generated during
crushing the rock formation by the drill bit are free to roll and slide against the bit. The
obtained specific energy as previously mentioned in section was shown to be
unreliable technique for monitoring the wear of the bit teeth. In an attempt to overcome
the shortcomings of this technique, a modified specific energy formula is presented and
evaluated using the concept of three body abrasive wear.
3.2 A New Approach for Predicting the Wear of Roller-Cone Bits using
the Concept of Three Body Abrasion
3.2.1 Introduction
In drilling for oil and gas, roller-cone bits with conical- shaped teeth are now
widely used due to their favourable durability and cost compared to PDC bits, however
generally speaking the prospective rock formation to be drilled plays an important role
for bit durability. The state of the bit is assessed according to the status of the tooth and
the bearings holding the cones of the bit. Roller-cone bits are classified mainly into two
categories, milled tooth bit and insert bits. Milled tooth bits are made of steel, while for
insert bits, the body of the insert is manufactured from steel and the tooth from tungsten
carbide. As drilling progresses the bits become worn and hence drilling efficiency
reduces. The traditional technique for diagnosing the status of the bit wear is by
monitoring the Specific Energy (SE) simultaneously with rate of penetration (PR)
against depth. The specific energy approach is considered a reasonable indication of
drill bit status throughout its drilling life.
Waughman et al. (2002, 2003) studied the real-time specific energy (SE) and
recommended when to pull out the worn (PDC) bits by producing a plot of (SE) versus
depth and creating a normal baseline as a reference for monitoring the wear of the drill
bits. A significant increase in SE in non-balling conditions typically indicates bit wear
(Waughman et al., 2002, 2003). When drilling shale formations, additional

Chapter Three: Case Study
P a g e |
interpretation techniques must be used in conjunction with raw SE to avoid any
potential misinterpretation, e.g. well logs and geophysical information. Specific energy
was used by Dupriest and Koederitz (2005) as a trending tool for monitoring the bit
status.
In this work a combination of specific energy and bit dullness as an indication for real-
time monitoring of drill bit wear for selected wells in the southern Iraq were
investigated. In most of the studied wells, the specific energy gave an indication of the
bit wear, however there was no correlation between the qualitative bit tooth wear and
the calculated values of the specific energy at many depth intervals for various of
studied wells. This is attributed to some factors that were not taken into consideration
within the specific energy equations of Teale and Rabia: (i) the phenomena of the three
body abrasive wear of the rock cuttings formed during drilling causing the free motion
of these cuttings to roll and slide (ii) the type of the material forming the bit and (iii) the
hardness of the rock formation to be drilled. As stated by Waughman et al. (2002) most
of the drilling optimization or drilling performance models do not include the effect of
rock hardness along drill bit type drilling parameters and the mechanical properties of
the minerals that form the drill bit based on the concept of three body abrasive wear. .
This section of the thesis overcomes the deficiency of the previous trending tools for
monitoring the real-time bit tooth wear by combining the rock formation hardness, drill
bit type, drilling parameters such as a weight on bit, rotary speed etc. and the
mechanical properties of the materials that form the drill bit based on the concept of
three body abrasive wear.
3.2.2 Objectives
The bit wear obtained from the formula developed in this work is compared to the
qualitative in-situ bit tooth wear for various drilled formation intervals of a number of
wells in the south of Iraq. The new approach for bit wear determination, if successful,
could be used as a trending tool to evaluate the status of the drill bits or predicting the
wear of roller-cone bits. The study could potentially be extended and applied to other
types of drill bits such as Polycrystalline Diamond Compact (PDC) bits.

Chapter Three: Case Study
P a g e |
.2.3 Classification of the bit tooth wear
Depending on the type of the rock formation to be drilled, the drill bit is classified
according to the criteria of The International Association of Drilling Contractors
(IADC) that adopted a system for bit classification in 1972, which was later modified in
1987. In 1992 the system was updated to include many factors that reflect the latest
technology in drill bit manufacturing. The system defines that rock bit comparison
charts should be used for bit selection according to the rock which is being drilled and
the availability of the bits. Major bit manufacturers have contributed in producing this
chart. Furthermore, each bit type in the chart has its own IADC code classified
according to its usage for drilling soft, medium or hard rock formations, and also
according to the available features of each bit. For instance, soft rock formation such as
limestone has hardness considerably low, therefore this kind of rock is more susceptible
to be worn quickly and based on this criterion, the selection of the bit hence is milled-
tooth roller-cone bit that has long sharp tooth made form steel as the formation to be
drilled has low hardness. On the other hand, hard rock formation has relatively high
hardness such as sandstone or marble that high degree of severity and not worn easily.
In this case, Tungsten Carbide (TC) or called insert bits are the preferable choice as
these bits have short tooth similar to buttons or inserts made from material harder than
steel (tungsten carbide embedded in cobalt) . In general, the selection of the bit is based
on the severity of the rock. The chart is designed separately for roller cone bits and PDC
bits. Within the chart of roller cone bits, the first section represents milled tooth or steel
tooth bits, whereas the next following section refers to insert or Tungsten-Carbide (TC)
bits. Figure shows the IADC classification chart for roller-cone bits provided from
Reed Tool Company (McGehee et al., a).
The IADC classification of drill bits is used in the present study to determine the type of
drill bit i.e. milled tooth or Tungsten-carbide (TC) bits. Determination of the exact type
of drill bit is crucially important in order to specify the main materials that forms these
bits and, thus determines their hardness.

Chapter Three: Case Study
P a g e |
Figure . Classification of roller-cone bits according to IADC
(McGehee et al., a)
3.2.4 IADC dull bit grading
McGehee et al. ( b) developed the IADC ideal standard chart for dull bit grading as
shown in Figure . This system of grading has used various codes to distinguish the
qualitative wear of each part of the bit. The grading system is highly important for
monitoring the bit performance. The chart contains eight different factors related to drill
bits bit cutter description, gauge, and other information related to dull characteristics
and reason for pulling the bit. The first two columns refer to the condition of inner and

Chapter Three: Case Study
P a g e |
outer rows of tooth, respectively, where the amount of wear is indicated by a value
ranging from 0 (indicating intact tooth or no wear) up to 8 (referring to a completely
dull tooth). The third column describes the dull characteristics of the bit. IADC uses
various codes to indicate the wear condition of the tooth and bearing for roller cone bits,
and the cutter conditions for PDC bits.
Rashidi et al. (2008) illustrated the dulling degree of the roller-cone tooth and for the
inserts of PDC bits according to the IADC classification. The schematic image displays
that the wear of the tooth or the insert is represented as a fraction of 8, i.e.1/8, 2/8, etc.
For a new tooth or insert, the dulling degree is zero, while a completely damaged cutter
or tooth has a classification of 8/8 or 1 as shown in Figure
Figure . IADC grading system for drill bits (McGehee et al., b)
Figure . IADC grading system for drill bits (Rashidi et al.,
3.2.5 Theory
The mechanism of wear for various materials due to the activity of the solid particles
has been discussed by Hutchings (199 ), who classified the abrasive wear into two
modes: two-body abrasive wear and three body abrasive wear. Two body abrasion is

Chapter Three: Case Study
P a g e |
caused by hard particles that are rigidly fixed to one surface and remove material from
the opposing surface, while three-body abrasive wear is attributed to hard protuberances
that are trapped between two solid surfaces but are free to roll and slide. Figure .
demonstrates the distinction between the two modes of abrasive wear.
Figure . Differences between (a) two-body abrasion and (b) three-body abrasion
(Kopeliovich )
During contact between the drill bit and the rock formation, three body abrasive wear is
likely to occur due to the free motion of the cuttings produced after crushing the rock by
the drill bit. The present study applies the three-body abrasion wear model of
Rabinowicz (197 ), which is dependent on the hardness of the abrasive and the abraded
material. Rabinowicz (197 ) proposed Equation ( - ) and Equation (2- as
mentioned in chapter two of the present study for the determination of the volume of the
abraded and the abrasive materials, respectively.
In the present study the hardness of the rock is typically less than 10 GPa ,although in
some intervals consolidated sandstone are encountered that have hardness greater than
10 GPa (Al- Ameri et al., 2011). On the other hand, the hardness of the teeth of the
roller-cone bit is in the range of 12.95-15 GPa (Mouritz and Hutchings, 1991; Osipov et
al., 2010), therefore Equation ( - ) is applicable for approximating the volume of rock
removal where roller-cone bits are acting as an abrasive material when drilling into
these rock formations.
Since the abrasive material in Equation ( - ) is represented by the drill bit and the
abraded material is the rock. Equation ( - ) is modified as follows:
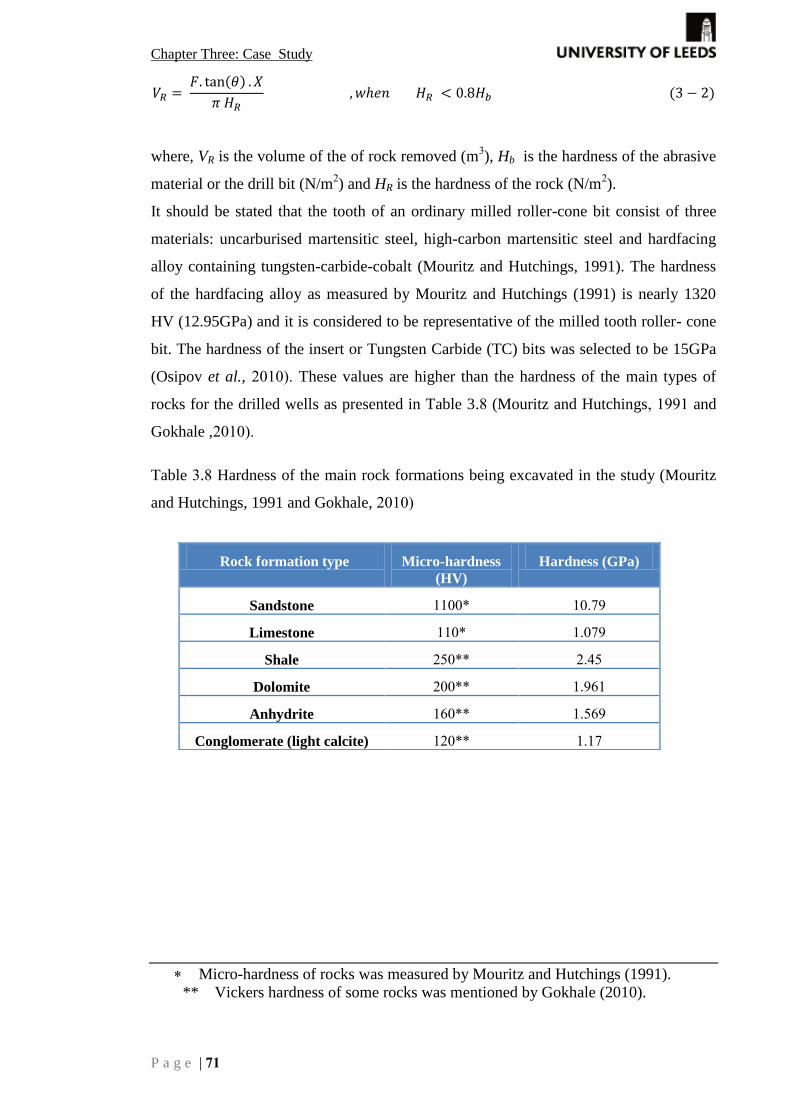
Chapter Three: Case Study
P a g e |
where, VR is the volume of the of rock removed (m ), Hb is the hardness of the abrasive
material or the drill bit (N/m ) and HR is the hardness of the rock (N/m
).
It should be stated that the tooth of an ordinary milled roller-cone bit consist of three
materials: uncarburised martensitic steel, high-carbon martensitic steel and hardfacing
alloy containing tungsten-carbide-cobalt (Mouritz and Hutchings, 1991). The hardness
of the hardfacing alloy as measured by Mouritz and Hutchings (1991) is nearly 1320
HV (12.95GPa) and it is considered to be representative of the milled tooth roller- cone
bit. The hardness of the insert or Tungsten Carbide (TC) bits was selected to be 15GPa
(Osipov et al., These values are higher than the hardness of the main types of
rocks for the drilled wells as presented in Table 3. (Mouritz and Hutchings and
Gokhale ,
Table . Hardness of the main rock formations being excavated in the study (Mouritz
and Hutchings, 1991 and Gokhale,
Micro-hardness of rocks was measured by Mouritz and Hutchings (1991).
** Vickers hardness of some rocks was mentioned by Gokhale (2010).
Rock formation type Micro-hardness
(HV)
Hardness (GPa)
Sandstone
Limestone
Shale
Dolomite
Anhydrite
Conglomerate (light calcite)

Chapter Three: Case Study
P a g e |
As the hardness of bit is generally more than that of rock formations, for evaluating the
wear of bit, Equation ( - ) could be used, where the rock is regarded as an abrasive
material, while the bit is the abraded material. However, the ratio of hardness of bit over
that of rock could exceed 1.25 when drilling into moderate and soft formation.
Rabinowicz (197 ) did not suggest a correlation for the case where Hw Ha, but
only stated that the wear is very small. Equation ( - ) can be modified for wear
quantification of bit wear volume as follows:
where Hb is the hardness of the bit (N/m ) and Vb is the volume of the material removed
from the bit (m ).
The sliding distance (X) in Equation ( - ) could be determined from the following
equation:
where Xr is the linear velocity of the bit given below and t is the time required to drill a
specific interval.
where N is the rotational speed , and db is the diameter of the bit.
As the inserts are connected with the cones therefore Equation ( - ) could be corrected
to the cone instead of the bit as follows:
Therefore, the sliding distance can be obtained from Equation ( - ) as follows:
The time required for drilling a certain depth interval drilling with a constant
penetration rate can be calculated in terms of penetration rate from the following
equation:

Chapter Three: Case Study
P a g e |
where L is the interval of depth being drilled and PR is the penetration rate as obtained
from bit records.
The applied load (F) in Equations ( - ) and ( - ) corresponds to the weight on bit (W).
Substitution of Equations ( - ) and ( - ) into Equation ( - ) yields:
Figure . Suggested model for abrasive wear (based on Rabinowicz,
Figure . shows the schematic sketch of the abrasive wear for the conical inserts
based on Rabinowicz model. Assuming a conical shape for the insert, therefore the
cross-sectional area of the worn insert is calculated as follows:
where Ab is the cross sectional area of the worn insert , ri is the radius of the insert cross
section (m).
The radius of the insert ri could be replaced by the worn height (hb) and the angle of
abrasion (θ) ,therefore, hb can be obtained as follows:
(
)
√
where Vb is the volume of the material removed from the bit (m ) and hb is the height of
the worn volume of insert (m).
The ratio of height of the worn insert hb to the initial tooth height of the insert is then
calculated (height of the milled-tooth is ˝ and the height of the insert is ˝
hb

Chapter Three: Case Study
P a g e |
according to Eason et al ). The predicted tooth wear as a 0-8 grade is then
obtained as follows:
The real-time predicted rate of bit tooth wear is obtained by dividing the predicted bit
tooth wear from Equation ( - ) over the depth interval. This will be compared to the
real-time qualitative bit tooth wear rate.
In Equation ( - ), the power index (2.5) is used when the ratio of the hardness of
abraded material (Hb) over that of rock (HR) is less than 1.25. However, when this ratio
is higher than 1.25 for softer rocks, it is expected that the power is greater than 2.5 (as
less wear is expected for the inserts). Therefore, in this study the power index in
Equation ( - ) is replaced by (n) as follows:
The weight on bit is distributed on all inserts (Nguyen, 2011). Figure 3.20 illustrates the
weight on bit is equal to the summation of the forces exerted from the teeth.
Figure . Force balance on the bit and the teeth (Nguyen, 2011)
The wear of the worn insert (Vi) has to be adjusted for single insert or tooth by dividing
the weight on bit in in Equation ( - ) over the number of the inserts engaged on the
bit. It is assumed that the number of the teeth for the milled-tooth bit in contact with the
rock is 50 and for Tungsten-Carbide (TC) bit is 65 (in general, this number could vary ,
but in general, the teeth count for milled-tooth bit is usually lower than the TC bit.

Chapter Three: Case Study
P a g e |
The abrasion angle (θ) in Equation (3-12) has to be expressed in terms of the attack
angle α The attack angle is defined as to be the angle between the cone axis and the
intersection of the insert centre line and the outside surface of the insert (Nguyen and
Ouan Van 1995). Figure 3.21a shows the attack angle with the corresponding cone,
while Figure 3.21b illustrates a schematic geometry of the insert in contact with rock.
Figure . Schematic sketch of the cone in contact with the surface of the rock (a)
insert in contact with rock (b)
The following mathematical relations are obtained from Figure 3.21b:
The attack angle (α is ranged between and Nguyen and Ouan Van, 1995) and
therefore, the abrasion angle (θ is ranged between and
a b

Chapter Three: Case Study
P a g e |
The geometry of the bit with its cones is shown in Figure 3.22. The projected view of
the bit and its parts is shown in Figure (3.22 b), while the radii of the bit and its cone is
shown in Figure (3.22 a), The relationship of the rotary speed of the bit and the cone has
to be determined in order to adjust the rotary speed and the diameter of the bit to those
of the corresponding cone that the inserts are connected with.
Figure . Schematic geometry of the bit (a) (Erno, 2014) and schematic sketch of the
legs of the cones (b)
From the geometry of Figure 3.22a, it is noted that:
where, N is the rotary speed (rpm) and V is the linear velocity (m/min). Using
engineering drawing scales (Fig.3.22), the following expressions are obtained for
geometrically similar bits used during drilling:
a b 2 times the radius
of bit leg
Leg of the bit
Max. radius of
the bit cone
Cone of the bit
Radius of the bit
Chapter Three: Case Study
P a g e |
The new relationship between the rotary speeds of cone and bit is substituted in
Equation (3-12) and the final formula of the volume of the material removed from the
insert is presented as follows:
(
)
where Vi is the volume of the material removed from the insert or tooth of the roller-
cone bit (m ) and α is the attac angle ranged from to To obtain a full rotation
of the teeth, the term tan (45-α could be integrated with respect to the attack angle α
therefore, Equation (3-19) could be written as follows:
∫
(
)
The integral in Equation (3-20) is replaced by [ ] The final value of
the integral is equal to 0.3465. The final equation of the volume of tooth wear is as
follows:
(
)
3.2.6 Results and discussion
Table . shows the rock formation and the corresponding hardness in GPa. The
commercial name of the drill bit according to IADC classification leads to the
determination of the exact type of the drill bit. The material forming the drill bit is
determined based on the type of the bit and the further data given by McGehee et al.
(1992). The roller-cone bit is either a milled-tooth or Tungsten-Carbide (TC) bit. The
hardness of the milled-tooth bit was chosen to be 1320 Vickers hardness (HV), or 12. 95
GPa, which represents the hardness of the external layer of the milled-tooth bit
according to Mouritz and Hutchings (1991). The hardness of the Tungsten –Carbide bit
is taken as 15 GPa (Osipov et al., 2010). Table . shows the manufacturer of the drill
bit, corresponding IADC bit code, and drill bit type along with the hardness for each bit

Chapter Three: Case Study
P a g e |
for well A in the South of Iraq. The data has been obtained for other wells studied in
this work using the same procedure.
Table . Drill bits used to excavate well A south of Iraq
Table . Drilling parameters of well A southern Iraq and the corresponding rock
hardness (Data are provided from bit records obtained from the section of Petroleum
Engineering of South Oil Company).
Depth
drilled (m)
Drill bit
manufacturer
Drill bit
commercial name
(code)
Drill bit type Bit hardness
(GPa)
- HUGHES SS5 Milled-tooth
- HUGHES R1 Milled-tooth
- HUGHES X3A Milled-tooth
- TSK MSS Milled-tooth
- SECURITY M44NF Milled-tooth
- SECURITY X3A Milled-tooth
- HUGHES JD4 Milled-tooth
- HUGHES J4 Milled-tooth
- SECURITY S84F (TC-bit)

Chapter Three: Case Study
P a g e |
From the available data for each well, the volume of the predicted worn insert (Vi) is
calculated from Equation (3-21). The height of the worn insert ( ) is obtained from
Equation (3- The predicted tooth wear index is determined from Equation (3- ).
The obtained values for the worn inserts are used to calculate the real-time predicted bit
tooth wear rate by dividing it over the incremental depth being drilled. This predicted
bit tooth wear rate is then compared with the real-time qualitative tooth wear rate
obtained from field data. The real-time qualitative bit dullness rate is obtained by
dividing the qualitative bit tooth wear ranging from 0 to 8 over the incremental depth.
Well A
After analysis of the data for well A , the real-time predicted tooth wear rate has been
obtained at various drilling intervals. It was found that the original proposed power
index by Rabinowicz was (2.5) in Equation ( - ) led to match values of the real-time
predicted tooth wear rate as shown in Figure . . However, higher values than 2.5 (3
and 3.5) for the power index in Equation ( - ) were also examined, but led to
underestimation for the prediction of wear rate. Lower power indices less than 2.5 (2.1-
2.4) for the power index in Equation ( - ) were also investigated, but the optimum
power index found to be 2.5 according to the calculated Mean Absolute Percentage
Error. It is worth mentioning that, when the power index reached 2.3, the predicted bit
tooth wear rate was very close to the predicted wear rate when the power index is 2.5.
Figure 3.23 illustrates the obtained results of the real-time predicted tooth wear rate
from various power indices corresponded to the bit drilled a certain interval.
Figure . Real-time predicted bit tooth wear rate from different power indices of the
modified Rabinowicz equation compared to the real-time qualitative bit wear rate for
well A in the south of Iraq
0.00 0.02 0.04 0.06
0
500
1000
1500
2000
2500
0 0.01 0.02 0.03 0.04 0.05 0.06
Real-time predicted bit tooth wear rate for well A1 ( wear index/m)
De
pth
(m
)
Real-time qualitative bit tooth wear rate (wear index/m)
Real-time qualitative bittooth wear rate
Real-time predicted toothwear rate (Power 2.5)
Real-time tooth wear rate(Power 3.0)
Real-time predicted toothwear rate (Power 3.5)

Chapter Three: Case Study
P a g e |
In Figure . 3 it can be seen that the predicted results become much close to the
observed ones when power index of .5 is used. It is worth mentioning although the
wear rate values from power indices of and 3. are underestimated at all depths, the
trend of the plots illustrate good agreement with the real-time measured bit tooth wear
rate. Nevertheless, the overall trends obtained from all power indices agree reasonably
well with the real-time qualitative tooth wear and exhibit improvement of the
predictions as compared to the approach based on the specific energy.
The same analyses were performed for data from all wells and accordingly, the
optimum power index form Rabinowicz equation was obtained.
Mean Absolute Percentage Error (MAPE) was used as a statistical indication for
selecting the optimum power index in Equation ( - ).The results of MAPE are shown
in Table 3.11. The statistical results suggest that the optimum power index applying in
Equation ( - ) for all wells is . as this provided lowest value of MAPE.
Table . Mean Absolute Percentage Error of the volume of wear using various power
indices values for wells A , B , B , A and B
It can be seen that for well A MAPE values are relatively high and this is further
investigated in the next section. The real-time predicted tooth wear rates based on power
index of .5 for other wells are plotted in Figures . to . and are compared to the
real-time recorded qualitative wear rate.
The results of the new wear model (power index 2.5) with the previous obtained
dimensionless bit tooth flatness (FD) from section 3.1.4 were compared to the recorded
bit tooth wear along depth for well A (Figure 3.24). It is shown from the figure that, the
predicted bit tooth wear from the new wear model is relatively better when compared to
the field recorded bit tooth wear. The values and trends of the new wear model were
Well (MAPE)
Power index (2.5)
(MAPE)
Power index (3.0)
(MAPE)
Power index (3.5)
A
B
B
A
B

Chapter Three: Case Study
P a g e |
close to the field wear, while for the dimensionless bit tooth flatness, the trend is
matching the trend of the recorded wear, but the values are so far.
Figure . Comparison between the predicted wear from the new model (power 2.5)
and the dimensionless bit tooth wear along with recorded field bit wear
Well B
Figure . illustrates the plot of the real-time predicted bit tooth wear rate (from power
index of .5) as compared with the real-time recorded tooth wear rate for well B at
various depths. It can be seen that the predicted wear rate reasonably agrees with
recorded tooth wear rate at all depths, despite slight divergence of the two curves
appearing from depth m to m..
Figure . Real-time predicted tooth wear rate obtained from power index
compared with the real-time recorded tooth wear rate for well B
-3 -2 -1 1 2 3 4
0
500
1000
1500
2000
2500
3000
0 2 4 6 8
Dimensionless bit tooth dullness (FD)
De
pth
(M
)
Qualitative and predicted bit tooth wear (0-8)
Recorded bit tooth wear
Predicted bit tooth wear(new model, power index2.5)
Dimensionless bit toothflatness (FD)
0.00 0.02 0.04 0.06 0.08 0.10
0
500
1000
1500
2000
2500
0 0.02 0.04 0.06 0.08 0.1
Real-time predicted bit tooth dullness rate for well B1 (wear index/m)
De
pth
(m
)
Real-time qualitative bit tooth dullness rate (wear index/m)
Real-time qualitative bittooth dullness rate
Real-time predicted toothdullness rate (Power 2.5)

Chapter Three: Case Study
P a g e |
Well B
Figure . shows that the predicted wear rate agrees reasonably with the recorded wear
rate, however extreme high values of the predicted wear rate were noted from a depth
2561m to 3009 m. This is attributed to the presence of shale formations at this range of
depth, as indicated in Figure . which causes the "bit balling" phenomena. Bit balling
causes sticky shale cuttings accumulate at the face of the bit leading to a reduction in
penetration rate (PR) for given conditions (weight on bit and rotational speed) and
therefore an overestimate of wear obtained from Equation ( - ).
Figure . Real-time predicted tooth wear rate obtained from power index .5
compared with the real-time recorded tooth wear rate for well B
The occurrence of shale formations could cause misinterpretation and therefore, the
analysis of the obtained data should be carefully carried out with such lithology. For
wells where shale formation is encountered, it is preferable to use other tools for wear
prediction with the presence of well logs to avoid any misleading results.
Wells A and B
For wells A and B , as can be seen from Figures . and . , the predicted tooth
wear rate is in agreement with the recorded tooth wear rate. However, for well A at
m, there is a significant difference between the predicted wear rate and the
recorded one as shown in Figure 3.2 . This significant difference is affecting the high
obtained value of MAPE as shown in Table 3.11. This is again presumably due to the
occurrence of shale which started at depth below 0 m. However, the great
divergence between the predicted and the recorded bit tooth wear is might be attributed
0 0.02 0.04 0.06 0.08
0
500
1000
1500
2000
2500
3000
3500
0 0.02 0.04 0.06 0.08
Real-time predicted bit tooth dullness rate for well B2 (wear index/m)
De
pth
(m
)
Real-time qualitative bit tooth dullness rate (wear index/m)
Real-time qualitative bittooth dullness rate
Real-time predicted toothdullness rate (Power 2.5)
Shale

Chapter Three: Case Study
P a g e |
to the unconformity (surface of erosion) at near depth of 2 0 m as shown in Figure .
The presence of such geological structures causes misleading interpretation.
Unconformity is represented with a curvy line at near depth 2 0 m as shown in Figure
The specific type of unconformity in this case is disconformity as it separates
parallel layers of limestone sedimentary rocks that illustrate erosion was taking part
during that period causing a break in the sedimentary geological record. This
disconformity affects the results of the predicted wear leading to misleading
interpretation. It is recommended to use other reliable techniques such as well logging
tools to avoid the misleading results.
Figure . Real-time predicted tooth wear rate compared with the real-time recorded
wear rate for well A
For well B , high value of the predicted wear was observed at the depth of 3264 m again
due to the existence of shale formation as shown in Figure 3.2 .
It is worth mentioning that for well B there was a sharp increase of the ratio (HR/Hb) in
Equation - ) from depth 3172 m to 3345 due to the occurrence of sandstone mixed
with shale formation that has high hardness. The hardness of the shale rock increased
from 2.4 GPa at depth 3172 m up to 6.5 GPa at depth 3264 m corresponding to
sandstone mixed with shale formation. In addition, it was noted that the penetration rate
for the same well suddenly dropped from 2.64 (m/hr) at depth 3172 m to 0.99 (m/hr) at
depth 3264 m which also contributed the sharp increase of the predicted wear rate.
0 0.025 0.05 0.075 0.1 0.125
0
500
1000
1500
2000
2500
0 0.025 0.05 0.075 0.1 0.125
Real -time predicted bit tooth dullness rate for well A2 (wear index/m)
De
pth
(m
)
Real-time qualitative bit tooth dullness rate (wear index/m)
Real-time qualitative bittooth dullness rate
Real-time predicted toothdullness rate (Power 2.5)
Unconformity
Shale

Chapter Three: Case Study
P a g e |
Figure . Real-time predicted tooth wear rate compared with the real-time recorded
wear rate for well B
3.2.7 Conclusions
In this chapter, the wear of the roller-cone bits was analysed by using a developed
equation based on the principle of three body abrasion, while incorporating, the
hardness of the rock formation and the materials forming the drill bit as well as other
drilling parameters such as penetration rate, weight on bit and rotational speed .
The new method was applied to five selected oil wells in the south of Iraq from two
main big oil fields in the south of Iraq, where only roller-cone bits were used, including
both milled-tooth and Tungsten-Carbide (TC) bit types .
The results obtained from the proposed model were compared with the recorded
qualitative bit tooth wear rate where a reasonable agreement at different drilling
intervals was obtained. Overall, the proposed model agreed well with the recorded bit
wear for all oil wells studied in this work, except for some minor anomalies at some
depth intervals and this could be related to the existence of shale as when drilling into
shale formations bit balling phenomena take part causing misleading interpretation.
Well logs should be used while drilling to verify the influence of shale on the obtained
results.
Misleading results occurred at certain depths and this could be attributed to a surface of
erosion or non-deposition (unconformity) between the parallel layers causing
misleading interpretations, therefore more reliable techniques are recommended to be
0 0.02 0.04 0.06 0.08 0.1 0.12
0
500
1000
1500
2000
2500
3000
3500
0 0.02 0.04 0.06 0.08 0.1 0.12
Real-time predicted bit tooth dullness rate for well B3 (wear index/m)
De
pth
(m
)
Real-time qualitative bit tooth dullness rate (wear index/m)
Real-time qualitative bittooth wear rate
Real-time predicted toothdullness rate (Power 2.5)
Shale

Chapter Three: Case Study
P a g e |
used when encountering such geological structures to prove the effects of such
formations on the obtained results.
This approach could be tested for other wells in other regions for vertical and could also
be tested for horizontal drilling to verify its reliability. The developed technique was
performed on roller-cone bits only, but could in principle be extended to Polycrystalline
Diamond Compact (PDC) bits.
It is worth pointing that based on the proposed model in this chapter, the wear could be
predicted based on the material properties of the bit as well as the rock and drilling
parameters. Therefore, properties of the bit, notably the hardness could significantly
affect the wear and it should be characterised and well understood. Therefore, in the
next chapter, attempts have been done to measure and characterise the properties of the
material that form the cutting elements of the bit, especially hardness and how it reflects
on the amount of wear. More reliable results would be obtained from the
aforementioned new developed wear model when precise hardness values are used for
both the materials forming the bit as well as the rock formation.

Chapter Four: Experimental Work (Indentation Testing)
P a g e |
Chapter 4 Experimental Work (Indentation Testing) This chapter is focused on measuring the mechanical properties of the materials form
the PDC cutters by nano and microindentation testing. The mechanical properties
include hardness, Young's modulus and fracture toughness. These properties are
crucially significant for wear quantification as the available wear models in the
literature depend mainly on the mechanical properties, therefore, precise determination
of the mechanical properties will reflect on the accuracy of the quantified wear. Sample
preparation needs to be done prior to the indentation testing to avoid misleading results
due to the high degree of the surface roughness of the samples. The samples
investigated throughout the tests are polycrystalline diamond cutters that used in oil
field PDC bits. PDC specimens are in form of disks with different dimensions. Figure
.1 illustrates an image of the two PDC cutters that have been used in the experiments.
Table 4.1 demonstrates the dimensions of the PDC cutters supplied from two different
manufacturers.
Table . Dimensions of the PDC specimens
Figure . Oil PDC cutters manufactured by two different manufacturers
The samples consist of two main parts, the first layer is the diamond table which is
clearly shown as black colour and its composition is mainly coarse diamond particles
with cobalt as a binder, while the second layer represents the tungsten carbide in cobalt
substrate. The first part of the experimental work is focused on the preparation of the
specimens using polishing technique to reduce the surface roughness, especially for the
Commercial Order Cutter Diameter
(mm)
Cutter Length
(mm)
Diamond Thickness
(mm)
M 13.44 (± 0.03) 8.0 (± 0.1) 2.2 (± 0.2)
M 13.44 (± 0.03) 13.2 (± 0.1) 2.2 (± 0.2)
K1608 16.00 (± 0.05) 8.0 (± 0.1) -
K1908 19.05 (± 0.05) 8.0 (± 0.1) -
K1608 K1908 M1313 M1308

Chapter Four: Experimental Work (Indentation Testing)
P a g e |
diamond surface. Once the samples are polished well, testing could take place. First
testing to be launched are micro and nano-indentation, where the mechanical properties
(hardness, Young's modulus and fracture toughness) of the two layers of the PDC
inserts are measured within these tests. The indentations tests will be followed by
analytical study using Scanning Electron Microscopy (SEM), Energy Dispersive X-ray
maps (EDX) along with the Energy Dispersive Spectroscopy (EDS) to examine the
element distribution on the surfaces of the substrate and diamond layers of the PDC
samples. Microstructural properties (particle size distribution and cobalt content) of the
materials forming the substrate and coating of the PDC sample are analysed to study
their effect on the mechanical properties which affect later the amount of wear of the
PDC samples.
4.1 Samples preparation
4.1.1 Surface roughness test (before polishing)
Surface roughness analysis has been performed on the specimens to evaluate the degree
of surface roughness for both layers (diamond and substrate). The most commonly
surface roughness parameters are the average surface roughness (Ra) as described in
ASME B46.1 and the surface skewness (Rsk). Average roughness (Ra) is defined as the
arithmetic average deviation of the surface valleys and peaks from profile mean line in
micrometres, and it is useful for detecting general variations in overall profile height,
while surface skewness (Rsk) represents the symmetry of the surface deviations from the
mean reference plane. Rq is another surface roughness parameter which is referred to the
root mean square of the surface peaks and valleys. Rq is calculated as between 1.11 and
1.25 times the (Ra) value. (Rq) is more sensitive to peaks and valleys, making it more
valuable parameter compared to Ra.
A surface with high value of (Ra), or a positive skewness (Rsk), will have high wear rate
(low wear resistance). The tests were carried out by using Ultra Precision Form Talysurf
PGI800 instrument at the Biomedical Engineering School of University of Leeds, with a
resolution of up to nm. The device uses a motorized column that gives high
accuracy and a tiny probe passes the surface of the specimen recording the surface
profile precisely within few minutes. The results will be presented as surface profile
measurement. Two tests were performed for each layer at various positions to measure
the main common surface roughness parameters; average surface roughness (Ra) and
skewness (Rsk), finally the roughness parameters (Ra) and (Rsk) were averaged. Surface

Chapter Four: Experimental Work (Indentation Testing)
P a g e |
profile measurement test was performed before polishing the samples and after to
observe the difference in the surface roughness parameters before and after polishing.
Figure 4.2 illustrates positions 1 and 2 on the surface of the cutter specimen M1313.
Figures 4.3 and 4.4 show the surface profile measurements across the surface of the
diamond layer of the PDC specimen at position 1 and 2 respectively before polishing
sample M1313, while Figures 4.5 and 4.6 illustrate the surface profile measurement for
the substrate layer of the PDC insert at position 1 and 2 respectively before polishing.
The average roughness for the diamond layer (Ra) was 1.423 µm and the skewness (Rsk)
was equal to -0.48545 before polishing and according to Table 4.2, the value of the
average roughness is corresponded nearly to the roughness grade number N7 as an
industrial classification for roughness (Bahushan 2001). A negative value for the surface
skewness means, that the surface has deep scratches or pits indicating the sample could
have a good wear resistance where just few hills are available that could wear away.
The average value of (Ra) for the tungsten carbide layer (substrate) was 0.8626 µm and
classified under grade number N6 according to Table 4.2. Surface skewness value at
position 1 is - .7103, while at position 2 is equal to 0.0968 and this indicates that the
surface at position 1 has downward spiky bias, and upward spiky peaks in position 2.
This could indicate that part of the substrate specifically at position 2 will be worn away
due to the spiky upward peaks, while in other parts as in position 1 deep valleys
occurred and could be considered as good bearing surfaces. The average value for the
surface skewness for sample M1313 was -
Figure . Selected positions 1 and 2 on the surface of the PDC sample
M1308

Chapter Four: Experimental Work (Indentation Testing)
P a g e |
Figure . Surface profile measurement of the diamond layer for the PDC insert at
position 1 before polishing
Figure . Surface profile measurement of the diamond surface for the PDC cutter at
position 2 before polishing
Ra =1.3862 µm , Rsk = -
Rq = 1.7422 µm , Rku =
Hei
ght
(µm
) H
eig
ht
(µm
)
Ra =1.4603 µm , Rsk = -
Rq = 1.8230 µm , Rku =

Chapter Four: Experimental Work (Indentation Testing)
P a g e |
Table . Roughness average with the corresponding grade number of roughness as
known in industry (Bhushan, 2001)
Figure . Surface profile measurement of the substrate layer for the PDC insert at
position 1 before polishing
Roughness Average parameter (Ra),
µm
Roughness grade number
N1
N2
N3
N4
N5
N6
N7
N8
N9
N10
N11
Hei
ght
(µm
)
Ra =0.8393 µm , Rsk = -
Rq = 1.0443 µm , Rku =

Chapter Four: Experimental Work (Indentation Testing)
P a g e |
Figure . Surface profile measurement of the tungsten-carbide layer for the PDC insert
at position 2 before polishing
The same test is carried out for all samples for both layers (substrate and diamond) in
order to measure the surface roughness of the layers forming the PDC cutters. The
results are compared later in Table 4.3. The skewness results showed that the values are
so close in different positions of the PDC layer, while it is varied for tungsten carbide
layer, where high skewness values available at some points referring to flat surfaces
with peaks, while low values found at other parts which it could be a surface having
pits. Furthermore, the results showed the need for the polishing operation to reduce the
degree of surface asperity especially on the diamond layer.
4.1.2 Polishing process
The aim of the polishing process is to prepare final polished samples to reduce the
surface roughness and makes the specimens ready for further tests and analysis. It is
important to obtain a flat surface and remove any sectioning deformation to avoid any
misleading results might be occurred.
According to the results of the surface roughness parameters for both surfaces of the
PDC samples, it is crucially important to polish the surfaces of both layers to reduce the
effect of surface asperities and consequently reducing the error with the measurements
of hardness, Young’s modulus and fracture toughness when using indentation tests.
Hei
ght
(µm
)
Ra =0.8859 µm , Rsk =
Rq = 1.1494 µm , Rku =

Chapter Four: Experimental Work (Indentation Testing)
P a g e |
Furthermore, well-polished surfaces will produce clear imprints that make it easier to
measure the diagonals of the obtained indents, especially within micro-indentation
testing. The polishing process of the samples in this study was following the ASM
international standards (ASM, 2002).
The polishing procedure starts with polishing both sides of the samples with abrasive
(silicon-carbide) paper which is widely used for ceramics. The used abrasive papers
have various grades from 240 up to 1200. The equipment used for this polishing
operation was "Metaserv 250 Grinder-Polisher", manufactured by BUEHLER. Two
different grade circular silicon carbide abrasive papers are mounted on the two platens
available for the device. Coarse abrasive papers (240) that have grit 52 micron size are
used firstly, and then gradually switch to the finest available abrasive paper (1200) that
has grit size of 8 microns. The platens are rotated at with moderate speed between 50 to
150 rpm. The sample is mounted manually to the rotated discs for 10 minutes at least.
Special care should be taken into consideration when lowering the sample towards the
platen. During each polishing process with abrasive papers, water is sprayed underneath
the abrasive papers (Figure 4.7). Water taps must be opened while the polishing process
is in progress to cool down the friction heat produced (lubrication) as well as to remove
any dust might be obtained during the polishing process. Later, each specimen is rubbed
with a clean cotton cloth soaked in soapy and warm water to remove the remained dust
produced when polishing. Finally, the samples are scrubbed manually with diamond
paste provided in a syringe using a clean cloth. The selection of the cloth is significant
to get optimum results as it depends mainly on the materials forming the sample. As our
samples are made of WC-Co (ceramic) and polycrystalline diamond, therefore, woven
cloth is useful for rough polishing of metals with alumina or diamond.
Figure 4.7 shows the Metaserv 250 Grinder-Polisher and Figure 4.8 illustrates the
diamond paste used for finishing the polishing process.
Figure . Metaserv 250 Grinder-Polisher on the left and the circular silicon carbide
polishing papers used with the polishing machine on the left.

Chapter Four: Experimental Work (Indentation Testing)
P a g e |
Figure . Diamond compound paste for finishing
4.1.3 Surface roughness test (after polishing)
Surface profile measurements were carried out for all samples of the PDC cutters after
polishing to observe the degree of the asperities on the samples surfaces. The same
surface roughness parameters that were measured previously are measured again after
polishing at two positions for the substrate and at one position for the diamond layer
,because the roughness parameters are varied slightly at different positions for the
diamond layer. Figure 4.9 illustrates the surface profile measurement for the diamond
layer of the M1313 sample at position 1, while Figure 4.10 demonstrates the same
measurement for the substrate layer of the same sample at position 1.
The roughness for the diamond layer (Ra) after polishing was 1.138 µm (1.423 µm
before polishing) and the skewness (Rsk) was - after polishing and these values
indicate that the surface roughness parameters were reduced after polishing. The
roughness (Ra) for the tungsten carbide layer after polishing was 0.3845 µm, while the
surface skweness value at position 1 was 0.0796. (Ra) of the substrate layer of sample
M1313 was 0.962 µm before polishing, while the same parameter (Ra) was equal to
µm. For the same sample, (Ra) of the diamond layer before polishing was 1.708
µm, but after polishing (Ra) was reduced to 1.3668 µm. The obtained surface roughness
parameters showed clearly the reduction of the degree of the surface roughness
parameters for both layers of all PDC samples and accordingly, the measurements of the
mechanical properties (section 4.2) of the diamond layer and the substrate could be
carried after polishing.

Chapter Four: Experimental Work (Indentation Testing)
P a g e |
Figure . Two Dimensional Surface profile measurement of the diamond layer for the
PDC cutter after polishing
Figure . Two Dimensional Talysurf graph of the substrate layer at position 1after
polishing
Ra =0.3845 µm , Rsk =
Rq = 0.4773 µm , Rku =
Hei
ght
(µm
)
Ra =1.138 µm , Rsk =-
Rq =1.4157 µm , Rku =
Hei
ght
(µm
)

Chapter Four: Experimental Work (Indentation Testing)
P a g e |
Table 4.3 illustrates the surface roughness parameters before and after polishing the two
layers of the PDC cutters of different types.
Table . Surface roughness parameters for various PDC inserts
The surface roughness affects the estimated mechanical properties obtained from Nano-
indentation tests. Bobji and Biswas (1998) stated that "It has been found that at low
indentation depths, the hardness is varied from the bulk hardness and the scattering in
the nano-indentation results is high. This difference in the obtained hardness at low
penetration depths mainly attributed to the surface roughness of the sample being tested.
Bobji and Biswas (1998) added that, the influence of surface roughness on nano-
indentation hardness is negligible if the penetration depths are higher than the surface
roughness.
Polishing is mainly needed to reduce the influence of surface roughness on the
estimated hardness from nano-indentation.
As the indenter is loaded near the surface that has asperities, the contact is first done
with a single asperity exists on the rough surface. When the increasing the load, this
asperity is deformed plastically and then the adjacent asperities come into contact.
During this process, the contact area established on the surface of the sample is varied
and accordingly, the hardness would be varied as well.
The surface roughness has crucial effect on the estimated results of nano-indentation
hardness as the contact between the indenter and the surface of the sample is not only
controlled by the material mechanical properties, but the topography of the sample is
significant. When the nano-probe is indenting the surface of the specimen, the
deformation (penetration) depth would be greater at low degree of surface roughness
PDC
Cutter
Layer Average
Surface
Roughness
(Ra), µm
(before
polishing)
Average
Surface
Roughness
(Ra), µm
(after
polishing)
Average Root
Mean Square
Surface
Roughness (Rq),
µm (before
polishing)
Average Root
Mean Square
Surface
Roughness
(Rq), µm (after
polishing)
Average
Surface
Skweness
(Rsk)
(before
polishing)
Average
Surface
Skweness
(Rsk)
(after
polishing)
M1313 Substrate -
M1313 Diamond 8.7.1 8.3..1 - -
K1908 Substrate 8.... ..5.0 -
K1908 Diamond 8.153 8..50 - -

Chapter Four: Experimental Work (Indentation Testing)
P a g e |
resulting lower hardness. On the contrary, if the indenter comes into contact with a high
degree of surface roughness, the contact area is underestimated and accordingly, the
estimated hardness would be overestimated (CSM, 2007). Therefore, it is significant to
determine the degree of the surface roughness of the samples of a surface before
launching with indentation testing. The surface roughness parameter (Ra) value should
be lower than 5% of the maximum indentation depth as stipulated in the International
Standard ISO 14577-4 (CSM,2007).
4.2 Indentation testing
4.2.1 Nano-indentation test
The apparatus used for this purpose is a NanoTest nano-indenter, provided by Micro
Materials Ltd. Wrexham UK available at the University of Leeds. The instrument is
highly sensitive towards temperature and sample vibration. The chamber of the
instrument has a thermostatically controlled heater, and the chamber is usually kept 2-3
degrees hotter than the room temperature. Figure 4.11 shows an image of the NanoTest
equipment.
Figure . NanoTest equipment by Micro Materials Ltd. UK
The experimental work will be focused firstly on measuring the nanoindentation
hardness and Young’s modulus of the samples as the main reason for that is, within
nanoindetation tests, there is no need for machine compliance correction as well as that
the hardness and Young’s modulus is calculated easily after plotting the force versus
penetration, while within microindentation tests, the hardness could not be determined
unless a clear image of the imprint is obtained using scanning electron microscopy
beside that Young’s modulus is affected by machine compliance and it has to corrected
for this influence.

Chapter Four: Experimental Work (Indentation Testing)
P a g e |
The NanoTest measures the movement of a diamond indenter in contact with the
surface of the sample. The type of the nano-indenter used in the nano-indentation test is
Berkovich that has three sided pyramid with a face angle of 65 º. In order to make a
measurement, an increasing load is applied and the probe indents the surface, as shown
schematically in Figure 4.12 below:
Figure . Schematic diagram of the indentation action (Beake et al.,
The elastic and plastic properties of the specimen determine the shape of the unloading
curve during the indentation process. Before starting the test it is crucially important to
calibrate the apparatus precisely otherwise the obtained readings will be imprecise.
Cleaning the samples from dust is necessary to avoid any misleading results. Choosing
the appropriate indentation conditions like minimum and maximum loads, loading rate,
number of indentations cycles, displacement between indentations points, thermal drift
effect and many other factors should be taken into account when performing any
nanoindentation test. In the present study, fixed and variable loads from 100 mN up to
500 mN for the substrate layer and range of loads from 50 mN up to 350 mN are
applied to obtain the load-displacement graphs of the two layers of the PDC samples to
monitor the effect of load increment on the obtained indentation depth that affects the
hardness and Young's modulus. Numbers of cycles were chosen to be three at each load
selection. Load rate was chosen to be 20 mN/sec. The displacement between
indentations points was selected to be 20 microns.
The main output results of the nano-indentation testing for this study are hardness and
reduced modulus. The software (Platform 3) which was used for running the nano-test
is functionalised to determine the applied load and the resulted penetration. The depth
resolution provided for the NanoTest is 0.001nm and maximum load up to 500 mN.
The hardness is then calculated from:
where Pmax. is defined as the maximum applied load (mN) , A is the projected
indentation area (nm ) and H is the hardness (mN/nm
) and then converted to GPa. The

Chapter Four: Experimental Work (Indentation Testing)
P a g e |
projected area is determined by the depth of impression (hp) and the known angle of the
indenter as shown in Equation (4-1a):
√
Reduced modulus (Er) is the modulus that incorporate the combined moduli of the
specimen (Es) and the indenter (Ei)) to account for the deformation of the probe.
The reduced modulus is related to the stiffness. The stiffness (S) is defined as the ability
of the material to resist elastic or non-permanent deformation. Stiffness is determined
from the slope of the unloading curve of the indentation plot. Reduced modulus is
determined from the following equation (Oliver and Pharr 1992):
√
√
where S is the stiffness of the material (mN/nm) and A is the indented area (nm ).
Young’s modulus of the sample (Es) is finally calculated from the following equation
(Oliver and Pharr 1992):
(
)
(
)
where Er is the reduced modulus (mn/nm ) and converted to GPa , E is the Young’s
modulus (mN/nm ) and converted to GPa, ν is the Poisson's ratio (dimensionless) , s is
referring to the sample and i is referring to the indenter. The Poisson's ratio of the
indenter is 0.07, whereas for the sample is 0.07 (diamond layer) and (tungsten-
carbide) (Chen, et al., ).Young’s modulus for the indenter is 1141 GPa.
Figure 4.13 represents a typical schematic relationship of load-displacement curve in
nano-indentation.
Figure . Schematic relationship of the relationship between the applied load and the
displacement (Oliver and Pharr, 1992)

Chapter Four: Experimental Work (Indentation Testing)
P a g e |
It is worth mentioning that, the determination of hardness and Young's modulus is
crucially important to quantify the wear of the samples being studied as most wear
models require these mechanical properties for wear quantification. In addition, fracture
toughness cannot be calculated within some models without the determination of
hardness and Young's modulus.
4.2.1.1 Nanoindentation of tungsten carbide – cobalt layer (WC-Co)
The nanoindentation test was carried out for M1308 and M1313 PDC specimens. Series
of nanoindentation tests were performed on WC-Co alloy with loads in range of 100mN
to 500 mN at different cycles were selected to observe the variation of hardness and
Young's modulus and when the mechanical properties would be stable as crack
(fracture) is initiated. As lower loads were also used, but underestimated values for the
mechanical properties were obtained due to the possibility of the effect of the surface
roughness. Other settings include fixed indentation loading and unloading speed at
4mN/sec. as the aim was to investigate the effect of the indentation load on the
measured mechanical properties. Examples of the nanoindentation graphs for the
performed tests are shown in Figures 4. -.15 and 4.16 where the figures showed
regular indentation hardness at 350 mN.
During the nano-indentation test, the elastic-plastic behaviour of the samples and the
two main mechanical proprieties of the specimens, i.e. hardness and Young's modulus
are analysed. It worth mentioning that the mechanical properties obtained from nano-
indentation testing are corrected for the effect of machine compliance, where calibration
of the device for machine compliance is performed regularly. Both measured properties
will be used later in this chapter to quantify the nano-wear.
Figure . Applied force against displacement for tungsten carbide-cobalt
(typical graph of test one)
0
100
200
300
400
0 200 400 600 800 1000 1200
Forc
e (m
N)
Depth (nm)

Chapter Four: Experimental Work (Indentation Testing)
P a g e |
Figure . Load versus penetration curve for tungsten carbide-cobalt
(typical graph of test two)
The obtained hardness and Young’s modulus for three tests are presented in Table 4.
It can be seen that the hardness and Young’s modulus are fluctuating. The variation of
the results might be attributed to the surface roughness.
Figure . Force- displacement curve for tungsten carbide-cobalt
(typical graph of test three)
It is clearly shown from Figures (4.14)- (4.16) that the plastic (indentation) depth of the
nano-indentation curves is not exceeding 850 nm and according to the International
Standard ISO 14577- , the surface roughness parameter (Ra) value should be lower than
5% of the maximum indentation depth. Hence, (Ra) should be less than 42.5 nm, but the
results obtained from Table (4.3) showed that (Ra) is between (0.385-0.482) µm,
therefore, the polishing process did not achieve the International Standard stipulated by
ISO 14577- . This might be the reason why the results of the nano-indentation hardness
and Young’s modulus are varied
0
100
200
300
400
0 200 400 600 800 1000 1200
Forc
e (m
N)
Depth (nm)
0
100
200
300
400
0 200 400 600 800 1000 1200
Forc
e (m
N)
Depth (nm)

Chapter Four: Experimental Work (Indentation Testing)
P a g e |
Table . Measured nanoindentation hardness and Young’s modulus for tungsten
carbide-cobalt (substrate layer) of the PDC cutters
Figure 4.17 and 4.18 shows the results of hardness and Young's modulus as a function
of applied load for the WC-Co layer. WC composite represents the hard phase of the
WC-Co and the hardness of the WC itself is much higher than the binder phase of the
alloy (cobalt). The reported values of hardness for the binderless WC ranged from 23 to
29 GPa and the reported values of Young’s modulus ranged from 705 to 795 GPa
(Ndlovu 2009), whereas the reported hardness values of the binder (Cobalt) were
between 2.7 and 4.8 GPa and the reported values of Young’s modulus were from 117 to
155 GPa (Ndlovu 2009). This could be a reason why hardness values are significantly
lower for some applied loads than the others as the indenter may have penetrated to the
binder phase (Co) of the composite material of WC-Co. This hypothesis should be
further investigated by the Scanning Electron Microscopy (SEM)
Test number Nanoindentation
hardness (GPa)
Young’s
modulus (GPa)
1 (100-350mN)
2 (350mN)
3 (100-500mN)
Average 16.69 ± 6.59 487.96 ± 161.18

Chapter Four: Experimental Work (Indentation Testing)
P a g e |
Figure . Obtained nanoindentation hardness versus applied loads for the tungsten
carbide-cobalt layer along with the reported literature values
Figure . Young’s modulus results against applied force for the tungsten carbide-
cobalt substrate within the reported previous values
In the work of Ndlovu et al.( ), the hardness of tungsten carbide-cobalt reported by
values within the range (12.7 – 25.5) GPa and (476-623) GPa for the Young’s modulus
depending on the WC grain size and the percentage of the cobalt binder which ranged
-15%. The obtained experimental results have shown similar results with those of
WC with 6% cobalt as a binder. The measured Young’s modulus values were plotted
versus the obtained nanoindentation hardness in Figure 4.19. The plot illustrates that
Young’s modulus values are proportional to the hardness and that agrees with the
previous study of Vaprek and Argon (2001) where for a large number of diverse super
hard nanocomposites a linear increase of the Young’s modulus with noindentation
hardness was reported.
0
5
10
15
20
25
30
35
0 100 200 300 400 500 600
Har
dn
ess
(G
Pas
.)
Load (mN)
Possible tungsten carbide - cobalt zone
Possible tungsten carbide
Zone
Possible cobalt zone
Standard deviation
= ±
0
100
200
300
400
500
600
700
800
900
0 100 200 300 400 500 600
Yo
un
g's
mo
du
lus
(GP
a)
Load (mN)
Possible tungsten carbide zone
Possible cobalt zone
Possible tungsten
carbide - cobalt zone
Standard deviation
= ±

Chapter Four: Experimental Work (Indentation Testing)
P a g e |
Figure . Measured Young’s modulus vs. hardness for the substrate
4.1.1.2 Nanoindentation of diamond table layer
In general, the top part of the oil PDC cutters represents the diamond layer in form of
polycrystalline compact diamond (PDC) with cobalt as a binder, while the lowest layer
consists of tungsten carbide - cobalt. Scanning electron micrograph is done for the top
layer of the specimens to get a better understanding of the topography of this layer.
SEM figures are shown in the next section. As the surface structure of the PDC top
layer is dominant by diamond crystals, the main challenge is to indent this layer with a
diamond probe without breaking it. Although, the natural diamond which represents the
tip of the indenter is harder than the artificial diamond, many researches mentioned their
failure to measure the hardness due to the breakage of the indenter and especially the
Berkovich type (Sumiya et al., 1997 and Sumiya and Irifune 2004). Berkovich probe
was used recently in nanoindetation of nanocrystalline diamond, but with strict
limitations of very low load i.e. 3 mN with thermal drift corrections (Couvy et al.,
The nano-indentation testing carried out in this study followed The International
Organisation for Standardisation ISO- (2015) and ASTM E2546 which
can be applied on nano and micro instrumented indentation testing. The nano-
indentation test is controlled by load. A series of nanoindentation tests were performed
using fixed loading and unloading rate of 4mN/sec. with indentation loads varied in the
range of 50 mN to mN as low loads were also performed, but failed to obtain
reliable results. After the tests the indenter was checked for possible damage by carrying
out tests against a reference sample. Figures (4. – .23) represent the typical load-
displacement curves for the PDC-Co. layer. The nanoindentation graphs of the diamond
layer illustrate a high degree of elastic recovery or elastic relaxation which means that
R² = 0.7255
0
100
200
300
400
500
600
700
800
900
0 5 10 15 20 25 30 35
Yo
un
g's
mo
du
lus
(GP
a)
Nanoindentation hardness (GPa)

Chapter Four: Experimental Work (Indentation Testing)
P a g e |
the ratio of the Young’s modulus to the hardness is low due to indenting diamond
particles (Sumiya and Irifune 2004).
Figure . Load versus the indentation depth for the PDC-Co layer in test 1 at fixed
load of 50 mN
Figure . Displacement – load graph of the diamond layer in test 2
at fixed load of 100 mN
Figure . Typical graph of test 3 for the diamond table in PDC samples
at loads 100-200 mN
0
10
20
30
40
50
60
0 50 100 150 200 250 300
Load
(m
N)
Depth (nm)
0
20
40
60
80
100
120
0 100 200 300 400 500 600
Load
(m
N)
Depth (nm)
0
20
40
60
80
100
120
140
160
0 100 200 300 400 500
Ap
pli
ed l
oad
(m
N)
Depth (nm)

Chapter Four: Experimental Work (Indentation Testing)
P a g e |
Figure . Load – penetration curve for the diamond layer
at loads 100-350 mN in test 4
The obtained values of hardness and Young’s modulus for four tests were tabulated in
Table 4.
Table . Final results of the nanoindentation tests of the PDC-Co layer of the samples
Test number Nanoindentation hardness
(GPa)
Young’s modulus
(GPa)
1 (50mN)
2 (100mN)
3 (100-200mN)
4 (100-350mN)
Average 49.36 ± 23.80 807.53 ± 181.98
0
20
40
60
80
100
120
0 100 200 300 400 500
Ap
pli
ed l
oad
(m
N)
Depth (nm)

Chapter Four: Experimental Work (Indentation Testing)
P a g e |
From Figures (4.20)- (4.23), the penetration depth of the nano-indentation curves is not
more than 320 nm, while the value of the surface roughness parameter (Ra) for the
diamond layer from Table (4.3) is between 1.423 and 1.6144 µm. According to ISO
- , (Ra) should be less than 16 nm, which means that the required condition of
ISO for polishing is not satisfied in the current case. Therefore, the variation of the
obtained results from nano-indentation might be attributed to the high degree of surface
roughness.
Figures 4. and 4. show the nanoindentation results as a function of applied load for
the PDC layer of the samples.
The previous reported upper limit and lower limit values of the hardness for natural
diamond are represented by the two blue lines in Figures 4.24 and 4.25, while the red
lines refer to the limiting hardness values of polycrystalline diamond compact with
binder (cobalt) and the green lines refer to the reported hardness limit values for the
binder (cobalt). It seems from Figures 4.24 and 4.25 that all of the obtained results lie
above the reported cobalt limits which might indicate that all of the indented points
were not pure binder phase (cobalt).
Figure . Indentation hardness for various zones in PDC layer within the reported
previous values obtained from Dubrovinskaia 2006 , Ndlovu 2009 and Osipov 2010
0
20
40
60
80
100
120
0 50 100 150 200 250 300 350 400
Har
dn
ess
(G
Pas
.)
Applied load (mN)
Possible diamond region
Possible diamond plus cobalt region
Possible cobalt region
Standard deviation
= ±

Chapter Four: Experimental Work (Indentation Testing)
P a g e |
Figure . Young’s modulus for different zones in PDC layer within the reported
previous values obtained from Osipov 2010 and Ndlovu 2009
The previous reported value of the hardness and Young’s modulus of polycrystalline
diamond compact was within the range 50-60 GPa and 776-925 GPa, respectively,
depending on the diamond grain size and the percentage of the cobalt binder which
varied from 5% to 20% (Dubrovinskaia 2006), (Osipov 2010) and Ndlovu (2009).
Young’s modulus values were plotted versus the hardness (Figure 4. and their
relationship agrees with the previous study of Vaprek and Argon (2001).
Figure . Measured Young’s modulus vs. hardness for the PDC layer
After achieving the nanoindentation tests of the diamond layer, it is crucially important
to verify the status of the Berkovich probe. In order to assess the status of the indenter,
nanoindentation checking test was carried out using ceramic sample before and after the
indentation process of the diamond layer. Table 4.6 illustrates the results before and
R² = 0.9357
0
200
400
600
800
1000
1200
1400
0 20 40 60 80 100 120
Me
asu
red
yo
un
g's
mo
du
lus
(GP
a)
Measured hardness (GPa)
0
200
400
600
800
1000
1200
0 50 100 150 200 250 300 350 400
Yo
un
g's
mo
du
lus
(GP
a)
Applied load (mN)
Possible diamond plus cobalt region
Possible cobalt region
Possible diamond region
Standard deviation
= ±

Chapter Four: Experimental Work (Indentation Testing)
P a g e |
after diamond layer indentation. It was observed that the hardness and Young’s modulus
of ceramic before and after is nearly the same and this indicates that the tip of the
indenter is intact and not deformed.
Table . Results of the nano-indentation of ceramic before and after testing PDC-Co
layer for the purpose of checking the status of the indenter
4.2.2 Analytical study of the samples after nano-indentation test
The purpose of performing the microscopic study is to examine the imprints obtained
from the nano-indentation test.
It is crucially essential to understand the detected types of signals by the samples and
how these signals could be employed to investigate the structure of various materials,
topology morphology and the composition. Krumeich (2011) described various types of
spectroscopies and imagining techniques which are considered nowadays indispensable
methods for sample characterisation. Krumeich (2011) classified the electron
microscopy methods depending on the various kinds of electron scattering. Figure 4.27
shows different types of detectable signals:
Figure . Modes of signals interaction in a sample (Krumeich, 2011)
Test number Nanoindentation hardness
(GPa)
Young’s modulus
(GPa)
Before nano-indentation
of PDC layer
After nano-indentation
of PDC layer
Average 21.41 ± 0.42 288.86 ± 7.42
Coefficient of variation
(%)

Chapter Four: Experimental Work (Indentation Testing)
P a g e |
Scanning electron micrograph (SEM): SEM scans the specimen with a high
energy beam of electrons that interact with the surface of the sample generating
signals consisting of information about the topography of the specimen's surface
and composition. SEM has more than one kind of detectors that are capable for
detecting various signals like secondary electrons (SE), backscattered electrons
(BSE) and energy dispersive X-ray spectroscopy (EDS or also called EDX).
Back Scattered Electrons (BSE): result from elastic interactions between the
incident electrons and the target specimen and the electrons interact deeper
compared to SEM enables the determination of the microstructure.
Energy Dispersive X-ray (EDX): In this technique the electrons interact deeper
than the SEM and BSE to the target sample providing maps of the element
distribution.
SEM was used to take images for both the diamond layer (top layer) and the
tungsten – carbide layer (substrate) to give a better understanding of the mineral
distribution of the composite material that forms the PDC cutters. Figure 4.28
illustrates the diamond – substrate interface for the specimen using Secondary
Electron Image (SEI).
Figure . Interface section of diamond table and tungsten carbide substrate
Figure . SEM micrograph (a) backscattered image (b) for the tungsten carbide-cobalt
layer (substrate) of the PDC samples
Tungsten-carbide layer
Diamond layer
Cobalt binder
Tungsten-carbide grains
a b

Chapter Four: Experimental Work (Indentation Testing)
P a g e |
Figure 4.29 shows a secondary electron image for the tungsten-carbide layer and a
backscattered micrograph of the same layer. The BSE image illustrates clearly the
tungsten-carbide grains and their size ranged from few nanometres up to µm
embedded into the binder (cobalt). Figure 4.30 shows the SEM and BSE images of the
diamond table. The arrows point to the diamond grains (black region) and to the cobalt
binder (grey region). The BSE image displayed the diamond grains which their size
ranged from to microns. Both snapped images of the diamond layer showed high
degree of roughness and further SEM technique is needed to display the chemical
composition of these layers.
The previous images did not display clearly the main composition of the coating layer
(diamond-cobalt) and the substrate (tungsten-carbide-cobalt) of the PDC specimens due
to the high surface roughness. BSE was later used to get a better image using the Energy
Dispersive X-ray and Spectroscopy (EDX and EDS). Figure 4.31 shows BSE images of
the diamond layer where three spectrum points (3, 4 and 7) were selected on the image
to examine the composition to identify the hard phase and the binder phase of the PDC
layer.
Figure . SEM image (a) and BSE image (b) for the diamond layer of the PDC cutter
A coloured X-ray map of the same BSE image was produced by EDX as shown in
Figure 4.31. The map shows the distribution of diamond grains or carbon (C) and cobalt
(Co) with small quantities of other minerals (impurities) such as Iron (Fe) and other
minerals. The selected spectrum points were analysed for the composition, Figures 4.
.33 and 4.34 demonstrate the EDS spectra at points 3, 4 and 7 respectively along with
the percentage of each element at the selected spots.
Diamond grains
Cobalt binder
a b

Chapter Four: Experimental Work (Indentation Testing)
P a g e |
Figure . Backscaterred micrographs and a coloured X-ray map of the PDC layer
displaying three spectrum points
Figure . EDS spectroscopy at point 3 on the diamond layer of the PDC cutter
Element Wt%
C
Co
Total:
C Ca O Fe Co

Chapter Four: Experimental Work (Indentation Testing)
P a g e |
Figure . Spectrum at point 4 on the diamond layer of the PDC insert
Element Wt%
C
O
Mg
Al
Si
S
Cl
K
Ca
Cr
Mn
Fe
Co
Cu
Zn
W
Total:

Chapter Four: Experimental Work (Indentation Testing)
P a g e |
Figure . EDS spectroscopy at point 7 on the diamond layer of the PDC specimen
Spectrum 3 illustrates that the main dominant element is carbon (C), with a very small
quantity of cobalt (Co). Spectrum 4 demonstrates the diverse composite elements beside
the dominant phase (diamond) and the binder phase (cobalt), while spectrum 7 shows
the dominant element is cobalt (Co).
From the aforementioned indentation curves it can be inferred that the size of
indentation impression is sub-micron, however, as it can be seen from the SEM images,
the scale of cobalt rich and diamond rich patches within the sample is larger than
indentation impression. Therefore, it is possible that an indentation is completely
embedded in the cobalt or diamond patches; hence the obtained properties could
indicate the properties of aforementioned materials.
The same scanning work has been done for the tungsten carbide layer to display the
composition of that layer. Figure 4.35 represents the backscattered electron images of
three chosen points in different positions and the X-ray map of the tungsten- carbide
layer (substrate). As expected, the dominant composition is (tungsten carbide) as an
alloy, while the cementing material in the substrate is cobalt acting as a binder phase.
Other minerals also exists, but with minor amounts. Further X-ray coloured maps and
Element Wt%
C
O
Fe
Co
Total:

Chapter Four: Experimental Work (Indentation Testing)
P a g e |
EDS spectra for the element distribution along the interface of the PDC cutters are
shown in Figures B.6 -B.9 in Appendix -B.
Figure . Backscattered electron images showing selected spectrum spots with X-ray
map of the tungsten carbide layer
EDX spectroscopy reveals the element distribution and their percentage composition of
each element that form the substrate of the PDC insert at three selected points 33 , 35
and 36 as shown in Figures 4. .37 and 4.38 respectively.

Chapter Four: Experimental Work (Indentation Testing)
P a g e |
Figure . EDS spectroscopy at point 33 on the substrate layer of the PDC specimen
The EDX spectroscopy graphs clarify that tungsten- carbide (WC) is the dominant
phase material in the substrate layer, shown by the orange colour area, while cobalt as
the binder phase represented by the turquoise colour showing the second highest
percentage after WC. Other elements are minorities such as iron (Fe), copper (Cu), etc.
Element Wt%
C
O
Cl
K
Fe
Co
W
Total:

Chapter Four: Experimental Work (Indentation Testing)
P a g e |
Figure . Spectroscopy graph and mineral composition at points 35 of the tungsten
carbide layer
Figure . EDS spectrum at point 36 of the substrate layer of the PDC cutter
Element Wt%
C
O
Na
Cl
K
Co
Mo
W
Total:
Element Wt%
C
Co
W
Total:

Chapter Four: Experimental Work (Indentation Testing)
P a g e |
Nanoindentation probe could penetrate into the hard phase (WC or diamond) or into the
binder phase (Co) and this might cause misleading interpretation of the obtained
nanoindentation results. The nanoindentation tests showed a large variance in the
results, because the probe could be indenting within a very small area which could be
diamond or cobalt areas Microindentation testing will produce much larger indentation
impression and could be used to check the nanoindentation results, as microindentation
tests produce bulk imprints relatively larger than those in the nanoindentation and
presumably reducing the high variance in the results. In addition, no cracks were
observed from the nanoindentation tests, therefore, higher loads maybe needed and
microindentaion could provide that.
Micro-indentation test
Microindentation was used to address the previous constraints in the nanoindentation
tests for quantifying the mechanical properties of the materials forming the layers of the
PDC samples. The micro-indentation testing performed in this study using Vickers and
Knoop probes followed the standards and E2546 stipulated by ISO
and ASTM respectively.
The tests in this study are controlled by force to obtain the mechanical properties which
can be calculated from a standard indentation load-depth curve.
4.2.3.1 Vickers micro-indentation
All Vickers indenters for hardness testers use a 136° square base pyramidal
diamond indenter. The test is carried out by applying various indentation loads on the
sample. The load is kept for a dwell time ranging from 10 to 15 seconds and then the
indenter is unloaded. A square shape imprint is left in the sample’s surface The
diagonal of the indent is determined using scanning electron microscopy (SEM). The
average value for the two diagonal indents is used in the calculation of the hardness
according to the following equation (Guder et al.,
where HV is the Vickers hardness number, F is the applied force (N) and da is the
average length of the indent diagonals (mm). Vickers number needs to be converted to
GPa units by multiplying HV by 0.009807.
An Instron 5566 mechanical testing machine is used for the microindentation
experiments as shown in Figure 4. Vickers hardness values determined from Instron

Chapter Four: Experimental Work (Indentation Testing)
P a g e |
are continuous over the total range of hardness for metals (HV100 up to HV1000) with
the exception of test forces below 200g. Depth resolution for Instron is less than 10 nm
and load resolution is 0.1 mN.
.
Figure . Instron 5566 equipment (a) and Vickers indenter (b)
The specimens tested by the Instron were polished using the procedure described in
section 4.1.2 in order to obtain clear imprints that are examined later using scanning
electron microscopy. Figure 4.40 illustrates the PDC samples mounted on a threaded
stainless steel base, where the cutters are marked to determine the area of the surface to
be indented. A series of microindentation tests were carried out to determine the
mechanical properties of the materials forming the PDC samples.
Figure . PDC samples mounted on a threaded base and marked
microindentation test
b
a

Chapter Four: Experimental Work (Indentation Testing)
P a g e |
4.2.3.1.1 Vickers microindentation of the substrate layer
Microindentation tests were performed on the substrate layer of the PDC inserts to
determine the hardness, the Young’s modulus and the fracture toughness of the material
forming the substrate layer. Loads applied were ranged from 10 to 300 N, where lower
loads were also applied, but unclear imprints were obtained. Loads higher than 300 N
were not used as loads between 100 and 200 N produced cracks at the edges of the
imprint.Figure 4.41 shows the imprints left after carrying out micro-indentation tests on
the substrate layer of the K1908 PDC sample at 50 N indentation load.
Figure . BSE image shows Vickers imprints on the substrate layer
of the K1908 sample when applying 50 N
Figure 4.42 demonstrates the indent left after applying 100 N on the substrate layer of
the M1313 sample. Digital Micrograph software 3.7 is used for analysing the SEM and
BSE images for determining the length of the diagonals of the imprints obtained after
the micro-indentation test.
Figure . Indents left after applying 100 N on the substrate surface for the sample
M1313
Imprint of Vickers

Chapter Four: Experimental Work (Indentation Testing)
P a g e |
The micro-indentation test was performed for all samples at various loads. The length of
the obtained diagonals for each sample after the test is averaged. The hardness of the
specimens is obtained from applying Equation (4-1). Table 4. and 4.8 display the
micro-indentation results for the substrate layer of the sample M1313 and K1908,
respectively. Low applied loads on sample M1313 were carried out, but the imprints
were not clear.
Table . Mechanical properties along with the diagonal indents length for tungsten-
carbide layer resulted from Vickers indentation for the sample M1313
Table . Mechanical properties for the substrate layer of the sample K1908 using
Vickers probe
The Young’s modulus of the PDC samples is not determined directly from the plot of
the applied load with the extension of the specimen as carried out for nano-indentation
testing , where the effect of the machine compliance took place and therefore, this effect
should be removed from the calculation of the Young’s modulus for microindentation
testing . This could be performed by a series of microindentation testing for the sample
with Vickers indenter and other testing of applying load by a bar (i.e. not with an
Load
(N)
Length of
first
diagonal
indent (µm)
Length of
Second
diagonal
indent (µm)
Average
diagonal
length
(µm)
Vickers
hardness
(HV)
Vickers
hardness
(GPa)
Young’s
modulus
(GPa)
Load
(N)
Length of
first
diagonal
indent (µm)
Length of
Second
diagonal
indent (µm)
Average
diagonal
length
(µm)
Vickers
hardness
(HV)
Vickers
hardness
(GPa)
Young’s
modulus
(GPa)
.

Chapter Four: Experimental Work (Indentation Testing)
P a g e |
indenter) on the anvil and plotting the graphs of the applied load vs. the extension of the
two tests .The total stiffness of the sample and the machine is obtained from the first
plot, while the stiffness of the machine is obtained from the second graph. The stiffness
represents the slope of the unloading curve of the plot (Oliver and Pharr 1992).
In order to obtain the net stiffness of the sample Hoo ’s law is applied for this purpose
The net stiffness of the specimen is calculated from the following equation:
where Snet is the net stiffness of the sample, Stotal is the stiffness of the sample plus the
stiffness of the machine and Sm is the stiffness of the machine without the sample. The
derivation of Equation (4-5) is shown in Appendix A.B.
Figure 4.43 shows the plot of the loading and unloading of the applied load versus the
extension for the substrate layer of the sample M1313.
Figure . Micro-indentation of tungsten-carbide and machine compliance for 100 N
applied load for sample M1313
Once the stiffness of the sample is determined, the reduced modulus of the sample is
obtained from Equation (4-2) and finally the Young’s modulus is determined from
Equation (4- Young’s modulus of the tungsten-carbide-cobalt layer for the sample
M1313 is tabulated in Table 4.
4.2.3.1.2 Vickers microindentation of the diamond layer
A series of microindentations with various applied loads (30-300) N were carried out on
the diamond layer of the PDC samples to determine its mechanical properties. As
0
20
40
60
80
100
120
0 0.005 0.01 0.015 0.02
Ap
plie
d lo
ad(N
)
Extension (mm)
Microindentation of Tungsten carbide Machine compliance
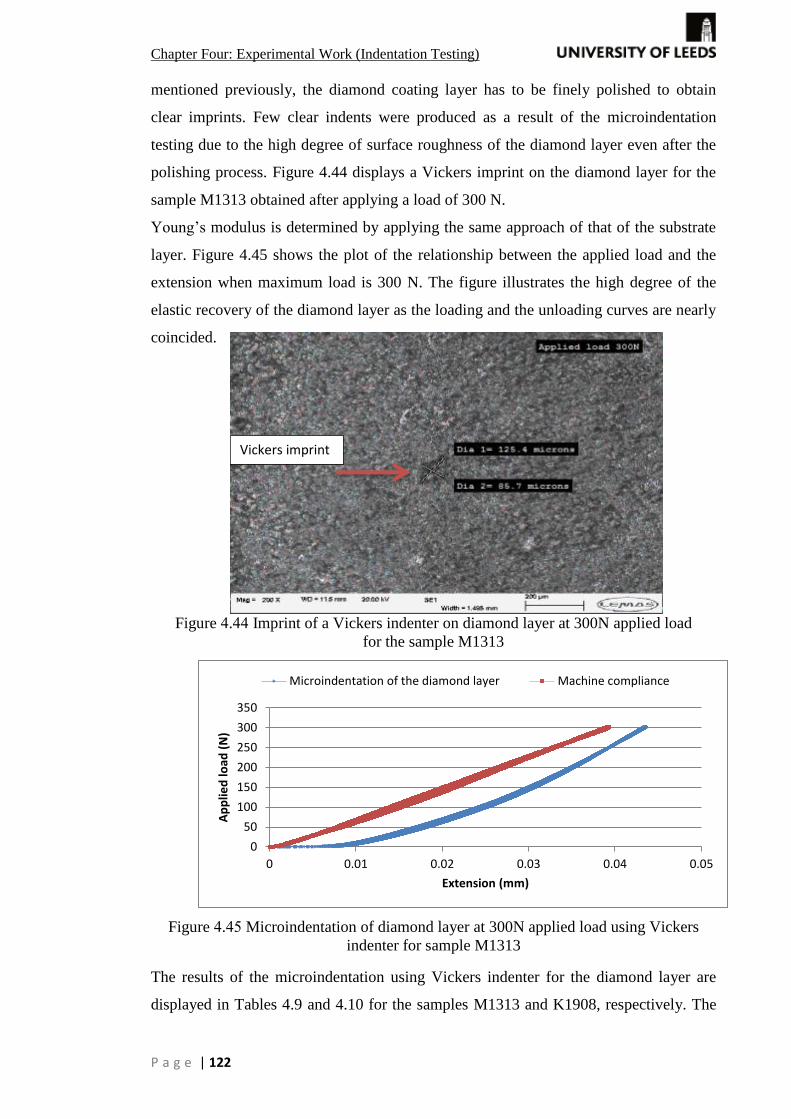
Chapter Four: Experimental Work (Indentation Testing)
P a g e |
mentioned previously, the diamond coating layer has to be finely polished to obtain
clear imprints. Few clear indents were produced as a result of the microindentation
testing due to the high degree of surface roughness of the diamond layer even after the
polishing process. Figure 4.44 displays a Vickers imprint on the diamond layer for the
sample M1313 obtained after applying a load of 300 N.
Young’s modulus is determined by applying the same approach of that of the substrate
layer. Figure 4.45 shows the plot of the relationship between the applied load and the
extension when maximum load is 300 N. The figure illustrates the high degree of the
elastic recovery of the diamond layer as the loading and the unloading curves are nearly
coincided.
Figure . Imprint of a Vickers indenter on diamond layer at 300N applied load
for the sample M1313
Figure . Microindentation of diamond layer at 300N applied load using Vickers
indenter for sample M1313
The results of the microindentation using Vickers indenter for the diamond layer are
displayed in Tables 4.9 and 4.10 for the samples M1313 and K1908, respectively. The
0
50
100
150
200
250
300
350
0 0.01 0.02 0.03 0.04 0.05
Ap
plie
d lo
ad (
N)
Extension (mm)
Microindentation of the diamond layer Machine compliance
Vickers imprint

Chapter Four: Experimental Work (Indentation Testing)
P a g e |
applied loads were different for the two samples as few clear indents were obtained at
certain loads.
Table . Mechanical properties and diagonal indents length of the diamond-cobalt
layer resulted from Vickers microindentation for the sample M1313
Table . Mechanical properties of the diamond layer for the sample K1908 after
Vickers microindentation
After each microindentation testing of the diamond layer, the tip of the indenter has to
be checked using SEM to observe any damage that may have occurred.
4.2.3.2 Knoop microindentation
Knoop microindentation testing was carried out to determine the hardness and the
Young’s modulus of the diamond layer as low loads are required for the Knoop
microindentation compared to the Vickers one. Knoop hardness testing is also used to
create cracks on the diamond layer for fracture toughness determination. The tip of the
indenter was made from natural diamond that has geometry of rhombic-based pyramidal
shape. The Instron 5566 mechanical testing machine is used to conduct the Knoop
microindentations on the diamond layer of the PDC sample. Before achieving the
Knoop indentations, the surfaces of the samples were polished to reduce the asperities
that might distort the obtained results.
The Knoop indenter is pressed into the cutters surface under a certain load for a period
of 15 seconds and then the load is released. The selected applied loads for Knoop
Load
(N)
Length of
first diagonal
indent (µm)
Length of Second
diagonal
indent (µm)
Average
diagonal
length, (µm)
Vickers
hardness
(HV)
Vickers
hardness
(GPa)
Young’s
modulus
(GPa)
.5.81 34..7
.0.305 5077.471 58.7.88 1.5.50
Load
(N)
Length of
first diagonal
indent (µm)
Length of Second
diagonal
indent (µm)
Average
diagonal
length,
(µm)
Vickers
hardness
(HV)
Vickers
hardness
(GPa)
Young’s
modulus
(GPa)
37.08 30.07 3..7. .7...541 ....417 15..35
50.35 ...45 .1..5 .743.7.1 .7..80
7..50 .5.17 7..845 ...5.30. .5.8... 1.8.04

Chapter Four: Experimental Work (Indentation Testing)
P a g e |
testing were chosen from 5 -50 N. The indents are examined by SEM to determine the
longest diagonal of the rhombus imprint. The hardness of the material is calculated from
Equation (4-6) as follows (Sumiya and Irifune 2004):
where HK is the knoop hardness (GPa), F is the applied force (N) and dl is the length of
the longest indent diagonal (µm). Figure 4.46 shows the indents left after Knoop
microindentation on the diamond layer of the sample M1313.
Figure . Knoop indents on diamond-cobalt layer at 20 N load for the sample M1313
Due to the rough surface of the diamond, just a few imprints left after the Knoop
microindentation for sample M1313, while it was not possible to obtain any clear
undistorted imprint on sample K1908 when using loads rather than 20 N even after
careful examination by SEM. The Young’s modulus of the diamond layer related to the
Knoop microindentation testing is determined similarly to the Vickers, microindentation
testing. Unfortunately, no cracks were produced after Knoop microinendtation. Table
.11 shows the mechanical properties of the diamond layer of the sample M1313
obtained from the Knoop microindentation.
Knoop imprints
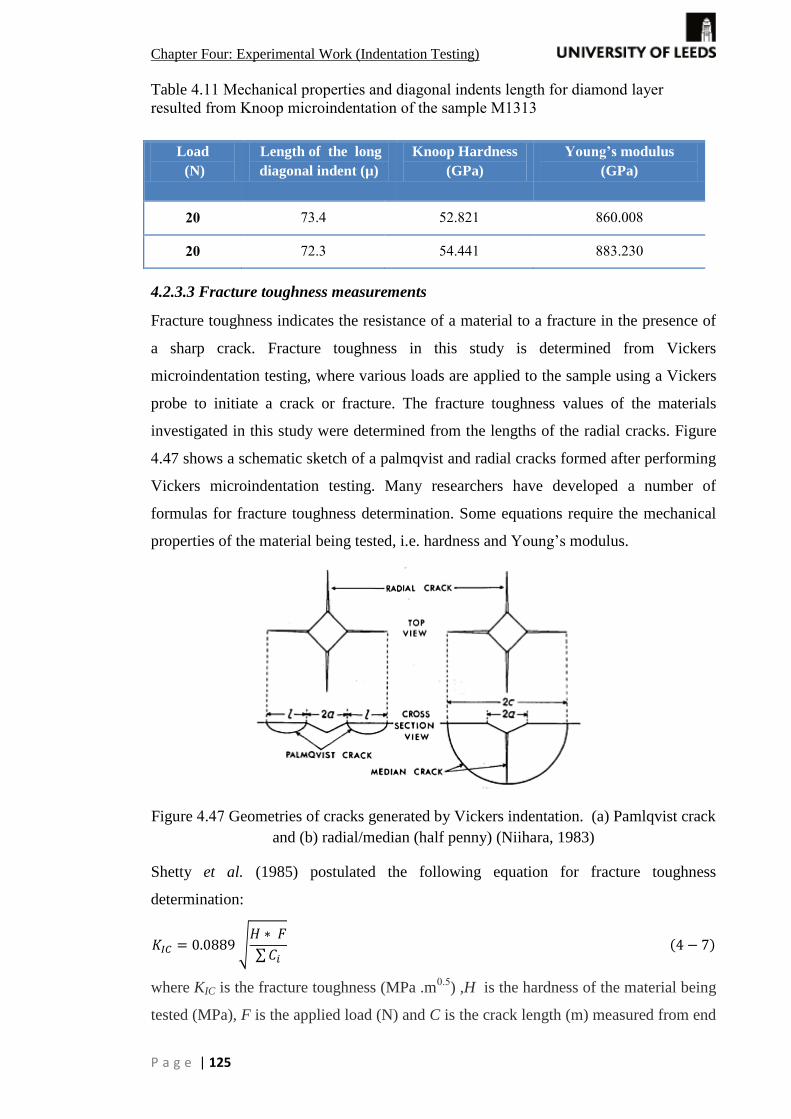
Chapter Four: Experimental Work (Indentation Testing)
P a g e |
Table . Mechanical properties and diagonal indents length for diamond layer
resulted from Knoop microindentation of the sample M
4.2.3.3 Fracture toughness measurements
Fracture toughness indicates the resistance of a material to a fracture in the presence of
a sharp crack. Fracture toughness in this study is determined from Vickers
microindentation testing, where various loads are applied to the sample using a Vickers
probe to initiate a crack or fracture. The fracture toughness values of the materials
investigated in this study were determined from the lengths of the radial cracks. Figure
.47 shows a schematic sketch of a palmqvist and radial cracks formed after performing
Vickers microindentation testing. Many researchers have developed a number of
formulas for fracture toughness determination. Some equations require the mechanical
properties of the material being tested, i.e. hardness and Young’s modulus.
Figure . Geometries of cracks generated by Vickers indentation. (a) Pamlqvist crack
and (b) radial/median (half penny) (Niihara, 1983)
Shetty et al. (1985) postulated the following equation for fracture toughness
determination:
√
∑
where KIC is the fracture toughness (MPa .m
) ,H is the hardness of the material being
tested (MPa), F is the applied load (N) and C is the crack length (m) measured from end
Load
(N)
Length of the long
diagonal indent (µ)
Knoop Hardness
(GPa)
Young’s modulus
(GPa)

Chapter Four: Experimental Work (Indentation Testing)
P a g e |
to end distance between opposite cracks subtracting the length of the diagonal of the
indent.
Evans and Charles (1976) suggested a semi-empirical equation for fracture toughness
calculation. Crack and indent length as well as the hardness of the indented material
were the most dependant parameters for fracture toughness determination as follows.
(
)
where, KIC is the fracture toughness (MPa .m
), H is the hardness (MPa) , a is the half
length of the diagonal indent (m) and C is the crack length (m). The crack length
represents the distance from the centre of the indent to the crack tip.
Lawn et al suggested an experimental technique for fracture toughness which
depends primarily on the previous work of Evans and Charles (1976). However, this
technique shows that the fracture toughness depends on the elastic-plastic properties of
the material along with the total crack length. The proposed equation is found to be
more applicable to ceramics. The suggested equation is as follows:
(
)
(
)
where KIC is the fracture toughness (MPa .m
), H is the hardness (MPa) , a is the half
length of the diagonal indent (m) , C is the crack length (m) and E is the Young’s
modulus of the material (MPa).
Other formulas for fracture toughness determination depend mainly on the mechanical
properties of the material being tested. Anstis et al. (1981) investigated the radial-
median cracks left after Vickers indentations. The suggested equation, derived by
testing on ceramics, is as follows:
√
where KIC is the fracture toughness (MPa .m
), H is the hardness (MPa) , E is the
Young’s modulus of the material (MPa) , C is the crack length (m) and F is the applied
load (N). The crack length represents the distance from the centre of the indent to the
crack tip.

Chapter Four: Experimental Work (Indentation Testing)
P a g e |
Laugier (1985) postulated an equation which could be applied on various materials soft
to hard and the obtained results were close to the literature.
(
)
(
)
where KIC is the fracture toughness (MPa .m
), H is the hardness (MPa) , E is the
Young’s modulus of the material (MPa) , C is the crack length (m) and F is the applied
load (N).
The measurements of the fracture toughness presented in this study were carried out
using the software DigitalMicrograph 3.7 to analyze the SEM and BSE images for
determining the cracks length obtained from microindentation testing.
4.2.3.3.1 Fracture toughness measurements of WC-Co
Vickers microindentation tests were conducted on the substrate layer of the PDC
samples by applying various loads for a dwelling time of 5 seconds and then releasing
the load. It was observed that when applying 100 N load cracks developed around the
edges of the imprints, whereas no clear cracks initiated at loads lower than 100 N.
Figure 4.48 illustrates the cracks caused from Vickers microindentation on the substrate
layer of the sample K1908, where 170 N was applied. The orange arrows demonstrate
the extension of the cracks from the edge of the diagonals of the imprint.
Figure . Cracks occurring when applying 170 N load on WC substrate
for the sample K1908
Table 4.12 shows the results of fracture toughness obtained from Vickers
microindentation testing for the substrate layer for samples K1908 and M1313. Various
equations are used for this purpose, where it is clear from the results that Lawn et al
Crack1 length = 39.20 µm
Crack2 length = 35.45 µm
Crack3 length = 36.40 µm
Crack4 length = 24.87 µm
Crack 2
Crack 1
Crack 4
Crack 3

Chapter Four: Experimental Work (Indentation Testing)
P a g e |
and Shetty et al. ( approaches exhibited good agreement with the reported
values in the literature for the same material. Figure 4.49 illustrates the comparison
between the literature and the obtained values of fracture toughness for the substrate
layer of sample
Table . Results of fracture toughness calculated from different methods for WC
substrate for samples K1908 and M1313.
Figure . Fracture toughness for the substrate layer from different models for the
substrate layer of sample K1908
K1908. Figure 4.50 shows the fracture toughness for sample M1313 obtained from
various equations along with the range literature value represented with the red lines.
Lo
ad
(N)
KIC
(M
Pa
.m )
Lit
era
ture
(O
sip
ov
et
al.
, 2
010
)
KIC
(M
Pa
.m )
(An
sti
s e
t a
l )
KIC
(M
Pa
.m )
(La
wn
et
al )
KIC
(M
Pa
.m )
(La
ug
ier )
KIC
(M
Pa
.m )
(Ev
an
s a
nd
Ch
arl
es )
KIC
(M
Pa
.m )
(Sh
ett
y e
t a
l
)
KIC
(M
Pa
.m )
Av
era
ge
(K1908) -
±
(K1908) -
12.454
± 2.21
(M1313) -
11.338
± 1.804
(M1313) - N/A
12.733
± 2.23
5
7
9
11
13
15
17
19
0 100 200 300
Frac
ture
to
ugh
ne
ss (
MP
a.m
1/2
)
Applied load (N)
Anstis et al
Lawn et al
Laugier
Evans and Charles
Shetty et al

Chapter Four: Experimental Work (Indentation Testing)
P a g e |
Figure . Fracture toughness versus applied loads for the substrate layer
for sample M1313
4.2.3.3.2 Fracture toughness measurements of diamond layer
As mentioned previously that, no fractures were created from Knoop microindentation,
therefore Vickers microindentation was the choice for creating fractures, especially on
the diamond surface. Many attempts were performed to obtain fractures around the
diamond layer of the PDC samples using various loads from 10 N up to 100 N, using
Vickers indenter, but clear cracks were obtained with just a few imprints, due to the
high surface roughness of the diamond layer even after fine polishing. However, indents
with cracks were obtained using a Vickers indenter at 30N and 50N on very well
polished diamond surfaces of the PDC sample (K1908).
Figure . Crack lengths when applying 30 N load on the diamond layer for the
sample K1908
5
7
9
11
13
15
17
19
0 100 200 300
Frac
ture
to
ugh
ne
ss (
MP
a.m
1/2 )
Applied load (N)
Anstis et al
Lawn et al
Laugier
Evans and Charles
Shetty et al
Crack1 length = 17.57 µm
Crack length = µm
Crack 2
Crack 1

Chapter Four: Experimental Work (Indentation Testing)
P a g e |
Figure 4.51 demonstrates a BSE image of a very fine polished diamond surface of the
PDC sample K1908. The orange arrows show opposite cracks occurred when applying
30 N. Figure 4.52 shows a Vickers imprint with four cracks occurring; one at each
diagonal edge when applying a load of 50 N for sample M1313.
Figure . Crack lengths when applying 50 N load on the diamond layer
for sample M1313
Table . Fracture toughness calculated by various methods for the diamond layers of
samples M1313 and K1908
Lo
ad
(N)
KIC
(M
Pa
.m )
Lit
era
ture
(O
sip
ov
et
al.
, 2
01
0)
KIC
(M
Pa
.m )
(An
sti
s e
t a
l
KIC
(M
Pa
.m )
(La
wn
et
al
KIC
(M
Pa
.m )
(La
ug
ier,
19
85
)
KIC
(M
Pa
.m )
(Ev
an
s a
nd
Ch
arl
es
, 19
76
)
KIC
(M
Pa
.m
)
Av
era
ge
30 N
K1908
sample
- 9.641 ±
50 N
M1313
sample
- 9.13 ± 1.219
Crack1 length = 30.67 µm
Crack length = µm
Crack 1 (edge to edge)
Crack 2(edge to edge)

Chapter Four: Experimental Work (Indentation Testing)
P a g e |
Table 4.13 exhibits the obtained values of fracture toughness of the diamond layer of
the PDC samples. Figure 4-53 illustrates the fracture toughness of the diamond layer for
two PDC samples at loads 30 N and 50 N. The obtained results were close for both
samples. Fracture toughness calculated from Laugier and Anstis et al
show good agreement with the literature value of the diamond layer of the PDC cutters.
The method of Shetty et al is not applicable due to lack of clear cracks at each
end of the diagonals of the indent for the samples.
Figure . Fracture toughness for the diamond coating of the PDC inserts obtained
from various approaches
The overall average results of the mechanical properties of the PDC samples obtained
from the microindentation testing can be summarised in Table 4.14 as follows:
Table . Overall results of the microindentation testing for the substrate and the
diamond layers of the PDC samples
PDC sample Vickers hardness
(GPa)
Yong's modulus
(GPa)
Fracture
toughness
(MPa.m
)
Layer
M1313 13.072 ±
516.943 ±
11.908 ±
Substrate
K1908 12.564 ±
514.344 ±
12.277 ±
Substrate
M1313 50.85 ±
864.534 ±
9.13 ±
Diamond
K1908 ±
855.63 ±
9.641 ± 1.064 Diamond
5
7
9
11
13
15
17
19
0 20 40 60
Frac
ture
to
ugh
ne
ss (
MP
a.m
1/2 )
Applied load (N)
Anstis et al
Lawn et al
Laugier
Evans and Charles
Sample
K1908
Sample
M1313

Chapter Four: Experimental Work (Indentation Testing)
P a g e |
Micro-structural properties and cobalt content of PDC cutters
This part of the work is carried out to study the effect of the micro-structural properties
of the PDC inserts and cobalt content on the mechanical properties of the materials
forming the PDC cutters. The study aimed to determine the particles size of the coating
(diamond) and the substrate (tungsten-carbide) and the weight percentage of the binder
(cobalt) in the PDC samples.
Combined BSD and coloured EDX images are used to analyse the micro-structural
properties of the PDC cutters. BSD images are used for displaying the best resolution of
the particle distribution compared to normal SEM images. EDX maps are used for
determining the cobalt content in the diamond and the substrate layers of the PDC
cutters.
The particle size diameter of the diamond and substrate is determined by using image J
software after analysing the BSD images and obtaining the area of the particles and then
converting the area into Circular Equivalent Diameter (CED) which is defined as the
diameter of a circle with the same area as the particle (Olson, 2011). CED is determined
from the following equation:
√
where, Ap is the area of the particle determined from Image J software (µm ). CED is
measured in µm.
Figure 4.54 shows the processing steps of the software (Image J) for an imported SEM
image used in the study.
Figure 4.55 shows the diamond particles embedded in the binder (cobalt) for the
diamond layer of samples M1313 (a) and K1908 (b). The particle size distribution of the
diamond grains of samples M1313 and K1908 is shown in Figure 4.56.

Chapter Four: Experimental Work (Indentation Testing)
P a g e |
Figure . Processing cycle of Image J software used for analysing SEM images in the
study for particles size determination
Figure . BSD images (a) sample M1313 (b) sample K1908 of the diamond layer
displaying the diamond grains (black) and the cobalt (white)
Figure . Diamond particle size distribution of sample M1313 (a)
and sample K1908 (b)
The major constraint was the shape of tungsten-carbide particles that were not spherical
and therefore, the determination of the diameter of the particle directly from the area
a b
0
5
10
15
20
25
30
35
0-5 5-10 10-15 15-20 20-25 >25
Fre
qu
en
cy
Diamond particle size (µm)
Mean particle size =
± µm
b
0
5
10
15
20
25
30
0-5 5-10 10-15 15-20 20-25 >25
Fre
qu
en
cy
Diamond particle size (µm) a
Mean particle size =
± µm
Import SEM
image
Setting image’s scale and
processing (adjusting+
removing noise +
outlining the particles)
Analyzing the
particles
Displaying Results on Image
J

Chapter Four: Experimental Work (Indentation Testing)
P a g e |
obtained from J image software would be wrong. Therefore, the areas of the irregular
shapes obtained from the software were used to determine the Circular Equivalent
Diameter (CED).
Figure 4. illustrates the irregular shape of tungsten-carbide (substrate) particles
embedded in cobalt for (a) sample M1313 and (b) sample K1908, while Figure 4.58
demonstrates the tungsten-carbide grain size distribution of specimen M1313 and
sample K1908.
Figure . BSD images (a) sample M1313 (b) sample K1908 of the substrate layer
displaying the tungsten-carbide particles (grey) and the cobalt (blue)
Figure . Substrate grain size distribution (a) specimen M1313 (b) specimen K1908
The cobalt content represented as weight percentage is determined from EDX maps at
selected various spectrum areas of the material surface (diamond and substrate layers)
and then averaging the results. Figure 4.59 shows the EDX maps with the corresponding
a b
0
10
20
30
40
50
60
70
0-2 2-4 4-6 6-8 >8
Fre
qu
en
cy
WC-Co particle size diameter (µm)
Mean particle size =
± µm
0
20
40
60
80
100
0-2 2-4 4-6 6-8 >8
Fre
qu
en
cy
Wc-Co particle size (µm)
Mean particle size =
± µm
a b

Chapter Four: Experimental Work (Indentation Testing)
P a g e |
element content for five different selected parts (a-e) of the diamond layer of sample
M1313.
Element Wt% C
Co W
Total:
Element Wt% C
Co W
Total:
Figure . EDX maps (a-e) and the corresponding mineral content for the diamond
layer of sample M1313
Element Wt% C
Co W
Total:
Element Wt% C
Co W .
Total:
Element Wt% C
Co W
Total:
a
b
c
e
d

Chapter Four: Experimental Work (Indentation Testing)
P a g e |
Similarly, Figure 4.60 shows the binder content (cobalt) in the diamond layer of sample
K1908 for various areas (a-e).
Figure . EDX maps (a-e) and the corresponding element content for the diamond
layer of specimen K1908
Element Wt% C
Co W
Total:
Element Wt% C
Co W
Total:
Element Wt% C
Co W
Total:
Element Wt% C
Co W
Total:
Element Wt% C
Co W
Total:
a
b
c
d
e

Chapter Four: Experimental Work (Indentation Testing)
P a g e |
Cobalt weight percentage is also measured for five different spectrums of the substrate
layer for samples M1313 and K1908 as shown in Figures 4.61 and 4.62 respectively.
Figure . Electron images and the corresponding element weight percentage for the
substrate layer of sample M1313
Element Wt% C O Co W
Total:
Element Wt% C O Co W
Total:
Element Wt% C O Co W
Total:
Element Wt% C O Co W
Total:
Element Wt% C O Co W
Total:
a
b
c
d
c

Chapter Four: Experimental Work (Indentation Testing)
P a g e |
Figure . EDX images and the corresponding element content for the tungsten-
carbide-cobalt layer of sample K1908
Element Wt% C O Co W
Total:
Element Wt% C O Co W
Total:
Element Wt% C O Co W
Total:
Element Wt% C O Co W
Total:
Element Wt% C O Co W
Total:
a
b
c
d
e

Chapter Four: Experimental Work (Indentation Testing)
P a g e |
Table 4.1 shows the micro-structural properties of two PDC inserts from different
manufacturers.
Table . Structural properties of PDC inserts from different manufacturers
Increasing cobalt content for a given substrate particle size causes the fracture toughness
to increase but reduces the hardness (Bellin et al., c). It is found that, fine substrate
(WC) grain size and low level of cobalt content leads to higher hardness and good wear
resistance , whereas coarse WC particles and high mass content of cobalt produce low
hardness and high wear rate (Mori et al., 2003 and Ndlovu , . Hong et al. (1988)
stated that cobalt infiltrates through the voids between diamond particles by capillarity
during the sintering process. Larger spaces are directly associated with larger particle
size which prefers dislodgment of cobalt, so when the cobalt content is high, therefore it
is corresponding to large particle grain size. Yahiaoui et al. mentioned that the
grain size and the content of cobalt are the most significant parameters relevant with the
material loss of PDC cutters as high wear rate is associated with large particle size.
High wear rate is also associated with high cobalt content of the diamond layer. Bellin
et al. ( b) explained the role of cobalt content towards fracture toughness.
Increasing the cobalt content in the diamond layer and the substrate will increase the
fracture toughness, whereas the wear resistance increases with lower cobalt content.
The particle size of the substrate layer of samples M1313 and K1908 is close around
- µm, whereas the cobalt content in the substrate of sample M1313 is 7.37%
compared to 8.82% in sample K1908. Accordingly, it is expected from these results that
the abrasion (wear) resistance of sample M1313 is slightly greater than sample K1908,
while sample K1908 is more durable against impact wear or fracturing (chipping) than
sample M1313.
PDC
samples
M1313
K1908
Diamond particle size (µm)
. 3 ±
min ˂ .
max > 23.2
. ± 3.
min ˂ .
max > 2 .
WC particle size (µm)
. ± .
min ˂ .
max >
. ± .
min ˂
max > .
Co wt.% (in diamond) 3.26 ± 0.5 4.4 ± 0.51
Co wt.% (in WC-Co) . ± . . ± .

Chapter Four: Experimental Work (Indentation Testing)
P a g e |
Longitudinal measurement of the binder (cobalt) across the interface between the
diamond and the substrate layers is achieved by performing (EDX-Quantline)
measurement of the cobalt as weight percentage for the two PDC samples to monitor
the binder behaviour of the two samples at the interface of two layers. Figures C. -C.
in Appendix-C illustrate the EDX maps along with spectra of the element distribution
on the diamond and the substrate layers of the PDC cutter as well as at the interface
between these two layers. Figures 4.63 show the cobalt content measurement across the
interface of the diamond and the substrate layers of samples M1313 and K1908. Figures
4.63 demonstrate that the binder content of both PDC cutters in the substrate layer is
lower than the standard traditional PDC cutters of (6- Yahiaoui et al. )
suggesting the two PDC samples are having low fracture toughness.
In general, from Figures . it is shown that sample K1908 has greater cobalt content
in both layers (substrate and diamond) confirming the previous results obtained from
EDX maps of Figures . and .60 for the diamond layer and Figures 4.61 and
.62 for the substrate layer of the PDC samples.
Figure . Longitudinal cobalt content across the interface of samples M1313 and
K1908
Figure . shows that cobalt weight percentage exceeds 4 % at the interface for
sample M1313, whereas sample K1908 shows fluctuating spectra near the interface and
a maximum cobalt content of about 29%. These results show that the sintering process
0
5
10
15
20
25
30
35
40
45
50
0 200 400 600 800 1000 1200 1400
Co
bal
t (w
t %
)
Distance (µm)
Cobalt (Sample M1313) Cobalt (sample K1908)
Interface
Substrate layer Diamond layer

Chapter Four: Experimental Work (Indentation Testing)
P a g e |
in sample M131 could be more efficient compared to sample K1908, therefore the
degradation of sample K1908 is expecting to be quicker than sample M1313.
Conclusions
Nano-indentation testing was carried out to measure the hardness and the Young’s
modulus of the materials forming the PDC samples using a Berkovich indenter. EDX
images revealed that PDC cutters have three proposed zones attributed to the different
components (WC, diamond and cobalt as a binder). Since the imprints from nano-
indentation were of similar size to the grain/areas of a given material, a wide scatter in
the hardness and Young's modulus data was unavoidable. In addition, the second reason
for the variation of the obtained results from nano-indentation might be attributed to the
high degree of surface roughness as the polishing process failed to satisfy the
International Standard stipulated by ISO 14577- for polishing the specimens, therefore,
in order to prevent the large fluctuation in the measurement of material properties,
micro-indentation experiments were carried out as micro-indentation testing would give
a bulk imprint of the tested surface of the material.
The hardness of the diamond layer of sample M1313 found to be greater than the
hardness of the sample K1 as shown in Table 4.14. This is mainly due to: (1) lower
level of binder content (3.26%) in sample M1313 compared to sample K1908 that has
higher cobalt content (4.4%); smaller grain size of sample M1313 (12.03 µm)
compared to sample K1908 ( µm).
For the substrate layer, the hardness of the tungsten-carbide layer of sample M1313 is
found to be higher than sample K1908 as shown in Table 4.14 and this is attributed to
the difference in the cobalt content of the substrate for the two PDC cutters. The cobalt
mass weight percentage in sample M1313 is near 7%, whereas sample K1908 has cobalt
content of about 9%. The mean grain size of samples M1313 and K1908 is very similar.
Fracture toughness was calculated from various models based on the mechanical
properties of the materials forming the PDC specimens as well as the cracks developed
at the end of the indents obtained from Vickers microindentation. It was found that
Lawn et al and Shetty et al methods provide the closest agreement to the
literature values of the fracture toughness for the substrate layer of the PDC cutter,
whereas the approaches of Anstis et al and Laugier found to be the
closest to the literature for the diamond layer of the PDC sample.

Chapter Four: Experimental Work (Indentation Testing)
P a g e |
The determined mechanical properties of the materials forming the PDC specimens are
strongly affected by the microstructure properties, especially the particle size
distribution and cobalt content. From the obtained results, samples with high particle
size distribution and high cobalt content are having low hardness and high values of
fracture toughness and consequently having low abrasion wear resistance and better
impact wear resistance, whereas samples having high hardness and low fracture
toughness are expected to have good abrasion wear resistance and less impact wear
resistance, therefore, it is expected that the amount of wear is consequently influenced
by the microstructure properties of the material.
It is worth mentioning that, the balancing of the cobalt content with the particle size
distribution should be achieved to gain high hardness and high fracture toughness. It is
recommended for manufacturing the PDC cutters that, the grains of the tungsten-carbide
alloy in the substrate layer as well as the particles of diamond in the coating layer of the
PDC samples should be a mixture of coarse and fine grain size. This mixture will
maintain high hardness and high fracture toughness without compromising of each one
and consequently increasing the wear rate resistance for impact and abrasion. In
addition, cobalt content within the substrate and the coatings should be also balanced.
Leaching process (depleting the binder) of the diamond layer is needed to minimise the
cobalt content after sintering to avoid the thermal expansion of cobalt when the PDC
cutters are subjected to elevated temperatures causing the chipping of these cutters.
Therefore, the balancing of cobalt content and the particle size distribution will enhance
the PDC inserts against impact and abrasive wear.
The next chapter will discuss the quantification of the abrasive wear for the substrate
and the coating layers of the PDC cutters that mainly depend on the properties of the
materials forming these layers.

Chapter Five: Experimental Scratch Testing
P a g e |
Chapter 5 Experimental Scratch Testing Any macroscopic or microscopic removal or fracture of material, especially at the cutter
surface, or any degradation that reduces bit life, is considered to be wear (Mouritz and
Hutchings 1991). Richardson (1968) as well as Mouritz and Hutchings (1991) showed
that the abrasive wear of the material depends on the term of abrasive hardness over
material hardness (Ha/Hm). It is found that when (Ha/Hm) less than 1, a very low
abrasive wear rate will occur. However, when (Ha/Hm) is greater than 1.2, the abrasive
could scratch the material causing a high abrasive wear rate. The wear of the roller-cone
bits, as well as PDC bits, is a major issue during drilling that leads to severe time losses
which affect the overall drilling operation cost. Therefore, it is essential to evaluate the
wear tendency of the material forming the drill bits.
In the literature, different tests have been performed, especially on PDC bits, and
particularly for the cutters, to evaluate their effectiveness and reliability in harsh
environments. The majority of the previous tests are destructive (Bellin et al.
The abrasion test is the most commonly used one, where the abrasive wear of the
material is evaluated against the rocks with different hardnesses. In these tests, the mass
loss measurements represent the volume of bit wear. Although, previous tests for
evaluating the wear of the PDC inserts are beneficial, precise measurement of the
material loss remains an issue.
The current chapter is focused on studying the wear mechanisms of PDC cutters and the
effect of their mechanical properties on the extent of wear. The volume of wear for the
PDC cutters was determined experimentally using micro and nano-scratch tests on
different layers of PDC cutters, i.e. the diamond layer and tungsten-carbide (substrate
layer) by implementing an approach based on the geometry of the removed material
after such tests. In addition, this chapter illustrates how the experimental wear is
compared to the predicted wear based on current approaches in the literature. Various
wear models are evaluated for micro and nano- scratch tests on both layers of the PDC
samples: WC-Co and diamond.
5.1 Micro-scratch testing
The scratch caused by a sharp indenter produces abrasion wear. The wear mechanism
caused by scratch testing is mainly dominant by ploughing and cutting. A series of
micro-scratch tests are carried out by applying various loads to a probe acting on the
surface of the PDC specimens (substrate and coating); moving the probe a sufficient

Chapter Five: Experimental Scratch Testing
P a g e |
sliding distance to produce a scratch. The resulting scratch length and width are focused
to evaluate the wear of the material. Budinski (2007) proposed an approach to determine
the hardness of the material from scratch tests based on the width of the obtained groove
and the applied load to cause that scratch. Figure 5.1 demonstrates the scratching using
a hard particle or indenter and the grooves generated. In this study, micro-scratch tests
are also applied for determining the hardness of the material being scratched, for which
Equation (5- is applied.
where SHN is the scratch hardness number (GPa), F is the applied force (mN) and ws is
the scratch width (µm).
Figure . Scratch test using a sharp indenter (Budinski, 2007)
Experimentally, the micro-scratch test is performed using Instron mechanical
tester with a diamond probe. Vickers and conical-spherical diamond indenters have
been used during the micro-scratch tests on both layers of the PDC samples.
It is quite challengeable to standardise the scratch testing (micro and nano) as there are
many variable parameters affect this testing. However, ISO-14577 and ASTM E2546
standards could be applied for micro and nano-scratch testing as mainly these tests are
controlled by load or depth selection (CSM In this study, the micro and nano-
scratch testing are controlled by load selection.
The obtained micro-scratches were examined by SEM, EDX and surface profilemeter.
5.1.1 Micro-scratch test of the substrate layer of the PDC samples using Vickers
indenter
A series of micro-scratch tests using a Vickers indenter were conducted on both layers
of the PDC specimens under various loads. The samples were mounted on an anvil that
has a manual controller to alter the sliding distance. The substrate of the PDC sample
Diamond stylus
Sliding direction

Chapter Five: Experimental Scratch Testing
P a g e |
was scratched using loads of - 300 N as at this load range the corresponding
mechanical properties are available from section . Measured wear from micro
scratch tests was compared to the predicted wear based on approaches in the literature
by Rabinowicz (1996), Hutchings (1992) and Ning and Ghadiri (2006). Figure 5.2
shows a SEM image of a groove obtained from a micro-scratch test when applying a
load of 200 N on the tungsten-carbide layer using a Vickers indenter for the sample
M1313. SEM images for the same scratch testing using Vickers indenter on the
substrate of sample M1313 at applying loads 100 and 300 N are shown in Figures D.1
and D.2 respectively in Appendix- D. Table 5.1 illustrates the results obtained from the
scratch tests using a Vickers probe on the substrate layer of the sample M1313. Once
the grooves were obtained from micro-scratch test, the scratches are examined by SEM
to determine their width and finally, the scratch hardness number is calculated from
Equation (5-
Figure . Tungsten-carbide layer after a scratch test with a Vickers indenter under 200
N load
Table . Results of the scratch test of the tungsten-carbide layer of the sample M1313
Load
(N)
Vickers
hardness
(GPa)
Sliding
distance
(µm)
Scratch
width, (b),
(µm)
Scratch
height (h),
(µm)
Scratch hardness
number
(GPa)
The scratch height of the obtained groove from the micro-scratch test is measured by a
2D Talysurf profilemeter. Groove depths measurements were carried out using Ultra
Scratch width = 225.25 µm
Sliding distance = 200 µm
Direction of sliding

Chapter Five: Experimental Scratch Testing
P a g e |
Precision Talysurf PGI800 with a resolution up to nm. Figure 5.3 shows a
profilemeter image of a scratch obtained after applying a 100N load on the substrate
layer of sample M1313 using Vickers indenter.
The volume of wear is calculated experimentally from the geometry of the removed
material using the following equation:
where b is the width of the scratch (measured here by scanning electron microscopy), h
is the height of the scratch (obtained using the 2D profilemeter and X is the sliding
distance.
Figure . Two dimensional Talysurf profilemeter showng the depth of scratch occurred
on the substrate layer after applying 100 N for sample M1313
In the literature, abrasion wear models are used to quantify the wear between the
abrasive and the abraded bodies for different kinds of materials. The experimental wear
obtained from the micro-scratch tests is compared with three different wear models
Rabinowicz (1996); Hutchings (1992) and Ning and Ghadiri (2006) using Equations (2-
(2-15) and (2-19) respectively as these wear models depends mainly on the
mechanical properties of the material being tested and they are used to quantify the wear
of ceramics and alloy metals using various loads and sliding distances. Therefore, the
experimental results of wear obtained from micro and nano-scratch testing are validated
with the three wear models mentioned above. Archard wear model is used for the
determination of the coefficient of abrasive wear, while other models such as the model
of Element six Ltd. is turned out due to inadequate explanation for this empirical model.
Dep
th
(mic
rom
etre
)

Chapter Five: Experimental Scratch Testing
P a g e |
When applying Vickers indenter during the micro-scratch test, the volume of wear of
the material is determined based on the geometry of the removed material as shown in
Figure 5.
Figure . Schematic sketch of the tip of Vickers indenter showing
the angle of abrasion (θ) (based on Rabinowicz ,1976)
Figure 5.4 shows a schematic sketch of the abrasive probe and the angle of abrasion.
The angle of abrasion (θ is and the angle αp) or the half angle of the abrasive
indenter is ( ) or , when using a Vickers indenter. The hardness and the
fracture toughness of the material used in Equations (2-14), (2-15) and (2-19) are
obtained from previous microindentation results shown in chapter four.
Figure 5.5 demonstrates the results of experimental wear along with the calculated
abrasive wear obtained from three models for the substrate layer of the sample M1313.
Figure . Wear calculated from different techniques for the substrate of sample M1313
The wear increases with load, as predicted by all models. The model of Rabinowicz
gave lower wear values than the experimental wear, while Ning and Ghadiri's
model displays a higher trend than the experimental one. Hutchings wear
model displays the closest agreement to the experimental data. As mentioned in section
0
5
10
15
20
25
30
0 50 100 150 200 250 300 350 400We
ar f
or
the
WC
laye
r (m
m3
*10
-4)
Applied load (N)
Experimental-Vickers Rabinowicz Hutchings Ning & Ghadiri
αp
b/2
θ h
b/2

Chapter Five: Experimental Scratch Testing
P a g e |
2.3.2.3 that the expected obtained wear values from Hutchings' would be double
of those obtained from Rabinowicz and this is due to the different assumption made
upon deriving their models. Rabinowicz developed his model basing on the projected
area of the cone indenter which assumed to be a whole circle, while Hutchings assumed
that the projected is half circle. Ning and Ghadir model is following a polynomial
fitting, where at low loads, the wear predicted by this model shows a close agreement to
the experimental wear. However, when the load is increased, the wear predicted by this
model has higher trend. Ning and Ghadiris' model depends mainly on the fracture
toughness and not affected by the angle of abrasion or the half angle of the abrasive
particle as in Rabinowiczs' and Hutchings' models.
5.1.2 Micro-scratch test of the diamond layer of the PDC samples using Vickers
indenter
A series of micro-scratch tests using a Vickers probe were carried out on the diamond
layer of the PDC specimen. Special care should be taken in scratching the surface of the
diamond layer, and low loads, varied from 10 N to 20 N were applied to avoid
damaging the tip of the indenter due to the high resistance of the material surface and a
high degree of asperities. Figure 5.6 illustrates the groove as a result of applying a 20 N
load on the diamond layer of the PDC insert of the sample M1313 using a Vickers
indenter. More images showing the micro-scratches resulting from using Vickers
indenter are presented in Figures D.3 and D. in Appendix –D, where the applied loads
used were 10 and 15 N respectively. Table 5.2 illustrates the results obtained from
scratching the diamond layer of the sample M1313. The Vickers hardness is taken to be
the average value from the previous microindentation tests for the sample M1313.
Figure . Scratch obtained with Vickers probe at 20 N for the diamond layer of the
sample M1313
Scratch width = 31.6 µm
Sliding distance = 300 µm
Groove on the
diamond layer

Chapter Five: Experimental Scratch Testing
P a g e |
Table . Micro- scratch test results of the diamond layer of the sample M1313
Load
(N
Vickers
hardness
(GPa
Sliding
distance
(µm
Scratch
width (
µm )
Scratch
depth (h
(µm
Scratch
hardness
num er (GPa
The experimental wear of the diamond layer as a result of micro-scratch test using
Vickers indenter is calculated from Equation (5-2) and then compared to the predicted
wear based on approaches in the literature.
Average values for hardness and fracture toughness from previous chapter were used for
the calculation of wear from the models of Rabinowicz (1996); Hutchings (1992) and
Ning and Ghadiri (2006). Figure 5.7 illustrates the wear obtained from the experiments
and predicted from the models.
From Figure .7, the trend of wear versus load for the diamond layer of the sample
M1313 is similar to that of the substrate, where Hatchings’ wear model seems to be the
nearest to the experimental wear, whereas Ning and Ghadiri’s model shows the
greatest disagreement to the experimental one. This might be due to the great influence
of fracture toughness on the Equation of Ning and Ghadiri as shown in section 2.3.2.3.
Despite the special care which was taken into account during the tests, the tip of the
indenter was found to get damaged after applying 20N. Figure 5.8 shows an SEM
image for the tip of the Vickers probe after preceding micro-scratch tests at load 20 N
on the diamond coating of the PDC sample M1313. The image shows that the tip of the
probe was damaged by the above tests and could not be used for further-scratch tests.
As such, further scratch tests were completed using a spheroconical indenter.

Chapter Five: Experimental Scratch Testing
P a g e |
Figure . Experimental and predicted wear calculated for the diamond-cobalt layer for
the sample M1313
Figure . Damaged tip of the Vickers indenter after scratching the diamond layer of
sample M1313 at 20 N applied load
5.1.3 Micro-scratch test of the substrate layer of the PDC samples using a
spheroconical indenter
Due to the high risk of damaging the diamond indenter , especially when conducting
the micro- scratch testing on the diamond layer of the PDC samples as shown above,
further scratch tests were performed using spheroconical indenter. The use of a
spherical tip of the probe is an effective option that reduces the risk of breakage
compared to the use of sharp indenters, particularly when scratching hard coatings
(Beake et al The spheroconical indenter has a micron radius and conical
angle of and is shown in Figure 5.
Figure . Spheroconical probe used in the micro-scratch testing (a), SEM image of the
tip of the spheroconical indenter (b)
a b
0
0.1
0.2
0.3
0.4
0.5
0.6
0.7
0.8
0 5 10 15 20 25 30
We
ar f
or
the
d
iam
on
d la
yer
(mm
3 *1
0-4
)
Applied load (N)
Experimental-Vickers Rabinowicz Hutchings Ning & Ghadiri
Wreckage of the
tip of the indenter

Chapter Five: Experimental Scratch Testing
P a g e |
The spheroconical indenter is used to carry out a series of micro-scratch tests for the
substrate layer of different PDC samples at various loads.
Figure 5.10 shows an SEM image of a groove obtained from micro-scratch testing of
the substrate layer of M1313 sample using a spheroconical indenter at 75 N, while
Figure 5.11 shows the groove produced after applying 50 N on the substrate layer of
sample K1908 using diamond spheroconical tip indenter. Figures D.5-D.8 in Appendix-
D show the grooves obtained from micro-scratching with a spheroconical indenter after
applying loads 100, 200, 25 and 75 N respectively on the substrate layer of sample
K1908, while Figures D.9 and D.10 in Appendix-D illustrate the scratches obtained
when applying loads 50 and 65 N respectively on the substrate layer of sample M1313.
The SEM images in Figures 5.10 and 5.11 show that the debris resulting from the
ploughing action due to the micro-scratching of the samples M1313 and K1908 is
dispersed outside the groove as well as accumulating on both sides of the scratch.
Tables 5.3 and 5.4 illustrate the micro-scratch testing results (scratch width and height)
performed on the substrate layers of the samples M1313 and K1908 respectively with a
spheroconical probe. Scratch hardness number was calculated for comparison with
Vickers hardness.
Figure . Scratch obtained at load 75 N on the substrate layer of the sample M1313
due to micro-scratching with spheroconical probe
Scratch width = 135.9 µm
Sliding distance = 200 µm

Chapter Five: Experimental Scratch Testing
P a g e |
Figure . Groove obtained using spheroconical indenter at 50 N load for the WC-Co
layer of the sample K1908
Table . Results of micro-scratch testing of the substrate layer using spheroconical
indenter for the sample M1313
Load
(N)
Vickers
hardness
(GPa)
Sliding
distance
(µm)
Scratch
width, (b)
µm))
Scratch depth
(h),
(µm)
Scratch
hardness
number (GPa)
Table . Results of micro-scratch testing of the substrate layer using spheroconical
probe for the sample K1908
Load
(N)
Vickers
hardness
(GPa)
Sliding
distance
(µm)
Scratch
width, (b)
µm))
Scratch depth
(h),
(µm)
Scratch
hardness
number (GPa)
Scratch width = 112.1 µm
Sliding distance = 200 µm

Chapter Five: Experimental Scratch Testing
P a g e |
The height of the groove is determined from the 2D profilemeter. Figure 5.12 shows the
topography of a scratch using spheroconical indenter for the substrate layer of the
sample K1908 when applying load of 50N.
Figure . Two-dimensional Talysurf profilemeter of a scratch occurred on the
substrate layer after applying 50 N for the sample K1908 using spheroconical probe
The schematic geometry of the micro-scratch process with a spheroconical indenter is
illustrated in Figure 5.13, where the depth or height of the material removed (h) is
shown along the scratch distance (X).
Figure . Schematic geometry of the worn material using spheroconical indenter
during micro-scratch testing
The resulting wear from micro-scratch test is determined from the following equation
which is found to quantify the wear volume along the scratch path as follows (CSM
Instruments., 2002):
Dep
th (
mic
rom
etre
)
(Residual depth) , h
(Distance), X
Wear
Depth of the groove
or height (h)
Wear
Sliding
distance (X)
Spheroconical probe

Chapter Five: Experimental Scratch Testing
P a g e |
RC rt
where Asegment is the area of the circular segment as seen from Figure 5.14 and L is the
sliding distance .The final equation of the circular segment is determined from Equation
(5-4): (The full derivation is shown in Appendix –A.C.
[ ]
where θ is the angle opposing the segment of the circle (Figure 5.14) and it can be
obtained from Equation (5-
(
)
where RC is the radius of the circle and h is the residual depth of the micro- scratch as
shown in Figure 5. :
Figure . Sketch of the circular segment of the spheroconical indenter tip that indents
the layer of the sample
The experimental wear at various load points obtained from the micro-scratching with a
spheroconical indenter of the substrate layer of the sample M1313 is compared to the
literature wear models (Figure 5. . Figure 5.16 displays the experimental wear
compared to the predicted one obtained from various wear models for the substrate
layer of the sample K1908. The mechanical properties of the substrate layer and the
diamond needed for the wear models are taken from chapter four.
Figures 5.15 and 5.16 display that Hutchings’ wear model is the nearest to the
experimental wear for the substrate layer when a spheroconical indenter is used, while
other models show lower values than the experimental one. This is attributed to the

Chapter Five: Experimental Scratch Testing
P a g e |
assumption of the projected tip of the cone indenter is a half circle when scratching is
achieved with a conical indenter as mentioned by Hutchings'. This assumption is so
close to the geometry of the removed material within scratch testing illustrated in Figure
5.13. It is worth mentioning that, the abrasion angle as well as the half angle of the
abrasive particle when scratching with a conical indenter are 44.2
and .
respectively, while the same angles are 22 and 68
when Vickers indenter is used. This
clearly shows that the values of wear volume obtained from Rabinowicz and Hutchings
are higher when conical indenters are used compared to the previous values of wear
volume when Vickers are used. Ning and Ghadiris' model exhibits low wear at low
loads and then showing higher trend due to the polynomial behaviour]r of this model
Figure . Experimental wear compared to the literature wear models
for the WC-Co layer of sample M1313
Figure . Wear comparison for the substrate layer of sample K1908 using
spheroconical indenter
0
1
2
3
4
5
6
7
8
40 50 60 70 80We
ar f
or
the
WC
laye
r (m
m3 *
10
-4)
Applied load (N)
Experimental-Conical Rabinowicz Hutchings Ning & Ghadiri
0
5
10
15
20
25
0 50 100 150 200 250
We
ar f
or
the
su
bst
rate
laye
r (m
m3
*10
-4)
Applied load (N)
Experimental-Conical Rabinowicz Hutchings Ning & Ghadiri

Chapter Five: Experimental Scratch Testing
P a g e |
The wear in Figures 5. and 5. illustrate an increasing trend with load. Ning and
Ghadiri’s wear model show values lower than the experimental one, while the
same model exhibits values higher than the experimental wear in the case of micro-
scratching with Vickers indenter and this due to the fact of Ning and Ghadiri’s model
depends on the fracture toughness of the sample and there is no effect of the abrasion
angle (θ) and the half angle of the abrasive indenter (αp).
5.1.4 Micro-scratch test of the diamond layer of the PDC samples using
spheroconical indenter
Series of micro-scratch tests with spheroconical probe were performed on the diamond
layer of different PDC samples at various loads. Figure 5.17 shows a BSE image
displaying the groove obtained from the micro-scratch test of the diamond layer with a
spheroconical indenter for the sample M1313 at 5 N. There is no evidence of debris
inside or around the groove. Figure 5.18 shows the scratch produced after scratching the
diamond layer of the sample K1908 at 2.5 N. Also, no debris is found to be produced
after carrying-out the micro-scratch test for the diamond layer of this sample. Figures
D.11 and D.12 in Appendix-D show the SEM images of the grooves produced from
micro-scratching with a spheroconical indenter for the diamond layer of sample K1908
when applying 20 and 10 N respectively. Figures D.13 and D.14 in Appendix-D
illustrate the scratches obtained from the micro-scratch testing of the diamond layer at
applied loads of 7.5 N for samples M1313 and K1908 respectively.
Figure . BSE image illustrates a groove obtained when applying 5 N load on the
diamond layer of sample M1313
Scratch width = 18.8 µm
Sliding distance = 300 µm Groove on the
diamond layer

Chapter Five: Experimental Scratch Testing
P a g e |
Figure . BSE image shows a scratch obtained when applying 2.5 N load on the
diamond layer of sample K1908
Tables 5.5 and 5.6 illustrate the micro-scratch testing results (scratch depth and width)
performed on the diamond layers of the samples M1313 and K1908 respectively, with a
spheroconical probe. The scratch hardness number was calculated from the results of
the scratch tests. At low loads, the results of the scratch hardness number show low
hardness and increased with load until the value will be fixed.
Table . Results of micro-scratch testing of the diamond layer using spheroconical
indenter for the sample M1313
Load
(N)
Vickers
hardness
(GPa)
Sliding
distance
(µm)
Scratch
width, (b)
µm))
Scratch depth
(h),
(µm)
Scratch
hardness
number (GPa)
Scratch width = 16.6 µm
Sliding distance = 300 µm
Scratch on the
diamond layer

Chapter Five: Experimental Scratch Testing
P a g e |
Table . Results of micro-scratch testing of the diamond layer using spheroconical
indenter for the sample K1908
Load
(N)
Vickers
hardness
(GPa)
Sliding
distance
(µm)
Scratch
width, (b)
µm))
Scratch depth
(h),
(µm)
Scratch
hardness
number (GPa)
Figure 5.19 illustrates the topography of a scratch obtained from the micro-scratching of
the diamond layer of the PDC sample K1908 at load 2.5 N where the indentation depth
is obtained. Figure 5.19 shows two positive peaks at the edges of the groove. These two
peaks refer to the ridges of the scratch causing as called (pile-up). It might be that cobalt
is showing this kind of pile-up as it is shown later in the analytical study that cobalt is
dislodged from the groove after scratching the area and accumulated at the edges of the
scratch.
Figure 5.20 and 5.21 show the comparison between the experimental wear obtained
from the micro-scratch test with a spheroconical probe for the diamond layer and the
wear predicted by various wear models for the samples M1313 and K1908,
respectively.
Figure . Two-dimensional Talysurf profilemeter of a groove obtained after applying
load of 2.5 N using spheroconical indenter on the diamond layer of the sample K1908
Dep
th
(mic
rom
etre
)

Chapter Four: Experimental Work (Indentation Testing)
P a g e |
Figure . Experimental and predicted wear of the diamond layer of the sample
M1313
Figure . Predicted wear compared to the experimental one of the diamond layer of
the sample K1908
Figure 5. shows that Hutching’s (1992) model is the closest to the experimental wear
within the micro-scratch test when using spheroconical indenter, whereas Ning and
Ghadiri’s model gave lower values as compared to the micro-scratch test when
using Vickers indenter. This may be due to the fact that the abrasion angle (which has
no effect in this model) of the conical probe is greater than the abrasion angle of the
Vickers probe.
0
0.05
0.1
0.15
0.2
0.25
0.3
0.35
0 1 2 3 4 5 6 7 8
We
ar f
or
the
d
iam
on
d la
yer
(mm
3 *1
0-4
)
Applied load (N)
Experimental-Conical Rabinowicz Hutchings Ning & Ghadiri
0
0.2
0.4
0.6
0.8
1
1.2
1.4
0 5 10 15 20 25 30 35
We
ar f
or
the
d
iam
on
d la
yer
(mm
3 *1
0-4
)
Applied load (N)
Experimental-Conical Rabinowicz Hutchings Ning & Ghadiri

Chapter Five: Experimental Scratch Testing
P a g e |
It is worth noting that the obtained graphs for sample K1908 show that all measured
wear models have lower values than the experimental wear except Hutchings’ )
model which displays close results to the experimental from micro scratching.
The tip of the spheroconical indenter is examined for any damage might occur after
performing the micro-scratch testing. Figure 5. shows the tip of the spheroconical
probe and it seems that the indenter is intact after carrying out micro-scratching on the
diamond layer of the PDC samples.
Figure . SEM image of the tip of the spheroconical indenter shows undamaged tip
5.1.5 Analytical study
5.1.5.1 Substrate layer
The objective of the analytical study is to study the wear mechanisms of the PDC
samples and the composition distribution along the scratched areas on both surfaces of
the PDC sample (coating and substrate). Analytical part is carried out on both scratched
layers of the PDC inserts obtained from the micro-scratch test with two indenters
Vickers and spheroconical. Energy dispersive X-ray maps and spectroscopy analyses
were applied on scratches to investigate the mechanisms of wear. Figure . a
demonstrates a coloured X-ray map of the main minerals forming the substrate layer:
Tungsten (W), Carbon (C) and Cobalt (Co) as a binder for sample M1313, while Figure
. b shows the mineral spectroscopy along a micro-scratch obtained from Vickers
probe on the WC-Co layer of the same sample of the PDC cutter at 100 N.
It can be seen that amount of tungsten (W) decreased sharply at the edges of the scratch
with an overall decrease within the scratch distance. Carbon (C) seems to increase on
the scratch edges with reduction trend in between, while the binder (Co) rises along the
scratch. X-ray maps displays clearly that composite alloy of W-C is almost dislodged

Chapter Five: Experimental Scratch Testing
P a g e |
from the scratch and the cobalt grains are occupying the scratch instead of the displaced
WC particles.
Figure . (a) X-ray maps of microscrtaches on the substrate layer using Vickers
indenter of the sample M1313, (b) Spectroscopy of main minerals along the scratch on
the substrate for the sample M1313
Analysis of the scratches obtained from using spheroconical indenter is also carried out
on the substrate layer of both samples. Figure 5. illustrates the X-ray maps of a
groove obtained from micro-scratching the substrate layer of the sample K1908 with a
spheroconical indenter, while Figure 5. shows the EDS analysis along the scratch on
the substrate layer of the sample K1908 at load 25 N.
Figure . X-ray maps of a scratch on the WC-Co layer after applying 100 N for
sample K1908
b
a

Chapter Five: Experimental Scratch Testing
P a g e |
The X-ray analysis of micro-scratch tests on the substrate layer of the PDC samples
(Figures 5. a and 5. ) reveals the fact that the bonds between the tungsten-carbide
alloy and the binder (cobalt) are broken showing that cobalt occupies the scratched area
and possibly produces piling up of carbon on the scratch edges.
Figure . EDS spectra of the groove produced after applying 25 N on the substrate
layer of sample K1908
Figure 5. demonstrates a 3D profilemeter image of the scratch after applying high
load of N The image shows the pile up of the materials on the groove’s sides in
agreement with EDX spectroscopy.
Figure . Three- dimensional image shows the scratch test after applying 300 N load
on the tungsten-carbide layer for sample M1313 with Vickers indenter
PILE-UP

Chapter Five: Experimental Scratch Testing
P a g e |
5.1.5.2 Diamond layer
The main cause of diamond wear or failure of the PDC cutters is due to the back
transformation of diamond to graphite and high difference in the thermal expansion
coefficient between diamond and cobalt causing the breakage of the diamond-diamond
bonds producing diamond failure. Reducing the binder content in the diamond layer
produces better thermal stability and wear resistance than the diamond layer that has
high cobalt content (Bellin et al a and Bellin et al b).
X-ray maps of the obtained scratches as a result of micro-scratching on diamond layer
of the PDC cutters were also examined. Figure 5. illustrates the composition
distribution in and outside the groove after micro-scratch test for the diamond layer of
the sample M1313 using Vickers probe. Unlike the substrate, the cobalt grains (as
shown in Figure 5.2 b) were expelled from the groove and the main remnant mineral
left inside the scratch is diamond, whereas Figure 5.2 a illustrates the amount of carbon
increases inside the scratch area.
Micro-scratching of the diamond layer will cause the dislodgment of the binder grains
out of the groove leaving the diamond grain to occupy the scratch area. This is caused
due to the breakage of the diamond –cobalt bonds. Figure 5. shows the EDX coloured
maps of the scratch and the adjacent area of the diamond layer of the PDC specimen
M1313 using Vickers indenter at varying loads.
Figure . Coloured X-ray map of a groove on the diamond layer as a result of micro-
scratching using Vickers indenter of sample M1313 at 15 N load
Groove on the
diamond layer

Chapter Five: Experimental Scratch Testing
P a g e |
Figure . Coloured X-ray maps of three scratches obtained after applying various
loads (a) 10N, (b) 15N and (c) 20N on the diamond layer of sample M1313
It is worth mentioning that the main wear mechanism of the diamond wear is ploughing
where, no debris was found after the micro-scratch test when applying various loads.
When the diamond layer was scratched the cobalt grains (green) were removed from the
groove and the main mineral remaining in the scratch was diamond (red-brown).
A possible explanation for this mechanism could be attributed to the micro wear of the
tip of the diamond indenter leaving some material on the scratched surface. Another
reason could be due to the fact that the adhesion between the diamond grains and cobalt
is presumably strong and extreme contact pressure can squeeze out the excessive cobalt
while further compacting of the diamonds grains. Displacement of cobalt could also be
further occurred due to a significant difference in the thermal expansion coefficient
between diamond and cobalt ( -
C-
for diamond compared to 1.2*10-
C-
for
cobalt) causing cobalt to expand quicker than diamond and consequently breaking the
bonds between the diamond particles causing failure (Sneddon and Hall 1988).
Investigating these hypotheses requires further work which could be a topic of future
studies. The findings of the analytical work for the diamond layer shows dissimilar
behaviour for the substrate as mentioned previously in section 5.1.5.1, where it was
shown that the binder (cobalt) is concentrated within the scratched area and the carbon
of (WC) was found to be increased at the edges of the groove. This might be attributed
as the load applied to the probe during the scratch test, WC grains are deformed and
therefore, the bonds between the WC grains are broken as well as the bonds between the
WC grains and the cobalt are no longer bonded causing the emergence of cobalt.
Furthermore, there was a pile-up of WC observed at the edges of the groove (Ndlovu
Similar analytical study is performed on the scratches obtained on the diamond layer
when using spheroconical indenter. The same findings of the EDX analysis after the

Chapter Five: Experimental Scratch Testing
P a g e |
micro-scratching using Vickers were obtained for conical tip indenter. Figure 5.
displays EDX coloured maps of a groove obtained from micro-scratching the diamond
layer with a spheroconical tip for the sample K1908 at load 10 N.
Figure . EDX maps of the main minerals in and around the scratch on the diamond
layer after applying 10 N for the sample K1908
It seems that carbon occupies the scratched area as shown in the bottom X-ray map of
Figure 5. , while the binder grains are dislodged outside the groove as shown in the
top right map of Figure 5. . This is presumably attributed for the same reasons
mentioned above for the micro-scratching of the diamond layer with Vickers indenter.
Figure 5. shows the EDS spectra of the two main minerals across a groove scratched
by a spheroconical probe at load 30 N of the sample K1908 as the width of the groove
was around 41.5 microns. The binder (cobalt) is likely to be decreased within the
scratched area and increased at the edges of the groove, whereas carbon (diamond)
increased along the groove compared to the non-scratched area. This is confirmed with
the mineral distribution of the EDX maps of Figures 5. . and 5. .
Groove on the
diamond layer
C Co W

Chapter Five: Experimental Scratch Testing
P a g e |
Figure . EDS spectra of the groove produced after applying 30 N on the diamond
layer of sample K1908
Nano-mechanical testing (Scratch test)
Nano-mechanical testing is a technique that has been used recently for the evaluation of
mechanical failure of ceramics and notably the nano-tribolgical measurements. Nano-
scratch testing approach has preference as it can overcome problems regarding the
breakage of the indenters and the contribution of the machine compliance (Beake et al
Beake et al. (2013) applied the nano-scratch technique for the assessment of different
kinds of ceramics. Beake and his co-workers used topography multipass scratch test or
three-scan procedure which includes pre-scratch topography scan, progressive scratch
and post topography scan in order to discard the effect of the machine compliance on
wear quantification or deformation. In addition, this method enables obtaining precise

Chapter Five: Experimental Scratch Testing
P a g e |
scratch depths after correction of the raw data for the influence of sample topography
or surface roughness. The recommended indenters used in nano-scratch tests are
spheroconical probes.
The selection of the probe’s radius is crucially important in the nanoscratch test If the
tip of the indenter is blunt, then it is not possible to scratch the samples surface to
initiate failure. The probe used in this study was a spheroconical indenter with a µm
tip radius. This represents an effective choice ensuring that deformation is monitored
carefully within the force range of the instrument (500 mN) but without risking the
damage of the probe due to repetitive scanning which could occur when sharper
indenters are used (like Berkovich indenters), especially when applying scratch tests on
hard and rough coatings. Within the progressive load scratch test, a probe is moved over
a sample surface with a linearly increasing load until failure happens at critical loads.
The failure is examined by an optical microscope or can be detected by load
deformation data.
The nano-scratch test produces three curves representing the relationship between the
depth and the distance or the scratch length. The first scan is the pre-scan scratch, while
the rest are the on-load scratch and post-scratch scans. Scan one or (pre-scan) is a
method for measuring the background profile of the surface of the specimen, while scan
two provides the true depth of the scratch, taking into account any curvature. After the
scratch is complete, a post-scratch scan or scan three carried out at the same location of
the scratch. This scan represents the residual depth of the scratch. The residual scratch
depth reveals the plastic deformation or the destruction occurred.
Before analysing the obtained data, correction for instrument compliance and surface
topography is performed within the equipment software according to the study of Beake
et al. (2009). The obtained nano-scratch after applying the progressive load is examined
using optical microscope available with the NanoTest equipment and/or by SEM. It is
worth mentioning, that the specimen’s surface should be polished finely before
launching the nano-experiments to increase the reliability of the results.
Nano-scratch of the substrate layer
Nano-scratch test was performed on the substrate layer of the PDC samples. Multi-pass
nano-scratch test at constant load was selected to perform the test. The settings were as
follows: µm scratch distance, maximum load of 500 mN, 200 µm distance to start

Chapter Five: Experimental Scratch Testing
P a g e |
increasing the load, load rate of 20 mN/sec and scratch speed of µm/sec. Figure 5.31
shows the image of the nano- spheroconical indenter used in the nano-scratch tests. The
tip of the indenter has a radius of 25 µm.
Figure . nano- spheroconical probe with a tip of 25 µm radius
Figure 5. shows a SEM image of a groove obtained after nano-scratch testing on the
substrate layer of sample K1908 using spheroconical indenter of 25 µm radius.
Figure . Groove obtained from nano-scratch testing on the WC-Co layer of
sample K1908
The penetration depth of the post-scratch test residual depth (h) used in Equation (5-5)
represents the residual depth. Equation (5-3) could be re-written to calculate the wear
volume (Vw) at different points as follows:
where n is the index of incremental area and sliding distance.
The total volume of nanowear for the selected PDC sample for 1200 µm distance under
500 mN load was calculated from Equation (5- and plotted as cumulative wear:
Nano-scratch obtained
after applying load of
500 mN

Chapter Five: Experimental Scratch Testing
P a g e |
∑
Plot of the multi-pass nanoscratch test is shown in Figure 5.33, where the three
consecutive scratch tests can be observed. It is crucially important to mention that the
results obtained from the software provided with the nano-scratch equipment are
corrected for the surface roughness and machine compliance.
Results of the measured nano-wear of the substrate layer for sample K1908 after
applying nano-scratch test were plotted vs. sliding distance at different points as shown
in Figure 5. . It is shown that, the volume of wear is increasing in areas that exhibit
high values of residual depth. Figure 5.33 shows that high peaks of residual depth
existed around 200, 322, 750, 886 and 1033 µm distance. Negative peaks also appeared
in the graph and this might be due two reasons (1) a result of a small residual sample
slope not being corrected out (2) at parts in the post-scan, the probe cannot reach the
bottom of the track and instead moves over the wear debris (3) the occurrence of
fracture rather than plasticity. Similarly, Figure 5.34 illustrates high wear rates at same
displacement values corresponded with high values of residual depths.
Figure . Multi-pass nano-scratch test on substrate layer of sample K1908
The total loss of the substrate material (wear) of sample K1908 obtained from the nano-
scratch test using spheroconical probe as shown in Figure 5.34 was -
mm .
-1500
-1000
-500
0
500
1000
1500
2000
2500
0 200 400 600 800 1000 1200
Pe
ne
trat
ion
de
pth
(n
m)
Displacement (µm)
Pre-scratch test On-load scratch test Post-scratch test

Chapter Five: Experimental Scratch Testing
P a g e |
Figure . Wear and cumulative wear of the substrate layer of the sample K1908
Similarly, for sample M1313 the multi-pass nano-scratch test is shown in Figure 5. .
Figure . Multi-pass nano-scratch test on substrate layer of sample M1313
For the sample M1313, the residual depth showed sharp positive peaks near distances of
50 and 947 µm, while the majority of the positive sharp peaks existed between distances
300 and 624 µm. Negative peaks (negative residual depths) also exists due to the same
reasons mentioned in Figure 5.34 above. The high values of residual depth affects the
0
0.005
0.01
0.015
0.02
0.025
0.03
0
0.2
0.4
0.6
0.8
1
1.2
1.4
1.6
1.8
2
0 200 400 600 800 1000 1200
We
ar v
olu
me
mm
3
*10
-06
Cu
mu
lati
ve w
ear
vo
lum
e m
m3
*10
-06
Distance (µm)
Cumulative wear volume Wear volume
-2000
-1000
0
1000
2000
3000
4000
5000
6000
7000
8000
9000
0 200 400 600 800 1000 1200
Pe
ne
trat
ion
de
pth
(n
m)
Displacement (µm)
Pre-scratch test On-load scratch test Post-scratch test

Chapter Five: Experimental Scratch Testing
P a g e |
total nano-wear calculated from Equation 5-7. Figure 5. shows the plot of nano-wear
and cumulative nano-wear for the substrate layer of sample M1313.
Figure . Nano-wear of the substrate layer of sample M1313
It is clearly seen, that the sharp peaks of nano-wear is corresponding to the high peaks
of residual depth as shown in Figure 5. . The total material loss of the substrate layer
due to the nano-scratch test for sample M1313 was -
mm .
Obtained wear from nano-experimental scratch test together with those of micro scratch
test of the substrate layer for samples K1908 and M1313 were compared with the wear
prediction base on the three models (Rabinowicz, , Hutchings, and Ning and
Ghadiri, ), as shown in Figures . and 5. respectively. The nearest wear
model to the experimental one was Hutchings’ , while Rabinowicz model
was the furthest from the experimental wear as illustrated in blue dashed line. Figures
. and 5. illustrate the correlation between the measured micro and nano-wear with
those from wear models using the spheroconical indenter.
0
0.002
0.004
0.006
0.008
0.01
0.012
0.014
0.016
0.018
0.02
0
0.2
0.4
0.6
0.8
1
1.2
1.4
1.6
0 200 400 600 800 1000 1200
We
ar v
olu
me
mm
3
*10
-06
Cu
mu
lati
ve w
ear
vo
lum
e m
m3
*10
-06
Distance (µm)
Cumulative wear volume Wear volume

Chapter Five: Experimental Scratch Testing
P a g e |
Figure . Trendlines of wear for the substrate layer of sample K1908 using
spheroconical probe
Figure . Wear trendlines for the substrate layer of sample M1313 using
spheroconical indenter
0
2
4
6
8
10
12
14
16
18
20
0 20 40 60 80 100 120 140 160 180 200
We
ar (
mm
3 *
10
-4)
for
the
su
bst
rate
laye
r
for
the
sam
ple
GK
19
08
Applied load (N)
Experimental Rabinowicz Hutchings Ning and Ghadiri
Nano wear
0
1
2
3
4
5
6
7
8
0 10 20 30 40 50 60 70 80
We
ar (
mm
3 *1
0-4
) fo
r th
e s
ub
stra
te la
yer
fo
r th
e s
amp
le R
13
13
Applied load (N)
Experimental Rabinowicz Hutchings Ning and Ghadiri
Nano wear

Chapter Five: Experimental Scratch Testing
P a g e |
Nano-scratch of the diamond layer
Similar nano-scratch tests are performed on the diamond layer of the two PDC samples
K1908 and M1313. The multi-scratch test was performed under similar experimental
settings used for the substrate layer. Figure 5. illustrates an optical image of the
groove obtained from a nano-scratch test of the diamond layer of sample K1908.
Figure . Optical microscope image shows the nano-scratch obtained
after applying 500 mN on the diamond layer of sample K1908
Plot of multi-pass nano-scratch test on the diamond layer of sample K1908 is shown in
Figure 5. , where the three scans of the nano-scratch test are displayed.
Figure . Scans of multi-pass scratch test of the diamond layer
of sample K1908
-3000
-2000
-1000
0
1000
2000
3000
4000
5000
6000
7000
8000
9000
0 200 400 600 800 1000 1200
Pe
ne
trat
ion
de
pth
(n
m)
Displacement (µm)
Pre-scratch test On-load scratch test Post-scratch test
Nano scratch on
the diamond layer

Chapter Five: Experimental Scratch Testing
P a g e |
Corrected residual penetration depths from Figure 5.40 were shown to be shallower than
the residual depths of the substrate layer for the same sample (Figure 5.33) indicating
that the wear of the diamond layer for this sample is lower than that of its substrate.
Figure 5.41 illustrates the results of wear obtained from nano-scratch testing for the
diamond layer of sample K1908.
Figure . Wear results after nano-scratch testing on the diamond layer
of sample K1908
Sharp peaks of wear were existed at distances between 35 and 490 µm. The wear of the
diamond material within the nano-scratch test using spheroconical probe was
-
mm . The cumulative wear was nearly constant beyond scratch length of
µm after a gradual increase from the starting point of the test and this is due to low
values of residual depths from scratch length 500- µm as shown in Figure 5.40.
The low values of residual depths will produce low nano-wear as displayed in Figure
Similarly, the plot of multi-pass nanoscratch test for sample M1313 is displayed in
Figure 5.
The residual scratch depth displayed lower values than those of the substrate layer of the
same sample. Figure 5.43 illustrates the wear behaviour of the diamond layer of sample
M1313.
0
0.002
0.004
0.006
0.008
0.01
0.012
0.014
0.016
0.018
0.02
0
0.1
0.2
0.3
0.4
0.5
0.6
0.7
0.8
0 200 400 600 800 1000 1200
We
ar v
olu
me
mm
3
*10
-06
Cu
mu
lati
ve w
ear
vo
lum
e m
m3
*10
-06
Distance (µm)
Cumulative wear volume Wear volume

Chapter Five: Experimental Scratch Testing
P a g e |
Figure . Scan of scratch tests of the diamond layer
of sample M1313
Figure . Results of wear obtained from nano-scratch test of the diamond layer
of sample M1313
Peaks shown to be existed from the starting point of the test until 700 µm , but these
peaks has lower values than those of sample K1908 giving an indication that the
diamond layer of sample K1908 exhibited higher wear rates than the same layer of
sample M1313. The total loss of the diamond material for sample M1313 was
-
mm . The cumulative wear volume is increased gradually until distance of
µm, beyond which
-3000
-2000
-1000
0
1000
2000
3000
4000
5000
6000
7000
8000
9000
0 200 400 600 800 1000 1200
Pe
ne
trat
ion
de
pth
(n
m)
Displacement (µm)
Pre-scratch test On-load scratch test Post-scratch test
0
0.001
0.002
0.003
0.004
0.005
0.006
0.007
0
0.02
0.04
0.06
0.08
0.1
0.12
0.14
0.16
0.18
0 200 400 600 800 1000 1200
We
ar v
olu
me
mm
3
*10
-06
Cu
mu
lati
ve w
ear
vo
lum
e m
m3
*10
-06
Distance (µm)
Cumulative wear volume Wear volume

Chapter Five: Experimental Scratch Testing
P a g e |
was shown to be almost constant as also attributed to low values of residual depth
beyond distance of 700 µm.
The wear obtained from micro and nano-experimental scratch test of the diamond layer
for samples K1908 and M1313 were plotted and compared with the wear obtained from
three models of (Rabinowicz , Hutchings and Ning and Ghadiri ), as
displayed in Figures . and 5. , respectively. Figures . and 5. illustrate the
correlation between the measured micro and nanowear with those from wear models
using the spheroconical indenter. Again, the obtained results of the nano-scratch test
follow the wear trend obtained from micro-scratch testing. Hutchings’ wear
model was found to be the closest to the experimental wear, while Rabinowicz (1996)
model displayed furthest trend from the experimental wear.
Figure . Experimental nano-wear compared to various wear models for the diamond
layer of sample K1908 using spheroconical probe
0
0.2
0.4
0.6
0.8
1
1.2
0 5 10 15 20 25 30
We
ar (
mm
3 *1
0-4
) fo
r th
e d
iam
on
d la
yer
for
the
sa
mp
le G
K1
90
8
Applied load (N)
Experimental Rabinowicz Hutchings Ning and Ghadiri
Nano wear

Chapter Five: Experimental Scratch Testing
P a g e |
Figure . Trendlines of wear for the diamond layer of sample M1313 using
spheroconical indenter
5.3 Normalisation of the wear
Normalisation of the experimental wear for both layers of the samples by sliding
distance and hardness exhibited a linear increasing trend when increasing the load.
Figure . Wear normalised for sliding distance and hardness for sample M1313
0
0.05
0.1
0.15
0.2
0.25
0.3
0.35
0 1 2 3 4 5 6 7 8
We
ar (
mm
3 *1
0-4
) fo
r th
e d
iam
on
d la
yer
fo
r th
e s
amp
le R
13
13
Applied load (N)
Experimental Rabinowicz Hutchings Ning and Ghadiri
Nano wear
0
100
200
300
400
500
0 20 40 60 80
No
rmal
ise
d w
ear
(m
m3 *
10
-07 *
GP
a/µ
m)
Load (N)
Experimental-Micro (WC) Micro-Rabinowicz (WC)Micro-Hutchings (WC) Experimental-Micro (Diamond)Micro-Rabinowicz (Diamond) Micro-Hutchings (Diamond)
Diamond-Co
WC-Co

Chapter Five: Experimental Scratch Testing
P a g e |
This normalisation showed clearly that the wear is linearly proportional with sliding
distance and inversely proportional with hardness. Figures 5. and 5. illustrate the
normalised nano and micro wear for sliding distance and hardness for samples M1313
and K1908 respectively. All wear models along with the experimental wear showed a
linear increasing trend with load.
Figure . Wear normalised for sliding distance and hardness for sample K
Ravikiran (1999) mentioned various definitions of wear quantification. Specific wear
rate is defined as the wear volume normalised for the applied force and the sliding
distance as shown in Equation 5-
where Vw is the volume of material loss (mm
- ), F is the applied load (N) and L is
the sliding distance (µm). The specific wear rate obtained from scratch testing is
calculated for two PDC samples from two different manufacturers (M1313 and K1908).
Figures 5. and 5. illustrate the average specific wear rate comparison obtained from
micro and nano scratch tests over a long load range for the substrate and the diamond
layers of the two PDC cutters, respectively. It is clearly shown, that sample M1313
0
200
400
600
800
1000
1200
1400
0 20 40 60 80 100 120 140 160 180 200
No
rmal
ise
d w
ear
(m
m3 *
10
-07 *
GP
a/µ
m)
Load (N)
Experimental-Micro (WC) Micro-Rabinowicz (WC) Micro-Hutchings (WC)
Experimental-Micro (Diamond) Micro-Rabinowicz (Diamond) Micro-Hutchings (Diamond)
Measures-Nano (WC) Nano-Rabinowicz (WC) Nano-Hutchings (WC)
WC-Co
Diamond-Co

Chapter Five: Experimental Scratch Testing
P a g e |
displayed less specific wear rate than sample K1908 for layers of the substrate and
diamond and consequently sample M1313 has higher wear resistance than sample
K1908.
Figure . Specific wear rate comparison for the WC-Co layer for
samples K1908 and M1313
Figure . Specific wear rate comparison for the diamond layer for
samples K1908 and M1313
Yahiaoui et al. concluded that diamond particle size and cobalt content are
significant parameters towards the wear of PDC inserts. High wear rate is associated
with large particle size. High material loss is also associated with high cobalt content of
the diamond layer.
44.34
50.29
41
43
45
47
49
51
53
55
Substrate layer
Spe
cifi
c w
ear
rat
e (
mm
3 *
10
-05
* (m
.N)-1
)
M1313
K1908
Standard deviation
M1313= ±
K1908 = ±
13.99
14.28
12
12.5
13
13.5
14
14.5
15
Diamond layer
Spe
cifi
c w
ear
rat
e (
mm
3 *
10
-05
* (m
.N)-1
)
M1313
K1908
Standard deviation
M1313= ±
K1908 = ±

Chapter Five: Experimental Scratch Testing
P a g e |
By comparing Tables 5.3 and 5.4 for the substrate as well as Tables 5.5 and 5.6 for the
diamond layer, it can be seen that the difference in wear rate for the two samples is
attributed to the difference in their hardness, where the hardness amount of the diamond
and the substrate is attributed mainly to the microstructural properties such as particle
size and binder content (cobalt) as shown section 4.3.
Archard wear model (Equation 2-17) describes wear in terms of sliding distance,
load and hardness, where a linear relationship is suggested as follows:
where F is the applied load, L is the sliding distances and H is the hardness.
Figure 5. shows the plot of the experimental wear results obtained from micro and
nano-scratch tests with spheroconical indenter for both layers of the two different PDC
samples against F(A).
It can be seen that, a linear correlation of the wear with the F(A) for both diamond and
substrate layers of the PDC cutters could be obtained as follows:
Figure . Predicted wear versus the function F(A)
y = 0.6061x R² = 0.981
0
2E-13
4E-13
6E-13
8E-13
1E-12
1.2E-12
1.4E-12
1.6E-12
1.8E-12
2E-12
0 5E-13 1E-12 1.5E-12 2E-12 2.5E-12 3E-12 3.5E-12
Pre
dic
ted
exp
eri
me
nta
l we
ar (
m3 )
(F.L)/H (m3)

Chapter Five: Experimental Scratch Testing
P a g e |
It can be seen that, the data obtained from nano and micro scratch tests can be fitted into
a single curve based on this model with a reasonable error, suggesting that wear of
various samples in this study could be predicted by knowing the three parameters in
Equation (2-17), i.e. hardness of the sample, applied force and sliding distance.
However, it is worth noting that in real drilling conditions, the existence of lubricant
and high temperature of the environment could affect the wear trends and this should be
further investigated in future studies.
5.4 Conclusions
In this chapter, the wear of PDC samples was assessed using micro and nano-scratch
facilities. The tests were carried out on both layers of PDC samples from two different
manufacturers.
Micro and nano scratch testing depends mainly on the geometry of the removed
material and consequently gives better representation of the volume of wear being
quantified. Furthermore, nano-scratch test provides valuable information of the groove
along the sliding distance showing the stages of failure after testing.
As the scratching the substrate and the diamond layers of the PDC samples, the material
of the two layers is removed by the tip of the diamond indenter (Vickers and
spheroconical) and hence, the type of the abrasive wear is in considered two body
abrasion. The experimental wear volume obtained from micro and nano-scratch testing
was compared with the predicted abrasive wear calculated from two body abrasive wear
models available in the literature. It was concluded that Hutchings' wear model showed
the best agreement with the experimental data compared with other abrasive wear
models.
The EDX analysis of PDC samples in and outside the grooves obtained from the micro-
scratch tests showed that for the substrate layer, the carbon grains accumulate at the
edges of the groove forming pile-up which is called ploughing, however debris of the
substrate was simultaneously found inside and outside the grooves being scratched
causing cutting action instead of ploughing. Therefore ploughing and cutting wear
mechanism were believed as the main mechanisms to occur in the tungsten-carbide
layer of the PDC cutter. EDX shows that tungsten decreased along the scratch, while
the binder (Cobalt) was observed to increase along the scratch and specifically on the
ridges. On the other hand, the mechanism of wear for the diamond layer is different,

Chapter Five: Experimental Scratch Testing
P a g e |
where the diamond grains occupied the scratch dislodging the cobalt outside the groove.
Due to the pile-up occurring during the scratching of the diamond layer of the PDC
samples and no wear debris were found, this confirms that the main dominant wear
mechanism for the coating layer (diamond) is ploughing. Two dimensional profilemeter
graphs of the obtained scratches of the diamond layer show that ridges occurred around
the grooves, suggesting again that ploughing is the main dominant wear mechanism for
the diamond layer of the PDC inserts.
It was shown that all the data for both PDC samples can be unified on a master curve
considering the three parameters mentioned above (load, sliding distance and hardness)
suggesting wear tendency of samples could be predicted based on the mechanical
properties, notably hardness.
The findings of this study could be extended to various types of PDC cutters from
different manufacturers to evaluate the amount of wear as a quality index rather than
using the previous traditional abrasion tests.

Chapter Six: Conclusions and Recommended Future Work
P a g e |
Chapter 6 Conclusions and Recommended Future Work
6.1 Conclusions
- The overall aim of this thesis was to study and analyse the wear of oil drill bits.
The main wear mechanisms of the PDC samples were investigated. It is
concluded from the obtained analytical images that ploughing is the dominant
mechanism of abrasive wear occurring in the diamond layer of the PDC samples
of the PDC bits, whereas cutting and ploughing are the main wear mechanisms
occurred in the substrate layer of the PDC specimens that represent insert or
(TC) roller-cone bits.
- Approaches of the specific energy and the dimensionless drilling parameters
available in the literature for predicting the real-time wear of drill bits while
drilling were evaluated for selected wells in Southern Iraq. It was shown that
these methods were unreliable for monitoring the bit tooth wear when compared
to the field qualitative bit tooth wear of the studied wells due to the presumed
effects of bit balling phenomena when drilling shale formations as well as the
unconformity surface.
- A new original approach for predicting the wear of the roller-cone bit is
presented based on the concept of three body abrasion. The new approach
incorporates the hardness of the rock formation and the materials forming the
drill bit as well as other drilling parameters such as penetration rate, weight on
bit and rotational speed. The new method was applied to roller-cone bits as all
the bits penetrated the wells in this study were of this type.
- The results obtained from the new theoretical wear method were compared with
the qualitative bit tooth wear rate of the selected oil wells in Southern Iraq,
where a good reasonable agreement was obtained compared to the previous
approaches mentioned in point 3 above. The only exceptions occurred when
reaching shale rocks; causing bit balling phenomena, and also when reaching
unconformity structures, where misleading results could be obtained. This
misinterpretation might be attributed to the reason that, when approaching such
structures, channels in the rock occurred as a result of unconformity.
Unconformity is occurring when there is a missing in the geological interval of
the deposited rocks and accordingly, the obtained results might be unreliable.

Chapter Six: Conclusions and Recommended Future Work
P a g e |
- The proposed method suggests that in order to predict the wear, characterisation
of the material properties of the bit is needed. The mechanical properties of the
materials forming the two layers of the PDC cutters were determined by micro
and nano-indentation techniques.
- Indentation results showed that both layers of sample M1313 have higher
hardness than sample K1908. Furthermore the fracture toughness of both layers
of sample K1908 is found to be higher than that of sample M1313.
- The microstructural properties of the materials forming the PDC cutters found to
have a great influence on the mechanical properties, especially hardness and
fracture toughness and consequently on the amount of wear.
- Hutchings’ wear model was found to be the closest to the experimental
wear compared to the models of Rabinowicz (1996) and Ning and Ghadiri
- An analytical study showed that, when the diamond layer was scratched, the
cobalt grains were removed from the scratch and the dominant mineral left in the
groove was diamond. The hypothesis of this mechanism is due to the micro-
wear of the tip of the diamond probe leaving some material on the scratched
surface, although it might also be attributed to the adhesion between the probe
and the diamond layer. In contrast, for the substrate layer, cobalt occupies the
scratched area.
- In conclusion, micro and nano-scratch testing could replace the traditional
techniques for testing the PDC against abrasive wear for two reasons: 1. Micro
and nano-scratch are semi-destructive tests as the samples could be tested many
times compared to the traditional vertical turret lathe technique which is
relatively destructive as the samples could not be tested again. 2. For wear
quantification, old traditional techniques are depending on the measurements of
the mass of the removed material after testing which is not precise, whereas
micro and nano-scratch testing depend on the geometry of the removed material.
In addition, nano scratch testing provides a method to quantify the volume of
wear along the scratch that enables the full analysis of the failure behaviour of
the material being tested.
6.2 Contribution to the Knowledge
Due to the shortage of references related to the prediction of the wear of roller-
cone bits, a developed new model for wear prediction of these bits was obtained

Chapter Six: Conclusions and Recommended Future Work
P a g e |
by incorporating the drilling parameters as well the mechanical properties of the
materials forming the drill bit led to a more enhanced model.
In the literature, PDC samples have been tested with destructive methods and
cannot be used for further tests, therefore carrying tests for wear resistance on
the PDC samples which are non-destructive were useful. Using state of the art
testing techniques based on micro and scratch mechanical testing provides
information of the amount of the volume of wear at different distances.
Indenting and scratching the diamond is challengeable and it was overcome by
using spheroconical indenters rather than sharp indenters that performed the
tests without significant problems.
Modulating the microstructure properties of the diamond and the tungsten-
carbide grains as well as the cobalt content is crucially important to manufacture
more durable PDC cutters against abrasion and impact wear.
Recommended Future Work
The suggested approach for predicting the bit wear based on three body abrasive wear
could be tested for other wells in other regions for vertical drilling and could also be
tested for horizontal drilling to verify its reliability. The developed technique was
performed on roller-cone bits only, but could in principle be extended to Polycrystalline
Diamond Compact (PDC) bits.
The specific energy technique is still considered an unreliable approach for monitoring
the wear of the drill bit while drilling, unless other techniques are used simultaneously
with the specific energy, such as well logs and geological information to understand
sudden changes in the specific energy when the bit drills shale rock formations and
other geological structures such as unconformity.
It is recommended to modulate the particle size distribution along with the cobalt
content when manufacturing the PDC cutters to find at what optimum binder content
and particle size can give maximum hardness and fracture toughness and consequently
decreasing the wear rate caused due abrasion and impact.
The findings of the experimental scratch test could be applied to various types of PDC
cutters from different manufacturers to evaluate the amount of wear as a quality index
rather than using the traditional abrasion tests.

Chapter Six: Conclusions and Recommended Future Work
P a g e |
DEM models could be used to simulate the rock drilling where torque and wear could
be quantified. The models of Archard , Rabinowicz , Ning and Ghadiri
and Hutchings , could be incorporated into DEM models for wear
prediction of the bit. Drilling parameters, particularly bit size, weight on bit, penetration
rate, revolution speed, and other bit design parameters, as well as the mechanical
properties of the materials forming the drill bit should be considered to obtain a reliable
model for wear quantification for PDC and roller-cone bits.
Further work is needed to investigate the displacement of cobalt from the scratched area
as shown from the EDX maps, where the hypothesis mentioned within the study needs
to be proven by further analytical study such as Atomic Force Microscopy (AFM)
which is considered a very high resolution scanning probe microscopy which can be
used to analyse the scratched areas with high resolution.

References .
P a g e |
References
Abbas, R. K., Hassanpour, A., Hare, C., and Ghadiri, M. (2014). "Real-time Monitoring
of Drill Bit Wear and Specific Energy as a Criteria for the Appropriate Time for Pulling
Out Worn Bits". Paper SPE 172269 presented at the Annual Caspian Technical
Conference and Exhibition. Astana, Kazakhstan, 12-14 November, 2014.
Abeed, Q., Frank, S., Detlev, L., and Ralf, L. (2012). "Petroleum system analysis of the
Upper Jurassic-Middle Cretaceous sedimentary sequences of the Southern
Mesopotamian Basin, Southern Iraq". Paper presented at the Geofluids VII 2012.
Akbari, B., Butt, S. D., Munaswamy, K., and Arvani, F.(2011) "Dynamic Single PDC
Cutter Rock Drilling Modeling and Simulations Focusing on Rate of Penetration Using
Distinct Element Method " Paper ARMA 11379 at the 45th
US Rock Mechanics /
Geomechanics Symposium . San Francisco, CA, 26–29 June,
Al-Ameri, T. K., Jafar, M.S. and Pitman, J. "Modelling Hydrocarbon
Generations of the Basrah Oil Fields, Southern Iraq, Based on Petromod with
Palynofacies Evidences". Paper presented at the AAPG Annual Convention and
Exhibition. Houston, Texas, 10-13 April, 2011.
Anstis, G.R., Chantikul, P., Lawn, B.R. and Marshall, D.B. (1981). "A Critical
Evaluation of Indentation Techniques for Measuring Fracture Toughness: I, Direct
Crack Measurements." Journal of the American Ceramic Society -
Archard, J. F. (1953). "Contact and Rubbing of Flat Surfaces." Journal of Applied
Physics -
ASM International Grinding and Polishing. [Online]. [Accessed 29 January
]. Available from:
http://www.asminternational.org/documents/10192/3447544/06958G_Chapter_4.pdf/a6
cda448-291f-491b-bf6f-456322c4e386
ASTM E2546. . Standard Practice for Instrumented Indentation Testing.
[Online]. [Accessed February 2016]. Available from:
http://www.astm.org/Standards/E2546.htm

References .
P a g e |
Beake, B. D., S. R. Goodes, S. Jones, Parkinson, R., Pickford, N. and Smith, J. 2003.
NanoTest User Manual. Wrexham, Micro Materials Ltd.
Beake, B. D., S. R. Goodes and B. Shi (2009). "Nanomechanical and nanotribological
testing of ultra-thin carbon-based and MoST films for increased MEMS durability."
Journal of Physics D: Applied Physics
Beake, B. D., A. J. Harris and T. W. Liskiewicz (2013). "Review of recent progress in
nano-scratch testing." Tribology - Materials, Surfaces & Interfaces -
Beake, B. D., V. M. Vishnyakov, R. Valizadeh and J. S. Colligon (2006). "Influence of
mechanical properties on the nano-scratch behaviour of hard nanocomposite TiN/Si 3 N
4 coatings on Si." Journal of Physics D: Applied Physics
Beake, B. D., B. Shi and J. L., Sullivan (2011). "Nanoscratch and nanowear testing of
TiN coatings on M42 steel." Tribology - Materials, Surfaces & Interfaces -
Beaton, T., Miko, C. W., Denouden, B. P., & Herman, J. (2008). "New Steel PDC Drill-
Bit Technology Redefines Performance Standards in Key Natural-Gas Applications".
Paper SPE 115008 presented at the CIPC/SPE Gas Technology Symposium. Calgary,
Canada, 16-19 June, 2008.
Bellin, F., Dourfaye ,A. , King, W. and Thigpen ,M. (2010 a). "The current state of PDC
bit technology". World oil , September : - .
Bellin, F., Dourfaye ,A. , King, W. and Thigpen ,M. (2010 b). "The current state of PDC
bit technology". World oil , October : -
Bellin, F., Dourfaye ,A. , King, W. and Thigpen ,M. (2010 c). "The current state of PDC
bit technology". World oil, November -
Bhushan, B. 2001. Modern tribology handbook, Boca Raton, FL, CRC Press.
Boland, J. N. and X. S. Lee (2010) ."Microstructural Characterisation and Wear
Behaviour of Diamond Composite Materials". Materials -
Bobji, M. S. and S. K. Biswas (1998). "Formation of hardness by nanoindnetation of
rough surfaces". Materials Research

References .
P a g e |
Budinski, K.G. (2007). Guide to friction, wear, and erosion testing .West
Conshohocken, PA: ASTM International. Section 2, (Alternatives to testing: Modeling
and simulation):16-
Burgess, T. M. (1985). "Measuring the Wear of Milled Tooth Bits Using MWD Torque
and Weight-on-Bit". Paper SPE/IADC 13475 presented at the SPE/IADC Drilling
Conference. New Orleans, Louisiana, 6-8 March 1985.
Chen, F., et al. (2010). "Thermal residual stress of polycrystalline diamond compacts."
Transactions of Nonferrous Metals Society of China -
Cobb, R. T., D. E. Scott and D. Nelms (2011). "Superior Quality Diamond Heel Inserts
Improve Cutting Structure and Seal Life in Abrasive and Directional Applications".
Paper CSUG/SPE 146058 presented at the Canadian Unconventional Resources
Conference. Alberta, Canada, 15-17 November 2011.
Couvy, H., D. Lahiri, J. Chen, A. Agarwal and G. Sen (2011). "Nanohardness and
Young’s modulus of nanopolycrystalline diamond". Scripta Materialia -
CSM Instruments. 2002. Overview of Mechanical Testing Standards. [Online].
[Accessed 29 June 2015]. Available from:
http://www.csm-instruments.com/en/webfm_send/42
CSM Instruments. 200 . The Influence of Surface Roughness on Instrumented
Indentation Testing (IIT). [Online]. [Accessed January ]. Available from:
http://www.csm-instruments.com/fr/the-influence-of-surface-roughness-on-
instrumented-indentation-testing-iit-nht-mht
Donald, H. (2010). "New Approach to Drilling Hard Chert Contaminated Carbonate
Formations in Kazakhstan". Paper SPE 139412 presented at the SPE Caspian
Carbonates Technology Conference. Atyrau, Kazakhstan, 8-10 November 2010.
Dubrovinskaia, N. , S. Dub, and L. Dubrovinsky (2006). "Super wear resistance of
aggregated diamond nanorods". Nano Lett. -

References .
P a g e |
Dunn, K..J. and M. Lee (1979). "The fracture and fatigue of sintered diamond compact".
Journal of Material Science ): 882–
Dupriest, F. E. and W. L. Koederitz (2005). "Maximizing Drill Rates with Real-Time
Surveillance of Mechanical Specific Energy". Paper SPE/IADC 92194 presented at the
SPE/IADC Drilling Conference. Amsterdam, The Netherlands, 23-25 February 2005.
Eason, J., J. Westhoff and J. Stevens (2008). Sintered bodies for earth-boring rotary drill
bits and methods of forming the same, Google Patents. [Online], [Accessed 5 June
2015]. Available from:
https://www.google.co.uk/patents/US20080101977?dq=Eason+,+Westhoff+and+Steven
s+2008&hl=en&sa=X&ei=IWpxVZzjCoGzUI_qgbgH&ved=0CCoQ6AEwAQ
Erno, L. 2014. Drilling and Well design. [Online]. Hungary: Miskkolci Egyetem
Foldtudomanyi Kar. [Accessed 1 November 2015]. Available from:
http://www.tankonyvtar.hu/en/tartalom/tamop412A/2011_0059_SCORM_MFKOT505
2-EN/sco_03_03.htm
Evans, A. G. and E. A. Charles (1976). "Fracture Toughness Determinations by
Indentation." Journal of the American Ceramic Society - -
Evans, T., and P. F. James (1964). "A Study of the Transformation of Diamond to
Graphite". Proceedings of the Royal Society of London. Series A, Mathematical and
Physical Sciences -
Falconer, I. G. and D. Normore (1987). "Well Site Applications of an MWD Bit
Efficiency Model", Paper SPE 16644, Society of Petroleum Engineers.
Fang, Z., A. Griffo, B. White, D. Belnap, R. Hamilton, G. Portwood, P. Cox, G. Hilmas
and J. Bitler "Chipping Resistant Polycrystalline Diamond and Carbide Composite
Materials for Roller Cone Bits". Paper SPE 71394 presented at the SPE Annual
Technical Conference and Exhibition, 30 September-3 October, New Orleans,
Louisiana.

Chapter Six: Conclusions and Recommended Future Work
P a g e |
Farrelly, M. and H. Rabia (1987). "Bit Performance and Selection: A Novel Approach".
Paper SPE/IADC 16163 presented at the IADC/ SPE Drilling Conference. New
Orleans, Louisiana, 15-18 March 1987.
Favier, J. (2007)"Industrial application of DEM: Opportunities and Challenges"
Available from: http://www.efluid.com.cn/topic/detail.aspx?id=423 .
Fujiwara, J. (2012). "Cutting Mechanism of Sulfurized Free-Machining Steel, Scanning
Electron Microscopy", Dr. Viacheslav Kazmiruk (Ed.), ISBN: 978-953-51-0092-8,
InTech, Available from: http://www.intechopen.com/books/scanning-electron-
microscopy/cutting-mechanism-of-sulfurized-free-machining-steel.
Geoffroy, H., D. N. Minh, J. Bergues and C. Putot (1999). "Interaction Between Rock
And Worn PDC Bit: Theory And Experiments". Paper ISRM 244 presented at the 9th
ISRM Congress. Paris, France , 25-28 August.
Gokhale, B. V. (2010). Rotary drilling and blasting in large surface mines. Kent: CRC
Press.
Guder, H.S., E. Sahin, O. Sahin, H. Gocmez, C. Duran and H. Ali Cetinkara (2011).
"Vickers and Knoop Indentation microhardness Study of β-SiAION Ceramic". ACTA
PHYSICA POLONICA A -
Hong, S.-M., M. Akaishi, H. Kanda, T. Osawa, S. Yamaoka and O. Fukunaga (1988).
"Behaviour of cobalt infiltration and abnormal grain growth during sintering of diamond
on cobalt substrate." Journal of Materials Science -
Hutchings, I.,M. ( Tribology: Friction and Wear of Engineering Materials.
London: Edward Arnold.
ISO 14577- . . Metallic materials -Instrumented indentation test for hardness and
materials parameters. [Online]. [Accessed 2 February 2016]. Available from:
http://www.iso.org/iso/iso_catalogue/catalogue_tc/catalogue_detail.htm?csnumber=566

References .
P a g e |
Katiyar, P. K., P. K. Singh, R. Singh and A. l. Kumar (2016). "Modes of failure of
cemented tungsten carbide tool bits (WC/Co): A study of wear parts." International
Journal of Refractory Metals and Hard Materials -
Kopeliovich, D., SubsTech website. [Online]. 2015. [Accessed 3 June 2015]. Available
from: http://www.substech.com/dokuwiki/doku.php?id=main_page
Kromka, A., J. Breza, M. Kadleciková, J. Janik and F. Balon (2005). "Identification of
carbon phases and analysis of diamond/substrate interfaces by Raman spectroscopy."
Carbon -
Krumeich, F., (2011). "Properties of Electrons, their Interactions with Matter and
Applications in Electron Microscopy". Available from:
http://www.microscopy.ethz.ch/downloads/Interactions.pdf.
Kuru, E. and A. K. Wojtanowicz (1992). "A Theoretical Method For Detecting In Situ
PDC Bit Dull And Lithology Change." Journal of Canadian Petroleum Technology
-
Larsen-Basse J. (1973). "Wear of hard-metals in rock drilling: a survey of the
literature". Powder Metallurgy (31):1–
Laugier, M. T. (1985). "The elastic/plastic indentation of ceramics." Journal of
Materials Science Letters -
Lawn, B. R., Evans, A. G. and Marshall, D. B. (1980). "Elastic/Plastic Indentation
Damage in Ceramics: The Median/Radial Crack System." Journal of the American
Ceramic Society - -
Lin, T.-P., G. A. Cooper and M. Hood (1994). "Measurement of the fracture toughness
of polycrystalline diamond using the double-torsion test." Journal of Materials Science
-
Lu P., X.C. Xiao, M. Lukitsch, Y. K. Chou (2012). "Micro-Scratch Testing and
Simulations for Adhesion Characterizations of Diamond-coated Tools". In: Annual
SME North American Manufacturing Research Conference (NAMRC39), 13/17 June
2011, Oregon State University, Corvallis, Oregon, US.

References .
P a g e |
McGehee, D. Y., J. S. Dahlem, J. C. Gieck, B. Kost, D. Lafuze, C. H. Reinsvold and S.
C. Steinke (1992 a). "The IADC Roller Bit Classification System." Paper SPE/IADC
23937 presented at the SPE/IADC Drilling Conference. New Orleans, Louisiana, 18-21
February 1992.
McGehee, D. Y., J. S. Dahlem, J. C. Gieck, B. Kost, D. Lafuze, C. H. Reinsvold and S.
C. Steinke (1992 b). "The IADC Roller Bit Dull Grading System." Paper SPE/IADC
23938 presented at the SPE/IADC Drilling Conference. New Orleans, Louisiana, 18-21
February 1992.
Mendoza, J. A., I. K. Gamwo, W. Zhang and J. S. Lin (2010). "Discrete Element
Modeling of Rock Cutting Using Crushable Particles". ARMA conference paper 10-
232 presented at the 44th U.S. Rock Mechanics Symposium and 5th U.S.-Canada Rock
Mechanics Symposium, Salt Lake City, Utah. June 27 –
Mori, N., H. Moriguchi, A. Ikegaya, Y. Shioya and K. Ohbi (2003). "Development of
Highly Durable Materials for Drilling Hard and Abrasive Rocks". Paper SPE 80457
presented at the SPE Asia Pacific Oil and Gas Conference and Exhibition. Jakarta,
Indonesia, 15-17 April 2003.
Mouritz, A. P. and I. M. Hutchings (1991). "The Abrasive Wear of Rock Drill Bit
Materials", Society of Petroleum Engineers, Paper SPE 24222.
Ndlovu,S., K. Durst and M. Goken (2007). "Investigation of the sliding contact
properties of WC-Co hard metals using nanoscratch testing. " Wear , (7– -
.
Ndlovu Siphilisiwe (2009). "The wear properties of Tungsten Carbide-Cobalt
Hardmetals from the Nanoscale up to the Macroscopic Scale". A PhD dissertation
submitted to the materials Science and Engineering, University of Erlangen-Nuremberg,
Germany.
Nguyen, T . 2011. Drilling Engineering –An Introduction to Drilling Drill Bits PE
311. [Online]. [Accessed 1 November 2015]. Available from:
http://www.google.co.uk/url?sa=t&rct=j&q=&esrc=s&frm=1&source=web&cd=1&ved
=0CCEQFjAAahUKEwiC_pqwrOXIAhVEQBoKHZ8UBeE&url=http%3A%2F%2Finf

References .
P a g e |
ohost.nmt.edu%2F~petro%2Ffaculty%2FNguyen%2FPE311%2FPresentations%2FC3
%2F1_Classification.ppt&usg=AFQjCNGxVyeO5AwBm5bH4x74FXYg0QUe5A&sig
2=3D8Ow4sBO3AX8SwhE22Eeg
Nguyen, T. and Q. Van. 1995. Insert attack angle for roller cone rock bits. EP0452058
B1. 1995- -
Niihara, K. (1983). "A fracture mechanics analysis of indentation-induced Palmqvist
crack in ceramics." Journal of Materials Science Letters -
Ning, Z. and M. Ghadiri (2006). "Distinct element analysis of attrition of granular solids
under shear deformation." Chemical Engineering Science -
Oliver, W.C., G.M. Pharr (1992). "An improved technique for determining hardness and
elastic modulus using load and displacement sensing indentation experiments" J.
Material Research -
Olson, E. (2011). "Particle Shape Factors and Their Use in Image Analysis–Part 1:
Theory | IVT". Journal of GXP Compliance -
Ortega, A. and D. A. Glowka (1984) "Frictional Heating and Convective Cooling of
Polycrystalline Diamond Drag Tools During Rock Cutting." SPE Journal April
-
Osburn, H. J. (1969). "Wear Of rock drilling tools". Powder Metallurgy (24):471–
Osipov, A. S., N.A. Bondarenko, I. A. Petrusha, and V.A. Mechnik (2010). "Drill bits
with thermostable PDC inserts" Diamond tooling journal online (625): 31-34.
Available from: http://www.dtj-online.com/userfiles/file/Vol70Num625_31-34.pdf
Perrott, C. M. (1979). "Tool materials for drilling and mining". Annual Reviews
Material Science 9:23–
Pessier, R. C. and M. J. Fear (1992). "Quantifying Common Drilling Problems With
Mechanical Specific Energy and a Bit-Specific Coefficient of Sliding Friction". Paper
SPE 24584 presented at the SPE Annual Technical Conference and Exhibition.
Washington, D.C., 4-7 October 1992.

References .
P a g e |
Rabia, H. (1982). "Specific Energy as a Criterion for Drill Performance Prediction."
International Journal of Rock Mechanics and Mining Sciences & Geomechanics
Abstracts -
Rabia, H. (1985). "Specific Energy as a Criterion for Bit Selection." SPE Journal of
Petroleum Technology -
Rabia, H., Farrelly, M., & Barr, M. V. (1986). "A New Approach to Drill Bit Selection."
Paper SPE 15894 presented at the SPE European Petroleum Conference. London 20-22
October 1986.
Rabinowicz, E. ) "Abrasive Wear Resistance as a Material Test", Lubrication
Engineering -
Rabinowicz, E. (1996) Friction and wear of materials. Second edition. Toronto, ON:
John Wiley & Sons.
Rashidi, B., G. Hareland and R. Nygaard (2008) "Real-Time Drill Bit Wear Prediction
by Combining Rock Energy and Drilling Strength Concepts" Paper SPE 117109
presented at the SPE International Petroleum Exhibition and Conference. Abu Dhabi,
UAE, 3-6 November 2008.
Ravikiran, A. (1999). "Wear Quantification." Journal of Tribology -
Reshetnyak, H. and J. Kuybarsepp (1994). "Mechanical properties of hard metals and
their erosive wear resistance." Wear -
Richardson, R. C. D. (1968). "The wear of metals by relatively soft abrasives." Wear
-
Sandvik hard material Company (2009). "Cemented carbide, Sandvik new
developments and applications". The brochure is available from:
http://www2.sandvik.com/sandvik/0130/HI/SE03411.nsf/88c2e87d81e31fe5c1256ae80
035acba/651f6e334db04c46c125707600562c88/$FILE/Cemented%20Carbide.pdf
Sawa, T. and K. Tanaka (2002). "Nanoindentation of natural diamond." Philosophical
Magazine A -

References .
P a g e |
Shetty, D. K., I. G. Wright, P. N. Mincer and A. H. Clauer (1985). "Indentation fracture
of WC-Co cermets." Journal of Materials Science -
Sinha, K.S. (2006) Scratching of Materials and Applications. Amsterdam, Elsevier.
Sneddon, M. V. and D. R. Hall (1988). "Polycrystalline Diamond - Manufacture, Wear
Mechanisms, and Implications for Bit Design." Journal of Petroleum Technology
-
Sumiya, H. and T. Irifune (2004). "Indentation hardness of nano-polycrystalline
diamond prepared from graphite by direct conversion." Diamond and Related Materials
-
Sumiya, H., N. Toda and S. Satoh (1997). "Mechanical properties of synthetic type IIa
diamond crystal." Diamond and Related Materials -
Teale, R. (1965). "The concept of specific energy in rock drilling." International Journal
of Rock Mechanics and Mining Sciences & Geomechanics Abstracts -
Tze-Pin, L., M. Hood, G. A. Cooper and L. Xiaohong (1992). "Wear and failure
mechanisms of polycrystalline diamond compact bits." Wear -
Vaprek, S and A. S., Argon (2001). "Mechanical properties of superhard
nanocomposites." Surface and coatings Techmology ( - -
Varel International. 2010. Advanced PDC Bit Cutter Technology. [Leaflet]. Dallas:
Varel International.
Warren, T. M. (1984). "Factors Affecting Torque for a Roller Cone Bit." SPE Journal of
Petroleum Technology -
Waughman, R. J., J. V. Kenner and R. A. Moore (2002) "Real-Time Specific Energy
Monitoring Reveals Drilling Inefficiency and Enhances the Understanding of When to
Pull Worn PDC Bits." Paper IADC/SPE 74520 presented at the IADC/SPE Drilling
Conference. Dallas, Texas, 26-28 February 2002.

References .
P a g e |
Waughman, R. J., J. V. Kenner and R. A. Moore (2003) "Real-Time Specific Energy
Monitoring Enhances the Understanding of When To Pull Worn PDC Bits." SPE
Drilling & Completion -
Wirojanupatump, S. and P. H. Shipway (1999). "A direct comparison of wet and dry
abrasion behaviour of mild steel." Wear 233– -
Xie, Y and H. M. Hawthrone. 2006. The cohesive strength of a surface material by
controlled scratching. In Sinha, S. K. K. Scratching of materials and applications.
Amsterdam: Elsevier, pp.186- .
Xu Wang (2008). "Grain growth, Densification and mechanical properties of
nanocrytalline WC-Co." A PhD dissertation submitted to the department of
Metallurgical Engineering, University of Utah ,US.
Yahiaoui, M., L. Gerbaud, J. Y. Paris, J. Denape and A. Dourfaye (2013). "A study on
PDC drill bits quality." Wear 298– -
Yahiaoui, M., J. Y. Paris, J. Denape and A. Dourfaye (2015 a). "Wear mechanisms of
WC–Co drill bit inserts against alumina counterface under dry friction: Part 1 — WC–
Co inserts with homogenous binder phase content." International Journal of Refractory
Metals and Hard Materials -
Yahiaoui, M., J. Y. Paris, J. Denape, C. Colin, O. Ther and A. Dourfaye (2015 b).
"Wear mechanisms of WC-Co drill bit inserts against alumina counterface under dry
friction: Part 2 — Graded WC-Co inserts." International Journal of Refractory Metals
and Hard Materials -
Zacny, K. (2012). "Fracture and Fatigue of Polycrystalline Diamond Compacts." SPE
Drilling & Completion -
Zhao, J., V. Labiouse , J. Dudt and J. Mathier (2010). "Rock Mechanics in Civil and
Environmental Engineering". Florida: CRC Press.
Ziaja, M. B., and S. Miska, (1982) "Mathematical Model of the Diamond-Bit Drilling
Process and Its Practical Application". SPE Journal -

References .
P a g e |
Ziaja, M. B. (1985) "Mathematical Model of the Polycrystalline Diamond Bit Drilling
Process and Its Practical Application". Paper SPE 14217 presented at the 60th SPE
Annual Technical Conference and Exhibition . Las Vegas, NV, 22-25 September 1985.

Appendix A: Derivations of Equations
P a g e | I
Appendix-A (Derivations of Equations)
A-Derivation of the Mechanical Specific Energy (MSE) equation of
Teale (1965) and the Specific Energy (SE) equation of Rabia (1985)
where W is the weight on bit , PR is the penetration rate T is the torque and ω is the
angular velocity.
And the final equation in imperial units will be as follows:
Derivation of the Specific Energy (SE) Equation for rotary drilling (Rabia 1985):
where En is the energy in Joules in 1 min. and V is a unit volume of rock in m , removed
in 1 min. Energy can be calculated from the following Equation (A-
where T is the torque and ω is the angular velocity.
Equation (A-8) can be written as follows:

Appendix A: Derivations of Equations
P a g e | II
where W is the weight on bit (Kg) , r is the bit radius (mm) and N is the rotary speed
(rev/min.).
Volume of rock removed can be calculated from the following Equation:
where PR = rate of penetration (m/hr).
Substituting Equation (A-9) and (A-10) into Equation (A-7) leads to Equation (A-
Simplifying Equation (A-11) by replacing 2r with d (bit diameter) and using conversion
factors to make all parameters homogeneous in units will make Equation (A-12) as
follows:
where SE (MJ/m )
In Imperial or field units SE will be in units of (lb.in/in ) or (lb/in
) or psi, Equation (A-
12) becomes:
where N (RPM), W (lb), d (in) and PR (ft/hr).
B- Hook’s law derivation of the net stiffness of the sample
where F is the applied load and S is the stiffness.

Appendix A: Derivations of Equations
P a g e | III
or it could be written as follows:
where, Snet is the net stiffness of the sample, Stotal is the stiffness of the sample plus the
stiffness of the machine without the sample and Sm is the stiffness of the machine
without the sample.
Then finally, the net stiffness of the sample could be determined by simplifying
Equation (A-
C-Derivation of the area of the worn material after micro-scratch test
with conical indenter
The area of the segment or the area of the yellow part of the sketch as illustrated in
Figure 5. represents the area of the circular sector minus the area of the triangle above
the segment.
The area of the circular sector is:
where RC is the radius of the circle, Sa is the arc length of the sector.
The area of the triangle is:
where ac is the chord length, rt is the height of the triangle.
Hence, Equation (A-19) could be re-written as follows:
Equation (A-21) can be written as follows:
(
) (
)
From the following trigonometric relation:

Appendix A: Derivations of Equations
P a g e | IV
Equation (A-24) can be written as follows:
Substituting Equation (A-25) into Equation (A-
The arc length Equation is follows:
Substituting Equation (A-27) into Equation (A-
Now substituting Equations (A-26) and (A-28) into Equation (A-18), the final Equation
of the cross- sectional area of the sphere or the segment is as follows:
[ ]
The angle θ can be determined from the following functions:
where rt is the height of the triangle and h is the residual depth of the nano-wear scratch.
(
) (
)
CSM Instruments (2002) used the following relation to quantify the wear volume of the
x-track or linear track could be calculated from the following Equation:
where Asegment is the cross sectional area of the track and L represents the length of the
scratch or distance.
By benefitting from Equation (A-32), volume of the predicted nano-wear could be
calculated from Equation (A-33) as follows:

Appendix B: Further Figures of Chapter Three
P a g e | V
Appendix-B (Further Figures of Chapter Three) Figure B.1 illustrates a sample of bit record for a well-being drilled in the South of Iraq.
The record shows information of the commercial bits used while drilling as well as
drilling parameters such as weight on bit, rotary speed, interval depth, etc. The status of
the drill bit is shown on the columns of dullness condition which include three sub-
columns (T for Tooth, B for Bearings and G for gauge).
Figure B. Bit record of an oil well in the south of Iraq
Figure B.2 shows the plot of the dimensionless square root of the rate of penetration
against the dimensionless torque for well B . Intercept a and slope a is determined
from the plot that are used in further calculations of the dimensionless drilling
parameters.
Figure B. Cross plot of dimensionless torque (TD) with dimensionless square root of
penetration rate (RD) for well B
y = 0.3113x + 46.503
0
10
20
30
40
50
60
70
80
90
40 50 60 70 80
Dim
en
sio
nle
ss t
orq
ue
*1
0-0
3
Dimensionless SQR Root of penetration rate*10-03

Appendix B: Further Figures of Chapter Three
P a g e | VI
Figure B. illustrates the plot between the dimensionless square root of the penetration
rate versus the dimensionless torque for well B . Constants a and slope a is obtained
for the calculations of the bit tooth flatness (FD).
Figure B. Cross plot of dimensionless torque (TD) with dimensionless square root of
penetration rate (RD) for well B
For wells A and B the plot of the square root of the dimensionless penetration rate
versus dimensionless torque are illustrated in Figures B.4 and B.5.
Figure B. Cross plot of dimensionless torque (TD) with dimensionless square root of
penetration rate (RD) for well A
Figure B. Cross plot of dimensionless torque (TD) with dimensionless square root of
penetration rate (RD) for well B
y = 0.4688x + 39.161
0
10
20
30
40
50
60
70
80
90
40 50 60 70 80 90
TD*1
0^-
3
Square RD*10^-3
y = 0.4079x + 48.28
0
20
40
60
80
100
30 40 50 60 70 80 90
Dim
en
sio
nle
ss t
orq
ue
*1
0-0
3
Dimensionless SQR root of penetration rate *10-03
y = 0.1101x + 55.243
0
10
20
30
40
50
60
70
80
30 40 50 60 70 80
Dim
en
sio
nle
ss t
orq
ue
*1
0-0
3
Dimensionless square root of penetration rate *10-03

Appendix C: Further Figures of Chapter Four
P a g e | VII
Appendix-C (Further Figures of Chapter Four) Figure C.1 shows the coloured EDX maps of the interface between the coating and the
substrate layers of the PDC sample. Tungsten, cobalt, calcium and carbon in the
diamond phase are shown within the maps. Cobalt is shown to have greater content in
the substrate layer compared to the coating.
Figure C. EDX maps of the interface of the PDC insert shows the mineral distribution
through diamond and substrate layers

Appendix C: Further Figures of Chapter Four
P a g e | VIII
Figure C.2 illustrates the coloured EDX map of the interface between the coating and
the substrate layers along with Energy Dispersive Spectroscopy EDS for a PDC
specimen (Figure C.3). The spectra for tungsten, cobalt and carbon (diamond) are
shown along the interface.
Figure C. X-ray map of the interface between diamond layer and tungsten carbide
Figure C. Energy dispersive spectroscopy maps for the major minerals
form the PDC insert

Appendix C: Further Figures of Chapter Four
P a g e | IX
Figure C.4 demonstrates the spectra for other elements (oxygen, calcium, iron,
potassium) along the interface of the PDC sample.
Figure C. Energy dispersive spectroscopy maps for other minerals form the PDC
insert

Appendix D: Further Figures of Chapter Five
P a g e | X
Appendix-D (Further Figures of Chapter Five) Figures D and D.2 show the micro-scratch testing with applied loads of and 300
N respectively on the substrate layer of sample M1313 using Vickers indenter.
Figure D. Micro-scratch obtained when applying 100 N on the tungsten-carbide layer
of the sample M1313
Figure D. Micro-scratch produced when applying 300 N on the substrate layer of the
sample M1313 with Vickers indenter
Scratch width = 251.03 µm
Sliding distance = 200 µm
Scratch width = 177.8 µm
Sliding distance = 200 µm

P a g e | XI
Figures D. and D. illustrate the micro-scratch testing with applied loads of 10 and
N respectively on the diamond layer of sample M1313 using Vickers indenter.
Figure D. Scratch obtained after applying N on the diamond layer on the sample
M1313 using Vickers indenter
Figure D. Scratch produced after applying 15 N on the diamond layer of the sample
M1313 using Vickers indenter
Scratch width = 28.4 µm
Sliding distance = 300 µm Groove on the
diamond layer
Scratch width = 23.7 µm
Sliding distance = 300 µm
Scratch on the
diamond layer

Appendix D: Further Figures of Chapter Five
P a g e | XII
Figures D. and D. show the micro-scratch testing on the substrate layer of sample
K1908 using a spheroconical indenter at loads of 100 and 00 N respectively.
Figure D. Scratch obtained on the substrate layer of the sample K1908
at load 100 N using spheroconical indenter
Figure D. Scratch obtained on the WC-Co layer of the sample K1908 at load 200 N
using spheroconical indenter
Scratch width = 145.2 µm
Sliding distance = 200 µm
Scratch width = 203.9 µm
Sliding distance = 200 µm

Appendix D: Further Figures of Chapter Five
P a g e | XIII
Figures D.7 and D.8 show the micro-scratch testing with applied loads of and N
respectively on the substrate layer of sample K1908 using a spheroconical indenter.
Figure D. Groove obtained on the substrate layer of sample K1908 at load 25 N using
spheroconical indenter
Figure D. Groove obtained on the substrate layer of sample K1908 at load 75 N using
spheroconical indenter
Scratch width = 125.8 µm
Sliding distance = 200 µm
Scratch width = . microns
Scratch distance = microns
Width of
the scratch

Appendix D: Further Figures of Chapter Five
P a g e | XIV
Figures D.9 and D. show the micro-scratch testing with applied loads of and 5 N
respectively on the substrate layer of sample M using a spheroconical indenter.
Figure D. Groove obtained when applying 50 N on the WC-Co layer of sample
M1313 using spheroconical indenter
Figure D. Scratch obtained when applying 65 N on the substrate layer of sample
M1313 using spheroconical indenter
Scratch width = 108.2 µm
Sliding distance = 200 µm
Scratch width = 126.74 µm
Sliding distance = 200 µm
Width of
the scratch

Appendix D: Further Figures of Chapter Five
P a g e | XV
Figures D. and D. show the micro-scratch testing with applied loads of 0 and 0
N respectively on the diamond layer of sample K1908 using a spheroconical indenter.
Figure D. Scratch obtained when applying 20 N on the diamond layer of sample
K1908 using spheroconical indenter
Figure D. Scratch obtained when applying 10 N on the diamond layer of sample
K1908 using spheroconical indenter
Scratch width = 24 µm
Sliding distance = 300 µm
Groove on the
diamond layer
Scratch width = 34.3 µm
Sliding distance = 300 µm
Scratch on the
diamond layer

Appendix D: Further Figures of Chapter Five
P a g e | XVI
Figure D. shows the micro-scratch testing on the diamond layer of sample M1313
with applied load of 7.5 N when using a spheroconical indenter, while Figure D.
illustrates the micro-scratching of sample K1908 with applied load of 7.5 N on the
diamond layer using a spheroconical indenter.
Figure D. scratch obtained when applying 7.5 N on the diamond layer of sample
M1313 using spheroconical indenter
Figure D. Groove produced when applying 7.5 N on the diamond layer of sample
K1908 using spheroconical indenter
Scratch width = 21.4 µm
Sliding distance = 300 µm
Groove on the
diamond layer
Scratch width = 20 µm
Sliding distance = 300 µm
Groove on the
diamond layer