november 2021 | week 45
TRANSCRIPT

1
12 Nov ±∆ ±%BDI 2,807 p 92 3.4%
BCI 3,836 p 556 17%
BPI 2,930 q -141 -4.6%
BSI 2,253 q -163 -6.7%
BHSI 1,613 q -113 -6.5%
W-O-W change
It’s been three weeks now of mounting retreats being noted across the board of the
dry bulk freight rates and the many in the market have started to get jitters. Although
in most cases rates are still holding up at relatively firm numbers compared to histori-
cal levels, it has been the speed in which this latest drop has been noted that has trou-
bled most and caused many to re-evaluate their market position. Yet this market drop
has not been alone in causing such a rethink.
There have been a number of macroeconomic figures coming out of China this past
month that seem to be both the reason as well as potential leading indicators as to
how we expect the next few months to transpire. China’s economic growth has
slumped to its slowest pace in the year during 3Q21, growing by a mere 4.9% year-on
-year between July and September. This is a considerable drop from the 7.9% noted in
the previous quarter and considerably lower than the official target set out by Beijing
for the year. At the same time, year-on-year growth in Chinese manufacturing activity
(3.5%) and retail sales (4.9%) have shown some improved performance in October,
though even these latest figures are still keeping in line with the overall trend seen
during the third quarter. The crippling factors have been numerous, as mentioned in
previous insights, yet their negative effects seem to be compounding as of late. Ever-
grande’s missed bond payments last month, coupled with the strong price surge in
commodity prices and crippling power shortages have all been strong dampeners on
the country’s economy. China’s producer price index rose year-on-year by 13.5% in
October, its highest level in more than a quarter century. While the country’s consum-
er price inflation has also been holding up at a relatively high level of 1.5%, in cases of
some essential goods, price inflation has been considerably higher than this. Given the
considerable drop in new building construction starts and the high level of contribu-
tion of the real estate sector (25%) on economic output, negative pressure has been
building up at a fast pace and cast shadows over the sustainability of the strong posi-
tive numbers that China posted during the first half of the year. The “hit” noted on
property investment and new building construction has been reflected in the drop in
construction-related commodities such as steel and iron ore, reflected in turn in the
shipping markets through the sharp drop noted in Capesize freight rates over the past
month.
All this has undoubtedly sounded the alarm in Beijing, with the overwhelming expec-
tation being that in the absence of any significant change in government policies, eco-
nomic growth will slow down further during the final quarter of the year. As such,
most economists do expect some action to be taken up sooner or later, though the
results of any action will depend on what action the central party chooses to take up.
For the time being, it looks as though the world’s second biggest economy and biggest
manufacturer still has major hurdles to overcome and the resulting ripples are going to
continue influencing global markets for some time. Everyone’s attention is now firmly
on what China’s central government will do next to tackle these issues, while the hope
is that the call to action within the party will be swift and have a strong enough impact
to drive the economy out of this recent slump and back on its previous track.
George Lazaridis
Head of Research & Valuations
08th - 14th November 2021 | Week 45
Dry Bulk Freight Market
Secondhand Market
Newbuilding Market
Demolition Market
Economic Indicators
Tanker Freight Market
12 Nov ±∆ ±%BDTI 821 p 4 0.5%
BCTI 618 p 64 11.6%
W-O-W change
Avg Price Index
12 Nov ±∆ ±%Dry 528 u 0 0.0%
Wet 538 u 0 0.0%
W-O-W change
Aggregate Price Index
12 Nov ±∆ ±%Bulkers 108 p 0 0.1%
Cont 130 u 0 0.0%
Tankers 119 p 2 1.3%
Gas 103 u 0 0.0%
M-O-M change
12 Nov ±∆ ±%Gold $ 1,848 p 94 5.4%
Oil WTI $ 80 p 1 1.5%
Oil Brent $ 81 q -1 -0.9%
Iron Ore 94 q -31 -24.5%
Coal 139 q -83 -37.4%
M-O-M change
Aggregate Price Index
12 Nov ±∆ ±%Capesize 85 p 3 3.3%
Panamax 97 p 4 4.1%
Supramax 106 p 2 2.4%
Handysize 107 p 1 1.2%
M-O-M change
VLCC 98 p 1 0.5%
Suezmax 83 p 1 0.9%
Aframax 112 p 0 0.4%
MR 118 u 0 0.0%

2
2020 2021
08th - 14th November 2021
Capesize – After a long correction path, the market returned back to an upward
trajectory last week, boosted by an improved demand profile. This was depicted
in the 17% weekly rise noted in the BCI TCA figure. Interest for iron ore ship-
ments was enhanced this past week, especially in the Pacific basin, where freight
rates for the Australia to China trade route increased by 19.1%. Supply and de-
mand balance was improved in the Atlantic as well.
Panamax – The market continued on its declining path last week, with the BPI
TCA falling to US$26,370/day. It seems as though charterers took a step back
during this past week in the previously active ECSA, as potential cargoes were
limited. In Asia, interest was also subdued last week. Nevertheless, some support
was seen from the increased demand for Baltic round voyages.
Supramax – The corrections in the market resumed here as well last week, with
owners witnessing a further weakening in rates. The BSI TCA fell to US$24,783/
day, about 6.8% lower compared to the week prior. Demand overall was poor,
increasing further available tonnage lists in both the Atlantic and Pacific basins.
However, losses were curbed by the somehow active US Gulf and North Asia
markets.
Handysize – Another week of losses for the Handysize market, with the BHSI
TCA declining to levels below US$30,000/day for the first time since July. Asia
was the key driver for last week’s drop, as demand lost ground compared to the
available tonnage in the region. At the same time, sentiment started to worsen in
the Atlantic basin as well, given the trimmed activity levels of the past few weeks.
0
20
40
60
80
100'000 US$/day
12 Nov 05 Nov ±% 2021 2020
Baltic Dry IndexBDI 2,807 2,715 3.4% 2,956 1,066
CapesizeBCI 3,836 3,280 17.0% 4,036 1,450
BCI 5TC $ 31,811 $ 27,199 17.0% $ 33,474 $ 13,050ATLANTIC RV $ 37,005 $ 32,610 13.5% $ 36,090 $ 13,734
Cont / FEast $ 49,525 $ 48,850 1.4% $ 54,611 $ 27,572PACIFIC RV $ 33,471 $ 23,987 39.5% $ 33,947 $ 13,069
FEast / ECSA $ 25,368 $ 21,523 17.9% $ 29,214 $ 11,711Panamax
BPI 2,930 3,071 -4.6% 3,016 1,103BPI - TCA $ 26,370 $ 27,641 -4.6% $ 27,148 $ 9,927
ATLANTIC RV $ 29,945 $ 30,065 -0.4% $ 26,413 $ 9,527Cont / FEast $ 39,182 $ 40,977 -4.4% $ 39,332 $ 17,999PACIFIC RV $ 22,375 $ 22,604 -1.0% $ 26,806 $ 9,104
FEast / Cont $ 17,513 $ 18,175 -3.6% $ 14,625 $ 2,729Supramax
BSI 2,253 2,416 -6.7% 2,433 746BSI - TCA $ 24,783 $ 26,580 -6.8% $ 26,762 $ 8,210
USG / FEast $ 43,553 $ 45,333 -3.9% $ 37,173 $ 19,867Med / Feast $ 41,633 $ 46,383 -10.2% $ 39,683 $ 17,570PACIFIC RV $ 18,071 $ 19,500 -7.3% $ 25,492 $ 7,188
FEast / Cont $ 17,540 $ 19,600 -10.5% $ 22,016 $ 2,634USG / Skaw $ 33,114 $ 34,286 -3.4% $ 29,632 $ 13,320Skaw / USG $ 33,194 $ 35,738 -7.1% $ 25,967 $ 7,598
HandysizeBHSI 1,613 1,726 -6.5% 1,406 447
BHSI - TCA $ 29,036 $ 31,074 -6.6% $ 25,311 $ 8,040Skaw / Rio $ 35,801 $ 36,607 -2.2% $ 23,840 $ 8,269
Skaw / Boston $ 37,021 $ 37,821 -2.1% $ 24,616 $ 8,606Rio / Skaw $ 38,706 $ 36,894 4.9% $ 29,699 $ 10,415
USG / Skaw $ 31,857 $ 35,143 -9.4% $ 22,852 $ 10,065SEAsia / Aus / Jap $ 23,031 $ 26,938 -14.5% $ 26,310 $ 7,264
PACIFIC RV $ 22,063 $ 25,000 -11.7% $ 24,924 $ 6,510
Spot market rates & indices Average
-2,000
0
2,000
4,000
6,000
8,000
10,000
12,000
BDI BCI BPI BSI BHSI
0
10
20
30
40
50'000 US$/day
0
10
20
30
40
50'000 US$/day
0
10
20
30
40'000 US$/day

3
2020 2021
Crude Oil Carriers - The market returned back to a declining path this past week,
despite that the benchmark BDTI figure closing marginally higher at 821bp. In the
VL market, the limited number of fresh enquiries continued adding pressure in the
MEG for both westbound and eastbound voyages. Elsewhere, demand was also
anemic. In the Suezmaxes, oversupply was once again apparent in key regions
such as WAF and MEG. However, sentiment seems to have improved somehow
helping trim losses for now. In the Aframax market, freight rates also posted a
decline this past week, with improved demand in the MED and Northern Europe
though being a glimpse of hope. Activity in the USG was also not uninspiring.
Oil Products - On the DPP front, it was an overall improved week, as interest for
petroleum products shipments from ARA and MED was enhanced. These gains
though were curbed by the less active SE Asia and USG markets. On the CPP
front, fixing was also increased this past week, helping reduce tonnage lists. How-
ever, activity in the USG was subdued here as well, reducing the overall gains.
08th - 14th November 2021
12 Nov 05 Nov ±% 2021 2020
Baltic Tanker IndicesBDTI 821 817 0.5% 626 722BCTI 618 554 11.6% 508 586
VLCCVLCC-TCE $/day -$ 8,289 -$ 6,722 -23.3% -$ 7,805 $ 38,084
WS 21.86 22.24 -1.7% 19.13 38.50$/day -$ 18,485 -$ 17,463 -5.9% -$ 15,005 $ 27,578
WS 44.14 45.66 -3.3% 35.03 62.19$/day $ 4,540 $ 6,669 -31.9% $ 1,910 $ 51,510
WS 45.00 46.86 -4.0% 36.53 60.56$/day $ 4,834 $ 7,325 -34.0% $ 2,611 $ 12,284
SUEZMAXSuezmax-TCE $/day $ 5,208 $ 8,134 -36.0% $ 1,536 $ 25,496
WS 68.05 75.23 -9.5% 56.86 71.78$/day $ 4,954 $ 8,645 -42.7% $ 3,227 $ 26,591
WS 81.72 85.06 -3.9% 66.39 80.68$/day $ 5,462 $ 7,623 -28.3% -$ 156 $ 24,400
WS 35.21 43.00 -18.1% 25.13 40.82$/day -$ 13,469 -$ 8,641 -55.9% -$ 15,976 $ 4,658
AFRAMAXAframax-TCE $/day $ 10,040 $ 11,298 -11.1% $ 3,301 $ 18,190
WS 121.56 127.19 -4.4% 96.19 100.42$/day $ 10,176 $ 13,671 -25.6% -$ 251 $ 17,844
WS 125.00 127.81 -2.2% 98.79 115.15$/day $ 9,455 $ 10,486 -9.8% $ 4,436 $ 21,894
WS 100.31 104.06 -3.6% 72.06 75.24$/day $ 15,466 $ 17,619 -12.2% $ 4,405 $ 19,487
DPPWS 125.00 110.42 13.2% 91.82 91.00
$/day $ 6,649 $ 3,226 106.1% $ 1,771 $ 11,393WS 105.63 106.25 -0.6% 86.97 91.68
$/day $ 5,978 $ 6,524 -8.4% $ 3,776 $ 17,556WS 127.25 126.31 0.7% 95.70 88.79
$/day $ 16,599 $ 16,215 2.4% $ 6,051 $ 15,427CPP
MR-TCE $/day $ 7,801 $ 8,471 -7.9% $ 6,793 $ 17,604WS 115.36 110.00 4.9% 89.45 121.52
$/day $ 9,112 $ 7,897 15.4% $ 5,489 $ 27,799WS 126.94 110.00 15.4% 119.85 124.71
$/day $ 2,391 -$ 156 1632.7% $ 3,945 $ 13,139WS 115.00 127.86 -10.1% 78.41 96.13
$/day $ 1,783 $ 3,982 -55.2% -$ 1,935 $ 11,998WS 177.50 136.13 30.4% 135.05 145.76
$/day $ 14,269 $ 4,295 232.2% $ 5,470 $ 11,741SPORE-AUS
CONT-USAC
USG-CONT
MEG-USG
MEG-SPORE
BALTIC-UKC
ARA-USG
MED-MED
MEG-JAPAN
SEASIA-AUS
Spot market rates & indices Average
MEG-MED
WAF-CHINA
BSEA-MED
CARIBS-USG
WAF-UKC
NSEA-CONT
0
200
400
600
800
1,000
BDTI BCTI
-104090
140190240290
'000 US$/day
0
50
100
150'000 US$/day
-200
20406080
100'000 US$/day
51525354555657585
'000 US$/day
4
last 5 years
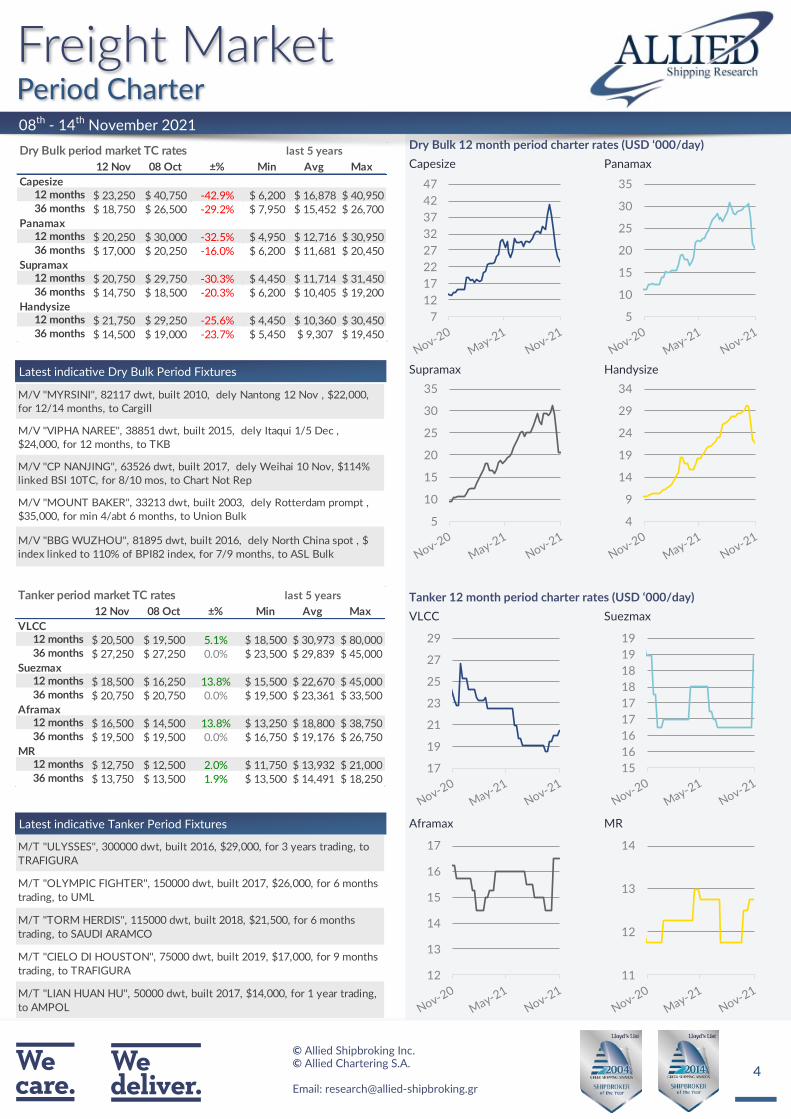
12 Nov 08 Oct ±% Min Avg Max
VLCC
$ 20,500 $ 19,500 5.1% $ 18,500 $ 30,973 $ 80,000
$ 27,250 $ 27,250 0.0% $ 23,500 $ 29,839 $ 45,000
Suezmax
$ 18,500 $ 16,250 13.8% $ 15,500 $ 22,670 $ 45,000
$ 20,750 $ 20,750 0.0% $ 19,500 $ 23,361 $ 33,500
Aframax
$ 16,500 $ 14,500 13.8% $ 13,250 $ 18,800 $ 38,750
$ 19,500 $ 19,500 0.0% $ 16,750 $ 19,176 $ 26,750
MR
$ 12,750 $ 12,500 2.0% $ 11,750 $ 13,932 $ 21,000
$ 13,750 $ 13,500 1.9% $ 13,500 $ 14,491 $ 18,250
12 months
36 months
12 months
36 months
Tanker period market TC rates
12 months
36 months
12 months
36 months
last 5 years
12 Nov 08 Oct ±% Min Avg Max
Capesize
$ 23,250 $ 40,750 -42.9% $ 6,200 $ 16,878 $ 40,950
$ 18,750 $ 26,500 -29.2% $ 7,950 $ 15,452 $ 26,700
Panamax
$ 20,250 $ 30,000 -32.5% $ 4,950 $ 12,716 $ 30,950
$ 17,000 $ 20,250 -16.0% $ 6,200 $ 11,681 $ 20,450
Supramax
$ 20,750 $ 29,750 -30.3% $ 4,450 $ 11,714 $ 31,450
$ 14,750 $ 18,500 -20.3% $ 6,200 $ 10,405 $ 19,200
Handysize
$ 21,750 $ 29,250 -25.6% $ 4,450 $ 10,360 $ 30,450
$ 14,500 $ 19,000 -23.7% $ 5,450 $ 9,307 $ 19,450
12 months
Dry Bulk period market TC rates
12 months
36 months
36 months
12 months
36 months
12 months
36 months
08th - 14th November 2021
Latest indicative Dry Bulk Period Fixtures
Latest indicative Tanker Period Fixtures
7
12
17
22
27
32
37
42
47
5
10
15
20
25
30
35
5
10
15
20
25
30
35
4
9
14
19
24
29
34
17
19
21
23
25
27
29
15
16
16
17
17
18
18
19
19
12
13
14
15
16
17
11
12
13
14M/T ''ULYSSES'', 300000 dwt, built 2016, $29,000, for 3 years trading, to
TRAFIGURA
M/T ''OLYMPIC FIGHTER'', 150000 dwt, built 2017, $26,000, for 6 months
trading, to UML
M/T ''TORM HERDIS'', 115000 dwt, built 2018, $21,500, for 6 months
trading, to SAUDI ARAMCO
M/T ''CIELO DI HOUSTON'', 75000 dwt, built 2019, $17,000, for 9 months
trading, to TRAFIGURA
M/T ''LIAN HUAN HU'', 50000 dwt, built 2017, $14,000, for 1 year trading,
to AMPOL
M/V ''MYRSINI'', 82117 dwt, built 2010, dely Nantong 12 Nov , $22,000,
for 12/14 months, to Cargill
M/V ''VIPHA NAREE'', 38851 dwt, built 2015, dely Itaqui 1/5 Dec ,
$24,000, for 12 months, to TKB
M/V ''CP NANJING'', 63526 dwt, built 2017, dely Weihai 10 Nov, $114%
linked BSI 10TC, for 8/10 mos, to Chart Not Rep
M/V ''MOUNT BAKER'', 33213 dwt, built 2003, dely Rotterdam prompt ,
$35,000, for min 4/abt 6 months, to Union Bulk
M/V ''BBG WUZHOU'', 81895 dwt, built 2016, dely North China spot , $
index linked to 110% of BPI82 index, for 7/9 months, to ASL Bulk

5
Reported Transactions
It was an active week in terms of newbuilding businesses overall,
with buying interest in the dry bulk segment being relatively vivid
right now. Deals emerged this past week for all key size segments
with exception the handysize front. Freight earnings may have
showed a fair correction as of late, yet sentiment and market outlook
continue to hold firm. Taking into account the long term prospects,
buyers have returned to the newbuilding market and we expect to
see more activity emerge during the final months of the year. How-
ever, the effect of newbuilding prices should not be overlooked. At
the same time, the tanker market was once again fairly inactive in
terms of new ordering, with just one deal emerging for 4 small prod-
uct tankers. Freight rates have shown some signs of a rebound dur-
ing the last couple of weeks, but it is still too soon to speak of any
robust freight rate recovery that could drive a sharp rise in interest
for newbuilding activity. Meanwhile, newbuilding prices have not
retreated during this time frame, trimming appetite further. Finally, it
was a very impressive week for the LNG sector, as several units
were added to the orderbook this past week from both Greek and
Qatari interests.
08th - 14th November 2021
10203040506070
Capesize Panamax Supramax Handysize
US$ million
30
50
70
90
110VLCC Suezmax Aframax LR1 MR
US$ million
Indicative Dry NB Prices (US$ million) last 5 years
12 Nov 08 Oct ±% Min Avg Max
Dry Bulkers
Capesize (180,000dwt) 60.8 60.5 0.4% 41.8 48.5 60.8
Kamsarmax (82,000dwt) 36.0 36.0 0.0% 24.3 29.4 36.0
Panamax (77,000dwt) 33.8 33.8 0.0% 23.8 28.4 33.8
Ultramax (64,000dwt) 33.0 33.0 0.0% 22.3 27.4 33.0
Handysize (37,000dwt) 29.5 29.5 0.0% 19.5 23.6 29.5
Container
Post Panamax (9,000teu) 124.5 124.5 0.0% 82.5 90.1 124.5
Panamax (5,200teu) 67.5 67.5 0.0% 42.5 50.6 67.5
Sub Panamax (2,500teu) 36.5 36.5 0.0% 26.0 31.1 36.5
Feeder (1,700teu) 28.0 28.0 0.0% 18.6 23.0 28.0
Indicative Wet NB Prices (US$ million) last 5 years
12 Nov 08 Oct ±% Min Avg Max
Tankers
VLCC (300,000dwt) 109.0 108.0 0.9% 80.0 89.5 109.0
Suezmax (160,000dwt) 75.5 74.5 1.3% 53.0 59.4 75.5
Aframax (115,000dwt) 60.0 59.5 0.8% 43.0 48.7 60.0
LR1 (75,000dwt) 55.0 54.5 0.9% 42.0 46.0 55.0
MR (56,000dwt) 41.5 40.5 2.5% 32.5 35.2 41.5
Gas
LNG 175k cbm 199.0 199.0 0.0% 180.0 187.9 201.3
LPG LGC 80k cbm 78.0 78.0 0.0% 70.0 71.8 78.0
LPG MGC 55k cbm 70.0 70.0 0.0% 62.0 63.9 70.0
LPG SGC 25k cbm 47.5 47.5 0.0% 40.0 42.7 47.5
Type Units Shipbuilder Price Buyer Delivery Comments
BULKER 2 210,000 dwt COSCO Yangzhou, China $ 63.5m Zhejiang Xieha, China 2023
BULKER 3 82,000 dwt Jiangsu Hantong, China $ 34.0m Nisshin Shipping, Japan 2024 Tier III, EEDI Phase 2
BULKER 1 64,000 dwt Imabari, Japan N/A Densay Shipping, Turkey 2023
TANKER 4 25,000 dwt CMJL Yangzhou, China N/A CMB, Belgium 2023/2024
CONT 4 2,900 teu Fujian Mawei, China $ 37.5m Karnaphuli, Bangladesh 2024
LNG 4 174,000 cbm DMSE, S. Korea $ 210.0m Qatar Petroleum, Qatar 2024
LNG 2 174,000 cbm Samsung, S. Korea $ 210.0m Qatar Petroleum, Qatar 2024
LNG 2 + 2 174,000 cbm DMSE, S. Korea N/A Maran Gas Maritime, Greece 2024
LNG 3 174,000 cbm Hyundai , S. Korea $ 211.0m Capital Gas, Greece 2024
MPP 3 7,800 dwt Wuhu Shipyard, China N/A Langh Ship Oy Ab, Finland 2024
Size

6
Indicative Dry Bulk Values (US$ million)
12 Nov 08 Oct ±% Min Avg Max
Capesize180k dwt Resale 60.50 59.00 2.5% 34.5 47.5 60.5180k dwt 5 year old 46.50 45.00 3.3% 23.0 31.3 46.5170k dwt 10 year old 36.50 35.50 2.8% 12.0 22.0 36.5150k dwt 15 year old 23.50 22.50 4.4% 6.5 13.7 23.5Panamax82k dwt Resale 43.50 40.00 8.8% 22.5 29.9 43.582k dwt 5 year old 35.50 34.50 2.9% 11.5 22.1 35.576k dwt 10 year old 26.00 25.50 2.0% 7.3 14.0 26.074k dwt 15 year old 19.00 18.50 2.7% 3.5 9.2 19.0Supramax62k dwt Resale 39.50 38.00 3.9% 19.0 27.2 39.558k dwt 5 year old 29.50 29.50 0.0% 11.0 17.3 29.556k dwt 10 year old 23.50 23.50 0.0% 6.0 12.6 23.552k dwt 15 year old 17.50 16.50 6.1% 3.5 8.3 17.5Handysize37k dwt Resale 30.50 30.50 0.0% 17.0 22.3 30.537k dwt 5 year old 26.00 25.50 2.0% 7.8 15.2 26.032k dwt 10 year old 18.00 17.50 2.9% 6.0 9.8 18.028k dwt 15 year old 11.50 11.50 0.0% 3.5 5.9 11.5
last 5 years
08th - 14th November 2021
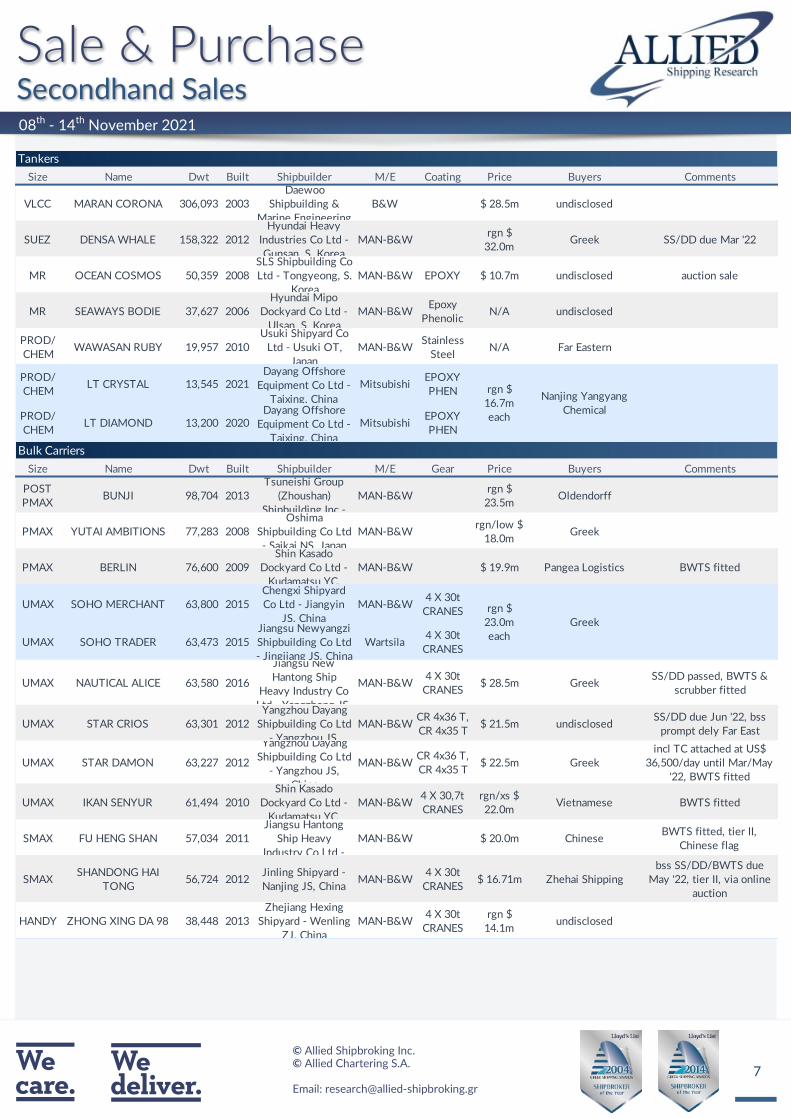
On the dry bulk side, the SnP market returned to vivid tone as of the
past week, giving a fresh boost to transactions coming to light during
the same time frame. This came seemingly at a time of considerable
pressure being felt in freight earnings, leaving a feeling that buying
appetite could be on the wain. Yet despite this we are still seeing a
strong level of fresh buying interest flowing into the market and
keeping asset prices still buoyant for the time being. Notwithstand-
ing this, it would not be a surprise if we were to witness a “wait and
see” attitude emerge soon, dampening activity moving forward.
On the tanker side, it was a rather interesting week in terms of activ-
ity taking place. It is true, that the recent upward trend noted on the
side of earnings has somehow boosted overall expectations for a
firmer SnP market in the near term, both in terms of volume and
asset price levels. However, it will take some time, before we start to
see any indication of this reflected in transactions taking place.
+3%+11%
+16%
+72%
0%
10%
20%
30%
40%
50%
60%
70%
80%
1 month diff 3 months diff6 months diff 12 months diff
+3%
+13%
+27%
+54%
0%
10%
20%
30%
40%
50%
60%
1 month diff 3 months diff6 months diff 12 months diff
+0%+7%
+31%
+84%
0%
10%
20%
30%
40%
50%
60%
70%
80%
90%
1 month diff 3 months diff6 months diff 12 months diff
+2%
+11%
+27%
+73%
0%
10%
20%
30%
40%
50%
60%
70%
80%
1 month diff 3 months diff6 months diff 12 months diff
+0%
-3%
+0%
+8%
-4%
-2%
0%
2%
4%
6%
8%
10%
1 month diff 3 months diff6 months diff 12 months diff
+0%
-2%
+2%
+8%
-4%
-2%
0%
2%
4%
6%
8%
10%
1 month diff 3 months diff6 months diff 12 months diff
+0% +0% +0%
+19%
0%
5%
10%
15%
20%
25%
1 month diff 3 months diff6 months diff 12 months diff
+0% +0%
+2%
+8%
0%
1%
2%
3%
4%
5%
6%
7%
8%
1 month diff 3 months diff6 months diff 12 months diff
Indicative Tanker Values (US$ million)
12 Nov 08 Oct ±% Min Avg Max
VLCC310k dwt Resale 100.00 98.00 2.0% 82.0 91.6 106.0310k dwt 5 year old 70.50 70.50 0.0% 60.0 68.2 83.0250k dwt 10 year old 46.50 46.50 0.0% 38.0 45.9 58.0250k dwt 15 year old 33.50 33.50 0.0% 21.5 30.2 40.0Suezmax160k dwt Resale 70.00 68.00 2.9% 54.0 62.5 72.0150k dwt 5 year old 48.50 48.50 0.0% 40.0 47.1 62.0150k dwt 10 year old 32.50 32.50 0.0% 25.0 32.1 44.5150k dwt 15 year old 18.00 18.00 0.0% 16.0 19.4 24.0Aframax110k dwt Resale 57.00 56.00 1.8% 43.5 49.6 57.0110k dwt 5 year old 40.50 40.50 0.0% 29.5 35.6 47.5105k dwt 10 year old 26.50 26.50 0.0% 18.0 23.5 32.5105k dwt 15 year old 16.50 16.50 0.0% 11.0 14.4 21.0MR52k dwt Resale 39.00 39.00 0.0% 33.0 36.6 40.052k dwt 5 year old 28.50 28.50 0.0% 23.0 26.9 31.045k dwt 10 year old 18.00 18.00 0.0% 14.5 17.9 21.045k dwt 15 year old 11.50 11.50 0.0% 9.0 11.0 13.5
last 5 years
7
08th - 14th November 2021
Size Name Dwt Built Shipbuilder M/E Coating Price Buyers Comments
VLCC MARAN CORONA 306,093 2003
Daewoo
Shipbuilding &
Marine Engineering
B&W $ 28.5m undisclosed
SUEZ DENSA WHALE 158,322 2012
Hyundai Heavy
Industries Co Ltd -
Gunsan, S. Korea
MAN-B&Wrgn $
32.0mGreek SS/DD due Mar '22
MR OCEAN COSMOS 50,359 2008
SLS Shipbuilding Co
Ltd - Tongyeong, S.
Korea
MAN-B&W EPOXY $ 10.7m undisclosed auction sale
MR SEAWAYS BODIE 37,627 2006
Hyundai Mipo
Dockyard Co Ltd -
Ulsan, S. Korea
MAN-B&WEpoxy
PhenolicN/A undisclosed
PROD/
CHEMWAWASAN RUBY 19,957 2010
Usuki Shipyard Co
Ltd - Usuki OT,
Japan
MAN-B&WStainless
SteelN/A Far Eastern
PROD/
CHEMLT CRYSTAL 13,545 2021
Dayang Offshore
Equipment Co Ltd -
Taixing, China
MitsubishiEPOXY
PHEN
PROD/
CHEMLT DIAMOND 13,200 2020
Dayang Offshore
Equipment Co Ltd -
Taixing, China
MitsubishiEPOXY
PHEN
Size Name Dwt Built Shipbuilder M/E Gear Price Buyers Comments
POST
PMAXBUNJI 98,704 2013
Tsuneishi Group
(Zhoushan)
Shipbuilding Inc -
MAN-B&Wrgn $
23.5mOldendorff
PMAX YUTAI AMBITIONS 77,283 2008
Oshima
Shipbuilding Co Ltd
- Saikai NS, Japan
MAN-B&Wrgn/low $
18.0mGreek
PMAX BERLIN 76,600 2009
Shin Kasado
Dockyard Co Ltd -
Kudamatsu YC,
MAN-B&W $ 19.9m Pangea Logistics BWTS fitted
UMAX SOHO MERCHANT 63,800 2015
Chengxi Shipyard
Co Ltd - Jiangyin
JS, China
MAN-B&W4 X 30t
CRANES
UMAX SOHO TRADER 63,473 2015
Jiangsu Newyangzi
Shipbuilding Co Ltd
- Jingjiang JS, China
Wartsila4 X 30t
CRANES
UMAX NAUTICAL ALICE 63,580 2016
Jiangsu New
Hantong Ship
Heavy Industry Co
Ltd - Yangzhong JS,
MAN-B&W4 X 30t
CRANES$ 28.5m Greek
SS/DD passed, BWTS &
scrubber fitted
UMAX STAR CRIOS 63,301 2012
Yangzhou Dayang
Shipbuilding Co Ltd
- Yangzhou JS,
MAN-B&WCR 4x36 T,
CR 4x35 T$ 21.5m undisclosed
SS/DD due Jun '22, bss
prompt dely Far East
UMAX STAR DAMON 63,227 2012
Yangzhou Dayang
Shipbuilding Co Ltd
- Yangzhou JS,
China
MAN-B&WCR 4x36 T,
CR 4x35 T$ 22.5m Greek
incl TC attached at US$
36,500/day until Mar/May
'22, BWTS fitted
UMAX IKAN SENYUR 61,494 2010
Shin Kasado
Dockyard Co Ltd -
Kudamatsu YC,
MAN-B&W4 X 30,7t
CRANES
rgn/xs $
22.0mVietnamese BWTS fitted
SMAX FU HENG SHAN 57,034 2011
Jiangsu Hantong
Ship Heavy
Industry Co Ltd -
MAN-B&W $ 20.0m ChineseBWTS fitted, tier II,
Chinese flag
SMAXSHANDONG HAI
TONG56,724 2012
Jinling Shipyard -
Nanjing JS, ChinaMAN-B&W
4 X 30t
CRANES$ 16.71m Zhehai Shipping
bss SS/DD/BWTS due
May '22, tier II, via online
auction
HANDY ZHONG XING DA 98 38,448 2013
Zhejiang Hexing
Shipyard - Wenling
ZJ, China
MAN-B&W4 X 30t
CRANES
rgn $
14.1mundisclosed
Tankers
Bulk Carriers
Nanjing Yangyang
Chemical
rgn $
16.7m
each
Greek
rgn $
23.0m
each

8
08th - 14th November 2021
HANDY ORIENT TRAIL 33,762 2011 Samjin Shipbuilding
Industries Co Ltd -
Weihai SD, China
MAN-B&W4 X 35t
CRANES
HANDY ORIENT TRADER 33,757 2010 Samjin Shipbuilding
Industries Co Ltd -
Weihai SD, China
MAN-B&W4 X 35t
CRANES
HANDY ORIENT TIGER 33,755 2011 Samjin Shipbuilding
Industries Co Ltd -
Weihai SD, China
MAN-B&W4 X 35t
CRANES
HANDY ORIENT TRANSIT 33,755 2010 Samjin Shipbuilding
Industries Co Ltd -
Weihai SD, China
MAN-B&W4 X 35t
CRANES
HANDY ORIENT ACCORD 33,755 2010 Samjin Shipbuilding
Industries Co Ltd -
Weihai SD, China
MAN-B&W4 X 35t
CRANES
HANDY LAKE DANY 28,358 2008
Shimanami Shipyard
Co Ltd - Imabari EH,
Japan
MAN-B&W4 X 30,5t
CRANES$ 11.0m Cetragpa old sale
Type Name Dwt Built Shipbuilder M/E Gear Price Buyers Comments
General
CargoDIAMOND LAND 35,040 2004
Jiangdu Yahai
Shipbuilding Co Ltd
- Jiangdu JS, China
SulzerCR 4x40 T,
CR 4x35 T$ 15.8m undisclosed
Size Name TEU Built Shipbuilder M/E Gear Price Buyers Comments
SUB
PMAXCORONADO BAY 2,578 2008
Xiamen
Shipbuilding
Industry Co Ltd -
Wartsila3 X 45t
CRANES$ 40.0m
SUB
PMAXGLACIER BAY 2,578 2009
Xiamen
Shipbuilding
Industry Co Ltd -
Wartsila3 X 45t
CRANES$ 40.0m
undisclosed
Gen. Cargo
Containers
Union Maritime$ 72.0m
en bloc

9
The ship recycling market continued to move at “moderate activity”
levels, with tanker units still holding center stage. The longer the
anticipated market rebound takes to emerge, the more interest is
expected to arise for retiring vintage tanker units, as the liquidity
drain worsens for owners. On the other hand, despite the recent
correction noted in the dry bulk market, we do not expect an in-
creased interest to scrap units to emerge anytime soon, as freight
rate levels and sentiment are still at considered high levels. In Bang-
ladesh, the level of buying interest is still holding firm, despite the
fact that reported businesses may not be as impressive of late. Ro-
bust offered prices are maintaining interest at firm levels, with
scrapyards focusing mainly on larger LDT units. In India, the Diwali
holidays trimmed potential businesses in the country, albeit activity
is considered improved compared to the average noted in the previ-
ous quarter. HKC deals continue to be the main stream of activity
flow for domestic players, with scrap prices though being at slightly
less attractive levels here. Finally, Pakistan has start to attract poten-
tial scrap candidates once again, given the strong fundamentals and
the strong appetite shown by domestic breakers. It is expected that
activity in the country will ramp up over the coming weeks.
08th - 14th November 2021
Reported Transactions
150
250
350
450
550
650Bangladesh India Pakistan China Turkey
US$/ldt
150
250
350
450
550
650
Bangladesh India Pakistan China Turkey
US$/ldt
Indicative Wet Prices ($/ldt) last 5 years
12 Nov 05 Nov ±% Min Avg Max
Indian Sub Continent
Bangladesh 620 620 0.0% 245 407 620
India 600 600 0.0% 250 399 600
Pakistan 610 610 0.0% 245 403 610
Far East Asia
China - - 120 217 300
Mediterranean
Turkey 320 320 0.0% 150 247 320
Indicative Dry Prices ($/ldt) last 5 years
12 Nov 05 Nov ±% Min Avg Max
Indian Sub Continent
Bangladesh 610 610 0.0% 220 391 610
India 590 590 0.0% 225 384 590
Pakistan 600 600 0.0% 220 387 600
Far East Asia
China - - 110 202 290
Mediterranean
Turkey 310 310 0.0% 145 237 310
Type Vessel's Name Dwt Built Country Built Ldt US$/ldt Buyer Sale Comments
Tanker OMAN PRIDE 299,986 1998 Japan 38,959 $ 527/Ldt Pakistani as is Oman
Bulker BERGE KANGCHENJUNGA 263,237 1994 Japan 33,703 $ 630/Ldt undisclosedAs is Singapore, incl. bunkers for voyage to demo
location
Tanker NAVION ANGLIA 126,749 1999 Spain 26,475 N/A Turkish
Tanker OCEAN WINNER 37,224 2002 S. Korea 8,750 N/A undisclosed
Gas RAMAGAS 16,137 1989 Germany 6,694 $ 680/Ldt Indian
Tanker YUHUA STAR 16,026 1997 Japan 4,603 N/A Indian High solid stainless steel content
Tanker NORVARG 1,063 1980 Norway 828 N/A Turkish

10
0102030405060708090
08th - 14th November 2021
US Dollar per Euro Yen per US Dollar
Iron Ore (TSI) Coal Price Index
Yuan per US Dollar US Dollar INDEX
Oil WTI $ Oil Brent $
UK shipping fund Tufton Oceanic Assets has another $39m to spend
on vessel acquisitions after selling out an over-subscribed tap issue of
new shares. The London-listed company said on 4 November that it
was launching an offer to capitalise on attractive sale-and-purchase
opportunities.
Tufton has now revealed 28.05m shares were sold at $1.39 each. "The
tap issue was well supported by new and existing shareholders and
was materially oversubscribed," the shipowner said. Demand for stock
was above the authority granted by shareholders earlier this year for
the sale of up to 10% of the equity. Key staff and affiliates of invest-
ment manager Tufton Investment Management have been allocated
671,567 shares.
Tufton brought in joint brokers Hudnall Capital and Singer Capital
Markets to run a bookbuilding process for the issue. The sale price
was a 1.4% discount to the closing price of $1.41 on 3 November. This
was also a 3.1% premium to its net asset value on 30 September of
$1.35. Source: Tradewinds
1.00
1.05
1.10
1.15
1.20
1.25
95.00
100.00
105.00
110.00
115.00
120.00
6.00
6.10
6.20
6.30
6.40
6.50
6.60
6.70
85.00
87.00
89.00
91.00
93.00
95.00
97.00
65.0085.00
105.00125.00145.00165.00185.00205.00225.00245.00
30.00
80.00
130.00
180.00
230.00
280.00
-40.00
-20.00
0.00
20.00
40.00
60.00
80.00
100.00
12 Nov 08 Oct ±% Min Avg Max
Markets
10year US Bond 1.58 1.61 -1.4% 0.83 1.36 1.75
S&P 500 4,682.9 4,391.3 6.6% 3,537 4,109 4,702
Nasdaq 15,861.0 14,579.5 8.8% 11,710 13,861 15,982
Dow Jones 36,100.3 34,746.3 3.9% 29,080 33,110 36,432
FTSE 100 7,347.9 7,095.6 3.6% 6,266 6,885 7,384
FTSE All-Share UK 4,194.9 4,046.7 3.7% 3,543 3,918 4,212
CAC40 7,091.4 6,560.0 8.1% 5,363 6,179 7,091
Xetra Dax 16,094.1 15,206.1 5.8% 13,053 14,817 16,094
Nikkei 29,610.0 28,048.9 5.6% 25,386 28,589 30,670
Hang Seng 25,328.0 24,837.9 2.0% 23,966 27,570 31,085
DJ US Maritime 191.4 170.7 12.2% 142.3 191.2 229.7
Currencies
$ per € 1.14 1.16 -1.0% 1.14 1.19 1.23
$ per ₤ 1.34 1.36 -1.7% 1.32 1.38 1.42
₤ per € 0.85 0.85 0.7% 0.84 0.87 0.92
¥ per $ 114.1 111.8 2.1% 102.9 108.5 114.4
$ per Au$ 0.73 0.73 -0.2% 0.71 0.76 0.80
$ per NoK 0.12 0.12 -1.7% 0.00 0.12 0.12
$ per SFr 0.92 0.93 -0.6% 0.88 0.91 0.94
Yuan per $ 6.39 6.45 -0.9% 6.37 6.48 6.62
Won per $ 1,180.6 1,193.2 -1.1% 1,084.3 1,132.9 1,197.6
$ INDEX 95.1 94.1 1.1% 89.4 91.8 95.2
Commoditites
Gold $ 1,847.5 1,753.6 5.4% 1,673.3 1,794.3 1,938.4
Oil WTI $ 79.8 78.6 1.5% 40.1 63.1 83.4
Oil Brent $ 81.3 82.0 -0.9% 42.6 65.9 85.4
Palm Oil - - - 562.0 562.0 562.0
Iron Ore 94.4 125.1 -24.5% 92.0 165.8 233.1
Coal Price Index 139.0 222.0 -37.4% 69.5 119.5 247.0
White Sugar 515.5 519.5 -0.8% 390.5 458.9 647.4
last 12 months

11
AERAKIS GEORGEMOBILE: +30 6946 04 57 37
BOLIS ILIASMOBILE: +30 6937 02 65 00
DASKALAKIS GEORGEMOBILE: +30 6932 24 80 07
DRAKOGIANNOPOULOS SAKISMOBILE: +30 6944 88 58 08
FRANGOS HARRISMOBILE: +30 6936 57 67 00
KLONIZAKIS JOHNMOBILE: +30 6948 50 55 81
KOSTOYANNIS JOHNMOBILE: +30 6932 43 39 99
KOUKOUMIALOS ZANNISMOBILE: +30 6978 15 17 55
MANOLAS NIKOLASMOBILE: +30 6940 63 22 56
MOISSOGLOU THEODOROSMOBILE: +30 6932 45 52 41
PAPAIOANNOU ANTONISMOBILE: +30 6936 54 80 22
PAPOUIS THASSOSMOBILE: +30 6944 29 49 89
PITHIS ALEXISMOBILE: +30 6970 86 33 77
PRACHALIAS ARGIRISMOBILE: +30 6947 62 82 62
STASSINAKIS JOHNMOBILE: +30 6972 60 92 09
TSALPATOUROS COSTISMOBILE: +30 6932 20 15 63
VARVAROS PLUTONMOBILE: +30 6937 25 15 15
Maritime Research & ValuationsCHASAPIS THOMAS
MOBILE: +30 6947 82 91 72LAZARIDIS GEORGE
MOBILE: +30 6946 95 69 40VAMVAKAS YIANNIS
MOBILE: +30 6942 94 71 87
Sale & Purchase
ALLIED SHIPBROKING INC. 48, Aigialeias Street, 4th Floor, Maroussi 151 25, Greece Tel: +30 210 45 24 500 Fax: +30 210 45 25 017/ 019 E-mail: [email protected]
ALLIED CHARTERING S.A. 48, Aigialeias Street, 4th Floor, Maroussi 151 25, Greece Tel : +30 210 42 88 100 Fax: +30 210 45 24 201
E-mail: [email protected]
E-mail: [email protected]
08th - 14th November 2021 | Week 45
ALEXOPOULOS PANOS MOBILE: +30 6944 34 66 15
FLOURIS DIMITRISMOBILE: +30 6937 81 32 39
KAILAS VAGGELISMOBILE: +30 6942 48 05 69
KANELLOS DIMITRIS MOBILE: +30 6945 07 47 85
KARAMANIS COSTASMOBILE: +30 6941 54 14 65
PATELIS DIMITRIS MOBILE: +30 6944 04 43 61
THEODOTOS ARISTOFANIS MOBILE: +30 6951 79 82 89
TSALPATOUROU ANASTASIAMOBILE: +30 6951 79 82 91
TSALPATOUROU MARGARITA MOBILE: +30 6934 74 22 16
TSOLAKIDI SONIAMOBILE: +30 6942 65 66 51
TZOTZOLI ATHANASIAMOBILE: +30 6955 48 19 08
Tanker CharteringFLOURIS JOHN
MOBILE: +30 6955 80 15 03 IALAIA ARIADNE
MOBILE: +30 6949 16 71 40KATERINIOS MICHAEL
MOBILE: +30 6981 13 66 23STERGIOPOULOS ALEXANDROS
MOBILE: +30 6951 79 82 91
Dry Cargo Chartering
12
Disclaimer
The information contained within this report has been provided by Allied Shipbroking Inc. and Allied Chartering S.A. for general information
purposes.
All the information is compiled through Allied Shipbroking Inc. and Allied Chartering S.A. databases, as well as from other market sources. De-
spite having taken reasonable care in the gathering, filtering and auditing of this information and believing that the information is accurate and
correct, it may still contain errors, as a lot of the views regarding market levels are partially derived from estimates and/or subject judgments
while the reported transaction activity is gathered from several sources and rumors, some of which are sometimes hard to validate in full their
accuracy and truthfulness. As such we advise that the information be taken cautiously, while advising that this information does not obviate the
need to also make further enquiries and seek further information in order to obtain a more accurate outlook. As we make no warranties of any
kind, both expressed or implied, as to the completeness, accuracy, reliability or completeness of the information herein, Allied Shipbroking Inc.
and its connected persons shall not be held liable to any loss or damage of any kind, including direct, indirect and/or consequential damages
caused by negligence of any kind on our part.
Any choice to rely on this information provided is strictly at the recipient’s own risk.
This report and its information is confidential and solely for the internal use of its recipients, while any re-production or re-distribution of the
report and its material is strictly prohibited without prior permission from Allied Shipbroking Inc.
If you wish to subscribe to this or any other report we produce, please contact us directly.
Appendix
Aggregate Price Index quoted on the first page for both Newbuilding and Secondhand relates to the current average prices levels compared to
where they stood at 1st January 2010 (i.e. index 100 = 01/01/2010)
Demolition market average price index refers to the combination of the average prices currently offered in the Indian Sub-Continent, Far East
and Mediterranean.
Period rates currently relate to Capesize of 180,000dwt, Panamax of 76,000dwt, Supramax of 56,000dwt and Handysize of 33,000dwt on the
Dry Bulk side and VLCC of 250,000dwt, Suezmax of 150,000dwt, Aframax of 115,000dwt and MR of 52,000dwt on the Tankers side respec-
tively.
In terms of Secondhand Asset Prices their levels are quoted based on following description:
All vessels built to European specifications by top Japanese shipbuilders, with dwt size based on the below table.
08th - 14th November 2021 | Week 45
Resale 5 year old 10 year old 15 year old
Capesize 180,000dwt 180,000dwt 170,000dwt 150,000dwt
Panamax 82,000dwt 82,000dwt 76,000dwt 74,000dwt
Supramax 62,000dwt 58,000dwt 56,000dwt 52,000dwt
Handysize 37,000dwt 32,000dwt 32,000dwt 28,000dwt
VLCC 310,000dwt 310,000dwt 250,000dwt 250,000dwt
Suezmax 160,000dwt 150,000dwt 150,000dwt 150,000dwt
Aframax 110,000dwt 110,000dwt 105,000dwt 95,000dwt
MR 52,000dwt 45,000dwt 45,000dwt 45,000dwt