november 13 2017 i industry research man made fibres … 2017.pdfdisclaimer: this report is prepared...
TRANSCRIPT

Overview
India is the second largest producer of Manmade Fibre (MMF)
and Filaments globally after China, with production of around
2,523 million kgs in 2016-17, increasing only marginally after
declining for the past five years. However, domestic MMF
demand remained subdued in FY17 on account of slower pick up
led by demonetisation and higher availability of cotton
(substitute) with competitive prices in the domestic market during
the year. Nonetheless, exports of MMF rose by close to 15% y-o-y
due to rising share in key polyester destination countries.
Today, the Indian textile and apparel industry contributes about
14% to industrial production (in value terms) and approximately
4% to the country’s GDP. The industry is the second largest
employer after agriculture, employing over 45 million people
directly and over 65 million people indirectly.
Outlook:
The domestic consumption of MMF contracted by a CAGR of
5.1% over the last 5 years (FY13 – FY17). However, in FY17 the
consumption witnessed a higher decline of 7.5% y-o-y.
MMF industry has been going through a lean phase for the last 5
fiscals. In FY17, factors such as sluggish demand, higher imports,
rigid competition from cotton yarn, fall in realisations and
temporary loss of production on account of demonetisation
weighed down on the industry. However, the domestic economy
is on a revival path and is expected to improve going forward.
Therefore, in the short to medium term, CARE Ratings expects
MMF consumption to remain relatively stable. With an overall
improvement in global economy, increased demand for
technical textiles and constrained cotton availability in the long
term, we expect polyester consumption to register a gradual
pick up. Also, with downward revision in GST rates from 18% to
12% in October 2017 and increase in import duties on various
synthetic yarns and fibres, the domestic industry is expected to
remain competitive vis-à-vis global players.
November 13 2017 I Industry Research
Man Made Fibres (MMF) –
Structure & Prospects
Contact: Madan Sabnavis Chief Economist [email protected] 91-22-67543489
Darshini Kansara
Research Analyst [email protected] 91-22-6754 3679
Mradul Mishra
[email protected] 91-022-6754 3515
Disclaimer: This report is prepared by CARE Ratings Ltd. CARE
Ratings has taken utmost care to ensure accuracy and objectivity
while developing this report based on information available in
public domain. However, neither the accuracy nor completeness of
information contained in this report is guaranteed. CARE Ratings is
not responsible for any errors or omissions in analysis/ inferences/
views or for results obtained from the use of information contained
in this report and especially states that CARE Ratings has no
financial liability whatsoever to the user of this report.

Industry Research I Man Made Fibres
2
Overview
Man-made Fibres (MMF) are synthetically produced using fibre-forming chemical substances. It is a fibre in which the
basic chemical units have been formed by chemical synthesis followed by fibre formation. Products that fall under the
MMF category can be broadly classified into Synthetic Fibre/Yarn & Cellulosic Fibre/Yarn. Within the Synthetic Fibre/Yarn
segment, Indian players manufacture products like Polyester Staple Fibre (PSF), Polyester Filament Yarn (PFY), Nylon
Filament Yarn (NFY) and Acrylic Staple Fibre (ASF) and under the Cellulosic Fibre/Yarn segment, predominantly Viscose
Staple Fibre (VSF), Viscose Filament Yarn (VFY) etc.
The domestic MMF industry mainly comprises of two components i.e., polyester and viscose, which together accounts for
about 94% (in volume terms). Under this, polyester accounts for about 83% while viscose accounts for the remaining
share. MMF is primarily used to produce 100% non-cotton fabrics and blended fabrics, which are in turn used in
readymade garments, home textiles and other industrial textiles.
Chart 1: MMF Value chain
Source: CARE Ratings
In FY17, the market size in volume terms of domestic MMF industry stood at 2,523 million kgs. While the domestic
demand remained subdued, the exports of MMF registered a sharp 15% growth in FY17. Going ahead, the demand for
MMF
Synthetic Fibre
Polyester
Polyester Staple Fibre (PSF)
Polyester Filament Yarn
(PFY)
Acrylic
Acrylic Staple Fibre
Others (Nylon, Olefin, etc)
Cellulose Fibre
Rayon
Viscose
Viscose Staple Fibre (VSF)
Viscose Filament Yarn (VFY)
Others
Other (Acetate & Triacetate)

Industry Research I Man Made Fibres
3
MMF from the textile sector will largely be driven by the growing usage of blended fabrics to meet the augmented
demand for the apparels, home textiles and technical textiles.
Chart 2: MMF Production & Consumption (Million kgs) Chart 3: MMF Imports & Exports (Million Kgs)
Source: Office of Textile Commissioner
Polyester Overview Polyester is a term often defined as “long-chain polymers chemically composed of at least 85% by weight of an ester,
dihydric alcohol and a terephthalic acid”. The first polyester fibre was introduced in 1941. Since then the usage of
polyester fibre has grown more rapidly compared to any other MMF. The unique physical properties of polyester like
strength, high elasticity and durability are some of the key reasons for the growth of polyester. The most popular and one
of the earliest uses of polyester were to make polyester suit in the 70s. Polyester was also used to make ropes used in
different industries. Nowadays, polyester is being used for a variety of applications. PET bottles are today one of the most
popular uses of polyester apart from textiles. Polyester being a direct substitute for cotton, any price change in cotton fibre
has a direct impact on the polyester demand.
Characteristics
Polyester fabrics and fibres are extremely strong and durable compared to natural fibre.
It is resistant to most chemicals, wrinkle-free and abrasion resistant.
Polyester is hydrophobic which gives it a quick drying property. Hollow polyester fibres can be used for insulation.
Polyester retains its shape and hence is good for making outdoor clothing for harsh climates.
Uses of polyester
Garmenting: Polyester is used in the manufacturing of various kinds of apparels and home furnishings like
bedspreads, sheets, pillows, furniture, carpets and curtains.
Insulation: Polyester is an ideal fabric for insulation as a fibre fill because it retains its shape over a long period of
time. Cotton and wool tend to flatten over a period of time and loose the warming effect.
Industrial Use:
2,6
34
2,6
00
2,5
92
2,5
11
2,5
23
2,0
73
1,9
33
1,9
48
1,8
16
1,6
79
-
500
1,000
1,500
2,000
2,500
3,000
FY13 FY14 FY15 FY16 FY17 (P)
Production Consumption
11
6
13
6
18
1
20
1
19
5
68
3 8
21
81
4
90
0
1,0
34
-
200
400
600
800
1,000
1,200
FY13 FY14 FY15 FY16 FY17 (P)
Imports Exports

Industry Research I Man Made Fibres
4
PET: Other than yarns and fibre, polyester is also used to make the plastic bottles that store beverages. Being
shatterproof and cheap, PET bottles are widely used in the beverages industry
Mylar: An unusual and little known use of polyester is in the manufacturing of balloons (decorated ones that
are gifted on special occasions). Such balloons are made of Mylar – a kind of polyester film manufactured by
DuPont or a composite of Mylar and aluminium foil.
Miscellaneous: Polyester is also used to manufacture high-strength ropes, thread, hoses, sails, floppy disk
liners, power belting etc.
A. Polyester Staple Fibre (PSF)
Overview
Polyester staple fiber (PSF) is a material produced from synthetic chemical compounds with a variety of uses in the textile,
automotive and furniture industries. Polyester staple fiber resists wrinkles, mildew, general surface damage and most
chemicals. This material also holds creases and pleats well, as long as they have been heat-set first. Polyester Staple Fibre
(PSF) has emerged as the fastest-growing fibre amongst all types of manufactured fibres. Polyester Staple Fibre (PSF) is
produced directly from Purified Terephthalic Acid (PTA) and Mono Ethylene Glycol (MEG).
Polyester staple fibers work well in home furnishings which include carpets, upholstery, curtains and sheets. Polyester
fiberfill is often used inside pillows and furniture as stuffing. Hoses, ropes and nets, thread, tire cord and sails on ships are
all made with polyester fibers, which are regularly combined with other materials to add new properties.
On basis of its properties, PSF can be broadly classified as Solid or Hollow Polyester staple fibre. Depending on the lustre,
PSF can be classified as Semi Dull or Bright. By mixing colour master-batch, dope dyed PSF can also be obtained in Optical
White, Black and several other colours. PSF is mainly produced in China, India, Taiwan, Indonesia, Vietnam, Malaysia and
Korea.
PSF formed around 35% of total man made textiles in FY17. Demand for PSF is mainly influenced by the comparative prices
of cotton and PSF, and their relative availability.
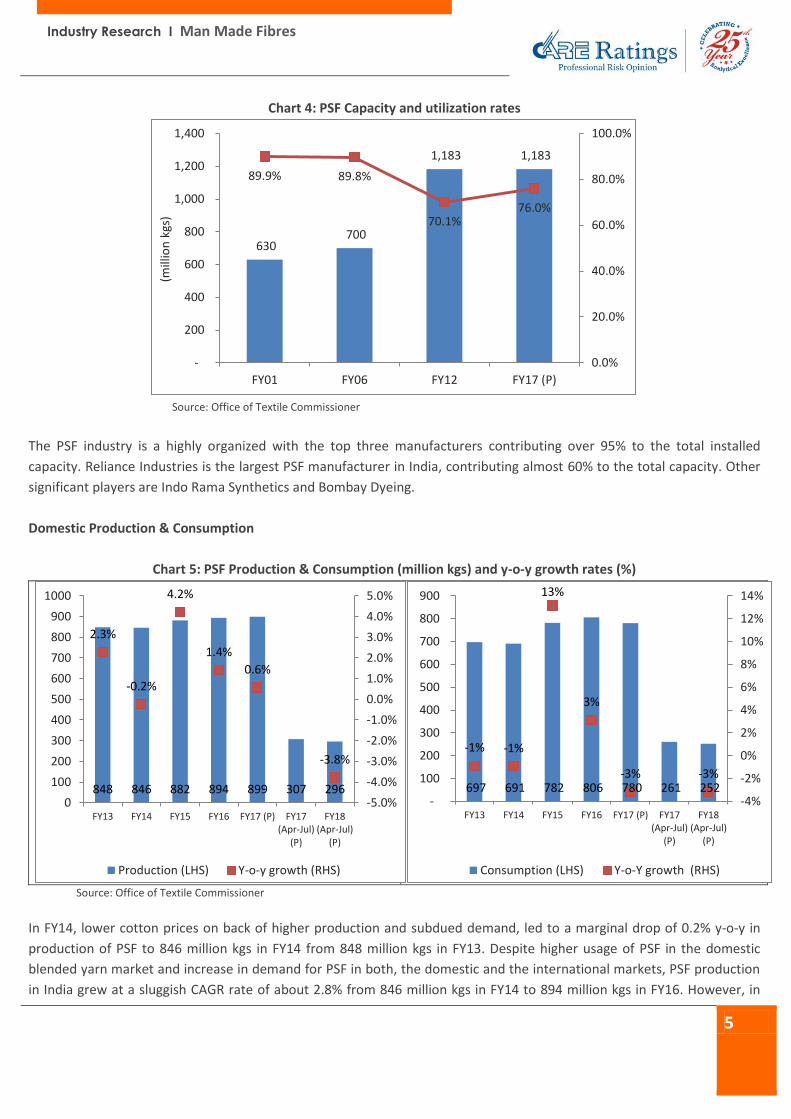
Capacity
The PSF capacity in India has increased from 700 thousand tonnes in FY06 to 1,183 thousand tonnes in FY12 registering a
CAGR of about 9.1%. Capacity has been maintained at that level since then to FY17. The majority of capacity addition
during the period was witnessed during FY07 with Reliance Industries and Indo Rama Synthetic being the main contributor
towards the incremental capacity. The sharp growth in the installed capacity of PSF can be attributed to the limited
availability of cotton, firm cotton prices and increased blending by spinning mills. Post FY06, the industry capacity has
almost doubled on account of higher cotton prices and consequently higher off-take of synthetic fibres as compared to
cotton fibres.
Industry Research I Man Made Fibres
5
Chart 4: PSF Capacity and utilization rates
Source: Office of Textile Commissioner
The PSF industry is a highly organized with the top three manufacturers contributing over 95% to the total installed
capacity. Reliance Industries is the largest PSF manufacturer in India, contributing almost 60% to the total capacity. Other
significant players are Indo Rama Synthetics and Bombay Dyeing.
Domestic Production & Consumption
Chart 5: PSF Production & Consumption (million kgs) and y-o-y growth rates (%)
Source: Office of Textile Commissioner
In FY14, lower cotton prices on back of higher production and subdued demand, led to a marginal drop of 0.2% y-o-y in
production of PSF to 846 million kgs in FY14 from 848 million kgs in FY13. Despite higher usage of PSF in the domestic
blended yarn market and increase in demand for PSF in both, the domestic and the international markets, PSF production
in India grew at a sluggish CAGR rate of about 2.8% from 846 million kgs in FY14 to 894 million kgs in FY16. However, in
630 700
1,183 1,183
89.9% 89.8%
70.1% 76.0%
0.0%
20.0%
40.0%
60.0%
80.0%
100.0%
-
200
400
600
800
1,000
1,200
1,400
FY01 FY06 FY12 FY17 (P)
(mill
ion
kgs
)
848 846 882 894 899 307 296
2.3%
-0.2%
4.2%
1.4%
0.6%
-3.8%
-5.0%
-4.0%
-3.0%
-2.0%
-1.0%
0.0%
1.0%
2.0%
3.0%
4.0%
5.0%
0
100
200
300
400
500
600
700
800
900
1000
FY13 FY14 FY15 FY16 FY17 (P) FY17(Apr-Jul)
(P)
FY18(Apr-Jul)
(P)
Production (LHS) Y-o-y growth (RHS)
697 691 782 806 780 261 252
-1% -1%
13%
3%
-3% -3%
-4%
-2%
0%
2%
4%
6%
8%
10%
12%
14%
-
100
200
300
400
500
600
700
800
900
FY13 FY14 FY15 FY16 FY17 (P) FY17(Apr-Jul)
(P)
FY18(Apr-Jul)
(P)
Consumption (LHS) Y-o-Y growth (RHS)

Industry Research I Man Made Fibres
6
FY17, due to higher availability of cotton on back of 4% increase in cotton production post decline for 2 consecutive years,
production of PSF registered only marginal growth of about 0.6% on a y-o-y basis.
Imports & exports
Chart 6: PSF Imports & Exports (million kgs)
Source: Office of Textile Commissioner
Abundant raw material availability and large capacities in the PSF industry enables India to export a large amount of PSF.
After the abolishment of quota regime in 2005, the share of exports to the total PSF production has grown from 7% in FY06
to 24% in FY17. The top export destinations for Indian PSF are USA (20%), Nepal (11%), Bangladesh (9%), Belgium (7%) and
Egypt (5%). On the import front, approximately 12-13% of the PSF demand in India is met through imports as of FY17.
During FY15, Imports registered a sharp 92% increase on back of competitive prices in the international markets and
higher off-take by domestic mills. Post that, in FY16, imports of PSF grew by about 22% y-o-y. However, in FY17, on back of
higher cotton production after 2 consecutive years of lower production, the imports of PSF remained stable. The key
countries exporting PSF to India are China (71%), South Korea (11%), Indonesia (7%), Taiwan (4%) and Thailand (4%).
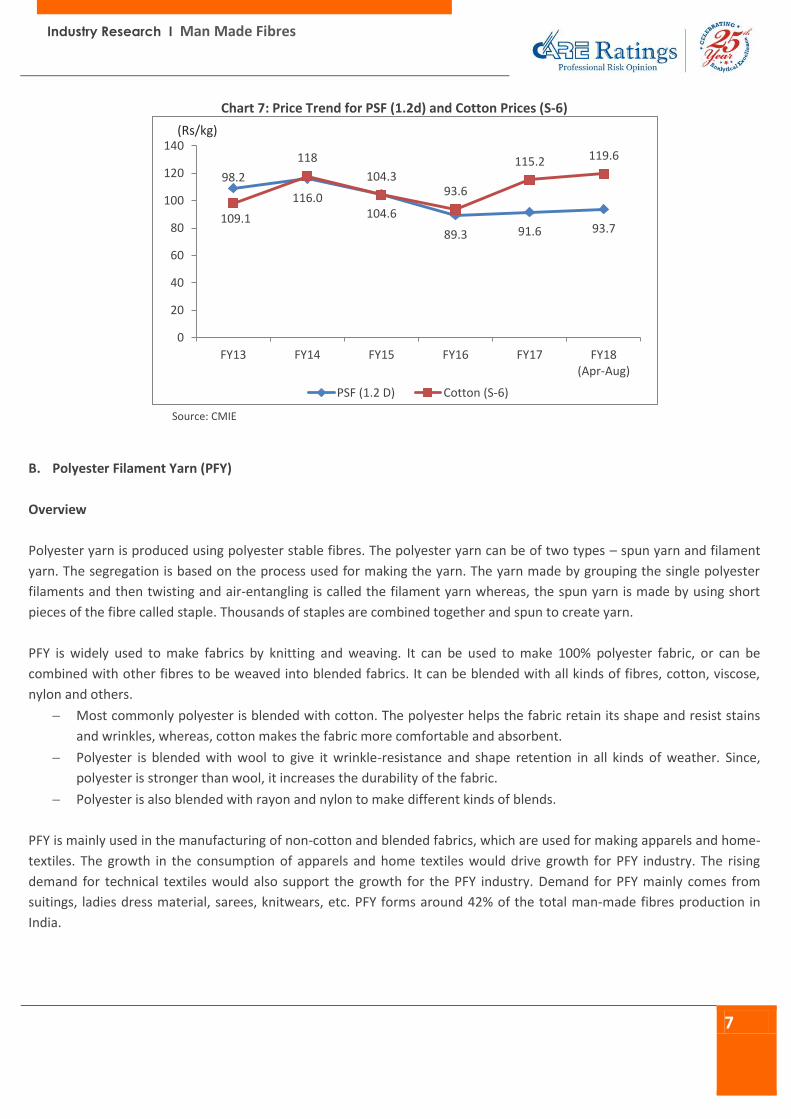
Prices
PSF price registered 6.3% growth in FY14 on back of strong demand from international markets along with domestic
demand post remaining stable in FY13. However, in FY15, prices dropped by close to 10% y-o-y on back of higher
production and over 12% higher availability during the year. Also, the lower international prices led to the downfall in
prices of domestic PSF. In FY16, on account of demand slowdown in the country along with lower demand in the
international markets, especially China, prices further declined by 14.7%, in line with fall in cotton prices. Thereafter, in
FY17, demand for PSF recovered, pulling up the prices to Rs 115.2 per kg from Rs 93.6 per kg in the previous year. This
increase in prices was on account of revival in demand for polyester fibre in the domestic as well as in the international
markets during the year.
30 43
82 100 100
25 31
170
205 184 182
214
70 78
0
50
100
150
200
250
FY13 FY14 FY15 FY16 FY17 (P) FY17(Apr-Jul)
(P)
FY18(Apr-Jul)
(P)Import Export
Industry Research I Man Made Fibres
7
Chart 7: Price Trend for PSF (1.2d) and Cotton Prices (S-6)
Source: CMIE
B. Polyester Filament Yarn (PFY)
Overview
Polyester yarn is produced using polyester stable fibres. The polyester yarn can be of two types – spun yarn and filament
yarn. The segregation is based on the process used for making the yarn. The yarn made by grouping the single polyester
filaments and then twisting and air-entangling is called the filament yarn whereas, the spun yarn is made by using short
pieces of the fibre called staple. Thousands of staples are combined together and spun to create yarn.
PFY is widely used to make fabrics by knitting and weaving. It can be used to make 100% polyester fabric, or can be
combined with other fibres to be weaved into blended fabrics. It can be blended with all kinds of fibres, cotton, viscose,
nylon and others.
Most commonly polyester is blended with cotton. The polyester helps the fabric retain its shape and resist stains
and wrinkles, whereas, cotton makes the fabric more comfortable and absorbent.
Polyester is blended with wool to give it wrinkle-resistance and shape retention in all kinds of weather. Since,
polyester is stronger than wool, it increases the durability of the fabric.
Polyester is also blended with rayon and nylon to make different kinds of blends.
PFY is mainly used in the manufacturing of non-cotton and blended fabrics, which are used for making apparels and home-
textiles. The growth in the consumption of apparels and home textiles would drive growth for PFY industry. The rising
demand for technical textiles would also support the growth for the PFY industry. Demand for PFY mainly comes from
suitings, ladies dress material, sarees, knitwears, etc. PFY forms around 42% of the total man-made fibres production in
India.
109.1
116.0 104.6
89.3 91.6 93.7
98.2
118
104.3 93.6
115.2 119.6
0
20
40
60
80
100
120
140
FY13 FY14 FY15 FY16 FY17 FY18(Apr-Aug)
PSF (1.2 D) Cotton (S-6)
(Rs/kg)

Industry Research I Man Made Fibres
8
Capacity
The PFY industry is relatively fragmented compared to PSF. Reliance Industries, Indorama Synthetics, JBF Industries and
Garden Silk Mills, Bhilosa Industries Pvt Ltd, Wellknown Polyesters Ltd. are the key PFY manufacturers, contributing about
60% of the total installed capacity in India. The remaining share is the unorganized segment, mainly concentrated in
Western India. Surat continues to be the key hub for PFY manufacturing in India.
Chart 8: PFY Capacity & utilization rates
Source: Office of Textile Commissioner
Domestic Production and Consumption
In the last 5 years, PFY production in India consistently declined at a CAGR of 4.7% from 1,288 million kgs in FY13 to 1,060
million kgs in FY17. This can be attributed to fall in consumption of non-cotton fabrics, subdued industrial activities
hampering demand for technical textiles and slowdown in automotive industry that impacted the overall production. In
FY17, production remained largely stable on back of restrained domestic demand. However, demand in international
markets increased by a sharp 19% y-o-y after increasing by about 12% in FY16 and declining by about 2% in FY15 (Refer
Chart 10).
Chart 9: PFY Production & Consumption (million kgs) and y-o-y growth rates (%)
Source: Office of Textile Commissioner
1,128 1,253
2,134 2,103
89.5% 85.8%
64.8%
50.4%
0.0%
20.0%
40.0%
60.0%
80.0%
100.0%
-
500
1,000
1,500
2,000
2,500
FY01 FY06 FY12 FY17 (P)
(Mill
ion
1,2
88
1,2
12
1,1
58
1,0
69
1,0
60
34
4
36
9
-12%
-8%
-4%
0%
4%
8%
12%
-
200
400
600
800
1,000
1,200
1,400
FY13 FY14 FY15 FY16 FY17 (P) FY17(Apr-Jul)
(P)
FY18(Apr-Jul)
(P)
Production (LHS) Y-o-Y Growth (RHS)
93
4
77
3
71
5
57
5
46
0
14
6
19
7
-30%
-20%
-10%
0%
10%
20%
30%
40%
-
200
400
600
800
1,000
FY13 FY14 FY15 FY16 FY17 (P) FY17(Apr-Jul)
(P)
FY18(Apr-Jul)
(P)
Consumption (LHS) Y-o-Y Growth (RHS)

Industry Research I Man Made Fibres
9
The domestic consumption of PFY through the period FY13 to FY17 registered a drop of CAGR of 16.2% from 934 million
kgs to 460 million kgs. In the last five years, consumption of PFY in the domestic market declined on account of fall in
consumption of non-cotton fabrics, technical textile leading to slower off-take of PFY. However, in FY18 (Apr-Jul) PFY
consumption has registered a sharp rise of about 35% y-o-y from 145 million kgs to 197 million kgs on back of
comparatively higher cotton prices.
Imports & exports
The PFY exports grew at a robust CAGR of 12% from 394 million kgs in FY13 to 616 million kgs in FY17. The growth can be
attributed to tightness in the global cotton availability, substitution of cotton by polyester in fabrics on account of the
widening cost differential and improved demand for PFY in the international markets. Continuing the trend, in FY17,
exports registered a y-o-y growth of 19.5% to reach 616 million kgs.
On the imports front, sufficient availability of PFY in the domestic market due to huge capacity additions by the domestic
manufacturers led to a sharp decline of about 15% CAGR in PFY imports over the last five years. The PFY imports declined
30 million kgs in FY13 to just 17 million kgs in FY17.
The top five export destinations for Indian PFY are Turkey, Brazil, Bangladesh, Korea and Egypt. While the key countries
exporting PFY to India are China, Malaysia, Indonesia, Korea Republic and Thailand.
Chart 10: PFY Imports & Exports (million kgs)
Source: Office of Textile Commissioner
Prices The PFY prices continued to increase in FY14, mainly on account of increase in prices of the key inputs like PTA and MEG.
The prices of PFY increased from an average of Rs 119 per Kg in FY13 to an average of Rs 129.3 per Kg in FY14. However,
prices dropped to Rs 96.4 per kg in FY17 on account of lower crude oil prices resulting in lower feedstock PTA and MEG
cost. In FY18 (till Aug), prices increased by over 7% y-o-y on account of increased input cost.
30 23 21 17 16 6 5
394
467 460 516
616
203 176
-
100
200
300
400
500
600
700
FY13 FY14 FY15 FY16 FY17 (P) FY17 (Apr-Jul) (P)
FY18 (Apr-Jul) (P)
Imports Exports

Industry Research I Man Made Fibres
10
Chart 11: Price Trend for PFY (126 D)
Source: CMIE
Feedstock A. Purified Terephthalic Acid (PTA)
Overview
Purified Terephthalic Acid (PTA) is a white, crystalline powder that resembles fine sugar but has lower soluble properties. It
is an aromatic acid and has its primary applications in Polyester manufacturing. PTA was first introduced in 1965 as an
alternative to Dimethyl Terephthalate (DMT) and since then, it has become the preferred raw material for Polyester Fibre,
PET film and engineering resins. PTA is produced from Paraxylene (PX), which forms a part of the derivative chain of
Petrochemicals.
PTA is a key raw material component in the polyester value chain and reacts with Mono Ethylene Glycol (MEG) in the
process of continuous polymerisation for producing polyester. For production of every 1MT of polyester melt, produced
via the process of continuous polymerisation, 0.86MT of PTA is required. The largest application for PTA is in Polyethylene
Terephthalate (PET) for the polyester industry to produce industrial & textile fibres, PET bottles and film & moulded
product applications. The applications of PTA are enlisted below:
Textile grade chips used to produce fibres & yarns to be used by the apparel and home furnishing manufacturers.
PET chips used for the production of bottles, microwave utensils, containers, audio-video tapes, x-ray sheets etc.
PET chips have also found their applications in the auto industry & products in the personal hygiene industry such
as diapers & sanitary napkins.
Bottle grade PET chips are used for making bottles used by the Fast Moving Consumer Goods industry, especially
the beverages segment.
PTA is also used to manufacture light-coloured adhesives to bond metal, wood, paper & synthetics.
PTA-based polyester & nylon is also used in electrical insulation and films.
PTA being one of the key raw materials involved in the production of polyester, its demand is greatly dependent on the
demand for PSF and PFY, which in turn is used for making fabrics. The demand for fabrics is driven by the increase in
119.0 129.3
118.1
99.9 96.4 103.2
0
20
40
60
80
100
120
140
FY13 FY14 FY15 FY16 FY17 FY18(Apr-Aug)
(Rs/kg)

Industry Research I Man Made Fibres
11
consumption of apparels and home textiles. The growing technical textile segment, especially the automotive segment, is
also likely to drive demand for the PTA. PTA also forms a key raw material used in the production of PET bottles. The PET
bottles are used for packaging beverages, whose demand is growing at a very fast rate, thereby driving demand for the
PTA.
Capacity
The PTA industry is a highly organised industry, with Reliance Industries, Mitsubishi and IOCL being the only PTA
manufacturers in India. SVC Superchem Ltd. had set up a plant with a capacity of 120 thousand tonnes in 1998, which it did
not use to produce PTA after the trial production. Reliance Industries is the largest manufacturer in India with the total
installed capacity of 4,400 thousand tonnes, with plants located at Patalganga, Haziraa and Dahej. It also has about 500
thousand tonnes capacity in Malaysia. IOCL has a total installed capacity of 553 thousand tonnes. Mitsubishi (MCPI) had a
total installed capacity of initially 470 thousand tonnes which it expanded to 1,270 thousand tonnes. JBF is also developing
a 1.25 MMT per annum capacity PTA plant, which is expected to commission in FY18.
Chart 12: Player-wise share of installed capacity
Source: Company reports and websites, CARE Ratings
Domestic Production and Consumption, Imports and Exports
PTA production in India has largely remained stable at average of about 3,500 thousand tonnes over the last five years.
Demand for PTA is driven by the textile and beverages sector. Earlier, the demand for PTA was met by imports, but with
the expansion of capacities by manufacturers in India, the share of imports in the PTA industry declined over the years.
RIL 70.7%
IOCL 8.9%
MCPI 20.4%

Industry Research I Man Made Fibres
12
Chart 13: PTA Production & consumption (000 tonnes) Chart 14: PTA Imports & Exports (000 tonnes)
Source: Ministry of Chemicals and Fertilizers, GoI
Prices
The main raw materials of polyester are purified terephthalic acid (PTA) and mono ethylene glycol (MEG). Costs of these
petrochemical derivatives are subject to volatility in crude oil prices. The prices remained largely stable in FY17 and
declined marginally by about 1% on a y-o-y basis. However, prices declined by a sharp 13% CAGR between FY13 and FY17
from $ 1,099 per tonne to $ 636 per tonne mainly on account of subdued demand, oversupply and falling crude oil prices.
Prices picked up in FY18 (Apr-Aug) by about 4% y-o-y on account of increase of about 9.6% y-o-y in crude oil prices during
the same period.
Chart 15: PTA Price Trend
Source: CMIE
3,4
94
3,4
77
3,7
55
3,4
32
3,3
91
4,1
38
4,4
55
4,8
00
3,9
56
3,5
43
-
1,000
2,000
3,000
4,000
5,000
6,000
FY13 FY14 FY15 FY16 FY17
Production Consumption
648
978 1,045
697
412
3.6 0.3 0.1
173 260
-
200
400
600
800
1,000
1,200
FY13 FY14 FY15 FY16 FY17
Imports Exports
1,099 1,021
829
641 636 646
110 108
86
47 49 50
-
20
40
60
80
100
120
-
200
400
600
800
1,000
1,200
FY13 FY14 FY15 FY16 FY17 FY18 (Apr-Aug)
PTA SEA prices ($/tonne) Crude Oil (Brent) $/barrel (FOB)

Industry Research I Man Made Fibres
13
High consumption of PTA in polyester component and unsaturated polyester resins is expected to push domestic market
growth. Textiles will be the largest market followed by bottling & packaging and furnishing. Going forward, with major
capacity additions expected by JBF, India is set to see declining import dependency for PTA.
B. Mono Ethyl Glycol (MEG) Mono Ethylene Glycol (MEG) is the most widely used chemical from the Glycol family. It is an essential raw material for
Polyester fibres (around 0.34 tonnes of MEG are required to produce 1 tonne of polyester) and Polyethylene
Terephthalate (PET) polymer. MEG based products are also used as coolants in Automobile antifreeze, resins, humectants
for tobacco/paper etc. The concept of “Green MEG” (MEG made from Agriculture based Alcohol) is slowly increasing with
many PET bottle manufacturing marketing it as environmentally friendly less carbon footprint products.
Capacity
The MEG industry is a highly organized industry, with Reliance Industries, India Glycols and IOCL being the only MEG
manufacturers in India. Reliance Industries is the largest manufacturer with the total installed capacity of 1,500 thousand
tonnes, where around 75 – 80% of MEG produced by RIL goes for captive polyester production. IOCL has a total installed
capacity of 325 thousand tonnes. India Glycols has a total installed capacity of 150 thousand tonnes.
Chart 16: Player-wise share of installed capacity
Source: Chemicals and Petrochemicals Manufacturer’s Association,
India (CPMA), Company reports and websites, CARE Ratings
Domestic Production and Consumption, Imports & Exports
The MEG production in India has remained largely stable during FY13 and FY17. It registered marginal growth of 1.1%
CAGR during the period from 1,061 thousand tonnes to 1,111 tonnes in FY17. However, further breaking down the years, it
is apparent that production dropped in FY15. However, the production has been increasing steadily post FY15, with
domestic production jumping in FY16 due to demand. Again, production fell marginally in FY17 on back of higher imports
RIL 75.9%
IGL 7.6%
IOCL 16.5%

Industry Research I Man Made Fibres
14
during the year. Imports have been consistently increasing since FY13. A CAGR growth of over 17% in imports was
registered between FY13 and FY17. Consumption recorded a CAGR growth of about 8.6% during the period.
Chart 17: MEG Production & Consumption (000 tonnes) Chart 18: MEG Imports & Exports (000 tonnes)
Source: Ministry of Chemicals and Fertilizers, GoI Prices
Prices of MEG usually move in line with global prices, as they follow landed cost parity. Prices of MEG are typically
influence by global prices, demand seasonality along with the availability of ethylene, molasses and the demand for co-
product ethylene oxide. With rising consumption of polyester, prices of MEG remained largely stable in FY17. However,
prices in FY18 (Apr-Aug) increased on account of higher crude prices along with tight supply arising out of few plant
shutdowns and lower inventories during the period.
Chart 19: MEG Price Trend
Source: CMIE
1,0
61
1,0
69
1,0
01
1,1
59
1,1
11
1,6
44
1,8
23
1,9
31
2,1
98
2,2
84
-
500
1,000
1,500
2,000
2,500
FY13 FY14 FY15 FY16 FY17
Production Consumption
655
821
1,004
1,112
1,235
72 67 73 72 62
-
200
400
600
800
1,000
1,200
1,400
FY13 FY14 FY15 FY16 FY17
Imports Exports
1,042 1,015
892
748 721 788
-
200
400
600
800
1,000
1,200
FY13 FY14 FY15 FY16 FY17 FY18 (Apr-Aug)
MEG SEA prices ($/tonne)

Industry Research I Man Made Fibres
15
Viscose Overview
Viscose (Rayon) was the first MMF to be introduced in France in 1890. The first commercial production of rayon fibre
started in United States in 1910 by the American Viscose Company. Unlike other man-made fibres, viscose is not synthetic.
It is made from wood pulp, a naturally occurring cellulose-based fibre. Therefore, its qualities are much more similar to
cotton and linen than synthetic fibres (nylon and polyester), which are petroleum-based products.
Rayon Grade Wood Pulp (RGWP), caustic soda and sulphur form the key raw materials for the viscose industry.
Characteristics
Silk-like aesthetics with a comfortable drape and feel qualities
It is moisture-absorbent and can be easily dyed in vivid colours
It is a versatile fibre and can be easily blended with the other fibres
No static build-up
Being a cellulosic fibre can get damaged by weak acids.
Uses of Viscose
Apparels: Viscose is used in the manufacturing of all kinds of apparels and home furnishings like bedspreads,
sheets, pillows, furniture, carpets and curtains.
Industrial use: High-tenacity rayon is used as reinforcement for mechanical rubber goods like tyres, conveyor belts
and hoses. It also finds application in aerospace, agricultural and technical textile industry.
A. Viscose Staple Fibre Overview
Viscose Staple Fibre (VSF) is a man-made, biodegradable fibre with characteristics akin to cotton. It is an extremely
versatile and easily bendable fibre. It is widely used in apparels, home textiles, dress material, knits wear and non-woven
applications.
VSF is mainly used for the production of blended yarn. It is mainly blended with polyester and cotton to form poly viscose
and viscose cotton blends. Blending with viscose improves the absorption qualities of the yarn. Approximately, 40% of the
VSF produced is used to produce 100% viscose yarn, which finds huge application in making embroidery thread.
The demand for VSF is mainly driven by the increase in the consumption of apparels and home textiles, both in the
domestic and the international markets. The increase in demand from these end-user industries is driven by the increasing
spending power of the people and the growing population. India, also exports a significant amount of VSF to other nations,
as Grasim is the largest producer of VSF across the world. The VSF exports grew at a robust CAGR of over 12% over the last
five years.

Industry Research I Man Made Fibres
16
Capacity – monopoly due to high entry barriers
Stringent licensing policies and environmental laws prevented the manufacturers to venture in the VSF space. Also, the
availability of the good quality raw material – Rayon Grade Wood Pulp (RGWP), acts as a hindrance to attract the new
capacity additions.
Grasim holds the monopoly in the VSF industry in India as it is the only Viscose Staple Fibre producer in the country. It has
a total installed capacity of 498 thousand tonnes per annum. It is a fully-integrated player, with a wood pulp plant having a
capacity of 70 million kgs and 840 million kgs caustic soda plant. Presently, it has four VSF plants located in India namely;
Nagda in Madhya Pradesh, Harihar in Karnataka and Vilayat and Kharach in Gujarat.
In the short term, demand for VSF depends on the recovery of global economies. The trend in supply of the fibre by China
will continue to have a bearing on the realizations.
Domestic Production and Consumption
VSF production in India grew at a CAGR of 2% from 337 million kgs in FY13 to 365 million kgs in FY17. The growth in
production can be attributed to the increased demand for the Indian VSF in both, the domestic and the international
markets. The increased production can also be attributed to the increased usage of VSF in the growing blended yarn
market.
In the current fiscal FY18 (Apr-Jul) VSF production has managed a sharp growth of over 11% to 127 million kgs as compared
to 114 million kgs in FY17 (Apr-Jul). Going forward, the VSF demand will be driven by both the textiles and the non-woven
segments over the long term. Increasing consumer awareness about the benefits of cellulose fibres has attracted greater
focus on offering innovative VSF variants, in terms of colour, texture and other value-added properties.
Chart 20: VSF Production & Consumption (million kgs) and y-o-y growth rates (%)
Source: Office of Textile Commissioner
337 361 365
342 365
114 127
-8.0%
-4.0%
0.0%
4.0%
8.0%
12.0%
16.0%
-
50
100
150
200
250
300
350
400
FY13 FY14 FY15 FY16 FY17 (P) FY17(Apr-Jul)
(P)
FY18(Apr-Jul)
(P)
Production (LHS) Y-o-Y Growth (RHS)
249
286 258
224 244
82 79
-15.0%
-10.0%
-5.0%
0.0%
5.0%
10.0%
15.0%
20.0%
-
50
100
150
200
250
300
350
FY13 FY14 FY15 FY16 FY17 (P) FY17(Apr-Jul)
(P)
FY18(Apr-Jul)
(P)
Consumption (LHS) Growth Rates (RHS)
Industry Research I Man Made Fibres
17
VSF consumption declined marginally at a CAGR of about 0.5% over the period FY13 to FY17 from 249 million kgs in FY13 to
244 million kgs in FY17. However, on a y-o-y basis, consumption increased by over 9% in FY17. In the current fiscal FY18
(April-Jul), consumption fell by about 3% to 79 million kgs as compared to 82 million kgs in FY17 during the same period.
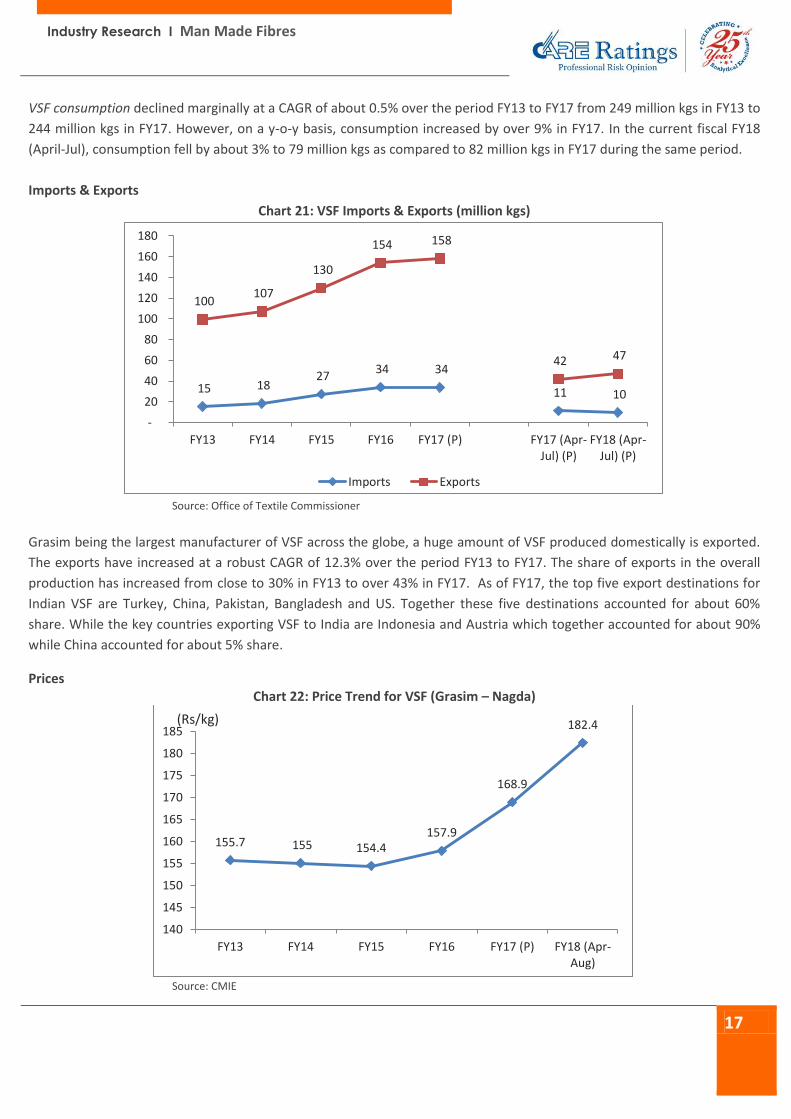
Imports & Exports
Chart 21: VSF Imports & Exports (million kgs)
Source: Office of Textile Commissioner
Grasim being the largest manufacturer of VSF across the globe, a huge amount of VSF produced domestically is exported.
The exports have increased at a robust CAGR of 12.3% over the period FY13 to FY17. The share of exports in the overall
production has increased from close to 30% in FY13 to over 43% in FY17. As of FY17, the top five export destinations for
Indian VSF are Turkey, China, Pakistan, Bangladesh and US. Together these five destinations accounted for about 60%
share. While the key countries exporting VSF to India are Indonesia and Austria which together accounted for about 90%
while China accounted for about 5% share.
Prices Chart 22: Price Trend for VSF (Grasim – Nagda)
Source: CMIE
15 18 27
34 34
11 10
100 107
130
154 158
42 47
-
20
40
60
80
100
120
140
160
180
FY13 FY14 FY15 FY16 FY17 (P) FY17 (Apr-Jul) (P)
FY18 (Apr-Jul) (P)
Imports Exports
155.7 155 154.4 157.9
168.9
182.4
140
145
150
155
160
165
170
175
180
185
FY13 FY14 FY15 FY16 FY17 (P) FY18 (Apr-Aug)
(Rs/kg)

Industry Research I Man Made Fibres
18
The VSF prices are dependent on prices of wood pulp. The VSF prices have grown marginally during FY13 and FY17 at a
CAGR of over 2%. However, prices increased by a sharp 12.8% during FY18 (Apr-Aug period) on back of high cotton
(substitute) prices. Cotton prices during the period increased by over 6% y-o-y in FY18 (Apr-Aug period). The prices of VSF
are also driven by the availability and prices of the other fibres and the energy cost.
B. Viscose Filament Yarn (VFY) Overview Viscose Filament Yarn (VFY) forms a very small portion of the overall MMF industry. Its share is approximately 2% of the
overall MMF industry. Approximately 50% of the VFY produced is used in the manufacturing of embroidery thread. It is
used as a close substitute for silk due to its inherent qualities. It is also widely used in blending. The VFY blend finds
application in making sarees, ethnic wear and bed linen.
Capacity - highly concentrated The VFY industry is highly concentrated with the top two players contributing over 60% to the overall industry capacity.
Century Rayon (B. K. Birla Group) is the largest player followed by Aditya Birla Nuvo. The capacity has remained largely
stable over the last few years. Other players include Sri Cheran Synthetics India Pvt Ltd, Kesoram Industries, etc.
The other players with VFY production capacity are NRC Ltd, SIV Industries Ltd and Travancore Rayons, but currently these
players are not under operation. Therefore, there has been a pressure on the operating rates of the two dominant
manufacturers.
Domestic Production and Consumption
VFY production has largely remained stable over the last few years, mainly due to the concentration of capacities with 2-3
players and the issue over the availability of the key raw material – wood pulp. Also, the huge VFY dumped in India at a
lower rate has eaten away into the share of the domestic VFY manufacturers.
Chart 23: VFY Production & Consumption (million kgs) and y-o-y growth rates (%)
Source: Office of Textile Commissioner
43 44 44 45 46
16 15 1%
3%
1%
3%
1%
-2% -3%
-2%
-1%
0%
1%
2%
3%
4%
-
5
10
15
20
25
30
35
40
45
50
FY13 FY14 FY15 FY16 FY17 (P) FY17(Apr-Jul)
(P)
FY18(Apr-Jul)
(P)
Production (LHS) Y-o-Y Growth rates (RHS)
46
53 53 51 47
15.3 14.9
3%
15%
0%
-4%
-8% -3%
-10%
-5%
0%
5%
10%
15%
20%
-
10
20
30
40
50
60
FY13 FY14 FY15 FY16 FY17 (P) FY17(Apr-Jul)
(P)
FY18(Apr-Jul)
(P)
Consumption (LHS) Y-o-Y Growth rates (RHS)

Industry Research I Man Made Fibres
19
The domestic production has thus increased at a CAGR of about 2% between FY13 and FY17. Also, in the current fiscal, the
production between April and July 2017, production has declined by about 2% y-o-y on account of higher imports (imports
increased by a sharp 18.3% y-o-y from April 2017 to July 2017).
VFY consumption remained largely stable and registered a marginal CAGR of 0.3% over the period FY13 to FY17 from 46.4
million kgs in FY17 to 47 million kgs in FY17. The demand for VFY is driven by the increased usage in making embroidery
threads.
After increasing consistently for few years, the imports have posted a considerable decline between FY13 and FY17.
Imports declined at a CAGR of about 6% during the period. However, in FY17, imports registered a sharp decline of over
28% y-o-y on account of lower domestic consumption. The share of imports in the overall consumption also declined from
around 18% in FY13 to 14% in FY17. In the current fiscal FY18 (Apr-Jul), the consumption is down by approximately 3%
from 15.3 million kgs to 14.9 million kgs.
Imports & Exports
Chart 24: VFY Imports & Exports (million kgs)
Source: Office of Textile Commissioner
VFY imports have decreased at a considerable rate over the past five years. The imports decreased at a CAGR of 6% from 9
million kgs in FY13 to 7 million kgs in FY17. However, imports increased in FY14 to 17 million kgs from 9 million kgs in FY13.
Post FY14, imports witnessed consistent decline in the next three years. This decline can be attributed to lower
consumption of VFY in the domestic market.
Prices The VFY prices grew at a CAGR of 2% over the period FY13 to FY17. FY17 saw a higher rise of 3.6% y-o-y in prices basis
mainly driven by the rise in the raw material prices and the increase in its substitute cotton fibre prices during the year.
9
17 16
10
7
1.8 2.1 6 6 6 6 5
1.8 2.0
-
2
4
6
8
10
12
14
16
18
FY13 FY14 FY15 FY16 FY17 (P) FY17(Apr-Jul)
(P)
FY18(Apr-Jul)
(P)Imports Exports

Industry Research I Man Made Fibres
20
Chart 25: Price Trend for VFY (150 D Bt. Indian Rayon)
Source: CMIE
Major Demand Drivers for Textile Industry 1. Demographic advantage
- The growing Indian population has also led to increase in the ‘earning population’ (age group 15-60) of the
country. The proportion of Indian populace in the age group of 15-64 years increased from 55.4% in 1991 to 66.4%
in 2017.
- Considering the huge size of the Indian population, the lower median age implies a higher number of working
people thereby clearly outlining the immense earning as well as spending potential of the Indian populace.
- Within 15-64 years age group, the share of population in 25-54 years age group is over 41% as of July 2017. 25-54
years age group being one of the highest spending age group, the current age dynamics are expected to boost the
retail sales of textiles in India. The median age of India is 26.7 years, one of the lowest globally in comparison to
37.2 years in the US, 45.8 years in Japan and 36.3 years in China.
Chart 26: Age distribution of Indian population Chart 27: Median age of population – 2016E
Source: CIA – The World Factbook
342.2
355.9 356.1 355
367.8
361.2
325
330
335
340
345
350
355
360
365
370
FY13 FY14 FY15 FY16 FY17 (P) FY18 (Apr-Jul)(P)
(Rs/kg)
37.3 35.4 30.76 27.3
55.4 56.9 63.4 66.4
7.3 7.7 5.83 6.24
0
20
40
60
80
100
1991 2001 2011 2017 Est.
0-14 years 15-64 years >64 years
(%)
46.9
46.8
40.5
39.3
37.9
37.1
31.6
30.1
27.6
Japan
Germany
U.K.
Russia
U.S.
China
Brazil
World
India
(%)

Industry Research I Man Made Fibres
21
2. Rising income levels & growing per capita expenditure
- In the last decade, Indian economy has progressed rapidly. Correspondingly, India’s per capita GDP has gone up
from Rs 80,518 in FY13 to Rs. 116,888 in FY17 at a CAGR of 9.8% fuelling a consumption boom in the country.
Correspondingly, the per capita personal disposable income surged from Rs 82,408 in FY13 to Rs 118,395 in FY17
at a CAGR of 9.5%. Also, the per capita private final consumption expenditure too rose from Rs 45,461 in FY13 to
Rs 68,722 in FY17 at a CAGR of 10.9%. The growth in country’s per capita GDP in turn has increased the disposable
income of the populace ultimately driving the country’s consumption.
Chart 28: Per capita indicators (Rs at current prices)
Source: Central Statistics Office (CSO)
3. Growing spread of plastic money
- The growing use of ‘plastic money’ i.e. credit and debit cards has resulted in an increased spending amongst the
consumers thereby fuelling the demand in the textile industry sector. With the acceptance of plastic money by
almost all the retailers in the textile retail segment, the number of outstanding plastic cards in the country is on a
rise. The incentives such as cash-back offer or discounts on selected sales linked to the plastic money have lured
the Indian consumer to experience the pleasure of ‘cashless shopping’.
Chart 29: Debit & Credit card usage trend (000 numbers)
80
,51
8
89
,79
6
98
,22
5
10
6,6
41
11
6,8
88
82
,40
8
91
,84
3
10
0,2
59
10
8,6
15
11
8,3
95
0
20,000
40,000
60,000
80,000
100,000
120,000
140,000
2012-13 2013-14 2014-15 2015-16 2016-17
Per capita GDP Per capita GNDI
40
,25
0
45
,46
1
51
,76
4
57
,08
6
61
,82
6
2,504
2,926
3,803 4,003
4,506
-
500
1,000
1,500
2,000
2,500
3,000
3,500
4,000
4,500
5,000
0
10,000
20,000
30,000
40,000
50,000
60,000
70,000
2011-12 2012-13 2013-14 2014-15 2015-16
Per capita PFCE PFCE on Clothing (Rs Bn)

Industry Research I Man Made Fibres
22
Source: Reserve Bank of India
4. Growing female working population
1. On the backdrop of growing Indian economy during the recent years, the participation of female workforce in the
country’s economic activities has increased considerably. The proportion of the female workforce which
accounted for 26% of the country’s workforce in FY71 has scaled to 31% during FY11. Notably, the percentage of
working women involved in the organised industrial activities too has increased from 27% in FY81 to 47% in FY11.
2. The higher purchasing power in the hands of ‘working-women class’ compared to the housewives enhances the
ability of the former to spend much more comparatively.
Chart 30: Share in total working population (%) Chart 31: Proportion of females working in organised
industrial activities (%)
Source: Census of India, Socio-Economic Statistics – 2011, CMIE
Policy Support by Government of India (GoI) Under the Union Budget FY18, the Government of India has allocated around US $ 926.7 million for textile Industry. Major
focus being to attract manufacturers, initiate technology upgradation and setup Integrated textiles parks, etc. Various
other initiatives by the Government such as the ‘Make in India’ campaign was launched to attract manufacturers and FDI.
5,9
72
,53
2
6,9
06
,84
8
7,8
03
,73
3
9,2
46
,15
3
10
,96
2,3
60
4,3
42
,06
4
4,7
06
,37
3
0
2,000,000
4,000,000
6,000,000
8,000,000
10,000,000
12,000,000
FY13 FY14 FY15 FY16 FY17 (P) 2016-17(Apr-Aug)
2017-18(Apr-Aug)
Debit Card Transactions
39
9,2
30
50
2,8
52
61
9,4
27
79
1,6
50
1,0
97
,51
6
39
4,0
23
56
0,3
24
0
200,000
400,000
600,000
800,000
1,000,000
1,200,000
FY13 FY14 FY15 FY16 FY17 FY17 (Apr-Aug)
FY18 (Apr-Aug)
Credit card Transactions
74.0 71.3 68.4 68.9
26.0 28.7 31.6 31.1
0%
20%
40%
60%
80%
100%
FY81 FY91 FY01 FY11
Males Females
26.8
33.1
48.4 46.7
0
10
20
30
40
50
60
FY81 FY91 FY01 FY11Proportion of Females working in organised industrialactivities

Industry Research I Man Made Fibres
23
Faster clearance of imports and exports has been promoted by taking appropriate measures. Following are some measures
taken by the GoI for the Textile Industry:
1. Technology Upgradation Fund Scheme (TUFS)
- Investment was made by the GOI to promote modernisation and up-gradation of the textile industry by
providing credit at reduced rates - In FY17, US$0.23 billion has been allocated for TUFS scheme under the Union Budget
2. National Textile Policy – 2000
- The key focus areas of the policy includes technological upgrades, product diversification, enhancement of
productivity and financing arrangements
- New draft of the policy ensures employment to about 35 million by attracting FDI. It also focuses on
establishing a modern apparel garment manufacturing centre in every North Eastern state. For this purpose,
the GoI has invested an amount of US $3.27 million.
3. Foreign Direct Investment (FDI)
- FDI of up to 100% is allowed in the textile sector through the automatic route
4. Scheme for Integrated Textile Parks (SITP)
- SITP was set up in 2005 with primary objective to provide necessary infrastructure facilities for setting up
textile units;
- However, the ministry of textiles found that the scheme has failed to achieve its objectives and therefore, the
GoI is reviewing the Scheme and a new scheme has been suggested – ‘Mega Textile Parks’ – to be launched to
provide the infrastructure support in the form of readymade factory sheds, warehouse, incubation centres and
testing labs, with express connectivity to seaports and airports to the industry.
Also, India has a free trade policy with the ASEAN Countries and the proposed agreement with the European Union will further boost countries exports. GST impact on MMF Industry The GST Council had included Man-made fibres and yarn under the 18% tax slab while the fabrics were slotted under 5%
GST slab with a condition that no input tax credit would be allowed at the fabric stage under the new GST tax regime.
However, the textile industry body Confederation of Indian Textile Industry (CITI) urged the government to reduce the GST
rate for yarns and fibres on grounds that the higher levy would compel the Indian producers to source the yarn and fabrics
at a cheaper rate from other producing countries like China and Indonesia where the mill gate prices of MMF, synthetic
fibres and yarns are lower than that in India.
In July 2017, a partial relief for the MMF textile units was provided as the GST on texturizing, twisting, weaving and yarn-
dyeing had been reduced from 18% to 5%. However, POY, PFY and Staple Fibre manufactured by virgin chips/granules
were covered under the umbrella of "man-made fibres" and liable to be taxed at 18% under the GST.
The higher rate was creating issues of inverted duty for the synthetic sector. Therefore, with the industry’s reaction, the
council reduced rate from 18% to 12% in October 2017 for MMF yarns. This is expected to be beneficial to the power and
loom sector. Also, the Department of Revenue (under the Ministry of Finance) has decided to increase the custom duties

Industry Research I Man Made Fibres
24
on import of various synthetic yarns and fabrics considering the demand of the textile industry stakeholders. This is
expected to improve India’s global competitiveness and will auger well for the domestic MMF industry.
Table 1: Custom Duty on Imports
Product Pre Revision
Rate Revised Rate
Custom Duty on Imports of:
Synthetic Woven Fabrics of various qualities, Other Woven Fabrics, Synthetic Filament Fabric, Artificial Filament Fabric and Artificial Woven Fabrics
10% 25%
Synthetic Texturized Yarn, Artificial Texturized Yarn, Synthetic Yarn, PSF, VSF and Artificial Yarn
10% 20%
Source: Ministry of Finance
Going forward, with revision in GST rates from 18% to 12% in October 2017 and increase in import duties on various
synthetic yarns and fibres, the domestic industry is expected to remain competitive vis-à-vis global players.
Financial Performance CARE Ratings has analysed the revenue and profit structure of the organised Manmade Fibres industry in India.
Chart 32: Net Sales (Rs Crore) Chart 33: Margins of MMF players (%)
Note: The industry financials are based on the financial results of 17 listed Man-made fibre players
Source: AceEquity
Net sales in FY17 declined marginally by about 0.5% after registering a sharper decline of about 4% and 5% in
preceding two years dragged down by subdued demand for the segment during the years. However, in FY17,
decline was restricted on account of slight revival in demand for polyester fibre in the domestic as well as in
11,698 11,838
11,250
10,807 10,754
10,000
10,500
11,000
11,500
12,000
FY13 FY14 FY15 FY16 FY17
9.7 8.8
9.5 8.5 8.9
1.6
0.5 1.5
0.0 0.7
-2.0
0.0
2.0
4.0
6.0
8.0
10.0
12.0
FY13 FY14 FY15 FY16 FY17
Operating Margins Net Margins

Industry Research I Man Made Fibres
25
the international markets. Demand also picked up as substitute cotton prices increased sharply by over 23% y-
o-y during FY17 vis-à-vis a rise of about 3% y-o-y in polyester staple fibre.
It is to be noted that the textiles demand was impacted in FY17 on account of the cash crunch in the market
post demonetisation in Q3 and Q4 due to which purchases took a hit.
The operating margins however expanded by about 50 basis points during the year on account of lower
feedstock costs. This expansion was limited as the other operating and administration costs remained high.
In line with the operating margins, the Net margins expanded by about 75 basis points on back of
lower interest costs incurred
Interest cover (ratio of PBDIT/interest) has been calculated for the set of 17 companies. The interest cover was higher at
2.0 times in FY17 from 1.7 times in FY16.
Outlook: Man-Made Fibres would continue playing second fiddle to cotton in India even as synthetic fibres continue its global dominance
Man-Made Fibres (MMF) dominate the world fibre consumption, accounting for more than 75% as of FY15 to the overall
fibre consumption. The rise in share can be attributed to the growing consumption of MMF in the developing countries
and continued consumption at elevated levels in the developed nations. Going forward, the share of MMF is expected to
grow further as the world cotton production is almost nearing its physical maximum and the MMF industry is expected to
fulfil the incremental demand. Polyester has overtaken cotton as the dominant fibre, but the cost and availability still play
a significant role in the inter-fibre substitution. Crude oil prices and cotton prices will affect the demand for respective
fibre in the world.
Chart 34: Fibre wise consumption breakup (%)
Source: Ministry of Textiles, European Man-made Fibres Association (CIRFS)
On the other hand, the Indian textile industry is predominantly a cotton-based industry. However, limited area under
cultivation and erratic rain affects the cotton availability. Cotton also faces stiff competition from other MSP based crops.
However, during FY18, the cotton production in India is set to increase by about 4.3% as per the latest estimates.
Therefore, we expect this higher production to put pressure on the prices and the prices are likely to witness a decline or
34% 32% 29% 29% 24%
66% 68% 71% 71% 76%
FY11 FY12 FY13 FY14 FY15
Cotton + Wool MMF
Global
68% 72% 72% 74% 75%
32% 28% 28% 26% 25%
FY13 FY14 FY15 FY16 FY17 (P)
Cotton MMF
India

Industry Research I Man Made Fibres
26
remain rangebound in FY18. The higher availability of cotton in the domestic market is expected to put pressure on the
polyester and viscose demand. However, demand for MMF from the technical textiles and home textile segment is
expected to remain strong. Cotton is expected to maintain its pole position in India.
Domestic MMF demand likely to remain stable in FY18
MMF industry has been going through a lean phase for the last 5 fiscals. The domestic consumption of MMF contracted by
a CAGR of 5.1% over the last 5 years (FY13 – FY17). In FY17, the consumption witnessed a higher decline of 7.5% y-o-y due
to factors such as sluggish demand, higher imports, rigid competition from cotton yarn, fall in realisations and temporary
loss of production on account of demonetisation weighed down on the industry. However, the domestic economy is on a
revival path and is expected to improve going forward. Therefore, in the short to medium term, CARE Ratings expects
MMF consumption to remain relatively stable. While, with an improvement in global economy, increased demand for
technical textiles and constrained cotton availability in the long term, we expect polyester consumption to register a
gradual pick up.
Also demand from blended and non-cotton spun yarn is expected to remain range bound and push MMF consumption in
the domestic market. Furthermore, MMF demand is likely to be boosted by:
1. Constant government support
2. Rising demand from technical and industrial textiles
3. Rising private final consumption expenditure (PFCE)
4. Growing population and rising incomes (with incomes rising in rural economy as well) and changing fashion trends
and
5. Expectations of Improved economic and industrial activities
Positives for the industry:
As of June 2017, the central government is planning to finalize and launch the new textile policy in FY18. The
policy aims to achieve US$ 300 billion worth of textile exports by 2024-25 and create an additional 35 million
jobs
Furthermore, an anti-dumping duty imposed on polyester yarn originating from China and Thailand is
expected to keep a check on imports
Free trade with ASEAN countries and proposed agreement with European Union will also boost exports.

Industry Research I Man Made Fibres
27
Conclusion:
MMF industry has been going through a lean phase for the last 5 fiscals. The domestic consumption of MMF
contracted by a CAGR of 5.1% over the last 5 years (FY13 – FY17).
In FY17, the consumption witnessed a higher decline of 7.5% y-o-y due to factors such as sluggish demand, sharp
rise in imports, rigid competition from cotton yarn, fall in realisations and temporary loss of production on account
of demonetisation weighed down on the industry.
The domestic economy is on a revival path and is expected to improve going forward. Therefore, in the short to
medium term, CARE Ratings expects MMF consumption to remain relatively stable. While, with an improvement
in global landscape, increased demand for technical textiles and constrained cotton availability in the long term,
we expect polyester consumption to register a gradual pick up. Also, with downward revision in GST rates from
18% to 12% in October 2017 and increase in import duties on various synthetic yarns and fibres, the domestic
industry is expected to remain competitive vis-à-vis global players.
Also, rapid urbanization, increase in organised retail penetration, rise of e-commerce, growth in income levels
(post the Seventh Pay Commission by the Centre as well as salary revisions by States) and favourable
demographics is expected to increase the consumption of apparels and other textile products.

Industry Research I Man Made Fibres
28
Annexure A (Manufacturing Processes)
1. Polyester manufacturing process:
Manufacturing of polyester consists of four stages:
1. Poly-condensation/condensation polymerization:
Today over 70 to 75 per cent of polyester is produced by the Continuous Polymerisation (CP) process using
Purified Terephthalic Acid (PTA) and Mono Ethylene Glycol (MEG). The alternative process used is called Batch
process using Dimethyl Terephthalate (DMT) and MEG.
Under poly condensation, the raw materials like PTA/DMT and MEG are converted into Poly Ethylene
Terephthalate (PET). The process of conversion of PTA/DMT and MEG into PET is as follows:
PTA/DMT is fed by a screw conveyor into hot MEG to dissolve and catalysts and Titanium dioxide (TiO2)
are added to it.
The slurry of raw materials is then continuously fed into esterification reactors and intermediate monomer
Di-Glycol Terephthalate (DGT) is formed.
DGT is fed into a poly-condensation reactor, at a high temperature (290 to 300°C) and total vacuum, the
monomer gets polymerised into the final product, PET.
Once the PET is formed it is converted into polymers of the desired molecular weight and then the filtered polyester melt
stream is either converted into polyester chips or sent to the next stage.
2. Spinning:
In this process, the PET monomer is extruded into polyester. There are many methods of spinning like melt
spinning, dry spinning, reaction spinning and wet spinning, but most of the new plants use the melt spinning
process.
Process of conversion of PET:
PET is pumped to melt spinning machines. These machines may be single-sided or double-sided and can have
36/48/64 spinning positions. At each position, the polymer is pumped by a metering pump, which discharges an
accurate quantity of polymer per revolution (to control the denier of the fibre) through a pack which has sand or
stainless steel particles as filter media and spinnerets which could be circular or rectangular and will have a specific
number of holes depending on the technology used and the final denier being produced.
Polymer comes out of each hole of the spinnerets and is instantly solidified by the flow of cool dry air. This process
is called quenching.
The filaments from each spinneret are collected together to form a small ribbon, passed over a wheel which
rotates in a bath of spin finish and this ribbon is then mixed with ribbon coming from other spinning positions, this
combined ribbon is a tow and are coiled in cans. The material is called undrawn tow and has no textile properties.
3. Drawing:
In this stage, properties of undrawn tows are modified. In this process, several million undrawn filaments are
drawn or pulled approximately four times in two steps, annealed, quenched, crimped, crimp set and final textile
spin finish is applied.

Industry Research I Man Made Fibres
29
Following is the process of modification of tows:
At the draw machine, undrawn tows from several cans are collected in the form of a sheet and passed through a
trough of hot water to raise the temperature of polymer to 70°C which is the glass transition temperature of this
polymer so that the polymer can be drawn.
In the next two zones, the polymer is drawn approximately four times to give tensile strength, stability and easy
dyeing property to the polyester filament yarn.
4. Crimping & cutting:
The drawn fibres are then crimped to add waviness to the synthetic fibre. The degree of crimp produces different
visual effects. Finally, the drawn and crimped tows are cut into desired 32/38/44/51 mm length and then baled to
be transported to a blend spinning mill. These cut fibres are known as Polyester Staple Fibre.
Once the polyester staple fibre is ready, it is used to make filament and spun yarns. The yarns can be blended with
other fibres to make various blended fabrics. Polyester and cotton is a popular combination. Wool and rayon are
also blended with polyester to make blended fabrics.
2. Viscose Manufacturing process Viscose is a cellulosic man-made fibre, generally manufactured from constituent RGWP, sulphur and caustic soda.
Viscose fibres are made using cellulose (dissolved wood pulp), sodium hydroxide, carbon disulfide and sulphuric
acid. Most commercial Rayon manufacturing processes today utilise the viscose process. It consists of the
following stages:
The cellulose sheets (dissolved rayon grade wood pulp) are saturated with a solution of caustic soda (or sodium
hydroxide) and allowed to steep for enough time for the caustic solution to penetrate the cellulose and react to
form soda cellulose.
The soda cellulose is mechanically shredded to increase the surface area and make the cellulose easier to process.
This shredded cellulose is often referred to as “white crumb”. The properly-aged white crumb is placed into a
churn or other mixing vessel and treated with gaseous carbon disulfide. The soda cellulose reacts with carbon
disulfide to form sodium cellulose xanthate.
The sodium cellulose xanthate is dissolved in a dilute solution of sodium hydroxide to give a viscose solution.
The viscose is allowed to stand for a period of time to “ripen” and it is forced through a spinneret after filtering the un-
dissolved materials that might disrupt the spinning process or cause defects in the rayon filament. In the process of
spinning, it comes in contact with a solution of sulphuric acid, sodium sulphate and several processes occur at this point
which cause the cellulose to be regenerated and precipitate from solution. The acidic spin bath converts the xanthate
functions into unstable xantheic acid groups, which spontaneously lose CS2 and regenerate the free hydroxyls of cellulose.
The result is the formation of fine filaments of cellulose or rayon.
3. Purified Terephthalic Acid (PTA) Manufacturing process
PTA was first produced commercially by the oxidation of PX, the key raw material, using dilute nitric acid which was
replaced by air. This process provided impure terephthalic acid and required further processing. It was later purified using
esterification to dimethyl terephthalate (DMT).

Industry Research I Man Made Fibres
30
The technology was replaced and now the modern technologies produce purified terephthalic acid by the catalytic liquid
phase oxidation of paraxylene in acetic acid, in the presence of air. The process uses manganese or cobalt acetate as a
catalyst. The reaction is exothermic, producing water which is removed in a solvent recovery system. Acetic acid from this
is returned to the reactor together with the oxidation catalyst. The resulting PTA is purified in a crystalliser where the
unreacted xylene and water are flashed off.
Source: Industry
4. Mono Ethylene Glycol (MEG) Manufacturing process
Ethylene and oxygen are combined to produce EO in a multi-tubular catalytic reactor. The highly exothermic reaction is
carefully controlled with proprietary and effective safety systems. EO produced in the reactor can be separated to high
quality purified EO and/or further processed to produce fiber-grade monoethylene glycol (MEG) as well as di- and
triethylene glycols (DEG, TEG).
Chart: MEG Production process
Source: Industry
Crude Terephthalic acid (CTA) production process
PXOxidation Crystallization CTADryingCrystal
SeparationAir
Recovery of Catalyst(s)
Recovery of Solvent(s)
Recovery of Catalyst(s)
CTA
High purity terephthalic acid (PTA) production process
Water
Solution Reduction CrystallizationCrystal
SeparationPTADrying
WaterHydrogen
EthanolReaction
System
EthyleneOxide
Reaction
EthyleneOxide
Purification
GlycolSeparation
Glycol Reaction
System
CarbonDioxide
Removal
Purified Ethylene Oxide
Monoethylene GlycolDiethylene Glycol
Triethylene Glycol
Ethanol Ethylene
Oxygen
CarbonDioxide

Industry Research I Man Made Fibres
31
Applications of MEG
Table 2: Applications of MEG
Applications of MEG Comments
1 Polyester
A. Textiles
Polyester is the largest synthetic fibre used in textiles and in
terms of production is second only to Cotton. Polyester
Filament Yarn can be directly used for textiles, while
Polyester Staple Fibre is blended with other fibres before
being drawn into a yarn.
B. Packaging
Polyethylene Terephthalate (PET) Film, sheet and moulded
containers for food packaging continue to grow in popularity.
Lightweight soft drink containers based on PTA & MEG are
crystal clear and shatterproof.
C. Furnishings
Staple Fibre made from Polyester is also used in furniture
applications like cushions, upholstery etc. Continuous
development in this fibre segment has opened a very good
opportunity in this segment.
D. Consumer goods
Apart from uses in Textiles, Furnishings as detailed above,
PET is also used in films for audio and video recording tapes.
Sun-Control films are also based on PET. PET has also become
the primary container resin for carbonated soft drink bottles
and other applications.
2 Adhesives, Sealants and Coatings
MEG and DEG is used in latex based paint formulation. These
glycols are also used to produce acrylate and methacrylate
resins for coatings, adhesives, and paints.
3 Alkyd Resins for Paints and Coatings MEG is used as a reactant in the manufacture of Alkyd resins
which are used in Paints, enamels and varnishes/
4 Antifreeze
MEG is used as an active ingredient in engine coolants and
antifreeze, offering benefits including a high boiling point,
low vapor pressure, excellent heat transfer abilities, and the
ability to depress the freezing point of water.
5 Others
A. Dyes & Inks
MEG finds applications in products like Dyes & Inks for High
speed printing.
B. Humectants
Glycols being hygroscopic in nature are also used as
Humectants for tobacco, paper etc
C. Explosives, Suspending agents for eltrolytic conductors etc.
Source: CARE Ratings
CORPORATE OFFICE: CARE RATINGS LIMITED (Formerly known as CREDIT ANALYSIS & RESEARCH LIMITED) Corporate Office: 4th Floor, Godrej Coliseum, Somaiya Hospital Road, Off Eastern Express Highway, Sion (East), Mumbai - 400 022. Tel: +91-22-6754 3456 I Fax: +91-22-6754 3457 E-mail: [email protected] I Website: www.careratings.com
Follow us on /company/CARE Ratings
/company/CARE Ratings