novel static and dynamic phenomena in magnetoelectric
TRANSCRIPT

D i e s e D i s s e r t a t i o n h a b e n b e g u t a c h t e t :
. . . . . . . . . . . . . . . . . . . . . . . . . . . . . . . . . . . . . . . . . . . . . . . . . .
DISSERTATION
Novel Static and Dynamic Phenomenain Magnetoelectric Materials
ausgeführt zum Zwecke der Erlangung des akademischen Grades einesDoktors der technischen Wissenschaften unter der Leitung von
Univ.Prof. Dr.rer.nat. Andrei PimenovE138
Institut für Festkörperphysik
eingereicht an der Technischen Universität WienFakultät für Physik
von
Lukas WeymannMatrikelnummer: 01635821Kölblgasse 32/38, 1030 Wien
Wien, am September 24, 2020

KurzfassungIn dieser Dissertation werden verschiedene neuartige Phänomene in magnetischen undmagnetoelektrischen Materialien mit einer breiten Auswahl an statischen und dynamis-chen Messmethoden untersucht.Der magnetoelektrische Effekt wird direkt an Samarium Ferroborat, SmFe3(BO3)4,
gemessen. Dort beobachten wir entlang der dreifachen Symmetrie-Achse die Sättigungder magnetisch induzierten elektrischen Polarisation bei kleinen Feldern und eine an-schließende Unterdrückung der Polarisation in starken gepulsten Magnetfeldern. Entlangeiner anderen kristallographischen Richtung erhalten wir eine nicht-lineare induziertePolarisation, entsprechend der dreifachen Symmetrie des Kristalls.
In Holmium-dotierten Langasit, HoxLa3−xGa5SiO14, wird ein ungewöhnlicher magne-toelektrischer Effekt gefunden, welcher mit zwei verschiedenen Ansätzen modelliert wird.Hierbei wird sowohl die besondere Winkelabhängigkeit des magnetoelektrischen Effektsberüksichtigt, als auch die magnetischen Eigenschaften. In diesem Material zeigt sichin der ungeordneten paramagnetischen Phase eine rätselhafte Kombination aus linearenund höchstgradig nicht-linearen magnetoelektrischen Signalen. So wächst die elektrischePolarisation linear mit dem Magnetfeld, aber oszilliert viele Male unter der Rotation desMagnetfeldvektors. Diese Analyse liefert neue Einblicke in die Magnetoelektrizität vonnicht-zentrosymmetrischen und paramagnetischen Verbindungen. Zusätzliche Erkennt-nisse werden über die magnetischen Eigenschaften der Seltene-Erden-Langasite durchdie Messung der paramagnetischen Resonanz in einem Mach-Zehnder-Interferometer imSub-THz Bereich gewonnen. Bei dieser Untersuchung von HoxLa3−xGa5SiO14 wird auchvon der Entdeckung eines starken Phonons bei ähnlichen Energien berichtet, welcheseine ungewöhnliche Kopplung an ein angelegtes Magnetfeld zeigt, das zu einer Ver-schmälerung der Phononenresonanz führt.
In dünnen Filmen aus ferrimagnetischem Yttrium-Eisen-Granat wird bei der sub-THz-Spektroskopie bei der magnetischen Resonanz ein zusätzlicher Dämpfungstermbeobachtet. Dieses Phänomen kann von der intrinsischen Dämpfung durch eine Analyseder komplexen Transmission bei verschiedenen Resonanzfeldern und durch die Messungunterschiedlich dicker Proben mit unterschiedlichen experimentellen Geometrien separi-ert werden. Der vorgeschlagene mikroskopische Mechanismus basiert auf der kohärentenReemission der einfallenden elektromagnetischen Welle durch einzelne magnetische Mo-mente. Dadurch kann die beobachtete Dämpfung mit dem magnetischen Äquivalent derSuperradianz in Verbindung gesetzt werden.
In den magnetoelektrischen Multiferroika GaV4S8 und Mn2Mo3O8 wird Drehmoment-magnetometrie verwendet, um die Übergänge zwischen verschiedenen Quantenphasen
i

zu identifizieren. Es zeigt sich, dass die Winkelabhängigkeit des magnetischen Drehmo-ments ein nützliches Werkzeug ist, um konventionelle Messungen der Magnetisierungzu ergänzen. Außerdem kann sie auch bei der Bestimmung der Spinstruktur in diesenMaterialien helfen.
ii

Abstract
In this dissertation, various novel phenomena in magnetic and magnetoelectric materialsare investigated by a variety of static and dynamic methods.A direct measurement of the magnetoelectric effect (MEE) is performed for samarium
ferroborate, SmFe3(BO3)4. There we observe along the threefold symmetry axis thesaturation of magnetically induced electric polarization in small fields and subsequentsuppression of the polarization in strong pulsed fields. Along a different crystallographicdirection, we obtain a nonlinear induced polarization that is consistent with the threefoldsymmetry of the crystal.
In holmium-doped langasite, HoxLa3−xGa5SiO14, an unusual effect is found and mod-eled with two different approaches. This includes the special angular dependence of themagnetoelectric effect as well as the magnetic properties. In this material a puzzlingcombination of linear and highly non-linear magnetoelectric responses in the disorderedparamagnetic state coincide. In particular, the electric polarization grows linearly withthe magnetic field, but oscillates many times upon rotation of the magnetic field vector.This analysis provides new insights into the magnetoelectricity of non-centrosymmetricand paramagnetic compounds.
An additional understanding of the magnetic properties of the rare-earth langasitecompounds is obtained by measuring the paramagnetic resonance in a sub-THz Mach-Zehnder interferometer. This investigation of HoxLa3−xGa5SiO14 also reveales a strongphonon at similar energies, exhibiting an unusual coupling to an applied magnetic fieldthat unexpectedly induces a narrowing of the phonon resonance.In thin films of ferrimagnetic yttrium iron garnet, an additional radiative damping
term is observed by sub-THz-spectroscopy at the magnetic resonance. This phenomenoncan be separated from the intrinsic damping by an analysis of the complex transmissionat different resonance fields and by measuring samples of different thicknesses with dif-ferent experimental geometries. The proposed microscopic mechanism is based on thecoherent re-emission of the incident electromagnetic wave by individual magnetic mo-ments, allowing a relation between the observed damping and the magnetic equivalentof superradiance.In the magnetoelectric multiferroics GaV4S8 and Mn2Mo3O8 torque magnetometry
is used to identify and resolve the transitions between different quantum phases. It isfound that the angular dependence of the magnetic torque is a useful tool to complementconventional measurements of the magnetization, and can also help in determining thespin structure in these compounds.
iii


Contents
1 Introduction 1
2 Experimental techniques 32.1 Sample Characterization . . . . . . . . . . . . . . . . . . . . . . . . . . . 32.2 Static Properties Measurement Techniques . . . . . . . . . . . . . . . . . 3
2.2.1 Impedance Analyzer . . . . . . . . . . . . . . . . . . . . . . . . . 52.2.2 Electrometer . . . . . . . . . . . . . . . . . . . . . . . . . . . . . 52.2.3 Vibrating Sample Magnetometer . . . . . . . . . . . . . . . . . . 72.2.4 Torque Magnetometer . . . . . . . . . . . . . . . . . . . . . . . . 7
2.3 Dynamic Properties Measurement Techniques . . . . . . . . . . . . . . . 82.3.1 Backward Wave Oscillator . . . . . . . . . . . . . . . . . . . . . . 82.3.2 Bolometer . . . . . . . . . . . . . . . . . . . . . . . . . . . . . . . 102.3.3 Cryostat . . . . . . . . . . . . . . . . . . . . . . . . . . . . . . . . 102.3.4 Optical Elements . . . . . . . . . . . . . . . . . . . . . . . . . . . 10
2.4 Summary . . . . . . . . . . . . . . . . . . . . . . . . . . . . . . . . . . . 13
3 Magnetoelectric Effect 153.1 Introduction . . . . . . . . . . . . . . . . . . . . . . . . . . . . . . . . . . 15
3.1.1 Linear Magnetoelectric Effect . . . . . . . . . . . . . . . . . . . . 163.1.2 Higher Order Magnetoelectric Effects . . . . . . . . . . . . . . . . 183.1.3 Microscopic Mechanism . . . . . . . . . . . . . . . . . . . . . . . 203.1.4 Magnetoelectric Multiferroics . . . . . . . . . . . . . . . . . . . . 223.1.5 Applications . . . . . . . . . . . . . . . . . . . . . . . . . . . . . . 23
3.2 Theory of the Magnetoelectric Effect in Rare-Earth Ferroborates . . . . . 243.3 Summary . . . . . . . . . . . . . . . . . . . . . . . . . . . . . . . . . . . 26
4 Magnetoelectric Effect in Samarium Ferroborate 294.1 High-Field Magnetoelectric Effect . . . . . . . . . . . . . . . . . . . . . . 294.2 Induced Polarization along the c-axis . . . . . . . . . . . . . . . . . . . . 344.3 Summary . . . . . . . . . . . . . . . . . . . . . . . . . . . . . . . . . . . 34
5 Magnetic Properties and the Magnetoelectric Effect in Ho-Langasite 375.1 Simple Phenomenological Model of the Magnetoelectric Effect . . . . . . 37
5.1.1 Holmium Langasite . . . . . . . . . . . . . . . . . . . . . . . . . . 375.1.2 Magnetization . . . . . . . . . . . . . . . . . . . . . . . . . . . . . 39
v

Contents
5.1.3 Magnetoelectric Effect . . . . . . . . . . . . . . . . . . . . . . . . 415.2 Extended Model of Magnetic Structure in Ho-LGS . . . . . . . . . . . . . 46
5.2.1 Breaking of Local C2 Symmetry . . . . . . . . . . . . . . . . . . . 465.2.2 Magnetization . . . . . . . . . . . . . . . . . . . . . . . . . . . . . 485.2.3 Magnetic Torque . . . . . . . . . . . . . . . . . . . . . . . . . . . 505.2.4 Fitting the Magnetic Structure . . . . . . . . . . . . . . . . . . . 505.2.5 Paramagnetic Resonance . . . . . . . . . . . . . . . . . . . . . . . 565.2.6 Induced Electric Polarization . . . . . . . . . . . . . . . . . . . . 595.2.7 Open Questions . . . . . . . . . . . . . . . . . . . . . . . . . . . . 62
5.3 Electron-Phonon Coupling in Rare-Earth Langasites . . . . . . . . . . . . 655.4 Excitation in the Complex Transmission . . . . . . . . . . . . . . . . . . 675.5 Summary . . . . . . . . . . . . . . . . . . . . . . . . . . . . . . . . . . . 71
6 Identifying Quantum Phase Transitions by Torque Magnetometry 736.1 Transition of Cycloidal Phase to Skyrmion Lattice in GaV4S8 . . . . . . 73
6.1.1 Identifying Phase Transitions by Magnetic Anisotropy . . . . . . . 746.2 Magnetic anisotropy in the antiferromagnetic multiferroic Mn2Mo3O8 . . 76
6.2.1 Manganese Molybdenum Oxide . . . . . . . . . . . . . . . . . . . 776.2.2 Magnetization . . . . . . . . . . . . . . . . . . . . . . . . . . . . . 786.2.3 Magnetic Torque . . . . . . . . . . . . . . . . . . . . . . . . . . . 78
6.3 Summary . . . . . . . . . . . . . . . . . . . . . . . . . . . . . . . . . . . 79
7 Radiative Damping in Yttrium-Iron-Garnet Films 837.1 Introduction . . . . . . . . . . . . . . . . . . . . . . . . . . . . . . . . . . 837.2 Experimental Method . . . . . . . . . . . . . . . . . . . . . . . . . . . . . 847.3 Analyzing the Transmission Spectra and Separating Intrinsic and Radia-
tive Damping . . . . . . . . . . . . . . . . . . . . . . . . . . . . . . . . . 867.4 Summary . . . . . . . . . . . . . . . . . . . . . . . . . . . . . . . . . . . 94
8 Conclusions 95
Acknowledgments 97
Bibliography 101
vi

1 IntroductionNearly every field of technology relies in one way or another on the development of newmaterials to either steadily improve functionality or to open completely new domainswith the discovery of novel physical effects. This is especially true for the field of mi-croelectronics, which is a primary driver of the huge changes seen in the everyday livesof most people during the last century, for example, due to the emergence of the firstcomputers and smartphones.A frequently mentioned candidate for the next leap in microelectronics are magne-
toelectric materials, which are based on the coupling of electric and magnetic materialproperties. This coupling is not to be confused with the dualism of both fields in elec-tromagnetic waves, as described by James Clerk Maxwell [1]. Even though the firstinduction of a magnetization in a dielectric material by moving it through a constantelectric field was discovered already by Wilhelm Röntgen [2] in 1888, an internal couplingof electric and magnetic properties, as described by Pierre Curie [3] and further elabo-rated by Landau and Lifshitz [4], was not experimentally confirmed before the discoveryof a linear magnetoelectric effect in the 1960’s by Astrov [5]. Subsequently, research onmagnetoelectricity was focused on the search for new magnetoelectric materials provingto be useful for applications by exhibiting stronger coupling and better operating tem-peratures. However, recent scientific attention has been drawn to many novel phenomenafound to emerge in magnetoelectrics and in multiferroics. In this work, a wide range ofexperimental methods was used to investigate novel magnetoelectric effects in a diverseselection of magnetoelectric materials. These effects included both static and dynamicphenomena as well as non-negligible higher order terms.
In Chapter 2 different experimental setups are described. Primary measurements wereperformed using different operating modes of a commercially available Physical Prop-erties Measurement System, equipped with a 14T magnet, as well as a quasi-opticalMach-Zehnder interferometer, equipped with a 7T magnet.
As previously stated, the magnetoelectric effect is the connecting concept between thesamples investigated in this work. Therefore an extensive discussion about this effectis presented in Chapter 3, where the historical background will be briefly summarized,some potential applications introduced, and different realizations of the magnetoelec-tric effect elaborated. This includes the linear and higher order effects, magnetoelectricmultiferroics and a model of the magnetoelectric effect in rare-earth ferroborates [6].
Chapters 4, 5, 6, 7 represent the primary body of work, showcasing all measurementsof the different material classes studied. Chapter 4 focuses on SmFe3(BO3)4, a member ofthe well investigated rare-earth ferroborates, known for exhibiting a giant magnetoelec-
1

1 Introduction
tric effect [7]. However, the model developed in [6], based on the magnetism of the Fe-and the Sm-ions, does not give a perfect agreement for the electric polarization inducedby a high magnetic field. This indicates an inaccurate assumption of the Fe-Sm molecu-lar field based on the estimated Landé-factor of Sm. By performing measurements in apulsed high magnetic field, we overcome the difficulties in determining the Landé factorand refine this model. Moreover, the previous theory does not account for a magneticallyinduced polarization along the crystal’s threefold axis, as it is limited to the first orderapproximation. We present the first experimental observation of such a higher ordermagnetoelectric effect in SmFe3(BO3)4 and propose a simple phenomenological modelbased solely on symmetry considerations.In Chapter 5, a more extensive model is developed to explain the unusual magneto-
electric effect observed in HoxLa3−xGa5SiO14. In this non-centrosymmetric material, alinear magnetoelectric effect is forbidden by the crystal symmetry, but emerges at smallmagnetic fields on top of a higher order effect. The effect is observed when measuringthe electric polarization along the high symmetry axis and when rotating the magneticfield around this axis. A model to explain this phenomenon is developed in two steps.First a phenomenological model is proposed by only taking into account the magneti-cally induced magnetization and polarization curves. This model is then revisited andexpanded by taking into account the magnetic anisotropy and the paramagnetic reso-nance, as obtained by sub-THz-spectroscopy. In the same chapter a puzzling couplingbetween a low-frequency phonon and applied magnetic fields is explored and discussed.In Chapter 6, the quantum phase diagram of two transition metal multiferroics is
investigated by torque magnetometry. It is shown that this simple experimental methodrepresents a valuable technique to complement magnetization curves when identifyingmagnetic phase transitions. In GaV4S8, the torque measurements prove to be useful foraccurately measuring the phase transition of a cycloidal spin structure into a skyrmionlattice. In the polar magnet Mn2Mo3O8, we resolve the transitions between the differentphases of antiferromagnetically coupled magnetic moments.In Chapter 7, a novel magnetic superradiance effect is revealed in thin films of yttrium
iron garnet using the technique of transmission spectroscopy in a quasi-optical Mach-Zehnder interferometer under applied magnetic fields. The versatility and sensitivity ofthis experimental setup can be used to distinguish between subtle differences in theferrimagnetic resonances originating from changes of the experimental geometry, samplethickness and resonance frequency. Using this sensitive data, we can separate the internalcontribution to the line width of the resonance from the contribution of the radiativedamping, which is identified as a ’superradiating’ effect.The conclusions of this work are provided in Chapter 8.
2

2 Experimental techniques
For the investigations reported in this thesis, a wide range of experimental techniqueswas used, falling into three categories: measurements of static phenomena, dynamicphenomena and sample characterization. A short introduction of the used experimentalsetups is given in this Chapter.
2.1 Sample Characterization
The samples have been characterized by several experiments that will be briefly in-troduced. A Laue diffractometer was used to confirm and accurately determine theorientation of the langasite compounds and the SmFe3(BO3)4 samples. The accurateorientation is of particular importance for the measurements of the angular dependenceof the magnetic properties and the magnetoelectric effect. The diffractometer is basedon the diffraction of a non-monochromatic X-ray beam on the crystal lattice.
The purity of the langasite crystals was probed with a scanning electron microscopeoperating with back scattered electrons. The accurate value of the holmium contentin the HoxLa3−xGa5SiO14 samples (Chapter 5) is essential to analyze the correspond-ing measurements and was obtained by comparing a Ho-langasite sample with a purelangasite crystal (x = 0) in a total reflection x-ray fluorescence (TXRF) analyzer1.
2.2 Static Properties Measurement Techniques
Static phenomena were mostly explored by different options for a commercially availablePhysical Properties Measurement Systems (PPMS) of the company Quantum Design.The PPMS is a variable temperature-field system providing a noteworthy versatility dueto its modular structure. It can operate in a temperature range of 2K - 400K and isequipped with a helium-cooled superconducting 14T magnet. For the measurements inthis work we used the commercial vibrating sample magnetometer and torque magne-tometer options, complemented with an electrometer and an impedance analyzer.
1This sample characterization measurement was kindly performed by our colleagues Peter Kregsamerand Christina Streli from the Institute of Atomic and Subatomic Physics of the Vienna Universityof Technology.
3
2 Experimental techniques
Sample
CF
-
+
RFQs
PPMS
Coulombmeter
Sampleε*
PPMS
HI0
U0
Impedance Analyzer
A
B
s
T
H
T
Amplifier
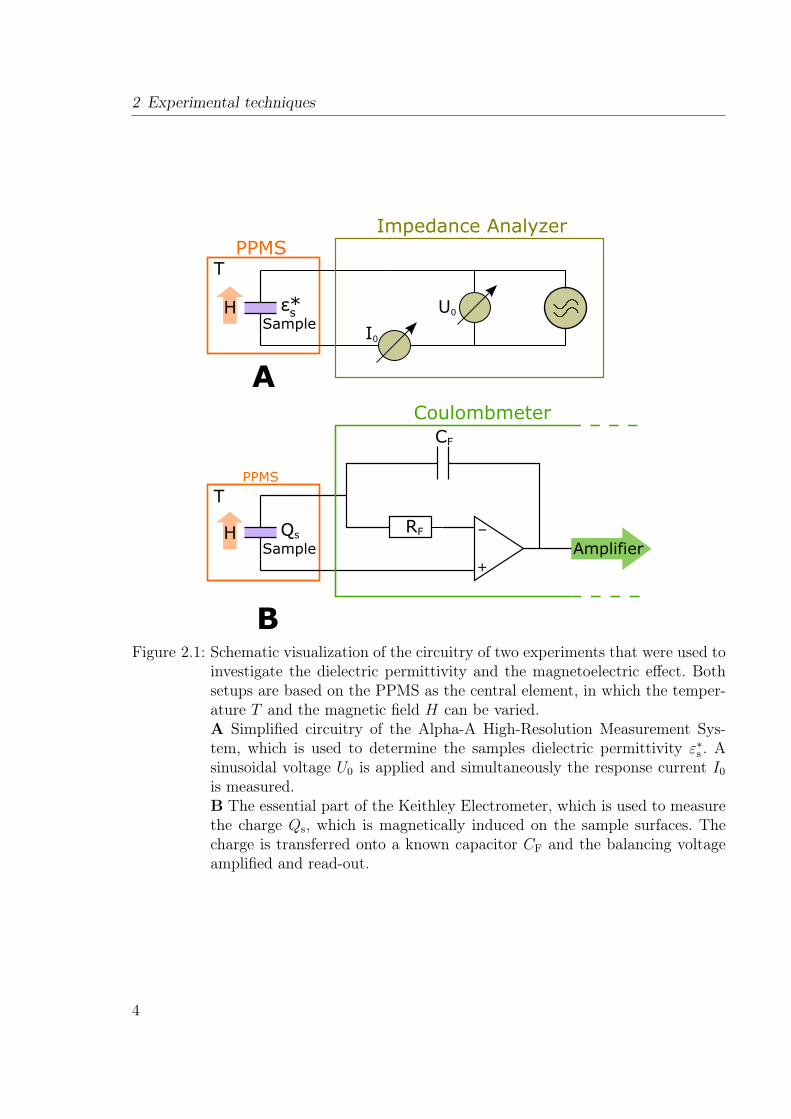
Figure 2.1: Schematic visualization of the circuitry of two experiments that were used toinvestigate the dielectric permittivity and the magnetoelectric effect. Bothsetups are based on the PPMS as the central element, in which the temper-ature T and the magnetic field H can be varied.A Simplified circuitry of the Alpha-A High-Resolution Measurement Sys-tem, which is used to determine the samples dielectric permittivity ε∗s . Asinusoidal voltage U0 is applied and simultaneously the response current I0
is measured.B The essential part of the Keithley Electrometer, which is used to measurethe charge Qs, which is magnetically induced on the sample surfaces. Thecharge is transferred onto a known capacitor CF and the balancing voltageamplified and read-out.
4

2.2 Static Properties Measurement Techniques
2.2.1 Impedance Analyzer
The dielectric permittivity of the sample can be measured by exchanging the multimeterwith an impedance analyzer; in the presented measurements the Alpha-A High Reso-lution Measurement System of the company Novocontrol Technologies was used. Eventhough the frequency dependent dielectric permittivity is a dynamic sample property,we used the impedance analyzer for determining its static limit by measuring at lowfrequencies.The impedance analyzer applies a sinusoidal voltage U(t) = Re(U0 exp(iωt)) with a
fixed frequency ω and amplitude U0 to the sample capacitor, i.e. the two silver pasteelectrodes on opposite sample surfaces. Here t is the time, with t = 0 chosen in such a waythat the equation holds. This voltage induces a current to flow through the sample I(t) =Re(I∗ exp(iωt)) with the same frequency, but an amplitude I0 = |I∗| and phase shifttan(ϕ) = Im(I∗)/Re(I∗) that depend on sample properties. The obtained impedanceZ∗ = U0
I∗can be used to get the dielectric permittivity of the samples
ε∗ =d
ε0A
1
iωZ∗, (2.1)
where d is the thickness of the sample and A the surface of the silver paste electrodes.The frequency range of the Alpha-A Analyzer spans from 3µHz to 20MHz and measuresthe relative impedance with an accuracy of < 3 × 10⁻⁵ and the absolute phase anglewith < 0.002. A simplified sketch of the circuitry is shown in Fig. 2.1 A.
2.2.2 Electrometer
The measurements of the magnetoelectric effect are performed by using a commerciallyavailable multimeter of the company Keithley Instruments. It measures the chargesthat are induced in two silver paste electrodes, which are prepared on opposite samplesurfaces and connected to the electrometer, which detects the charges that are inducedby the applied magnetic field, as shown in Fig. 2.1B. A capacitor with an accuratelyknown capacity CF is placed in the feedback loop of an operational amplifier (OP).The induced charge on the sample Qs is stored on this capacitor and matched via theOP with a balancing voltage V . This voltage is then amplified by a second OP andfinally measured. Due to the known capacity CF, the charge can be recalculated bythe expression Qs = CFV . The electrometer is equipped with four capacitors to resolvecharges down to 10 fC and up to 2.1µC.Due to the upper limit of the magnetic field provided by the PPMS, additional high-
field measurements of the magnetoelectric effect were performed in a pulsed magnet atthe Dresden High Magnetic Field Laboratory (HLD) at the Helmholtz Zentrum Dresden-Rossendorf.
5

2 Experimental techniques
U U
Sample
PPMS/VSM
PPMS/Torque Magnetometer
Sample
R
R
A
B
T
T
H
H
M
M T
Figure 2.2: Schematic visualization of the circuitry of two experiments that were usedto investigate the magnetic properties of the sample. Both setups are basedon the PPMS as the central element, in which the temperature T and themagnetic field H can be varied. A Simplified structure of the Vibrating Sam-ple Magnetometer. The oscillation of the sample magnetization Ms inducesa voltage U in the pickup coils.B The circuitry of the Wheatstone bridge, which is the central element ofthe Torque Magnetometer. A non-parallel applied magnetic field and sam-ple magnetization lead to a torque T, which induces a variation of electricalresistance in two piezoresistive paths, which is then matched by two knownhigh-precision resistors. The balancing voltage is measured to determine themagnetic torque.
6

2.2 Static Properties Measurement Techniques
2.2.3 Vibrating Sample Magnetometer
The vibrating sample magnetometer (VSM) is a DC magnetometer that measures thesamples magnetization by reading out the voltage
Vcoil =dΦ
dt(2.2)
that it is induced in a pickup coil by the change of magnetic flux Φ over time t, whenthe sample is oscillated in the vicinity of the coil. The characteristic vibration of thesample at a frequency of 40Hz and an amplitude of 2mm is generated by a linearmotor. Using a lock-in detection technique of the amplified induced voltage, a resolutionof 10−6 emu is achieved. A sketch of the experimental setup is shown in Fig. 2.1C.Additional low field measurements were performed in a SQUID magnetometer2 with arotatable sample holder, which provides the angular dependence of the magnetization.This measurement of the magnetization in static ’low’ fields is complemented by high-field measurements performed in a pulsed magnet with field strengths up to 56T in theHigh Field Laboratory at the Helmholtz-Zentrum Dresden-Rossendorf in Germany. Thismagnetometer is based on a similar principle as the VSM: The induced magnetizationleads to a voltage in pickup coils that can be read-out. But instead of oscillating thesample in a DC magnetic field in the vicinity of the coils, the change of magnetizationis generated by the pulse nature of the field.
2.2.4 Torque Magnetometer
Measuring the torque that is induced by an applied magnetic field B on a sample withmagnetization µ is given by
τ = µ×B . (2.3)
The torque magnetometer option for the PPMS is designed to measure this propertyaccurately to give insights into the magnetization of the investigated material. The sam-ple is mounted on a lever sample stage that is only connected to the sensor by twopiezoresistive legs, wherein a torsion leads to a change in resistance. If a magnetizationis induced that is neither parallel nor perpendicular to the applied field, Eq. (2.3) givesa non-zero torque τ that is read-out by the difference of resistance ∆R = R1 − R2 inthe two piezoresistive paths, which is extracted by a Wheatstone bridge circuitry, asvisualized in Fig. 2.1D. Two accurately known high-precision resistors are connectedand a balancing voltage is used to determine ∆R, which is induced in both legs by theproportional magnetic torque. The sensor chip is mounted on a horizontal rotator op-tion, which provides a full rotation of the sample around an in-plane axis of the thinplate sample in the magnetic field. Therefore a full measurement of τ can be performed
2These measurements were performed by Vsevolod Ivanov at the Prokhorov General Physics Instituteof the Russian Academy of Sciences.
7

2 Experimental techniques
with two complementary cuts of the investigated crystal. Nevertheless the sample sizeis limited due to the rather small size of the torque sensor chips (1.5 × 1.5mm) and themaximum torque of 10−5 Nm. Above this limit the torque magnetometer enters a non-linear regime and the chip can break. The gravitational background can be subtractedby a measurement of the paramagnetic samples in zero magnetic field. This setup pro-vides the possibility to measure field scans of the magnetic torque for a fixed angle, orresolving the angular dependence of the torque at a fixed magnetic field.
2.3 Dynamic Properties Measurement Techniques
In addition to the investigation of static properties, a quasi-optical sub-THz Mach-Zehnder interferometer (Fig. 2.4) was used to explore dynamic phenomena. On theone hand this frequency range is perfect for electron spin- and ferromagnetic resonancespectroscopy, but on the other hand we also report the observation of an optical phonon,which is a rather unusual finding in this frequency range. The experimental setup isschematically shown in Fig. 2.4. The central element of the setup is the splitting of theelectromagnetic wave into two separate beams, which interfere again before the signalis detected. The traveled distance of both light paths is equal, but while one beamtravels only in free space, the second beam is transmitted through the sample. Since thesamples refractive index deviates in general from the refractive index of air, the opticalpath length of both beams are usually not the same. However, the length of the samplebeam path can be adjusted by an automatically movable mirror, which maintains a zerodifference of both optical path lengths. The mirrors position can therefore be translatedinto the phase shift that occurs when the wave is transmitted through the sample. Hence,by simultaneously measuring the absorption coefficient, the complex refractive index n∗of the investigated material can be recalculated. The interferometer can also operateat a ’transmission-only’ mode, where the reference beam is blocked and a mechanicalchopper is installed in the main beam. This setting provides quicker and more accuratemeasurements of the transmission through the sample, while the phase information islost. The absolute value of the transmission is determined in this case, by comparing thetransmission through the sample with a reference measurement, in which the sample isremoved from the beam.The experimental setup allows for either frequency scans at a fixed applied mag-
netic field, or measuring at a fixed frequency while sweeping the magnetic field. In thefollowing, we will have a closer look on the different elements of the Mach-Zehnderinterferometer.
2.3.1 Backward Wave Oscillator
To enable the investigation of a broad range of sub-THz phenomena the source of aMach-Zehnder interferometer has to meet certain requirements, foremost the provision
8

2.3 Dynamic Properties Measurement Techniques
1 2 4
1
5 5
6
7
8
+-NS 3
Figure 2.3: Schematic of a backward wave oscillator in accordance to [8] is shown onthe top. The heater (1) induces the emission of electrons in the cathode (2),which are then accelerated onto the anode (4), forming an electron beam(3), which is collimated by a magnetic field (5). The periodic slow structure(6) induces a grouping of the electrons, which generates the electromagneticwave (7) that is led out by a waveguide (8). The cooling system is not shownfor the sake of simplicity. In the bottom, the frequency range of the eightbackward wave oscillators of different construction. The overlap of a fewlamps is useful to combine the spectra of different frequency ranges.
of monochromatic light in a broad frequency range with a reasonably high intensity. Inthe presented research a set of eight backward wave oscillators (BWO) was used to meetthose requirements. BWOs are electrovacuum generators of continuous electromagneticwaves with tunable frequencies in the range of ±30% around the central value and a char-acteristic output power of 10mW, which can reach up to 200mW for long wavelengthslamps [8], as shown in Fig. 2.3. The radiation is generated by a very delicate mechanism,including the need for high voltage, high vacuum and the resilience to high temperatures.A stream of electrons is created by a heated cathode and accelerated by the applicationof a high voltage of up to 6.5 kV onto an collector anode, while being collimated by anapplied magnetic field. This electron beam travels over a comb-like electrode consistingof up to 200 closely placed plates, which functions as a slowing system. This leads toa periodical bunching of the electrons, which generates an electromagnetic wave thattravels in the opposite direction of the electrons on a waveguide into free space; hencethe name ’backward wave’. Since the frequency of the output radiation is determined by
9

2 Experimental techniques
the separation of the rods and the kinetic energy of the electrons, which is transferredby the slowing system onto the electromagnetic wave, the described frequency tuningcan be achieved by a variation of the acceleration voltage. A frequency of approximately0.03 - 1.1THz is covered by a set of nine BWOs. Either air or water cooling is needed toestablish a stable operation of the lamps. Even though BWOs are nearly perfect for thesekind of scientific applications, the industrial production is nowadays strongly reduced.
2.3.2 BolometerThe sub-THz beam can be detected by any far-infrared detector. For this purpose acommercially available helium-cooled infrared bolometer was used, since it provides asignificantly higher sensitivity than a comparable room-temperature device (e.g. Golaycell). The bolometers principle of operation is fairly simple. The incoming radiation isabsorbed by a semiconductor, which leads to a rise of temperature that can be readout by the change of resistivity. To maintain a continuous operation mode, the heathas to be transferred quickly to the temperature reservoir. Therefore, a low specificheat of the semiconductor is desirable to allow for a high speed operation mode, aswell as a large temperature coefficient to increase the bolometers sensitivity. In thecase of a helium cooled bolometer, these quantities need to satisfy the requirementsfor temperatures around 4.2K. A continuous comparison with the zero signal is neededto get good absolute values for the absorbed intensity and to increase the signal tonoise ratio. This is either realized by operating at destructive interference (transmissionand phase mode) or with a mechanical chopper (transmission only mode) and a lock-inamplifier. However, it should be mentioned that due to a possible change of transmissionthrough the sample, the ’destructive interference’ is just a minimum of the signal andonly zero, if the amplitude of sample and reference beam are equal before interfering inthe final polarizer.
2.3.3 CryostatThe sample is mounted in a magneto-optical cryostat with four Mylar windows, whichprovides magnetic fields of up to 7T. The field is generated by a superconducting coilin a helium bath and can be applied in the horizontal plane either parallel (Faradaygeometry) or perpendicular (Voigt geometry) to the beam path by rotating the cryostat.The sample can be cooled down to 1.8K by pumping the sample chamber with liquidhelium.
2.3.4 Optical ElementsDue to the long wavelength of the sub-THz radiation, conventional glass lenses used foroptical interferometers are not compatible with this setup. Therefore the lenses are madefrom polyethylene or teflon, materials that are transparent and have a low refractive
10

2.3 Dynamic Properties Measurement Techniques
Reference
Sample
Hy
BWO
Bolometer
1
13 1
11
3
2
1
4
56
y
z
Voigt
x
x
Sample
BWO Bolometer
1
1 1
2a
1
5 8
y
z
Faraday
x
2b
8
a
bHx
7
Figure 2.4: Schematic setup of the Mach-Zehnder interferometer. The operation princi-ples of source (BWO) and detector (bolometer) are explained in the text.top Voigt geometry: The spherical lenses (1) are used to either transformdivergent light into parallel beams or focus the radiation onto the sample (5),which is mounted in a magneto-optical cryostat, or the detector. A metallicwire grid is used to linearly polarize (2) and split (3) the beam. A motorizedmirror (6) is installed in the sample beam (blue), which adjusts its opticalpath length to interfere destructively with the reference beam (red), whichruns over a modulating mirror (4).bottom Faraday geometry: The linear polarizer (2a) is complemented witha circular polarizer (2b), as explained in the text. A chopper (7), coupled viaa lock-in amplifier with the bolometer - is used to improve the absolute sig-nal. No reference beam can be used in this setup, which therefore only allowsfor measuring in transmission mode. Due to this fact, the beam splitters andthe motorized mirror can be removed and replaced by simple mirrors (8).Further optical elements like attenuators and additional polarizers were leftout for the sake of simplicity. Both setups are explained in more detail in thetext.
11

2 Experimental techniques
index in this frequency range. Here, we will shortly explain all optical elements of theinterferometer ordered from source to detector (Fig. 2.4).
The first lens transfers the divergent radiation emitted by the BWO into a parallelbeam. Since the intensity of the BWOs cannot be controlled directly, a set of fourcombinable attenuators is used, which transmit 30%, 10%, 3% or 1% of the signal,respectively. The next element on the beam path is only used for the ’transmission-only’mode: a mechanical chopper, operated at a frequency of 23Hz and connected to thedetection unit. It continuously provides a zero signal over the course of the completemeasurement. Due to the fact that the light emitted by the lamp is monochromatic, butnot always perfectly polarized, a wire grid polarizer, which consists of a parallel grid ofthin tungsten wires, with an inter-wire distance of 0.03mm, is installed to control thepolarization based on the following principle. The unpolarized light can be describedas the sum of two perpendicularly linear polarized waves. The wave thats polarizedperpendicular to the wires is not affected by the grid (wave length λ dwire thicknessof wire), but for the parallel wave the wires function as a metal surface: The electrongas is set into oscillation by the wave and emits a secondary wave; the beam is reflected.For achieving a circular polarization a combination of wiregrid and mirror is placed ina 45 angle to the light beam (shown in Fig. 2.4). The light polarized perpendicular tothe wires passes the grid, is reflected by the mirror and passes the grid again, where itinterferes with the parallel polarized light that is reflected by the grid. When the distancebetween grid and mirror is exactly a quarter of the wave length, hence giving this opticalelement the name λ/4-plate, the resulting wave will be circularly polarized. However,the circular polarized light can only be used in the ’transmission only’ mode. Due to thedescribed working principle of a linear polarizer, the same element is used as a beamsplitter, splitting the light into reference and sample beam. The latter is focused by a lensonto the sample, which is mounted inside the magneto-optical cryostat and transferredback into a parallel beam by another lens. For a better comparability two equal lenses areinstalled in a similar matter in the reference beam. While the mirror in the sample beamis motorized to maintain the destructive interference as mentioned above, the mirrorin the reference beam oscillates with a frequency of Ωmod ≈ 28Hz and an adjustableamplitude. This modulation mirror is primarily used to provide the information aboutthe transmission of the sample, as described below. A second beam splitter is installedto combine both beams again, which then interfere in another polarizer, before thecombined light gets focused into the bolometer.
The phase shift can be read out directly by the movement of the motorized mirror,which maintains an equal optical path length. Therefore the reference and sample beamlengths have to be calibrated to find the movable mirrors ’zero position’, by removingthe sample out of the sample beam and finding the zeroth order of the destructiveinterference. The polarizer in front of the detector has to be set in such a way that theelectric fields of reference Eref(t) and sample beam Esam(t) are subtracted from each
12

2.4 Summary
other. Therefore the intensity as measured in the bolometer is given by
I(t) = |Esam(t)− Eref(t)|2
= |Esam,0 ei(ωt+∆ϕ) − Eref,0 e
i(ωt+APM cos(Ωmodt))|2 (2.4)= E2
sam,0 + E2ref,0 − 2ErefEsam cos(∆ϕ− APM cos(Ωmodt)) ,
where the starting point of the time t = 0 was chosen in such a way that the equationshold. Here ω denotes the lights frequency and Esam,0 and Eref,0 are the amplitudes ofsample and reference beam, respectively. While the phase shift between both beams∆ϕ is constant over time, the induced phase shift by the modulation mirror with anamplitude APM and a frequency Ωmodt is time dependent. The movable mirror adjuststhe phase difference to ∆ϕ = 2πm by moving to the closest minimum, where the integerm denotes the order of the minimum. The direction that it has to move to is obtained byanalyzing the modulated signal. A measurement of the spectra can be used to confirmthat in fact the zeroth order was achieved, via the position of the minimum
∆l = (n− 1)d−mλ , (2.5)
where n (= 1 for the calibration measurement) is the refractive index and d the thicknessof the sample. ∆l is only independent of the wavelength λ at m = 0, when the dispersionof n is small enough that ∆n · d λ can be assumed.
While the transmission phase can be easily calculated by the position of the movablemirror, i.e. the minimum, the transmission is obtained by the curvature of the signalmodulated around the minimum and extracted by the applied lock-in technique.
2.4 SummaryThe experimental setups introduced above allow for an extensive investigation of mag-netic and magnetoelectric compounds, as presented in Chapters 4-7. For this work, thedirect observation of the magnetoelectric effect via the combination of an Electrometerand Physical Properties Measurement System is essential. The magnetic properties areinvestigated in the static regime by a Vibrating Sample Magnetometer and a TorqueMagnetometer and complimented by dynamic measurements of the magnetic resonancein a Mach-Zehnder interferometer operating with monochromatic sub-THz radiation.The latter also allows for the investigation of other dynamic phenomena, like a low-frequency phonon (Chapter 5.3) and the magnetic equivalent of superradiance (Chap-ter 7).
13

3 Magnetoelectric Effect
In this section the magnetoelectric effect will be introduced, considering the historicalbackground, prominent compounds and possible applications. Further details can befound in recent reviews about the linear [9] and higher order [10] magnetoelectric ef-fects (MEE) and magnetoelectric multiferroics [11; 12]. Moreover, the quantum theorydeveloped for describing the MEE in rare-earth ferroborates [6], which will be applied inChapter 4 and expanded in Chapter 5 for the MEE in HoxLa3−xGa5SiO14, is presentedand discussed.
All materials that were investigated in this work are magnetoelectric. While the rare-earth langasites are paramagnetic and dielectric (showing no ferroic order), yttrium irongarnet is ferrimagnetic and SmFe3(BO3)4 has even two coupled ferroic orders (anti-ferromagnetic and ferroelectric) and is, therefore, considered to be a magnetoelectricmultiferroic. While these materials are based on magnetic rare-earth ions, the samplesinvestigated in Chapter 6 are transition metal magnetoelectric multiferroics.
3.1 IntroductionThe possibility of a correlation of magnetic and electric material properties were firstdiscussed by Pierre Curie [3], as a consequence of his hypothesis: ’[...] when certain causesproduce certain effects, the elements of symmetry of the causes must be found in theeffects produced’1, which became later known as Curie’s principle. However, it tookmore than 65 years until the realization that a breaking of time-reversal symmetry ismandatory to get a magnetoelectric response, as formulated by Lev Landau and EvgenyLifshitz [4]. This lead to the first observation of an intrinsic ME in the form of an inducedmagnetization by (and linearly on) the application of an electric field in Cr2O3 [5]. It isquite remarkable that the reverse effect, an electric polarization induced by a magneticfield, was only measured a year later [13], since nowadays the latter effect is consideredto be more easily detectable, which becomes obvious after the derivation of the essentialequations, as discussed below. Both parts of the magnetoelectric effect in Cr2O3 revealedthe same linear dependence, manifest in the linear magnetoelectric susceptibility αij, inconsistence with the theory and as presented in the following.The linear (αij, SI-unit: s/m) and higher order (βijk, SI-unit: s/A; γijk, SI-unit: s/V)
magnetoelectric effects emerge from the coupling of electric (E = (Ex, Ey, Ez)) and1French original: ’Enfin, lorsque certaines causes produisent certains effets, les éléments de symétriedes causes doivent se retrouver dans les effets produits.’, see [3].
15
3 Magnetoelectric Effect
magnetic (H = (Hx, Hy, Hz)) fields in a material’s free energy, given in its most generalform as
F(E,H) = F0 − P siEi −M s
iHi − 12ε0εijEiEj − 1
2µ0µijHiHj (3.1)
−αijEiHj − 12βijkEiHjHk − 1
2γijkHiEjEk − ... ,
where P s (M s) represents the spontaneous polarization (magnetization), ε0 (µ0) and ε(µ) is the dielectric permittivity (magnetic permeability) of vacuum and the material,respectively, and the indices i, j, k denote the summation over the three spacial coor-dinates. In most of the cases, considering a specific compound simplifies this generalexpression by neglecting the terms that are prohibited by the material symmetry. Theelectric polarization and magnetization can be deduced by differentiating the free energywith respect to the electric and magnetic field, respectively:
Pi(E,H) = −∂F(E,H)
∂Ei
= P si + ε0εijEj + αijHj +
1
2βijkHjHk + γijkHiEj ... (3.2)
Mi(E,H) = −∂F(E,H)
∂Hi
= M si + µ0µijHj + αijEi + βijkEiHj +
1
2γijkEjEk ... (3.3)
Here we only included the first higher order magnetoelectric terms (βijk, γijk), while weleft out the third rank tensors for the purely electrically induced polarization (F3,E =1/6 δijkEiEjEk) and magnetically induced magnetization (F3,H = 1/6 ηijkHiHjHk) ofthe same order and all higher orders (e.g. dijklEiEjHkHl, where dijkl is a fourth ranktensor).
3.1.1 Linear Magnetoelectric Effect
In most of the experimentally investigated MEEs, the linear coupling dominates andtherefore allows for neglecting the higher order terms (the magnetoelectric susceptibilityis then often replaced by the dimensionless susceptibility χME
ij = cαij, where c is thespeed of light). With this approximation the magnitude of the change in polarization bya magnetic field compared to the complementary effect can be estimated, via
∆Pi = αijHj (3.4)
∆Mj =1
µ0
αijEi . (3.5)
16

3.1 Introduction
For example an α = 10psm−1 (corresponds to χ ≈ 3 · 10−3) would result for an appliedmagnetic field of µ0H = 1T in a polarization of P ≈ 8µCm−2, which is quite easy tomeasure with a voltmeter and samples of reasonable size, whereas a rather strong electricfield of 1000V/mm would only lead to an induced magnetization of µ0∆M = 0.01mT,which calls for experiments with magnetometers with a considerable sensitivity (e.g.SQUID magnetometers). The symmetry of the linear MEE (equal coupling betweenmagnetically induced polarization ∆Pi(Hj) ∝ αij and electrically induced magnetization∆Mj(Ei) ∝ αij) follows from the symmetry of second derivatives, which applies to thetwice differentiable free energy F (equation 3.1).From Curie’s first prediction of the MEE on, symmetry considerations were the main
drivers for finding magnetoelectric compounds. The first symmetry requirement for alinear MEE is the lack of an inversion center, which limits the candidates of linear mag-netoelectric materials to non-centrosymmetric compounds or a breaking of the inversionsymmetry, for example by a spin ordering, as in the case of the antiferromagnetic Cr2O3.Explaining the need for this requirement, offers an opportunity to demonstrate Curie’sprinciple: the separation of electric charges (which is achieved in the MEE by an appliedmagnetic field) is a non-centrosymmetric effect, i.e. no inversion center can be foundthat leaves the constellation untouched. If an inversion center could be found and de-fined with the coordinates (0, 0, 0) there would be for each charge at the coordinates(x, y, z) an identical charge at (−x,−y,−z), which would contradict the emergence ofcharge separation. Using now Curie’s principle, it can be concluded that the causes forthis non-centrosymmetric effect have to be non-centrosymmetric as well, and can befound for example in the broken spatial inversion symmetry of the crystal structure. Asmentioned above, Landau and Lifshitz found the necessity of breaking the time-reversalsymmetry to allow for a linear MEE. This can be achieved externally by applying amagnetic field or by moving the sample. The latter was actually shown already in 1888by Wilhelm Röntgen [2], more than 70 years before the finding of the intrinsic MEE, bythe observation of a magnetization that arose in a moving dielectric placed in an electricfield. The experiment consisted of a glass disc rotating between two capacitor plates,while the movement of a magnetic needle placed closely above the upper plate was ob-served with an optical setup. Opposing to this extrinsic breaking of the time-reversalsymmetry, the intrinsic breaking of this symmetry is achieved in Cr2O3 by the presenceof the spontaneous long-range magnetic order in the material.However, after the first experimental confirmation of the magnetoelectric effect the
interest in this physical phenomenon grew sparse over several decades: the search fornew compounds turned out to be complicated and the effect in the first investigatedcompounds was too weak (Cr2O3: α ≈ 4 psm−1) to be of any use for promising appli-cations. Thin films of the ferrimagnetic material Yttrium Iron Garnet (YIG), which areinvestigated in this thesis in respect to the emergence of magnetic superradiance, alsoexhibit a considerably strong magnetoelectric effect [14] with a linear magnetoelectricsusceptibility of α ≈ 30 psm−1 [15] and higher order contributions [16]. Only in therecent years, several compounds surpassed the value of α > 100 psm−1, like compounds
17

3 Magnetoelectric Effect
of the M2Mo3O8 (M = transition ion) [17] or the RMnO3 [18] crystal families. Thelargest linear MEE is considered to be exhibited by TbPO4 at low temperatures [19],with α = 730psm−1 [10].The upper bound serves as a tool for the efficient search for materials that exhibit a
strong linear MEE. It was first calculated for the dimensionless magnetoelectric suscep-tibility to be χME
ij <√εiiµjj [20] and later refined by an approximation for materials
with localized permanent magnetic moments [21] to satisfy
χMEij <
√χEiiχ
Mjj , (3.6)
with the electric and magnetic susceptibility
χEij = εij − 1 and χMij = µij − 1 , (3.7)
respectively.
3.1.2 Higher Order Magnetoelectric Effects
Compared to the vast amount of publications about the linear magnetoelectric effect,the observations of higher order effects are reported much more rarely, even though thesymmetry requirements are less strict and allow for example a bi-linear MEE in non-centrosymmetric magnets with an intact time-reversal symmetry [22], as we will see inthe following. The first measurement of a so-called ’paramagnetoelectric effect’, emerg-ing from a non-zero βijk, which leads to a term in the free energy proportional to EHH(’EHH magnetoelectric effect’), was reported in NiSO4·H2O in 1965 [23] and is consid-ered to be the most thoroughly investigated higher order MEE [9]. Similar quadraticmagnetoelectric effects were reported for example in BiFeO3 [24] or Pb(Fe1/2Nb1/2)O3
[25].A second order2 MEE emerging from a non-zero γijk (giving rise to a non-zero term
in F ∝ HEE, which will be denoted therefore as ’HEE magnetoelectric effect’) wasmeasured in yttrium iron garnet [14; 16], which can be described as a magnetic fielddependent electric susceptibility [27].As discussed above, the linear MEE is only permitted in media with certain symmetry
requirements that can be described by a subgroup of 58 magnetic point groups (outof the total 122 Shubnikov groups [28]). However, the symmetry requirements for thesecond order MEE are somewhat different. In general the EHH magnetoelectric effectis permitted in the 66 Shubnikov groups, which also allow for the piezoelectric effect(coupling between mechanical stress and electric polarization in certain materials [29]),
2In the literature the notation of ’second order’ magnetoelectric effects is used inconsistently. In thisthesis we will denote with ’second order’ MEE those effects that arise from non-zero third rankmagnetoelectric susceptibilities (e.g. βijk). Consequently ’third order’ MEE are connected to MEsusceptibilities of the fourth rank (e.g. πijkl). This nomenclature is consistent with [26].
18
3.1 Introduction
while the HEE magnetoelectric effect is possible in the 66 piezomagnetic (see e.g. [30])crystal classes [16]. In other words, the EHH magnetoelectric effect is allowed in timesymmetric media, while the spatial symmetry still has to be broken. On the other hand,the necessity for a broken time symmetry remains intact for the HEE magnetoelectriceffect, but it is allowed in centrosymmetric materials.
The third rank tensors for the higher order ME susceptibilities in equation (3.1) hasto be symmetric in the last two components, leading for example for the tensor of theEHH term in the free energy to
1
2βijkEiHjHk =
1
2βikjEiHkHj , (3.8)
which reduces the number of independent components of βijk (and similarly of γijk)from 27 to only 18 components, as argued by [10], and is therefore often replaced byonly two indices, e.g. βiν could replace βijk, where ν takes on the values from 1 to 6,which represents the combinations jk = 11, 22, 33, 12, 13, 23.
Even magnetoelectric effects above the third order (see footnote 2) were already elab-orated in the 1960’s in the form of the piezomagnetoelectric effect [31; 32], where thestress tensor σij is considered in the free energy
F(E,H, σ)π = −πijklEiHjσkl (3.9)
leads to an expansion of equation (3.2) by a term
P πi = −∂F
π
∂Ei= πijklHjσkl , (3.10)
where πijkl is the piezomagnetoelectric tensor.
In a similar way, the tensor dijkl was considered in the measurement of a third orderMEE in a spin glass system (Sr0.98Mn0.02TiO3) [33], giving similar equations:
F(E,H)d = −1
2dijklEiEjHkHl , (3.11)
P di = −∂F
d
∂Ei= dijklEjHkHl . (3.12)
Even though the higher order MEE is often dominated by the linear contribution, casesof a considerably strong higher order effect are known, as reported in the recently studiedholmium hexaborate HoAl3(BO3)4, with a magnetically induced electric polarization of3600µCm−2 at an applied field of 70 kOe [34], which is much larger than the polarizationinduced by comparable field strengths of linear magnetoelectrics. Another strong higherorder MEE will be presented in Fig. 5.4 and discussed in Chapter 5.
19

3 Magnetoelectric Effect
3.1.3 Microscopic Mechanism
An overview about possible microscopic theories of the linear magnetoelectric effect isgiven in [35]. The mechanisms that can induce a change of the magnetic propertiesof a compound by an applied electric field are discussed with respect to the possibleinteractions.
Single-Ion Anisotropy
The direction of the spins of an ion in a crystal depends on the magnetic field and thesingle-ion anisotropy. The latter provides the direction of the easy axis or easy plane,i.e. the preferable direction of the spins, while the magnitude of the anisotropy is ameasure for how strong this preference is. In many cases, the spins are assumed as’Ising-spins’, which means that they are either parallel or antiparallel to the easy axis.This approximation is feasible, when the single-ion anisotropy is large ( |B|). In thisso-called ’Ising-limit’ the MEE can only occur, if the direction of the easy axis changes,which can happen when the electric field induces a change of the local symmetry by amovement of the ions relative to their ligands. On the other hand, a vanishing single-ionanisotropy leads to ’free spins’ without any preferred direction that can align parallelto the magnetic field. The spin anisotropy energy for the i-th ion can be assumed to beproportional to the second power of the effective spin moment (S)
Esinglei ∝ (Sρi )2 , (3.13)
for the coordinates ρ = x, y, z. In general all even powers of spin operators have tobe considered (satisfying the time-reversal symmetry), but since in all magnetic pointgroups, which allow for a MEE, the second order term is non-zero and dominates, thisapproximation is sufficient [35].
Symmetric Superexchange
The orbital overlap of two neighboring magnetic ions influences the exchange integralsand energies. However, more commonly the interaction of two magnetic ions is mediatedby a non-magnetic ion inbetween, which is the so-called ’superexchange’. In a symmetricconfiguration this contribution takes on the form of
Esymmij ∝ rij(S
ρi S
ρ′
j + Sρ′
i Sρj ) , (3.14)
where rij = ri− rj is the distance between the two ions at ri and rj and ρ, ρ′ ∈ x, y, z.An application of an electric field could induce a movement of cation and anion inopposite directions and modify their electron wave function, which can cause a changeof the orbital overlap and equation (3.14). In this way the mechanism could give rise toa MEE.
20
3.1 Introduction
Antisymmetric Superexchange
In crystals with low symmetry the superexchange configuration may not be symmetric,e.g. the exchange interaction is mediated by a non-magnetic ion, which does not lie in thecenter of the connecting line between the two magnetic ions. The antisymmetric exchangeis only allowed to be non-zero when the inversion symmetry of the bond direction isbroken, which can be achieved by polarizing or moving the ions relatively to the cell byan external electric field. The superexchange term can be written as the antisymmetricversion of equation (3.14):
Eantiij ∝ rij(S
ρi S
ρ′
j − Sρ′
i Sρj ) . (3.15)
This contribution was elaborated by Dzyaloshinsky [36] and Moriya [37], hence theprominent name ’Dzyaloshinsky-Moriya interaction’, and is considered to be substan-tially weaker than the symmetric contribution. However, the absolute change of bothcontribitutions by the described mechanisms might be of the same order of magnitude[9].
Dipolar Interaction
The magnetic dipolar interaction is a long-range and rather weak interaction, whichis responsible for determining the domain size in ferromagnetic materials. However, aconsiderable change of magnetic anisotropy might be induced in a piezoelectric materialby an applied electric field, when the distortion leads to a change of the magnetic dipolfields by moving the magnetic ions in a nonuniform way. This interaction leads to acontribution
Edipolij ∝ mimj
r3ij
− 3(mirij)(mjrij)
r5ij
(3.16)
including the magnetic dipole moment mi for the i-th ion [35].
Zeeman energy
The g-tensor (often simply denoted as g-factor) links the magnetic moment of a par-ticle to its quantum angular momentum. In the case of an atom with a spin angularmomentum S and an orbital angular momentum L the g-factor takes on the form ofthe Landé g-factor, gJ , which can be approximated with assuming the electron orbitalg-factor gL ≈ 1 and the electron spin g-factor gS ≈ 2 as:
gJ ≈3
2+S(S + 1)− L(L+ 1)
2J(J + 1), (3.17)
where J = |J| (L, S are accordingly defined) with the total angular momentum J = L+S.It determines the splitting ∆EZ of two degenerate energy levels of an atom in a magnetic
21

3 Magnetoelectric Effect
field with strength B, i.e. the Zeeman effect
∆EZ = gJµBB , (3.18)
where µB is the Bohr magneton.Even though the g-tensor can be assumed to be isotropic whenever the spin-orbit
coupling can be neglected, it is anisotropic in the general case and depends on thewave functions of the ground states, which are determined by the local symmetry ofthe magnetic ions. An applied electric field can modify the wave functions, in the senseof displacing the electrons from the equilibrium position around the core, which leadsto a change of orbital momentum. This effect of an induced change of the local crystalsymmetry would result in a change of the g-tensor due its described definition. Thecontribution of this interaction is proportional to the local or applied magnetic field B:
EZeemani ∝ Bρgρρ
′
i Sρ′
i . (3.19)
This effect is responsible for one of the strongest linear MEE, as measured in TbPO4
[19].
3.1.4 Magnetoelectric Multiferroics
Multiferroics are defined as materials that show more than one ’ferroic’ property in thesame phase [38]. Those properties are ferroelasticity, ferrotoroidicity, ferroelectricity andferromagnetism, which is usually expanded by antiferromagnetism (and ferrimagnetism).This combination of properties can give rise to a coupling between both ferroic orders insuch a way, that the field associated with one ferroic property can influence or controlthe second ferroic property. For the presented work, the most interesting subgroup ofmultiferroics are magnetoelectric multiferroics, which are again a subgroup of magneto-electric materials, as discussed above, and combine (anti-)ferromagnetic ordering withferroelectric properties. However, it should be noted that magnetoelectric multiferroicscan only be understood as a subgroup of magnetoelectrics in the presented definitions ofthe notions, as pointed out in [39]. Deviating definitions of ’multiferroics’, were antifer-romagnetism and -electricity are excluded, and ’magnetoelectrics’, which are sometimesrestricted to materials that exhibit the linear magnetoelectric effect (αij 6= 0), exist inliterature.The combinations of (anti-)ferromagnetic and (anti-)ferroelectric properties attracted
much scientific attention, as recently discussed in [12], due to the associated promis-ing applications, e.g. magnetoelectric memory [40]. Moreover, novel phenomena wereobserved in multiferroics, like coupled magnetoelectric excitations, so-called ’electro-magnons’, which were first observed in rare-earth manganites RMnO3 (R = Rare earth)[41], electric conductivity in multiferroic domain walls [42], the optical magnetoelectriceffect, or nonreciprocal directional dichroism, as observed for example in GaFeO3 [43]
22

3.1 Introduction
and many more [11]. The most studied magnetoelectric multiferroic is BiFeO3, which ex-ceptional nature arises, among other intriguing features, from a reported large remanentpolarization of ≈ 55µC/cm2 in the ferroelectric hysteresis loops and ferroelectric andantiferromagnetic order well above room temperature in thin film heterostructures [44].While the magnetism in bismuth ferrite originates from d-electrons, some multiferroicsbased on f -electron magnetism are known, like Eu0.5Ba0.5TiO3 [45]. As an additional ap-proach in the search for new multiferroics, composite materials of two individual ferroiccompounds were created and investigated, which allow for the same coupling and effectsas conventional magnetoelectric multiferroics. Examples for such a composite multifer-roic is the combination of the ferroelectric BaTiO3 with the magnetic CoFe2O4 [46],the multilayer LuFeO3/LuFe2O4 [47] and many more are discussed in recent reviews[9; 12; 48].
3.1.5 ApplicationsThe investigation of magnetoelectric materials and especially magnetoelectric multi-ferroics is driven by the prospect of potential applications (e.g. [11]), and is focusedon microelectronic devices [12]. Additionally, it should be mentioned that especially inthe early years the research of the MEE was supported by the outlook of promisingapplications in basic research, e.g. for determining magnetic symmetries or observingantiferromagnetic domains [38].One of the most prominent examples is the use of the voltage-control of the mag-
netization to build a magnetoelectric random access memory (MERAM), which cancombine the advantages of ferroelectric RAM (ultrafast electrical write-operation) withmagnetic RAM (non-destructive read-operation), as proposed in [40]. A short and sim-plified description of the disadvantages of conventional magnetic memories and conven-tional random access memories can illustrate the motivation behind the development ofmagnetoelectric RAM, as follows. Magnetic storage devices are based on a simple mech-anism: The binary information is stored on a magnetized medium by translating a ’0’into one direction of magnetization and a ’1’ into the opposite direction. Recording datais therefore achieved by applying a magnetic field focused at the position of the bit. Therecording or reading over several bits is usually implemented mechanically. The mechan-ical movement limits the speed, which is the main disadvantage of such storage devices.Faster recording and saving sequences can be achieved by storing the data electricallyon random access memory. In such devices the data does not have to be recorded andread out in a certain order, hence the name ’random access’, and the processing speedis not limited by mechanical components. The data is stored on capacitors, which haveto be refreshed constantly to prevent loosing the data due to a slow discharge. There-fore this type of memory is considered a volatile storage device; when the power supplyis switched off, all data is lost. A possible combination of the non-volatility of mag-netic memories with the high speed that arises from electrically adressing the storagein a ’random access-type’ memory is the main advantage of memory devices based on
23

3 Magnetoelectric Effect
magnetoelectric multiferroics. Even though the same is already achieved with differenttechnologies (e.g. floating gate MOSFET), the imaginable information density that canbe reached with the development of a MERAM is still promising for intriguing benefits.In fact, recent reports show a noteworthy progress in engineering such a device [49].
Other technological implementations that are already remarkably advanced on thepath to practical applications, reach from weak magnetic field detection (e.g. [50]) tovoltage-controlled phase shifters in the sub-THz frequency regime (e.g. [51]). Furtherideas are discussed in several reviews [9; 11; 12; 39], including voltage-tunable magne-toresistance, electric field-tunable microwave signal processing, spin-wave generation andmany more.
3.2 Theory of the Magnetoelectric Effect in Rare-EarthFerroborates
Rare-earth ferroborates attracted first scientific attention around the turn of the cen-tury due to their promising optical features, which are especially interesting for opticalapplications [52], and unusual magnetic properties [53]. First experimental observationsof a magnetoelectric effect were made in GdFe3(BO3)4 in 2005 [7], which lead to furtherpublications about measurements of the magnetoelectric nature of different rare-earthferroborate compounds (e.g. [54]) and the modeling of the magnetoelectric effect [6] inthis magnetically rather complex system. The particular interest in this material grouparises from the peculiarly strong MEE and the unusual combination of two single-ionsmechanisms behind it.
Rare-earth ferroborates (general formula: RFe3(BO3)4; R = rare-earth ion) belong tothe hexagonal R32 space group; rhombohedral with a threefold and a twofold symmetryaxis perpendicular to each other. The magnetic properties emerge from the Fe3+ andR3+ subsystems, which are coupled by exchange-interaction. The iron ions order belowthe Néel temperature (TN ≈ 32K for SmFe3(BO3)4 and in the same range for the othercompounds) into two subsystems with magnetization M1 and M2. The rare-earth ionsare split in the same way into two sublattices (q = 1, 2), which are assumed to be coupledby the exchange interaction mostly to the Fe3+ subsystemM1 andM2, respectively. Thisleads to a total effective magnetic field at the rare-earth sites
hq = H + λMq , (3.20)
in an external magnetic field H, where λ is the constant of the molecular field of the ironsublattices. This expression is expanded to account for the antiferromagnetic ordering ofthe iron sublattices and their saturation at a field Hsat ≈ 106 Oe, leading to an effective
24

3.2 Theory of the Magnetoelectric Effect in Rare-Earth Ferroborates
magnetic field
hq =
(Hmol
Hsat
)Hex + (−1)qHmol
√1−
(H
Hsat
)2
ey , (3.21)
when the external field is applied along the a-axis. Here the strength of the molecularfield Hmol = λMq was extracted to be Hmol = 50 kOe for R = Nd ferroborate [55]. ForR = Sm ferroborate it was estimated to be Hmol = 330 kOe [6].In the rare-earth ions the magnetism arises from the 4f -electrons, which energy lev-
els are degenerate in free space. However, assuming a rare-earth ion in a crystal, thisdegeneracy may be split by the electronic surrounding. This influence of the charge dis-tribution on the magnetic ion is described by the crystal field Hamiltonian HCF, whichtakes on the general form
HCF =∑tτk
BtτCtτ (k) , (3.22)
where k is the wave vector, Btτ are the crystal field parameters, which are usually deter-
mined by symmetry considerations and experimental techniques (e.g polarized absorp-tion spectroscopy) and Ctτ (k) are the single-electron irreducible tensor operators, whichdescribe the electron orbital configuration and are defined by the Laplace spherical har-monics3 Y t
τ
Ctτ (k) =
√4π
2t+ 1Y tτ (θ, φ) , (3.23)
which are defined as
Y tτ (θ, φ) =
√(τ − t)!(τ + t)!
P tτ (cosθ)e
itφ (3.24)
were k is replaced by the two angles θ and φ and the associated Legendre polynomialsof the order τ and the power t are given as4
P tτ (x) = (−1)t(1− x2)t/2
dt
dxt(Pτ (x)) , (3.25)
where Pτ (x) are the Legendre polynomials of order τ . The non-zero crystal field param-eters can be identified by considering the symmetry of the rare-earth sites, which arecharacterized by the D3 symmetry around the crystallographic c-axis (in the Cartesiansystem z), which leaves us with
HCF = B20C2
0 +B40C4
0 +B60C6
0 + iB4−3(C4
−3 +C43) + iB6
−3(C6−3 +C6
−3) +B66(C6
6 +C6−6) . (3.26)
3In the literature the indices lm are used more commonly. The notation tτ is used in consistency with[6] to prevent a confusion with the quantum numbers l and m.
4For the sake of simplicity, we only give the polynomials for τ ≥ 0.
25

3 Magnetoelectric Effect
As discussed previously, the magnetic field and temperature dependence of the elec-trical polarization is derived by considering the free energy, which emerges from theHamiltonian describing the system. The complete derivation is rather complex and canbe found in [6]. We will give here the final expressions for the electric polarization alongthe two in-plane axes x, y:
Px = QgJµB
∑q=1,2
hqχ(hq, T )(C1(γ2qy − γ2
qx)− C2γqyγqz) (3.27)
Py = QgJµB
∑q=1,2
hqχ(hq, T )(2C1γqxγqy + C2γqxγqz) . (3.28)
Here Q is a constant, depending on the number of rare-earth ions and the distributionof energy levels of their electronic configuration; hq is the absolute value of the effectivemagnetic field, which is given by Eq. (3.20); C1,2 are two constants, which are calculatedto be C1 = 4.92 and C2 = 7.09 for samarium ferroborate; γqα are the three components(α = x, y, z) of the unit vector along the effective magnetic field hq/hq; and finally theBrillouin function
χ(hq, T ) =1
∆q
tanh
(gJµBhqkBT
∆q
), (3.29)
where the dimensionless anisotropy factor is given as
∆q =√g2‖γ
2q‖ + g2
⊥γ2q⊥ . (3.30)
Here the magnetic spectroscopic factors for SmFe3(BO3)4 are g‖ = 0.379 and g⊥ = 1.441,where ‖,⊥ denotes the components along and perpendicular to the c-axis, respectively.Unfortunately, the origin of these values is not indicated in [6].Eq. (3.27) is used for fitting the high-field behavior of the magnetically induced po-
larization in samarium ferroborate, as seen in Fig. 4.3 and explained in Chapter 4.1.The presented approximation does not account for a magnetically induced polarization
along the crystallographic c-direction, due to neglecting higher order terms in the appliedperturbation theory [6].
3.3 Summary
The magnetoelectric effect is the coupling of magnetic and electric properties in a solid.In the linear magnetoelectric effect the electrically induced magnetization is proportionalto the applied electric field and vice versa. Higher orders, however, can lead to a morecomplex proportionality. The possible microscopic mechanisms that can lead to these ef-fects span from the interaction of magnetic ions to a change of the single-ion anisotropy.Research for magnetoelectric materials attracted scientific interest throughout the pastdecades and offers the realization of many intriguing potential applications in microelec-
26

3.3 Summary
tronics. The presented theory of the magnetoelectric effect in rare-earth ferroborates isapplied in the next chapter for SmFe3(BO3)4.
27


4 Magnetoelectric Effect in SamariumFerroborate
As discussed in Chapter 3, rare-earth iron borates attracted much scientific attentiondue to the discovery of a strong magnetoelectric effect, which is already extensivelystudied and well described by a quantum theory [6], as outlined in Chapter 3.2. Never-theless, we were able to contribute to this field of research by two sets of measurementon SmFe3(BO3)4. Firstly, our measurements provided new insights into the high-fieldbehavior of the magnetically induced electric polarization along the crystal’s a-axis, Pa,by an in-plane magnetic field. The experimental determination of the g-factor of thesamarium ions in this system is noteworthy, since the values reported in literature areinconsistent (e.g. [6; 56]). Difficulties in determining the samarium g-factor arise from itsrather small value. However, we present a method to accurately determine the g-factorwith an error of only about one percent. Secondly, we observed an induced electric po-larization along the crystallographic c-axis, Pc, corresponding to a MEE of the sixthorder.
4.1 High-Field Magnetoelectric EffectThe measurement of the high-field magnetoelectric effect in [54] reveals not only a sat-uration of Pa for small magnetic fields along a- and b-axis, but also shows a decrease atfields above 5T, which is accounted for in the theory by modifying the effective magneticfield (Eq. 3.21) with the introduced Fe-Sm molecular field of the strengthHmol = 330 kOe[6]. However, theory and experiment did not show a perfect agreement and called forfurther investigations. Unfortunately, the origin of the chosen molecular field strengthwithin [6] remains unclear and we will show that the actual value has to be modified.With this newly determined Hmol, the g-factor of the samarium-ions in this system canbe calculated, based on the optically obtained value for the splitting of the ground stateof ∆ = 13.2 cm−1 [57]. The g-factor that will be determined in the following is moreaccurate than the strongly varying literature values ([6]: ≈ 0.412, [56]: ≈ 0.679). In thissection we only deal with the ⊥-component of the g-factor (see Chapter 3.2).We extend the discussed observations with measurements in a PPMS with static
magnetic fields along the crystal’s b-axis of up to 14T (Chapter 2.2) and in a pulsedmagnetic field with a strength of up to 56T, where the decrease in polarization becomesmore pronounced and thus gives additional data to determine the exact parameters Hmol
29

4 Magnetoelectric Effect in Samarium Ferroborate
cc
Sm
ab
c
b*
b
a
H
B
Fe
Figure 4.1: Structure of SmFe3(BO3)4. The oxygen-ions coordinating the cations arelocated at the corners of the polyhedra. Three different directions are shown:a three dimensional view (bottom) and the a-cut (top left) and c-cut (topright) directions. The compound consists of alternating layers of Sm-Fe andB-O ions along the c-direction.
30

4.1 High-Field Magnetoelectric Effect
M1
M2
M1
M2
Fe Sm Fe Sm
M1
M2
M1
M2
Fe Nd Fe Nd
HH=0
H
weakAM
weakAM
strongAM
strongAM
Figure 4.2: Illustration of the coupling as described in Chapter 3.2 between the rare-earth magnetic moments to the two magnetic iron subsystems M1 and M2.This coupling is found to be antiferromagnetic [58]. However, the strengthof this coupling can vary strongly in the different compounds of the rare-earth-ferroborate family. This simplified sketch demonstrates that the weaklycoupled neodymium moments cant into the direction of the applied field ofµ0H > 5T, while the antiferromagnetic coupling of the samarium momentsto the iron sublattices dominates for fields below Hmol, which is deter-mined in Table 4.1.
31
4 Magnetoelectric Effect in Samarium Ferroborate
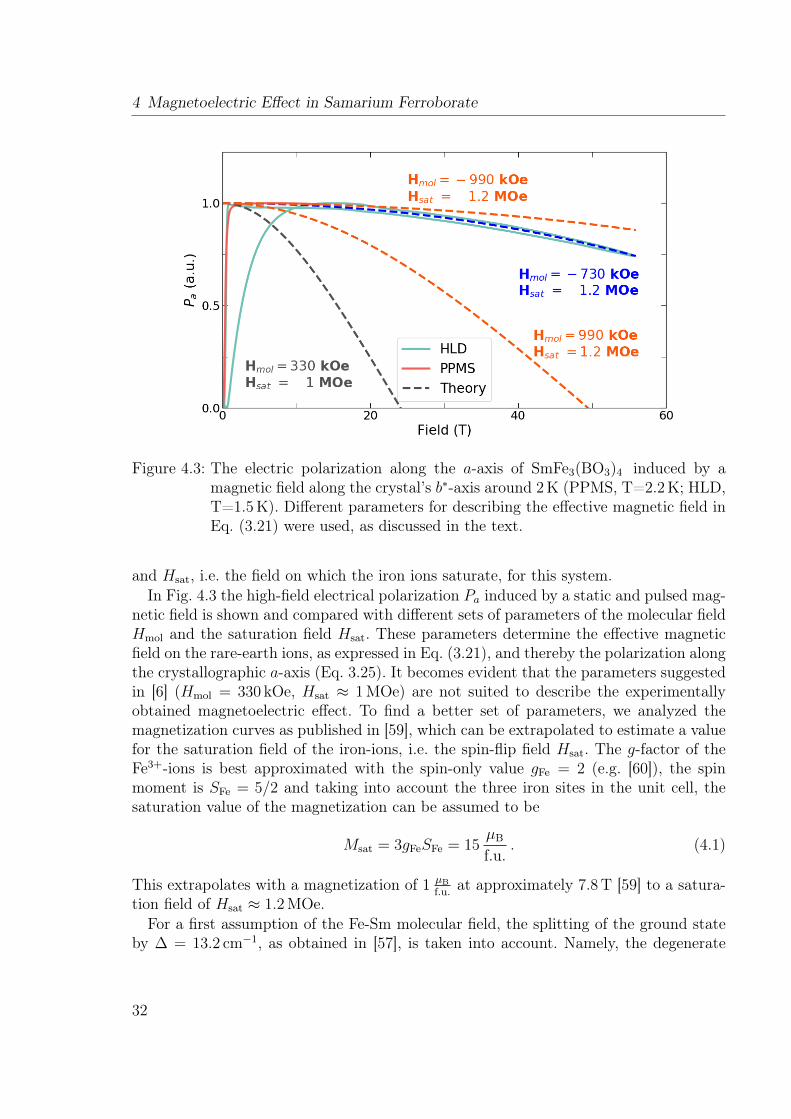
Figure 4.3: The electric polarization along the a-axis of SmFe3(BO3)4 induced by amagnetic field along the crystal’s b∗-axis around 2K (PPMS, T=2.2K; HLD,T=1.5K). Different parameters for describing the effective magnetic field inEq. (3.21) were used, as discussed in the text.
and Hsat, i.e. the field on which the iron ions saturate, for this system.In Fig. 4.3 the high-field electrical polarization Pa induced by a static and pulsed mag-
netic field is shown and compared with different sets of parameters of the molecular fieldHmol and the saturation field Hsat. These parameters determine the effective magneticfield on the rare-earth ions, as expressed in Eq. (3.21), and thereby the polarization alongthe crystallographic a-axis (Eq. 3.25). It becomes evident that the parameters suggestedin [6] (Hmol = 330 kOe, Hsat ≈ 1MOe) are not suited to describe the experimentallyobtained magnetoelectric effect. To find a better set of parameters, we analyzed themagnetization curves as published in [59], which can be extrapolated to estimate a valuefor the saturation field of the iron-ions, i.e. the spin-flip field Hsat. The g-factor of theFe3+-ions is best approximated with the spin-only value gFe = 2 (e.g. [60]), the spinmoment is SFe = 5/2 and taking into account the three iron sites in the unit cell, thesaturation value of the magnetization can be assumed to be
Msat = 3gFeSFe = 15µB
f.u.. (4.1)
This extrapolates with a magnetization of 1 µBf.u. at approximately 7.8T [59] to a satura-
tion field of Hsat ≈ 1.2MOe.For a first assumption of the Fe-Sm molecular field, the splitting of the ground state
by ∆ = 13.2 cm−1, as obtained in [57], is taken into account. Namely, the degenerate
32
4.1 High-Field Magnetoelectric Effect
ground state (Kramers doublet) of the Sm3+-ion is split by the local effective field ofthe Fe ions. With a g-factor of samarium gSm equal to the Landé value gJ,Sm = 2/7 thiswould correspond, related by the so-called Larmor presession, to a strength of
Hmol =hc
gSmµBµ0
∆ ≈ 990 kOe , (4.2)
where h is the Planck constant.Furthermore, the sign of the coupling between the samarium- and the iron-ions needs
to be considered. By studying the possible exchange paths between rare-earth and ironions, [58] concludes that the coupling is antiferromagnetic in gadolinium ferroborate.This fits very well to the increase of the magnetization when admixing La-ions on theSm-sites [59], indicating an antiferromagnetic coupling of Sm- and Fe3+-ions. This can beconsidered in the effective magnetic field by an opposite sign of Hmol and Hsat. However,the set of parameters, which were estimated based on the literature, does not give a goodagreement between theory and experiment (orange curves in Fig. 4.3). The most likelyconclusion is that the molecular field Hmol is deviating from Eq. (4.2), because the Smg-factor differs from the Landé value gSm 6= 2/7 and the value of 0.412 as assumed in [6].Therefore, we extract its actual value by fitting our data with a fixed spin-flip field anda fixed splitting ∆. The result for the different theoretical curves, as shown in Fig. 4.3are given in Table 4.1, including the refined value of the samarium g-factor of ≈ 0.39,which is substantially larger than the originally assumed value (gJ,Sm = 2/7 ≈ 0.29).The error in the fit is considerably small and only of about 1%. The experimental erroris also small, since only relative field strengths play a role in this analysis. Therefore wecan conclude that the presented value of gSm is accurate and can replace the stronglyvarying literature values.
[6] [57] & [59] Fit∆ 6.3 cm−1 13.2 cm−1 13.2 cm−1
gSm 0.412 2/7 0.388Hmol 330kOe 990kOe 730 kOeHsat 1MOe 1.2MOe 1.2MOe
Table 4.1: Different parameters for fitting the electrical polarization Pa induced by ahigh magnetic field. Bold values were fixed, based on literature values andestimations, as discussed in the text. The value of ∆ in the first column isderived in accordance to the values given for gSm and Hmol in [6]. The Sm-Femolecular field Hmol depends on the samarium g-factor gSm and its splitting∆, which is fixed to 13.2 cm−1 for the last two columns. In the last columnthe molecular field was fitted (blue) to estimate the actual g-factor.
33

4 Magnetoelectric Effect in Samarium Ferroborate
4.2 Induced Polarization along the c-axisSo far only the magnetoelectric effect with an electric polarization along the a-axisof rare-earth ferroborates has been reported in the literature. Nevertheless, a possibleoccurance of a magnetically induced Pc is already mentioned in [6]. Here we report theexperimental observation of this higher order MEE and show that it satisfies a simplephenomenological model, based solely on symmetry arguments. The observed effect isvery similar to the MEE in HoxLa3−xGa5SiO14, which will be discussed in Chapter 5,where a microscopic model is developed. However, the simple symmetry-based model issufficient to provide a first explanation of the effect in SmFe3(BO3)4.The similarity of the MEE in both compound families can be understood by the two
different space groups, which share an important feature: in space group P321 (langa-sites) and R32 (ferroborates) the threefold c-axis and the twofold symmetry axis per-pendicular to c are present. Therefore it can already be concluded that any polarizationalong the threefold axis induced by a magnetic field, which is rotated in the ab-planehas to satisfy at least a sixfold symmetry, which emerges from the crystal’s (threefold)and the time reversal symmetry of the electric polarization (twofold). Due to the twofoldsymmetry axis along a, no Pc can be expected when the magnetic field is applied alongthe main crystallographic axes a, b, c. Therefore the magnetic field was rotated in stepsof 5 in the ab-plane to search for this higher order magnetoelectric effect. And indeedwe were able to experimentally obtain an electric polarization along the crystal’s c-axis,as shown in Fig. 4.4.However, the polarization is so small that it is likely dominated from a stray polar-
ization along the a-axis, since Pa is already for rather low fields in the range of severalhundred µCm−2. To remove this distortion of the signal, the twofold symmetry of Pawas used, which emerges when the magnetic field is rotated in the ab-plane. Thereforethe Pc was extracted by subtracting the angular dependence with a sin(2φ) fit. We wereable to show (Fig. 4.5) that the resulting polarization along the c-axis convincingly sat-isfies the expected sixfold symmetry, as argued above. It is noteworthy that the valuesof Pc decrease for larger fields. This cannot be explained by the presented simple modeland, therefore, calls for an approach considering the microscopic magnetic structure ofSmFe3(BO3)4.
4.3 SummaryIn this Chapter, we successfully refined the theory of the magnetoelectric effect in rare-earth ferroborates [6]. With the literature values for the splitting of the lowest lyingdoublet, ∆, and the saturation field, Hsat, we extracted the molecular field, Hmol, byfitting the high-field magnetoelectric effect. This lead to an accurate determination ofthe samarium g-factor. Furthermore, we were able to show the presence of a higher-orderMEE for Pc.
34

4.3 Summary
Figure 4.4: The electric polarization along the c-axis of SmFe3(BO3)4 induced by amagnetic field applied in the ab-plane with an angle of 15 (solid) and 75(dashed) to the a-axis, respectively. The angular dependence were extractedfrom these and further measurements by reading out the polarization atdifferent temperatures (color) and different fields (2T and 14T) and areanalyzed in Fig. 4.5.
35

4 Magnetoelectric Effect in Samarium Ferroborate
Figure 4.5: Analysis of the electric polarization along the c-axis induced by magneticfields rotated in the crystal’s ab-plane for different temperatures at a fixedmagnetic field (left) and different field strengths at a fixed temperature(right), respectively. The theoretical lines (dashed) are simple fits with sinecurves. The residual ∆Pc (bottom) is the difference of the experimental curve(top) and the corresponding fit.
36
5 Magnetic Properties and theMagnetoelectric Effect inHo-Langasite
The finding of a puzzling combination of a linear and a higher order MEE in holmium-doped langasite [61] motivated a thorough investigation of the magnetic properties ofthis compound. The main features of the dependence of the induced electric polariza-tion on the magnetic field vector can be explained by a simple phenomenological model,which will be introduced in Chapter 5.1. However, no perfect agreement with the low-temperature magnetoelectric effect and magnetization curves is achieved and furtherinconsistencies are revealed by measurements of the angular dependence of the mag-netization and the magnetic torque, as presented in Chapter 5.2. Therefore the firstapproximation will be extended in Chapter 5.2 by taking into account a more complexmagnetic structure. These studies led to the unexpected discovery of the magnetic fieldsensitivity of a strong low-frequency phonon, which exhibits some sensitivity to magneticfields, as discussed in Chapter 5.3.
5.1 Simple Phenomenological Model of theMagnetoelectric Effect
We present the experimental study of the holmium-doped langasite HoxLa3−xGa5SiO14,which exhibits a puzzling combination of linear and highly non-linear magnetoelectricresponses in the disordered paramagnetic state, as published in [61]. While the mag-netic field scans of the electric polarization show quasi-linear dependence, the inducedpolarization oscillates six times upon the rotation of the magnetic field vector. Eventhough straightforward symmetry considerations are sufficient to qualitatively describethe observed angular dependence, a derivation of the phenomenological Hamiltonianbased on the microscopical mechanisms is necessary, to be able to explain the obtainedcombination of a linear and higher-order MEE.
5.1.1 Holmium LangasiteLangasite, La3Ga5SiO14, and related compounds were first synthesized in the 1980s inRussia and actively studied since then for a wide range of interesting properties, as their
37

5 Magnetic Properties and the Magnetoelectric Effect in Ho-Langasite
a
b
a ba(x)
b
RGaGa/SiO
AB
DO
c(z)
a(x)
Fe
b*(y)
Figure 5.1: The structure of rare-earth langasite with the general formula R3Ga5SiO14
(a) and iron containing langasite with the general formula A3BFe3D2O14
(b). The lines illustrate the antiferromagnetic interactions that give rise to ageometric frustration of the rare-earth ions on the distorted kagomé lattice(left) and the iron ions on the triangle lattice (right).
non-linear optical, elastic and piezoelectric properties [62; 63], and associated applica-tions, with early implementation as surface and bulk acoustic wave filters [64]. Varioushigh-temperature piezoelectric applications, including gas sensoring and deposition ratemonitoring for vapor-phase deposition, were suggested for bulk acoustic wave resonators,which can operate at up to 900 C [65] or further high-temperature applications, likesensoring pressure, force and acceleration [66]. The recent progress in electro-opticalapplications is also noteworthy, as reported for example in [67; 68].The compounds of the langasite family belong to the non-centrosymmetric crystal-
lographic space group P321, which allows for optical rotation and piezoelectricity, butnot for spontaneous electric polarization due to the presence of orthogonal threefold andtwofold symmetry axes, which can easily be identified in the structure [69; 70], visualizedin Fig. 5.1.The study of magnetoelectric properties was focused on Fe-substituted langasites (gen-
eral formula: A3BFe3D2O14, where A, B, D denote the three substitutable cation sites)showing non-collinear periodically modulated orders of Fe-spins [71]. The interplay be-tween magnetic frustration, structural and spin chiralities gives rise to a rich variety ofmultiferroic behaviors in these compounds [72; 73]. The magnetic frustration does notonly play a role in the Fe-langasite, where the antiferromagnetically interacting Fe3+-ions lie on the three corners of an equilateral triangle in the crystallographic ab-plane, asvisualized in Fig. 5.1b, but also in rare-earth langasites, where the magnetic ions formin the ab-plane a distorted kagomé lattice [70], i.e. corner sharing triangles (Fig. 5.1a),which can give rise to exotic low temperature effects like a spin-liquid phase [74; 75].However, in the compound that this work is focused on, the rare-earth site is mostlyoccupied by non-magnetic ions (La) and only a small percentage of magnetic ions (Ho),
38

5.1 Simple Phenomenological Model of the Magnetoelectric Effect
lifting the geometric frustration.The investigated samples are single crystals of magnetically diluted holmium langa-
site: HoxLa3−xGa5SiO14, with x = 0.043 ± 0.005, which were grown by the Czochralskitechnique. For the electric polarization experiments a plane-parallel plate with thicknessd = 2.13mm and area A = 106mm2 has been cut with the flat surfaces of the sampleparallel to the ab-plane. Additional samples of smaller size were used for the preliminaryVSM measurements, originating from the same batch. The crystals were proven to beright-handed single domain [64; 69], which is likely a result of the growth procedure. Thiswas confirmed by obtaining a homogeneous polarization rotation of about 5 for greenlight along the crystallographic c-axis for the described sample, which is in reasonableagreement with the literature data [76].Within the unit cell of Ho-langasite there are three equivalent rare-earth positions
(R=La, Ho) with a rather low C2-symmetry along the a-axis of the crystal, allowing forelectric dipole moments on R-sites, which in the case of magnetic Ho-ions can dependon an applied magnetic field. The electronic configuration of the Ho3+-ions is 4f 10 andthe ground state is 5I8.The local axes are denoted with Xi, Yi, Zi for the three sites, distinguished by i =
1, 2, 3, with local C2-symmetry axes along Zi, which are related by 120-rotations aroundthe crystallographic c-axis (C3 symmetry axis). For i = 1 the axes are chosen in sucha way that the following relation between the unit vectors in the hexagonal (a, b∗, c),Cartesian (x, y, z) and the three local frames holds:
Z1 = a = x,
X1 = b∗ = y,
Y1 = c = z.
(5.1)
On all three sites Yi = (0, 0, 1) in the Cartesian coordinates, Z2,3 = (−12,±√
32, 0) and
X2,3 = (∓√
32,−1
2, 0).
5.1.2 Magnetization
The Ho-doped langasite is paramagnetic and does not order down to the lowest tempera-tures. However, the magnetization saturates already at fields ≈ 1T at low temperatures,inducing a long-range order. These small saturation fields suggest that the magnetismof the Ho3+-ions is dominated by the two lowest-energy levels split by the crystal fieldfrom the other states of the J = 8 multiplet. The level splitting ∆ in this so-callednon-Kramers doublet1 is estimated to be 3.1K. A more accurate value is extracted byquasi-optical measurements of the paramagnetic resonance (Chapter 5.2.5) and will beimplemented in the expansion of the presented model in Chapter 5.2. The magneticmoments of the Ho-ions are assumed to be of Ising-type. The magnetic field dependence
1Ho3+ has an even number of f -electrons and is therefore considered a non-Kramers ion.
39

5 Magnetic Properties and the Magnetoelectric Effect in Ho-Langasite
Figure 5.2: Magnetization curves as obtained in a vibrating sample magnetometer alongthe main crystallographic axis (dots) at a temperature of 5K. The magne-tization for H ‖ a (left) was separated from the two other axes for the sakeof clarity. The derivation of the theoretical curves (lines) is explained in thetext.Inset: Visualization of the magnetic moments on the three equivalent Ho-sites in the unit cell, as assumed for developing the model.
40

5.1 Simple Phenomenological Model of the Magnetoelectric Effect
of the magnetization along the main crystallographic axes are shown in Fig. 5.2. Asdiscussed below, due to the C2-symmetry at the Ho-sites, only two options are consid-ered for the direction of the magnetic moments: either parallel or perpendicular to thelocal Zi-axes. Since a non-zero magnetization was obtained along the crystallographicc-direction, the moments are assumed to lie within the XiYi-plane, with an angle γ ≈ 30
with the crystallographic c-axis fitting the magnetization data the best. γ is the only freemagnetic anisotropy parameter in our model that reproduces well the field dependenceof the magnetization along the b∗- and c-axes (see Fig. 5.2), but underestimates themagnetization for H‖a, which is indicative of deviations of the magnetic moments fromthe XiYi-plane (see discussion below). However, a different approach for the magneticanisotropy will be presented in Chapter 5.2.
5.1.3 Magnetoelectric EffectFig. 5.3 shows the angular dependence of the electric polarization along the c-axis, Pc,for the magnetic field vector, H, rotated in the ac- and ab-planes. The complex angulardependence is indicative of a high-order MEE resulting from the C3 symmetry of lang-asite. Although the expansion of the magnetically-induced electric dipole of the Ho-ionin powers of H begins with terms ∝ H2, the bilinear MEE is cancelled in the sum overthe dipole moments of the Ho-dopants in the three La sublattices.
The lowest-order phenomenological expression for Pc allowed by C3 and C2 symmetriesis
P (4)z = a4(T )HxHz(H
2x − 3H2
y ), (5.2)
where we use the Cartesian coordinates with x = a, y = b∗, z = c and a4(T ) is amaterial constant. Fourth-order MEE in crystals with trigonal crystal symmetry havebeen discussed earlier [55; 77; 78]. Eq. (5.2) implies that Pz ∝ sin2 θ sin 2θ cos 3ϕ, whereθ and ϕ are, respectively, the polar and azimuthal angles describing the magnetic fielddirection. This angular dependence is in good agreement with the results of experimentalmeasurements at high temperatures shown in Fig. 5.3a, whereas at low temperatures theexperimental θ-dependence becomes more complex, indicating substantial higher-ordercontributions to the MEE.The fourth-order MEE described by Eq. (5.2) gives zero electric polarization for a
magnetic field in the basal ab-plane. However, the experimentally measured electricpolarization shown in Fig. 5.3b is of the same order as that for out-of-plane fields. Theelectric polarization shows a periodic dependence on the azimuthal angle, ϕ, with theperiod of 60 apparently resulting from a sixth-order MEE. The lowest-order expressionfor the electric polarization induced by an in-plane magnetic field is, indeed, of sixthorder in H:
P (6)z = a6(T )HxHy(H
2x − 3H2
y )(3H2x −H2
y ) ∝ sin 6ϕ. (5.3)
The sixth-order magnetoelectric response has not been discussed so far in the litera-ture. The right-hand side of Eq. (5.3), found using symmetry arguments [55; 77; 78], is
41

5 Magnetic Properties and the Magnetoelectric Effect in Ho-Langasite
Figure 5.3: Angular dependence of the static electric polarization along the c-axis. a.Dependence of Pc on the polar angle θ between the applied magnetic field,H, and the c-axis, for H rotated in the ac-plane at several temperatures. b.Dependence of Pc on the azimuthal angle ϕ for H rotated in the ab-plane.The modulation with the 60 period is indicative of a high-order MEE (seeEq. (5.3)). Experimental data are shown with symbols, and solid lines arecalculated within the model described in Chapter 5.1.
42
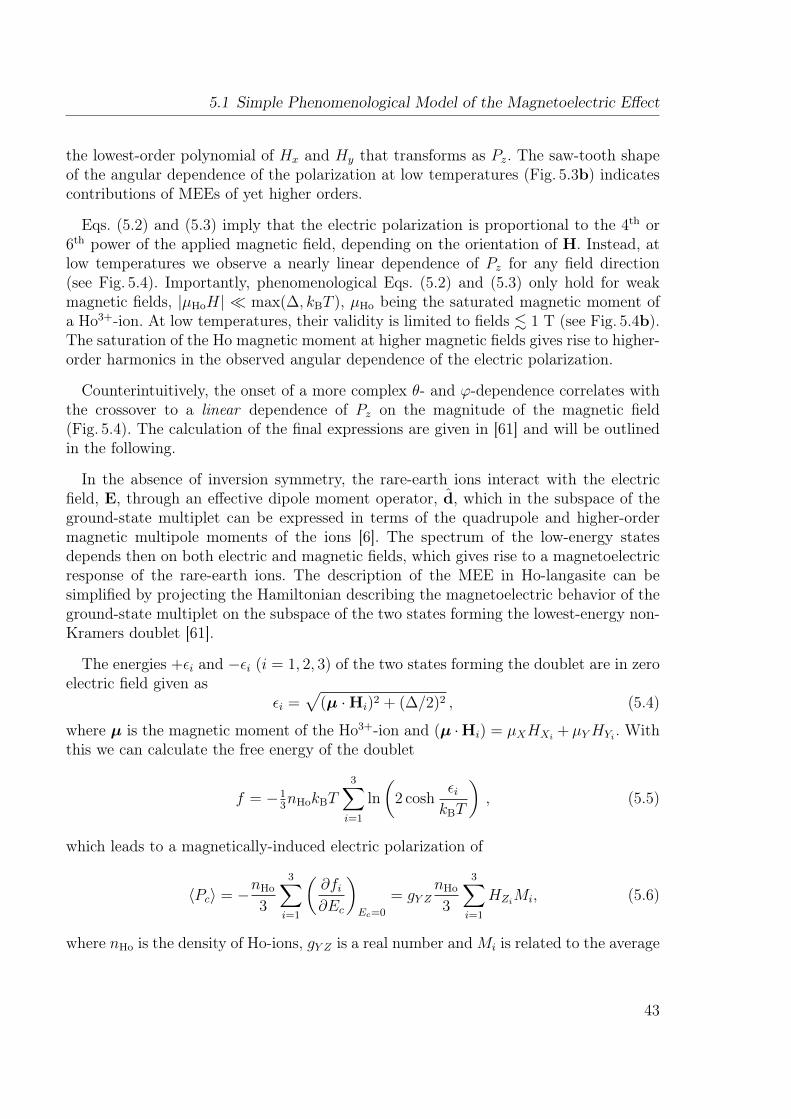
5.1 Simple Phenomenological Model of the Magnetoelectric Effect
the lowest-order polynomial of Hx and Hy that transforms as Pz. The saw-tooth shapeof the angular dependence of the polarization at low temperatures (Fig. 5.3b) indicatescontributions of MEEs of yet higher orders.
Eqs. (5.2) and (5.3) imply that the electric polarization is proportional to the 4th or6th power of the applied magnetic field, depending on the orientation of H. Instead, atlow temperatures we observe a nearly linear dependence of Pz for any field direction(see Fig. 5.4). Importantly, phenomenological Eqs. (5.2) and (5.3) only hold for weakmagnetic fields, |µHoH| max(∆, kBT ), µHo being the saturated magnetic moment ofa Ho3+-ion. At low temperatures, their validity is limited to fields . 1 T (see Fig. 5.4b).The saturation of the Ho magnetic moment at higher magnetic fields gives rise to higher-order harmonics in the observed angular dependence of the electric polarization.
Counterintuitively, the onset of a more complex θ- and ϕ-dependence correlates withthe crossover to a linear dependence of Pz on the magnitude of the magnetic field(Fig. 5.4). The calculation of the final expressions are given in [61] and will be outlinedin the following.
In the absence of inversion symmetry, the rare-earth ions interact with the electricfield, E, through an effective dipole moment operator, d, which in the subspace of theground-state multiplet can be expressed in terms of the quadrupole and higher-ordermagnetic multipole moments of the ions [6]. The spectrum of the low-energy statesdepends then on both electric and magnetic fields, which gives rise to a magnetoelectricresponse of the rare-earth ions. The description of the MEE in Ho-langasite can besimplified by projecting the Hamiltonian describing the magnetoelectric behavior of theground-state multiplet on the subspace of the two states forming the lowest-energy non-Kramers doublet [61].
The energies +εi and −εi (i = 1, 2, 3) of the two states forming the doublet are in zeroelectric field given as
εi =√
(µ ·Hi)2 + (∆/2)2 , (5.4)
where µ is the magnetic moment of the Ho3+-ion and (µ ·Hi) = µXHXi+ µYHYi . With
this we can calculate the free energy of the doublet
f = −13nHokBT
3∑i=1
ln
(2 cosh
εikBT
), (5.5)
which leads to a magnetically-induced electric polarization of
〈Pc〉 = −nHo
3
3∑i=1
(∂fi∂Ec
)Ec=0
= gY ZnHo
3
3∑i=1
HZiMi, (5.6)
where nHo is the density of Ho-ions, gY Z is a real number andMi is related to the average
43

5 Magnetic Properties and the Magnetoelectric Effect in Ho-Langasite
Figure 5.4: Linear magnetoelectric effect in Ho-langasite. a. Electric polarization formagnetic fields in the ac-plane with θ = 45 (see also Fig.5.3a). Symbolsare experimental data, dashed lines are results of theoretical calculations, asdescribed in Chapter 5.1. The inset shows temperature dependence of thestrength of the 4th-order magnetoelectric response, a4 in Eq. (5.3), obtainedfrom the low-field slopes. Symbols are experimental data; the line is the T−3
fit. b. Magnetic field dependence of the electric polarization, Pc, for appliedmagnetic fields rotated in the ab-plane through 15 from the b∗-axis (seealso Fig. 5.3b). The inset shows temperature dependence of the strength ofthe 6th-order magnetoelectric response, a6 in Eq. (5.3), obtained from thelow-field slopes. Symbols are experimental data; the line is the T−5 fit.
44

5.1 Simple Phenomenological Model of the Magnetoelectric Effect
magnetic moment of the i-th Ho-ion by 〈µi〉 = (µX , µY , 0)Mi and equals to
Mi =tanh βεi
εi(µ ·Hi) , (5.7)
where β = 1/kBT .Summing Eq. (5.7) over the three Ho-sites gives an average magnetic moment at zero
applied electric field of
M =nHoµ
20
3
3∑i=1
µi(µi ·H)tanh (βεi)
εi. (5.8)
The largest discrepancy between theory and experiment is found in the angular depen-dence of the electric polarization shown in Fig. 5.3. The main reason for this deviationis the intrinsic disorder in the langasite crystal structure (Fig. 5.1). The four positionsin the local surrounding of rare-earth ions are randomly occupied by two Si and two Gaions [64; 69] resulting in 6 inequivalent Ho-ions in each sublattice and the concomitantlattice distortions affect the magnetic anisotropy and magnetoelectric interactions of theions. This will be considered in the extension of this model, as discussed in Chapter 5.2.Importantly, our simple model2 based on average symmetry of rare-earth ions capturesthe basic physics of the magnetoelectric response of Ho-langasite.
In the limit of strong fields and low temperatures, |µ · Hi| ∆, kBT , when themagnetic moment saturates, the electric polarization,
Pc = 13nHogY Z
3∑i=1
HZisign(µ ·Hi), (5.9)
shows a complex saw-tooth dependence on the direction of the magnetic field in theab-plane (due to the sign-functions) and, at the same time, a simple linear dependenceon the strength of the magnetic field, in agreement with our experimental observations.In the opposite limit of weak fields and high temperatures, kBT |µ0H|,∆,
Pc ≈nHogY Zµ
30H
4
4(kBT )3sin γ cos2 γ cos θ sin3 θ cos 3ϕ, (5.10)
where H is the magnitude of the magnetic field and γ = arccos(µY /µ0), which agreeswith Eq. (5.2) obtained by symmetry and gives a4(T ) ∝ T−3. At zero temperature,(kBT )3 in Eq. (5.10) is replaced by ∆3/12.For magnetic field applied in the ab-plane, the electric polarization at high tempera-
2In the following the model developed in Chapter 5.1 is referred to as the ’simple model’.
45

5 Magnetic Properties and the Magnetoelectric Effect in Ho-Langasite
tures,
Pc ≈nHogY Zµ
50H
6
240(kBT )5cos5 γ sin6 θ sin (6ϕ) , (5.11)
is proportional to H6 and oscillates six times as ϕ varies by 2π, in agreement withEq. (5.3) (a6 ∝ T−5). At zero temperature, (kBT )5 → ∆5/90.The coefficients a4 and a6 in Eqs. (5.2, 5.3) can be estimated from the low-field slopes
of experimental data shown in Fig. 5.4. As demonstrated in the insets to Fig. 5.4, theyindeed follow the expected a4 ∝ T−3 and a6 ∝ T−5 behavior.For a more detailed discussion of the microscopic model, see [61] and Refs. [79; 80; 81;
82]. The resulting magnetic field-dependence of the electric polarization (dashed lines inFigs. 5.3 and 5.4) is in reasonable agreement with experimental data.
5.2 Extended Model of Magnetic Structure in Ho-LGSEven though the main features of the observed magnetoelectric effect can be reproducedby the first model presented above, many discrepancies remain to be explained, callingfor an extension of the model. In particular the magnetization curve (Fig. 5.6) indicatesthat the magnetic structure of this compound is more complex than accounted for in thefirst model. To resolve the actual magnetic structure measurements of the magnetizationas a function of the magnetic field direction in a SQUID magnetometer were performedand combined with further measurements in a torque magnetometer. As presented inChapter 5.2.2 and 5.2.3, these measurements show clearly the need for extending thefirst approximation of the model (Chapter 5.1).
5.2.1 Breaking of Local C2 SymmetryAs a starting point for extending the simple model (Chapter 5.1), it is useful to revisitthe assumptions we made previously. The possible orientation of the Ising-type magneticmoment of the Ho-ion is limited by the C2-symmetry to be either in the perpendicularplane or parallel to the a-axis of the crystal. Considering that the crystal C2-symmetryrelies on averaging the random distribution of the Ga- and Si-ions, which occupy the2d-position (see Fig. 5.1), a local breaking of this symmetry becomes possible in cases ofan uneven distribution. For estimating the possible influence of the 2d-position on themagnetic moment of the Ho-ions the nearest and next-nearest 2d-sites should be takeninto account, since they have a similar distance to the rare-earth site (d1 = 3.42 and d2 =3.66 , respectively). These four positions can be occupied by 16 different combinations ofGa- and Si-ions, of which only four possibilities preserve the C2-symmetry, as visualizedin Fig. 5.5.Therefore it seems reasonable to consider additional easy axes which do not follow the
crystal’s C2-symmetry. Nevertheless it is important to note that those additional easyaxes may break the symmetry locally, but an averaging over the whole crystal should
46

5.2 Extended Model of Magnetic Structure in Ho-LGS
3.42 A 3.66 A
3.66 A
Ga
3.42 A
Ho
Ga
HoHo
HoHo
Ho Ho
Ho
Ho
Ho
Ho
Si/Ga Si/Ga
Si/GaSi/Ga
Ho Ho
HoHo
Ho Ho
Ga
GaGa
GaGa
Ga
Ga
Ga
Ga
Ga
Ga
GaGa
Ga
GaGa
Ga
GaGa
Ga
Ga
Ga
GaGa
GaGa
Ga
Ga
Ga
Ga
Ga
SiSi
SiSi
Si
Si
Si
SiSi
Si
Si
Si
Si
Si
Si
Si
Si
SiSi
Si
Si
Si
SiSi
Si
Si
Si
SiSi
Si
Si
Si
43 7 8
65
b*
c
b*
c
c
a
Ho
0 1 2
Ho Ho
1,2 3,4 5,6,7,8
Ho
Ho
Ho
Ho
0
Ho
b*
c
c
a
Ho
Chapter 5.1 Chapter 5.2
Ho
Figure 5.5: The 16 different distributions of Ga/Si-ions in the close vicinity of the mag-netic Ho-ion (top), which lead to 9 different possible directions of the mag-netic moment (bottom right) are shown schematically as a projection ontothe b∗c-plane (and ac-plane). Note that the relative length of the projecteddistance is exaggerated in the 16 distributions to clarify the symmetry. Theactual ratio is shown in the general scheme in the center. In the model pre-sented in the text, both distances were assumed to be of equal length. Themodel of Chapter 5.1 is shown in the bottom left.
47

5 Magnetic Properties and the Magnetoelectric Effect in Ho-Langasite
still restore the C2-symmetry. Therefore for each easy axis, which does not satisfy thesymmetry, a second easy axis has to be assumed in such a way that the twofold rotationaround the a-axis projects those two axes onto each other. In the following section themeasurements of the magnetic torque of Ho-LGS are presented and analyzed to identifywhich directions of the Ising-type magnetic moments are present in the investigatedsample.
5.2.2 MagnetizationThe magnetization of a single Ho-ion becomes in this extension of the model slightlymore complex as compared to Eq. (5.7), since a summation over the different easy axesei is needed, resulting in
µHo(H) =∑ei
wi · µi (µi ·H)tanh ∆
kBT
∆, (5.12)
where the moments of the different easy axes are weighted with∑
iwi = 1 and µi =mtotei, with the length of the magnetic moment mtot. So far only the magnetizationemerging from the lowest-energy doublet,M2lvl was considered. The higher energy levelscan be included in this expression via the temperature-independent van-Vleck param-agnetism [83]. This additional values to the magnetization can be extracted from thehigh-field region of the magnetization curve. Here the change of M2lvl becomes neg-ligible and the van-Vleck slopes dominate the change of magnetization. Therefore weextended the set of measurements with new measurements performed with a vibratingsample magnetometer in a PPMS, which provides magnetic field strengths of up to 14T(Fig. 5.6). The investigated sample has a nearly cubical shape and originates from thesame batch as the other cuts of HoxLa3−xGa5SiO14, which were measured in this work.The slope of the linear fits of the magnetization above 13T were used to get the threedifferent van-Vleck parameters Va ≈ 55.9µB/Ho
kT , Vb* ≈ 60.2µB/HokT and Vc ≈ 29.2µB/Ho
kT ,which can be used to calculate the van-Vleck magnetization
MvV =
Va 0 00 Vb 00 0 Vc
·H . (5.13)
The magnetization of the two level system and the van-Vleck magnetization sum up tothe total magnetization
Mtot = M2Lvl + MvV . (5.14)
Due to the presence of the threefold rotation axis, which is along the crystal’s c-axis, thevan-Vleck parameter should be constant in the ab-plane. Nevertheless the parametersVa and Vb* were not observed to be exactly the same, which might be due to a smallmisalignment of the sample in the measurement. Even though a significant improvement
48

5.2 Extended Model of Magnetic Structure in Ho-LGS
Figure 5.6: The field scans of the magnetization along the main crystallographic axes,measured at 2.3K (blue) and 12.3K (green). The theoretical curve (dashed)is calculated according to the extended model, as outlined in the text.
49
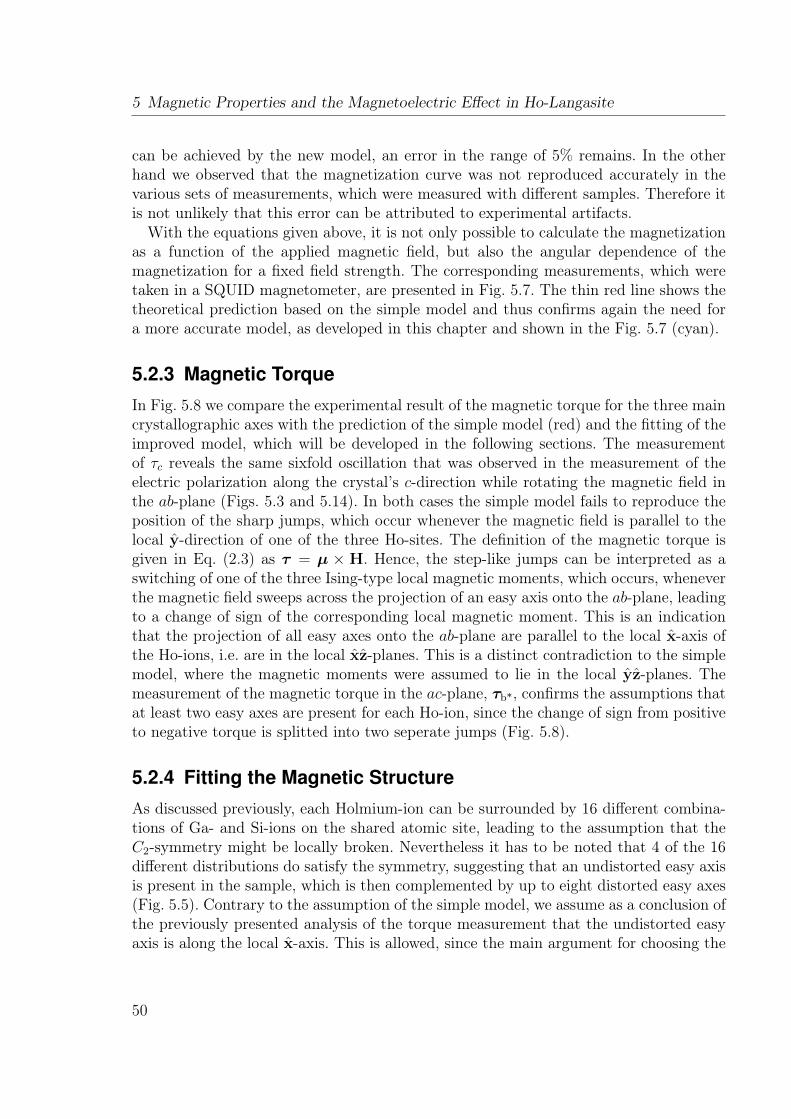
5 Magnetic Properties and the Magnetoelectric Effect in Ho-Langasite
can be achieved by the new model, an error in the range of 5% remains. In the otherhand we observed that the magnetization curve was not reproduced accurately in thevarious sets of measurements, which were measured with different samples. Therefore itis not unlikely that this error can be attributed to experimental artifacts.With the equations given above, it is not only possible to calculate the magnetization
as a function of the applied magnetic field, but also the angular dependence of themagnetization for a fixed field strength. The corresponding measurements, which weretaken in a SQUID magnetometer, are presented in Fig. 5.7. The thin red line shows thetheoretical prediction based on the simple model and thus confirms again the need fora more accurate model, as developed in this chapter and shown in the Fig. 5.7 (cyan).
5.2.3 Magnetic TorqueIn Fig. 5.8 we compare the experimental result of the magnetic torque for the three maincrystallographic axes with the prediction of the simple model (red) and the fitting of theimproved model, which will be developed in the following sections. The measurementof τc reveals the same sixfold oscillation that was observed in the measurement of theelectric polarization along the crystal’s c-direction while rotating the magnetic field inthe ab-plane (Figs. 5.3 and 5.14). In both cases the simple model fails to reproduce theposition of the sharp jumps, which occur whenever the magnetic field is parallel to thelocal y-direction of one of the three Ho-sites. The definition of the magnetic torque isgiven in Eq. (2.3) as τ = µ × H. Hence, the step-like jumps can be interpreted as aswitching of one of the three Ising-type local magnetic moments, which occurs, wheneverthe magnetic field sweeps across the projection of an easy axis onto the ab-plane, leadingto a change of sign of the corresponding local magnetic moment. This is an indicationthat the projection of all easy axes onto the ab-plane are parallel to the local x-axis ofthe Ho-ions, i.e. are in the local xz-planes. This is a distinct contradiction to the simplemodel, where the magnetic moments were assumed to lie in the local yz-planes. Themeasurement of the magnetic torque in the ac-plane, τb*, confirms the assumptions thatat least two easy axes are present for each Ho-ion, since the change of sign from positiveto negative torque is splitted into two seperate jumps (Fig. 5.8).
5.2.4 Fitting the Magnetic StructureAs discussed previously, each Holmium-ion can be surrounded by 16 different combina-tions of Ga- and Si-ions on the shared atomic site, leading to the assumption that theC2-symmetry might be locally broken. Nevertheless it has to be noted that 4 of the 16different distributions do satisfy the symmetry, suggesting that an undistorted easy axisis present in the sample, which is then complemented by up to eight distorted easy axes(Fig. 5.5). Contrary to the assumption of the simple model, we assume as a conclusion ofthe previously presented analysis of the torque measurement that the undistorted easyaxis is along the local x-axis. This is allowed, since the main argument for choosing the
50
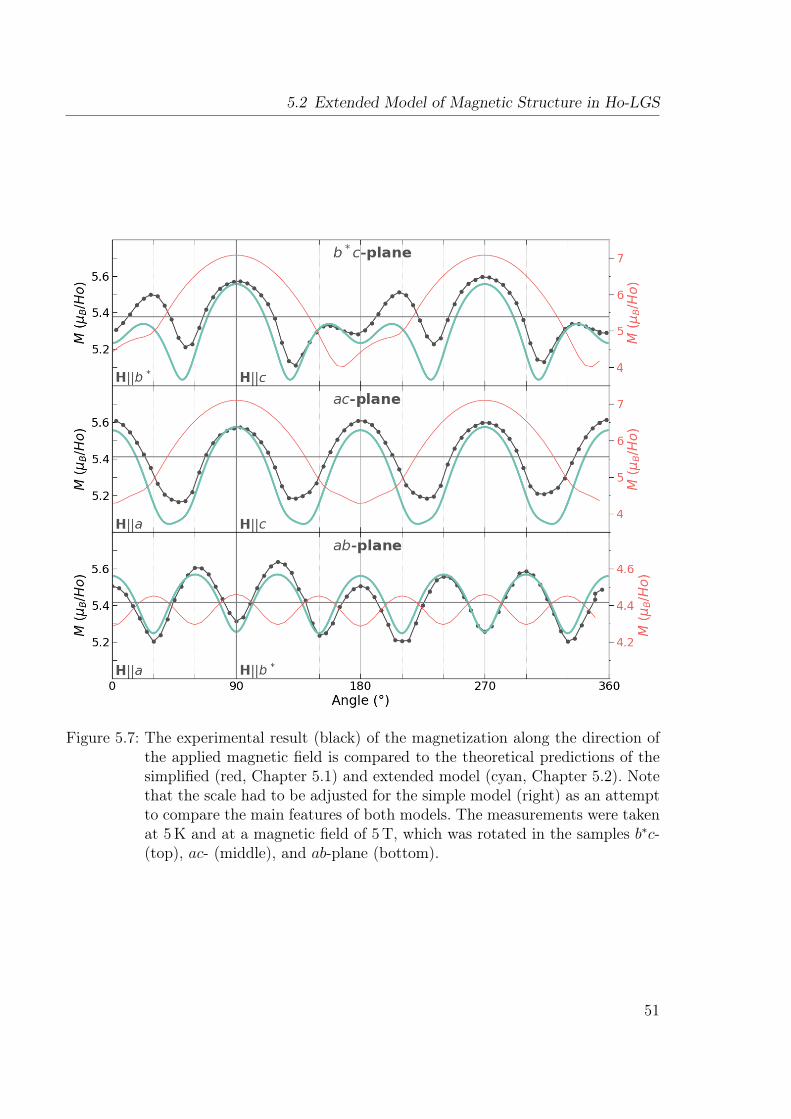
5.2 Extended Model of Magnetic Structure in Ho-LGS
Figure 5.7: The experimental result (black) of the magnetization along the direction ofthe applied magnetic field is compared to the theoretical predictions of thesimplified (red, Chapter 5.1) and extended model (cyan, Chapter 5.2). Notethat the scale had to be adjusted for the simple model (right) as an attemptto compare the main features of both models. The measurements were takenat 5K and at a magnetic field of 5T, which was rotated in the samples b∗c-(top), ac- (middle), and ab-plane (bottom).
51

5 Magnetic Properties and the Magnetoelectric Effect in Ho-Langasite
Figure 5.8: The experimental result (black) of the magnetic torque is compared to thetheoretical predictions of the simplified (red, section) and extended model(cyan, section). Note that the scale had to be adjusted for the simple model(right) as an attempt to compare the main features of both models. Themeasurements were taken at 2.3K and at a magnetic field of 6T, which wasrotated in the samples b∗c- (top), ac- (middle), and ab-plane (bottom).
52

5.2 Extended Model of Magnetic Structure in Ho-LGS
easy axis to be in the yz-planes, i.e. the non-zero magnetization in c-direction, is notvalid anymore, due to the assumption of additional distorted easy axes3.Having this in mind, we can identify the nine possible easy axes ei as visualized in
Fig. 5.5 and describe them by only four angles θ1, φ2, θ3 and φ3 as given in Table 5.1.Here we neglected the small difference in distance between the Ho-ion and the nearestand next-nearest Ga/Si-sites, respectively, and assume a mirror symmetry around thec-axis, which translates e5 into e7 and e6 into e8. Hence, we are able to describe thosefour easy axes by only two angles θ3 and φ3.In this table we assigned to each easy axis a weight wi, representing the relative
abundance of the i-th easy axis, by assuming a random distribution of the Ga- andSi-ions. Nevertheless we used the weights as additional free parameters in the fittingprocedure, to account for possible deviations of the random Ga/Si-distribution in thevicinity of a Ho-ion. However, the weights need to satisfy the conditions w1 = w2,w3 = w4 and w5 = w6 = w7 = w8 due to symmetry arguments, while also
∑iwi = 1
has to be fulfilled. Therefore only three additional parameters are needed to cover allpossible relative abundances of the ei.
i = 0 1, 2 3, 4 5, 6, 7, 8
ei
100
cos(θ1)0
± sin(θ1)
cos(φ2)± sin(φ2)
0
cos(φ3) sin(θ3)± sin(φ3) sin(θ3)± cos(θ3)
wi 1/4 1/16 1/16 1/8
Table 5.1: The directions and weights of the easy axes ei that can be assumed for arandom distribution of Ga- and Si-ions, as visualized in Fig. 5.5.
First results of this new model revealed the need for an additional scaling parameter,λ, to scale the magnetic torque and the change of MH , i.e. the magnetization projectedonto the direction of the applied magnetic field, via
τ(ei, wi, λ) |H = λ (Mtot(ei, wi) |H ×H) and (5.15)MH,j(ei, wi, λ) = MH,j + λ
(MH(ei, wi)−MH,j
), (5.16)
respectively. Here MH,j is the experimentally determined average magnetization alongthe magnetic field direction for each of the three sets of measurements (gray horizontalline in Fig. 5.7) and j = a, b*, c denotes the rotation of the magnetic field through thesamples b∗c-, ac- and ab-plane, respectively. Without the parameter λ no quantitativeagreement between experimental and theoretical curves can be achieved for Figs. 5.7 and5.8. Instead the model overestimates the magnetic anisotropy without this parameter.
3The fitting procedure was repeated with an easy axis in the yz-planes as a starting point. However,the experiments could not be described very well. Therefore only the model with an easy axis alongthe local x-axis as a starting point is presented in this chapter.
53

5 Magnetic Properties and the Magnetoelectric Effect in Ho-Langasite
In total this leads us to a set of eight parameters (4 angles, 3 weights, 1 scaling factor)to fit six sets of measurements (Figs. 5.7 and 5.8) simultaneously. The straight-forwardfitting procedure would consist of calculating the residual for every possible combinationof values for the eight parameters, down to a predefined threshold. Unsuprisingly, thisbrute-force search would take to much computational cost to be feasible and was there-fore replaced by a more delicate approach. First of all it is essential to define how theresiduals are calculated for a given set of parameters p, since the weighting can influencethe outcome. For each of the six sets of measurements, the residual is calculated in thesame way (here given for τx):
ρτ,x =nτ,x∑i τexp,xi
(∑xi
(τexp,xi − τxi(p))2
nτ,x
)1/2
, (5.17)
where the sum over the xi denotes the summation over all points of the given measure-ment and the subscript ’exp’ is used to distinguish the experimental values from thetheoretically calculated. The summation of all n = 6 residuals gives the total residual
ρ =
∑j ρj
n, (5.18)
which will be minimized by a variation of the Hooke’s algorithm (Fig. 5.9), as explainedin the following paragraph.
In this approach a certain number of points are randomly generated in the eightdimensional parameter space, which is constrained by the predefined limits. The anglescan be set due to symmetry reasons to < 90 and the weights are wi < 1. In eachiteration of the following algorithm every point moves in the parameter space in theway, which is visualized in the schematic Fig. 5.9. In the first phase of every iterationthe optimal direction is determined, by varying every coordinate, i.e. parameter, oneafter another by a predefined step-size, first in the positive and, if this does not reducethe residual, in the negative direction. If the residual is decreased by the step, the newcoordinate is saved, before this procedure is repeated for the next coordinate. After alleight coordinates are varied, the algorithm moves either on to phase 2a or, if no furtherreduction was reached, reduces the step size (phase 2b). The phase 2a was implementedto reduce the computational cost considerably. Instead of finding a new optimal direction(phase 1), the point moves in the previously determined direction as long as no furtherreduction of the residual can be achieved. Only when this is the case a new iteration isstarted with phase 1. This procedure is repeated until a predefined cut-off step-size isreached in phase 2b.
This explanation is still simplified and it is important to pay attention to some possibledisadvantages of this approach. First of all the term ’best direction’ is not accurate, sinceone parameter is varied after another and saved as soon as the value of the residual isreduced. Hence, not all directions are actually tested. A quite common disadvantage of
54

5.2 Extended Model of Magnetic Structure in Ho-LGS
YesNo
Yes NoNo
Yes
1
2a2b
Varying Parameterby +/- Step-Size
Move alongOptimal Direction
ReduceStep-Size
At least one Parameter
was updatedReducedResidual?
Parameteris updated
Parameterremains
ReducedResidual?
All Parameterare updated
All Parameterremain
Step-Size reducedbelow limit?
Initialize Parameters
No Parameterwas updated
Figure 5.9: A schematic of the fitting algorithm is shown. The three different phases 1,2a and 2b are explained in the text in more detail.
55
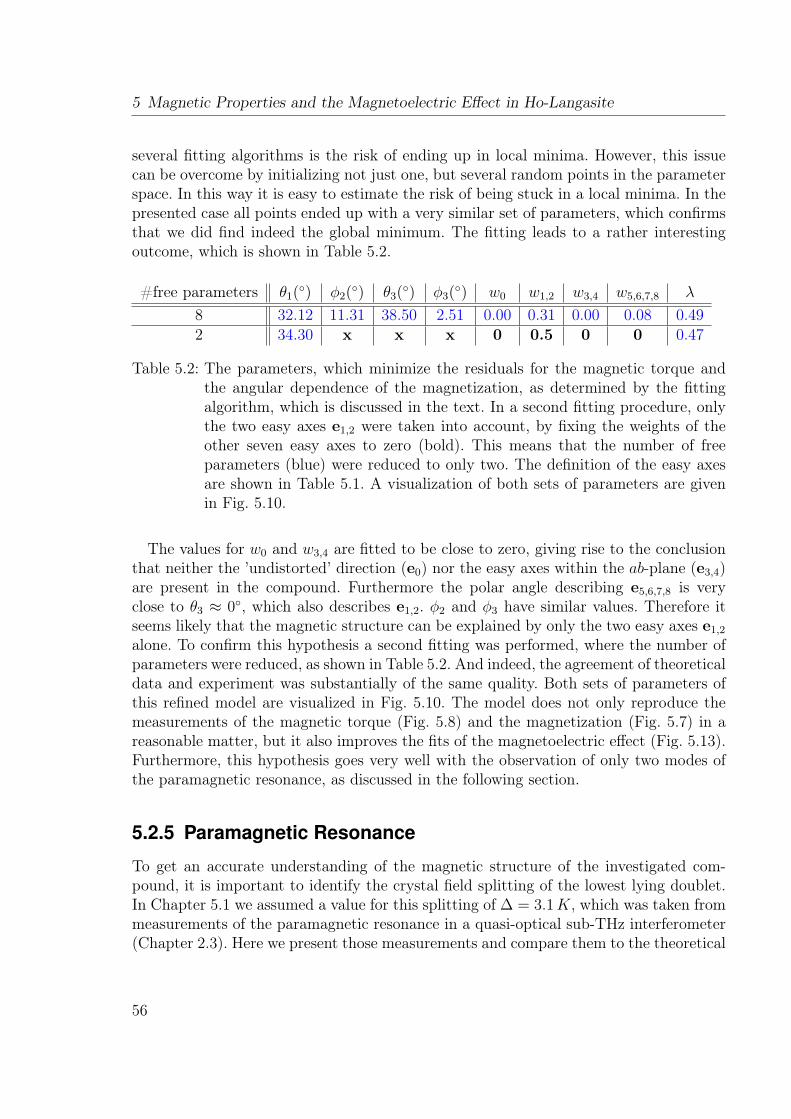
5 Magnetic Properties and the Magnetoelectric Effect in Ho-Langasite
several fitting algorithms is the risk of ending up in local minima. However, this issuecan be overcome by initializing not just one, but several random points in the parameterspace. In this way it is easy to estimate the risk of being stuck in a local minima. In thepresented case all points ended up with a very similar set of parameters, which confirmsthat we did find indeed the global minimum. The fitting leads to a rather interestingoutcome, which is shown in Table 5.2.
#free parameters θ1() φ2() θ3() φ3() w0 w1,2 w3,4 w5,6,7,8 λ
8 32.12 11.31 38.50 2.51 0.00 0.31 0.00 0.08 0.492 34.30 x x x 0 0.5 0 0 0.47
Table 5.2: The parameters, which minimize the residuals for the magnetic torque andthe angular dependence of the magnetization, as determined by the fittingalgorithm, which is discussed in the text. In a second fitting procedure, onlythe two easy axes e1,2 were taken into account, by fixing the weights of theother seven easy axes to zero (bold). This means that the number of freeparameters (blue) were reduced to only two. The definition of the easy axesare shown in Table 5.1. A visualization of both sets of parameters are givenin Fig. 5.10.
The values for w0 and w3,4 are fitted to be close to zero, giving rise to the conclusionthat neither the ’undistorted’ direction (e0) nor the easy axes within the ab-plane (e3,4)are present in the compound. Furthermore the polar angle describing e5,6,7,8 is veryclose to θ3 ≈ 0, which also describes e1,2. φ2 and φ3 have similar values. Therefore itseems likely that the magnetic structure can be explained by only the two easy axes e1,2
alone. To confirm this hypothesis a second fitting was performed, where the number ofparameters were reduced, as shown in Table 5.2. And indeed, the agreement of theoreticaldata and experiment was substantially of the same quality. Both sets of parameters ofthis refined model are visualized in Fig. 5.10. The model does not only reproduce themeasurements of the magnetic torque (Fig. 5.8) and the magnetization (Fig. 5.7) in areasonable matter, but it also improves the fits of the magnetoelectric effect (Fig. 5.13).Furthermore, this hypothesis goes very well with the observation of only two modes ofthe paramagnetic resonance, as discussed in the following section.
5.2.5 Paramagnetic Resonance
To get an accurate understanding of the magnetic structure of the investigated com-pound, it is important to identify the crystal field splitting of the lowest lying doublet.In Chapter 5.1 we assumed a value for this splitting of ∆ = 3.1K, which was taken frommeasurements of the paramagnetic resonance in a quasi-optical sub-THz interferometer(Chapter 2.3). Here we present those measurements and compare them to the theoretical
56

5.2 Extended Model of Magnetic Structure in Ho-LGS
𝝓 𝝓2
3
Ho
b*
c
c
a
𝝓2
b*
c
c
a
Ho
Ho
Ho
28
Figure 5.10: Visualization of the easy axes as given in Table 5.2 for eight (left) and two(right) parameters. Only the axes with non-zero weights are drawn. Thedashed lines on the right panel indicate the position of the easy axes witheight parameters (left panel). The projections of the easy axes onto the ac-and b∗c-plane were chosen in accordance to Fig. 5.5.
Figure 5.11: Examples of a paramagnetic resonance, as measured in the Mach-Zehnderinterferometer at different frequencies in Faraday geometry. The shift of theresonance frequency can be identified in intensity and phase.
57

5 Magnetic Properties and the Magnetoelectric Effect in Ho-Langasite
Figure 5.12: The different modes of the paramagnetic resonance are plotted for the ex-ternal field along the main crystallographic axes (a - left, b∗ - middle, c -right). All possible polarizations were measured for the a-cut sample (cir-cles) and complemented by two sets of measurements on the c-cut sample(squares) for H ‖ a, to cover most of the possible excitation conditions(green - h ‖ a, red - h ‖ b∗, blue - h ‖ c). The model from Chapter 5.1(dashed orange) is assumed a splitting of ∆ = 65GHz. The extension ofthe model, as developed in Chapter 5.2 (solid violet) assumed ∆ = 90GHz,as explained in more detail in the text.
prediction of the new model. Furthermore the value of ∆ will be adjusted by a moreaccurate analysis of the data.As shown in Fig. 5.11 the paramagnetic resonance appears in field scans at fixed
frequencies as a distorted Lorentzian in the relative transmission and phase shift. Byfitting both curves simultaneously, the resonance field can be extracted, even thoughthe change in signal is rather small and somewhat distorted, possibly due to the smallamount of Ho-ions in the compound. The resonance fields extracted are shifted to slightlylarger field strengths compared to the values, which were simply read out of the raw dataand used for the simple model (Chapter 5.1). In general the gyromagnetic ratio g can bedifferent for different directions of applied field and different polarizations of the magneticac-field of the incoming light beam. Therefore we tested all possible combinations withinthe a-cut sample and complemented it with two measurements of the c-cut sample (h ‖ aand h ‖ b∗ for an applied field H ‖ a). Plotting the resonance fields as a function of thefrequency of the incoming light reveals the expected linear behaviour at larger fields, witha slope corresponding to the g-factor (Fig. 5.12). At low fields the resonance frequenciesconverge to the value of the splitting of the non-Kramers doublet, where the frequency of
58
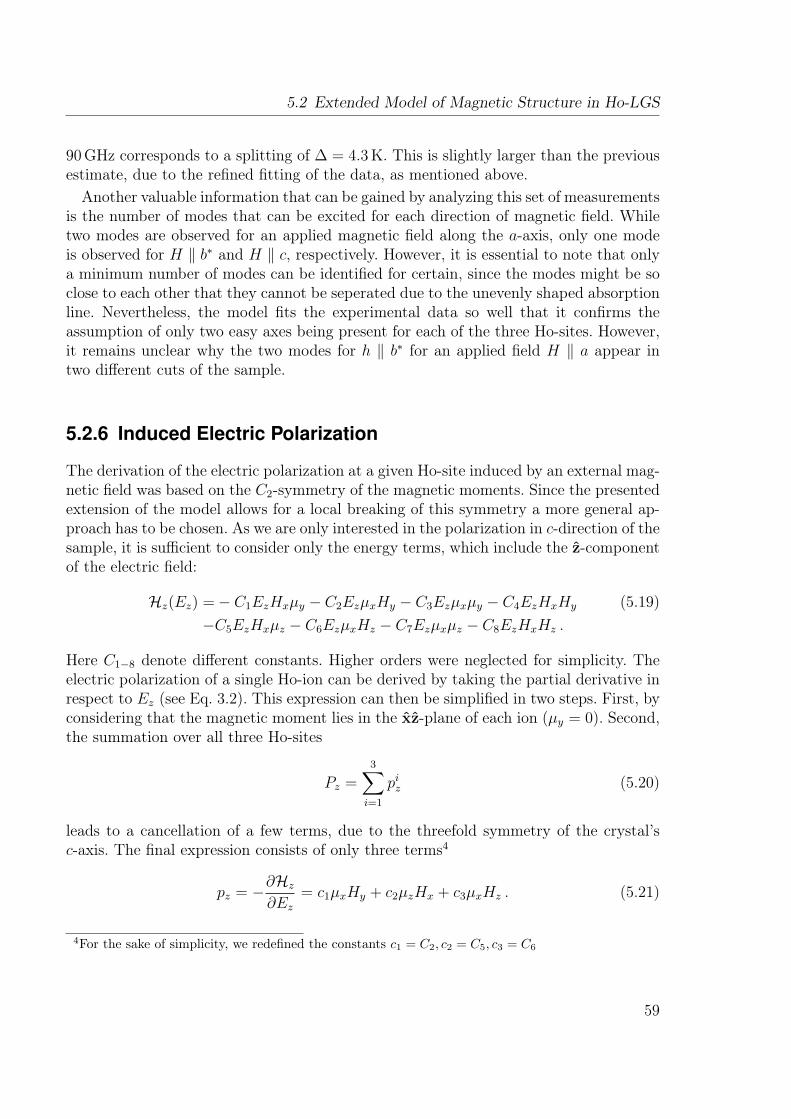
5.2 Extended Model of Magnetic Structure in Ho-LGS
90GHz corresponds to a splitting of ∆ = 4.3K. This is slightly larger than the previousestimate, due to the refined fitting of the data, as mentioned above.
Another valuable information that can be gained by analyzing this set of measurementsis the number of modes that can be excited for each direction of magnetic field. Whiletwo modes are observed for an applied magnetic field along the a-axis, only one modeis observed for H ‖ b∗ and H ‖ c, respectively. However, it is essential to note that onlya minimum number of modes can be identified for certain, since the modes might be soclose to each other that they cannot be seperated due to the unevenly shaped absorptionline. Nevertheless, the model fits the experimental data so well that it confirms theassumption of only two easy axes being present for each of the three Ho-sites. However,it remains unclear why the two modes for h ‖ b∗ for an applied field H ‖ a appear intwo different cuts of the sample.
5.2.6 Induced Electric Polarization
The derivation of the electric polarization at a given Ho-site induced by an external mag-netic field was based on the C2-symmetry of the magnetic moments. Since the presentedextension of the model allows for a local breaking of this symmetry a more general ap-proach has to be chosen. As we are only interested in the polarization in c-direction of thesample, it is sufficient to consider only the energy terms, which include the z-componentof the electric field:
Hz(Ez) =− C1EzHxµy − C2EzµxHy − C3Ezµxµy − C4EzHxHy (5.19)−C5EzHxµz − C6EzµxHz − C7Ezµxµz − C8EzHxHz .
Here C1−8 denote different constants. Higher orders were neglected for simplicity. Theelectric polarization of a single Ho-ion can be derived by taking the partial derivative inrespect to Ez (see Eq. 3.2). This expression can then be simplified in two steps. First, byconsidering that the magnetic moment lies in the xz-plane of each ion (µy = 0). Second,the summation over all three Ho-sites
Pz =3∑i=1
piz (5.20)
leads to a cancellation of a few terms, due to the threefold symmetry of the crystal’sc-axis. The final expression consists of only three terms4
pz = −∂Hz
∂Ez= c1µxHy + c2µzHx + c3µxHz . (5.21)
4For the sake of simplicity, we redefined the constants c1 = C2, c2 = C5, c3 = C6
59

5 Magnetic Properties and the Magnetoelectric Effect in Ho-Langasite
Figure 5.13: The magnetoelectric effect can be directly observed by measuring the elec-tric polarization for an applied magnetic field. Here the polarization alongthe samples c-axis is measured, while the magnetic field is applied in theac-plane (left) and the ab-plane (right) under an angle of 45 with respectto the a-axis in both cases. The theoretical curve of the model presented inChapter 5.1 is shown for 2.3K (dashed). No magnetoelectric effect can beobserved for magnetic fields along the main crystallographic axes.
Therefore only three parameters5 (c1, c2, c3) had to be fitted, using a similar fittingalgorithm, as presented above, resulting in the values, which are given in Table 5.3.
c1 c2 c3
0.151 0.288 0.089
Table 5.3: Constants determined from the fitting of the polarization, as given by Eq.(5.21).
The main disadvantage of the simple model was the poor agreement of the shapeof the electric polarization, when plotted as a function of the magnetic field direction(Figs. 5.3 and 5.14). While the sweeping of the field in the ac-plane results in a peak,which is shifted compared to the simple model, the measurement in the ab-plane led to adifferent position of the sharp jumps in polarization, analogous to the measurement of themagnetic torque in that plane. As shown in Fig. 5.14, both inconsistencies were overcomeby the extended model. The remaining difference of the new model and the experiment
5The magnetic structure assumed in Chapter 5.1 did lead only to two terms in this expression:C1µyHx + C5µzHx.
60

5.2 Extended Model of Magnetic Structure in Ho-LGS
Figure 5.14: The electric polarization induced by an applied magnetic field as the func-tion of the field direction. The measurement points were extracted fromthe 14T field scans (see Fig. 5.13), where the field was rotated across thecrystal’s ac-plane (left) and ab-plane (right). The theoretical curve of themodel presented in Chapter 5.1 is shown for 2.3K (dashed). In agreementwith symmetry considerations, no magnetoelectric effect could be observedfor fields in the b∗c-plane.
61
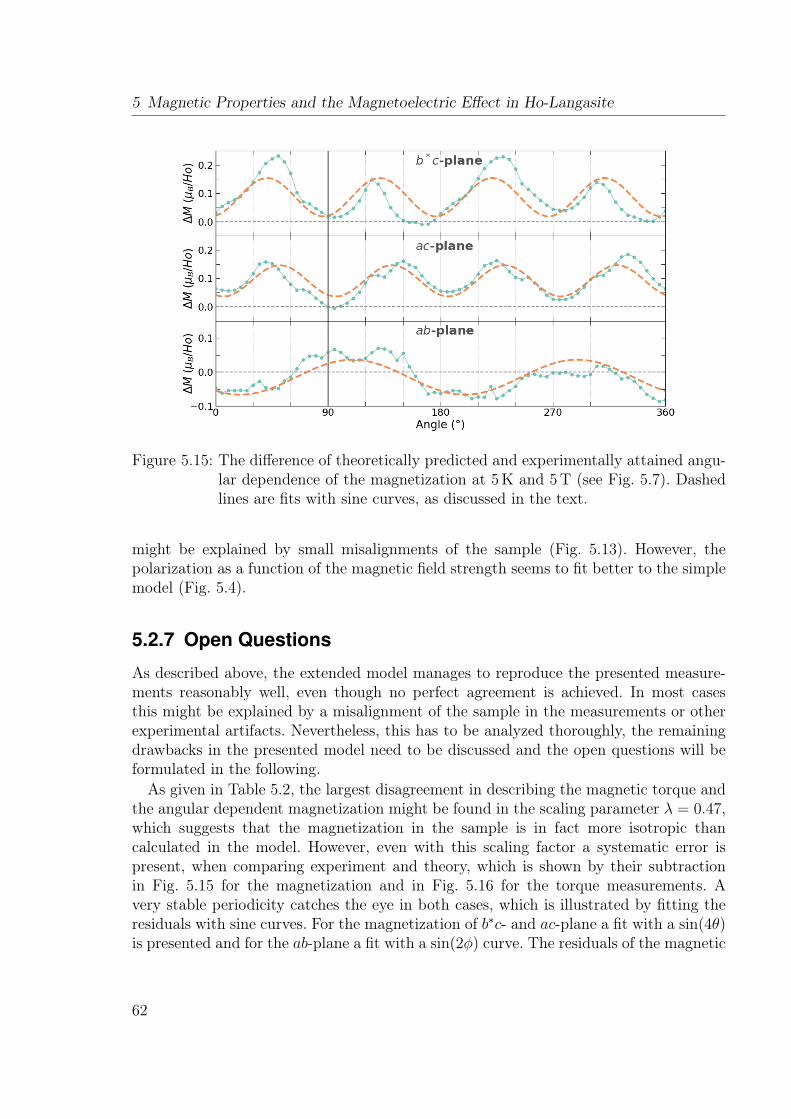
5 Magnetic Properties and the Magnetoelectric Effect in Ho-Langasite
Figure 5.15: The difference of theoretically predicted and experimentally attained angu-lar dependence of the magnetization at 5K and 5T (see Fig. 5.7). Dashedlines are fits with sine curves, as discussed in the text.
might be explained by small misalignments of the sample (Fig. 5.13). However, thepolarization as a function of the magnetic field strength seems to fit better to the simplemodel (Fig. 5.4).
5.2.7 Open Questions
As described above, the extended model manages to reproduce the presented measure-ments reasonably well, even though no perfect agreement is achieved. In most casesthis might be explained by a misalignment of the sample in the measurements or otherexperimental artifacts. Nevertheless, this has to be analyzed thoroughly, the remainingdrawbacks in the presented model need to be discussed and the open questions will beformulated in the following.As given in Table 5.2, the largest disagreement in describing the magnetic torque and
the angular dependent magnetization might be found in the scaling parameter λ = 0.47,which suggests that the magnetization in the sample is in fact more isotropic thancalculated in the model. However, even with this scaling factor a systematic error ispresent, when comparing experiment and theory, which is shown by their subtractionin Fig. 5.15 for the magnetization and in Fig. 5.16 for the torque measurements. Avery stable periodicity catches the eye in both cases, which is illustrated by fitting theresiduals with sine curves. For the magnetization of b∗c- and ac-plane a fit with a sin(4θ)is presented and for the ab-plane a fit with a sin(2φ) curve. The residuals of the magnetic
62

5.2 Extended Model of Magnetic Structure in Ho-LGS
Figure 5.16: The difference of theoretically predicted and experimentally attained mag-netic torque (Fig. 5.8) in b∗c- (top) and ac-plane (bottom) at 2.3K, 12.3Kand 22.3K (left to right). Dashed lines are fits with sine curves.
torque reveals also a sin(2δ) for all sample planes. A connection between these residualsand the sample symmetry (cubic for magnetization, thin plate for torque) is so farmerely speculative, but calls for further investigation. This additional contribution tothe magnetization leads to a problematic asymmetry of the magnetization around thecrystal’s c-axis in the b∗c-plane, as seen in Fig. 5.7, which contradicts the symmetry ofthe model. However, we neglected in this approach the small difference of the distanced1 and d2 of the Si/Ga- to the Ho-sites. This approximation might be the reason for thisdiscrepancy.
In both previously described models, the induced magnetization and the magnetoelec-tric effect are driven by the lowest lying doublet, whilst other levels are only accountedfor in the van-Vleck paramagnetism, which assumes the next level is at an energies E1,which satisfy E1−E0 kBT , where E0 is the ground level [84]. Therefore no deviationsof the linear relation between magnetic field and induced electric polarization at largerfields are expected in these approaches. Nevertheless, we were able to explore the mag-netoelectric effect beyond the model, by measurements in pulsed magnetic fields of up to56T, which are presented in Fig. 5.17. The induced electric polarization along the c-axiswas measured for different directions of magnetic field in the ab- and ac-plane, respec-tively. The observed high-field anomalies are of a strikingly different nature for the twoplanes: while a decrease of electric polarization can be observed for certain directions of
63

5 Magnetic Properties and the Magnetoelectric Effect in Ho-Langasite
Figure 5.17: top The induced electric polarization by a pulsed magnetic field of up to56T for certain directions in the ab- (left) and ac-plane (right), respec-tively. The combination of field direction and temperature, which was usedfor each pulse, is shown in the legend in each plot. bottom The corre-sponding low field (14T) measurement points (see Fig. 5.6) are presentedto facilitate the identification of the high-field features. Note that a differentbase temperature was used to allow for stable measurements.
fields in the ab-plane, there is no such slow-down of the effect for fields in the ac-plane.Quite the contrary, the linear magnetoelectric effect, which is observed at low tempera-tures above a few Tesla, transforms into a second linear regime with an even larger slopeat field strengths between 20-40T. The temperature dependence reveals expectedly aslight weakening of the MEE at larger temperatures.These high-field features most likely correspond to the admixture of higher levels,
which is not accounted for in the presented model and, therefore, requires a furtherexpansion. The experimental identification of the crystal field levels by spectroscopicmethods would be strongly desired to complete the description of the system. Resolvingthe occupation of the Ga/-Si sites in the vicinity of the magnetic Ho-ions would be an ad-ditional major help in confirming the presented theory and answering the open question,along with further measurements, like repeating the investigations on HoxLa3−xGa5SiO14
with different Ho-content.
64
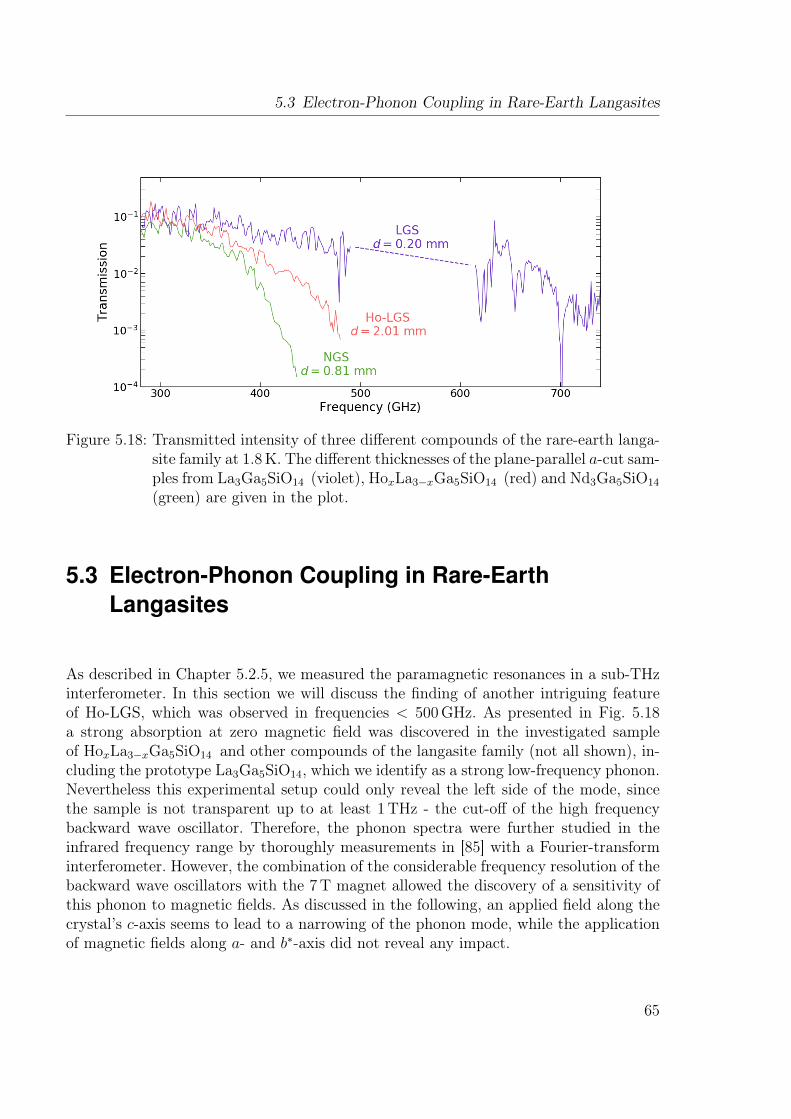
5.3 Electron-Phonon Coupling in Rare-Earth Langasites
Figure 5.18: Transmitted intensity of three different compounds of the rare-earth langa-site family at 1.8K. The different thicknesses of the plane-parallel a-cut sam-ples from La3Ga5SiO14 (violet), HoxLa3−xGa5SiO14 (red) and Nd3Ga5SiO14
(green) are given in the plot.
5.3 Electron-Phonon Coupling in Rare-EarthLangasites
As described in Chapter 5.2.5, we measured the paramagnetic resonances in a sub-THzinterferometer. In this section we will discuss the finding of another intriguing featureof Ho-LGS, which was observed in frequencies < 500GHz. As presented in Fig. 5.18a strong absorption at zero magnetic field was discovered in the investigated sampleof HoxLa3−xGa5SiO14 and other compounds of the langasite family (not all shown), in-cluding the prototype La3Ga5SiO14, which we identify as a strong low-frequency phonon.Nevertheless this experimental setup could only reveal the left side of the mode, sincethe sample is not transparent up to at least 1THz - the cut-off of the high frequencybackward wave oscillator. Therefore, the phonon spectra were further studied in theinfrared frequency range by thoroughly measurements in [85] with a Fourier-transforminterferometer. However, the combination of the considerable frequency resolution of thebackward wave oscillators with the 7T magnet allowed the discovery of a sensitivity ofthis phonon to magnetic fields. As discussed in the following, an applied field along thecrystal’s c-axis seems to lead to a narrowing of the phonon mode, while the applicationof magnetic fields along a- and b∗-axis did not reveal any impact.
65

5 Magnetic Properties and the Magnetoelectric Effect in Ho-Langasite
Figure 5.19: top The dielectric permittivity measured along the crystal’s c-axis as afunction of temperature, measured at a frequency of 1 kHz. bottom Trans-mission (left) and optical thickness l = nd, where n is the refractive indexand d the geometrical thickness of the sample (right) of a linearly polarized(h ‖ b∗, e ‖ c) monochromatic electromagnetic wave through a Ho-LGSsample (a-cut), measured at zero magnetic field and different temperatures(color).
66
5.4 Excitation in the Complex Transmission
Figure 5.20: The change of transmission (top) and change of optical thickness l (bottom)of an electromagnetic wave with a frequency of 345GHz, which is linearlypolarized with h ‖ b∗ and e ‖ c, under the variation of an external magneticfield H ‖ c.
5.4 Excitation in the Complex Transmission
The dielectric permittivity εc of compounds of the langasite family are known to haverelatively large values [64]. The doping of the prototype LaGaSiO with 1.5% Ho-ions doesnot effect the temperature dependence by much, as shown in the top panel of Fig. 5.19.Nevertheless, we are the first to measure a low frequency phonon, which can be partlyattributed for the large value of εc (Fig. 5.18).The sensitivity to magnetic field of the phonon was first observed in an attempt to
measure the paramagnetic resonance at 345GHz in a magnetic field scan (Fig. 5.20). Theabsorption at the resonance field of about 2T is dominated by a strong absorption inthe range of 0-4T. The measurement of the spectra at different magnetic field strengths(Fig. 5.21) confirms that this effect seems to be well pronounced at fields below 4T anddecreases for larger fields (see Fig. 5.20). Using its thickness, the transmission and phaseshift of an electromagnetic wave through the sample can be converted into the complexdielectric permittivity ε∗. The excitation of the phonon can be observed in the spectrumof ε∗ as a Lorentzian function
ε∗(ω) = ε(0) + ∆εω2 + iωγ
ω20 − ω2 − iωγ
. (5.22)
Therefore we can extract the static dielectric permittivity ε(0), the strength of the exci-
67

5 Magnetic Properties and the Magnetoelectric Effect in Ho-Langasite
Figure 5.21: Field dependence of the phonon at 1.8K. The frequency of Figure 5.20(345GHz) was indicated by a gray dashed line. top Transmission (left) andoptical thickness l (right) of a linearly polarized (h ‖ b∗, e ‖ c) monochro-matic electromagnetic wave through a Ho-LGS sample (a-cut), measured atdifferent strengths (color) of the magnetic field, which was applied in alongthe crystal’s c-axis (Voigt geometry). bottom For a better visualisation ofthe change of signal (and optical thickness), it was devided (subtracted) bythe zero field signal (optical thickness).
68

5.4 Excitation in the Complex Transmission
tation ∆ε, the resonance frequency fres = ω0/2π and the damping parameter γ by fittingthe measured complex transmission for different temperatures (Fig. 5.22). However, sinceonly the information of the phonon’s left side is given, we had to acknowledge that thisset of parameters provided too many degrees of freedom to fit the subtle differencesunder the application of magnetic field. This can be understood, when approximatingω ω0 in Eq. 5.22. In this limit, we can assume the real and imaginary part to be
ε′(ω) ≈ ε(0)− ∆ε
ω20
ω2 (5.23)
and
ε′′(ω) ≈ ∆ε
ω20
γω , (5.24)
respectively. While the real part allows for determining ε(0) by the zero-frequency limitand ∆ε
ω20by its quadratic slope, the imaginary part can be used for extracting γ. However,
a separation of ∆ε and ω0 cannot be achieved in this frequency regime, if the changesare small. Therefore, we fixed one of the two parameters (∆ε), when fitting the magneticfield dependence.
This analysis provided several interesting insights. First of all, the increase of thestatic permittivity along the c-axis for a decrease of temperature cannot be explained bythe change of the low-frequency phonon, since its static contribution, ∆ε, unexpectedlydecreases with decreasing temperature. Even more interestingly, we can attribute thechange of complex transmission under the application of a magnetic field of up to 4T toa decrease of γ, i.e. a narrowing of the phonon. Above this field no significant changes ofthe phonon parameters can be identified. The origin of this sensitivity to magnetic fieldsmight be a coupling of the crystal field levels of the magnetic Ho-ion to the vibrationalphonon mode. However, the determined parameters suggest a variation of ε∞ = ε(0) +∆ε, i.e. a sensitivity to magnetic fields of excitations at higher frequencies. Nevertheless,understanding the microscopic mechanisms behind the excitation and alteration of thephonon calls for further investigation in complementary experimental setups.
Even though the high frequency side of the phonon excitation can be observed in aFourier-transform infrared spectrometer, an attempt to get further information aboutthe sensitivity to magnetic fields failed. Unfortunately the resolution is not sufficient toreveal any signal in the relative spectra.
For a comprehensive study of the phonon spectra with special attention to the tem-perature dependence of Ho-langasite and further compounds of the langasite family, werefer to [85].
69

5 Magnetic Properties and the Magnetoelectric Effect in Ho-Langasite
Figure 5.22: Parameters for fitting the the low-frequency phonon (Fig. 5.21 and 5.19)as a Lorentzian, as described in Eq. (5.22). ∆ε (top) was assumed to beindependent on the magnetic field, while the change of γ, ε0 (along c-axis)and fres are shown (bottom) for each temperature (color).
70
5.5 Summary
5.5 SummaryWe presented an extensive study of the magnetic and magnetoelectric properties ofHoxLa3−xGa5SiO14. An unusual MEE was discovered for the polarization along the crys-tal’s c-direction, which is linearly dependent on the strength of the magnetic field, butoscillates six times upon the rotation of the field in the ab-plane of the compound. Thiseffect could be qualitatively modeled by two approaches, assuming two different magneticstructures of the system. Already the assumption of one local easy axis for each of thethree Ho-sites is sufficient to reproduce the main features of the observed phenomenon.However, the investigation of the magnetic properties revealed a more complex magneticanisotropy, indicating the presence two local easy axes for the Ho-ions. However, a scal-ing factor had to be introduced, to be able to model the magnetic and magnetoelectricproperties simultaneously. Furthermore, a coupling of an applied magnetic field to a low-frequency phonon was observed. By extracting the parameters describing this excitation,we concluded that the application of a magnetic field along the crystal’s c-axis leads toa narrowing of the phonon resonance.
71


6 Identifying Quantum PhaseTransitions by TorqueMagnetometry
In this chapter, two realizations of resolving the magnetic phase diagrams of two mag-netoelectrics by torque magnetometry are presented. In many cases the measurement ofthe magnetization curves is not sufficient to indicate the correct microscopical structureof the magnetic moments, but additional information about the magnetic anisotropy isneeded, which can be provided by measuring the magnetic torque. At least, an accuratemeasure, which is complementary to measuring the induced magnetization, of the ex-act transition fields and temperatures can be offered by this experimental method, aspresented for two different materials, namely in the polar magnetoelectric multiferroicsGaV4S8 [86; 87] and Mn2Mo3O8 [88; 89].
6.1 Transition of Cycloidal Phase to Skyrmion Latticein GaV4S8
The polar magnetic semiconductor GaV4S8 is paramagnetic down to a temperature of13K. Below this temperature it presents delicate structured magnetic phase diagram,including a cycloidal phase and the first observation of a Néel-type skyrmion latticephase in a bulk crystal ever reported [90]. In this section we show the proof of principlethat such a quantum phase diagram can easily be resolved by the torque magnetometeroption of a PPMS (Chapter 2.2.4).
Skyrmions in Lacunar Spinel Chalconegides
Recent scientific attraction was caused by the experimental observation of topologically-stable magnetic vortex textures [91], so-called skyrmions, which have been already the-oretically studied since 1989 [92] and are thought to have intriguing applications asspintronic devices, like transistors or memory devices [93]. Skyrmions are distinguishedby the type of rotation of the spins into Bloch- and Néel-type skyrmions (schematicallyshown in Fig. 6.1), while also a novel combination of both types were recently observed,the so-called anti-skyrmions [94].
73

6 Identifying Quantum Phase Transitions by Torque Magnetometry
Figure 6.1: Spin structure of a Bloch- (a) and Néel-type skyrmion and the correspondingcross-sections. The image was directly taken from [90].
The family of lacunar spinel chalcogenides AM4X8 (A = Ga, Ge; M = V, Nb, Ta;X = S, Se) consist of transition metal clusters M4 as the magnetic building blocks,which large separation induces a Mott insulators state in the crystal. Furthermore, thesecompounds were investigated for a rich variety of interesting physical phenomena, likepressure-induced superconductivity [95], colossal magnetoresistance [96] and magneto-electric mutliferroicity [97].The compound GaV4S8 belongs at room temperature to the F 43m space group, but
undergoes a structural transition by cooling below a temperature of TS ≈ 40K into therhombohedral R3m space group [86; 98], followed by a magnetic transition at TC = 13K,first solely connected to the emergence of a ferromagnetic order [98]. However, a morecomplicated magnetic phase diagram was resolved, which lead to the first observationof a Néel-type skyrmion in a bulk crystal [90].The magnetic phases and the corresponding phase transitions below TC were iden-
tified in [90] by measuring the magnetization curves along three crystallographic axes([100],[110],[111]). Within the M(H) measurement, the transitions can be observed asdirection-dependent step-like features. However, it could be argued that the steps are notvery well pronounced, which brings some difficulties in pinpointing the exact transitionfield and temperature. Therefore we examine the phase transition by torque magnetom-etry (Chapter 2.2.4) and propose this approach to measure and identify quantum phasetransitions.
6.1.1 Identifying Phase Transitions by Magnetic Anisotropy
The investigated sample is a thin plane-parallel plate, cut along the [111]-plane. Asdescribed in [90], the crystal has four different easy axes ([111],[111],[111],[111]). For
74
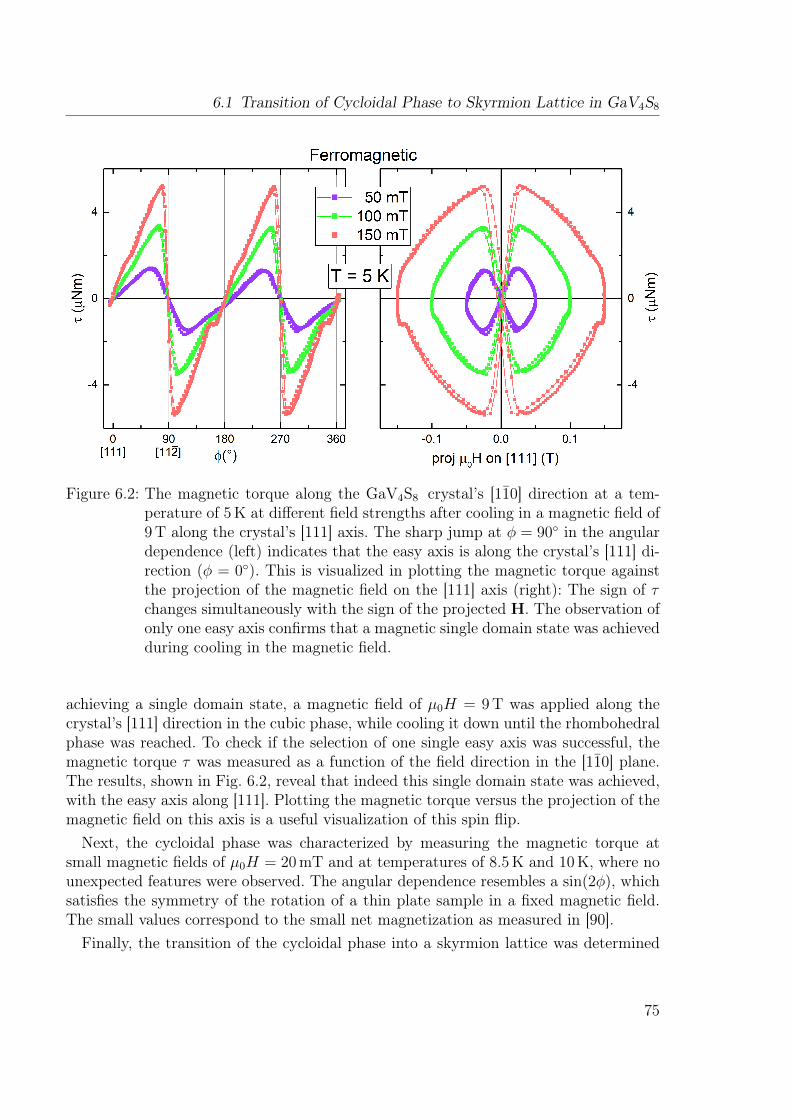
6.1 Transition of Cycloidal Phase to Skyrmion Lattice in GaV4S8
Figure 6.2: The magnetic torque along the GaV4S8 crystal’s [110] direction at a tem-perature of 5K at different field strengths after cooling in a magnetic field of9T along the crystal’s [111] axis. The sharp jump at φ = 90 in the angulardependence (left) indicates that the easy axis is along the crystal’s [111] di-rection (φ = 0). This is visualized in plotting the magnetic torque againstthe projection of the magnetic field on the [111] axis (right): The sign of τchanges simultaneously with the sign of the projected H. The observation ofonly one easy axis confirms that a magnetic single domain state was achievedduring cooling in the magnetic field.
achieving a single domain state, a magnetic field of µ0H = 9T was applied along thecrystal’s [111] direction in the cubic phase, while cooling it down until the rhombohedralphase was reached. To check if the selection of one single easy axis was successful, themagnetic torque τ was measured as a function of the field direction in the [110] plane.The results, shown in Fig. 6.2, reveal that indeed this single domain state was achieved,with the easy axis along [111]. Plotting the magnetic torque versus the projection of themagnetic field on this axis is a useful visualization of this spin flip.Next, the cycloidal phase was characterized by measuring the magnetic torque at
small magnetic fields of µ0H = 20mT and at temperatures of 8.5K and 10K, where nounexpected features were observed. The angular dependence resembles a sin(2φ), whichsatisfies the symmetry of the rotation of a thin plate sample in a fixed magnetic field.The small values correspond to the small net magnetization as measured in [90].
Finally, the transition of the cycloidal phase into a skyrmion lattice was determined
75

6 Identifying Quantum Phase Transitions by Torque Magnetometry
Figure 6.3: The magnetic torque along the GaV4S8 crystal’s [110] direction in an appliedmagnetic field of 200Oe and at temperatures of 10K (orange) and 8.5K(blue) after cooling in a magnetic field of 9T along the crystal’s [111] axis.The observed magnetic torque is rather small and exhibits an uneven shape.This might be a result of experimental artifacts like some misalignment ofthe sample or mechanical stress in the sensor.
(Fig. 6.4). For this purpose it is important to bear in mind that only one easy axisis present in the sample. Therefore it proves useful to take into the projection of themagnetic field onto the [111] direction, as shown in Figs. 6.2, 6.3, 6.4 on the right side.In this way, the exact position of the transition in the field-temperature diagram can bedetermined. We extract by the two presented measurements that the magnetic transitionoccurs for a temperature of 11K at a field of 30mT and for 12K at 25mT. This fitsvery well the previously determined values in [90].
6.2 Magnetic anisotropy in the antiferromagneticmultiferroic Mn2Mo3O8
As reported in [99], the polar ferrimagnet Mn2Mo3O8 undergoes three different magnet-ically ordered phases, when an external field of up to 14T is applied along the crystal’sc-axis, as detectable by the different slopes in the magnetization curve Fig. 6.5b. To com-plement these measurements with additional information about the magnetic anisotropy,the magnetic torque around the crystal’s c-axis was measured (Fig. 6.6). An extended
76
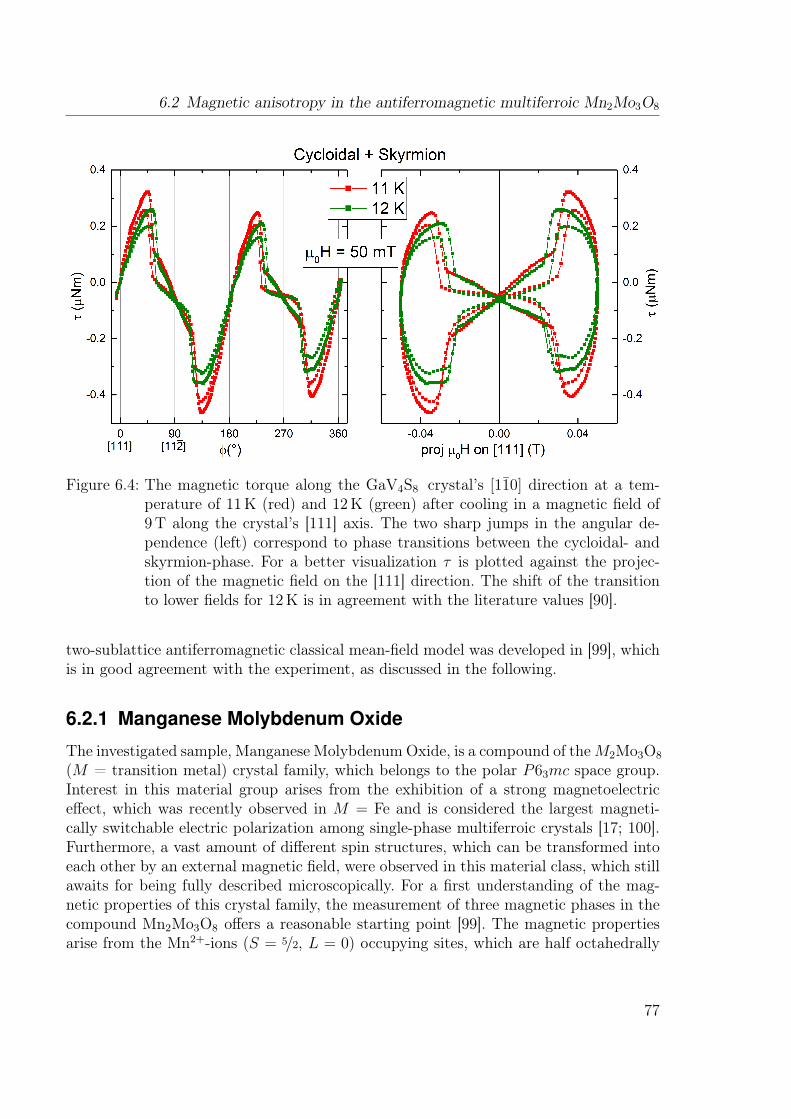
6.2 Magnetic anisotropy in the antiferromagnetic multiferroic Mn2Mo3O8
Figure 6.4: The magnetic torque along the GaV4S8 crystal’s [110] direction at a tem-perature of 11K (red) and 12K (green) after cooling in a magnetic field of9T along the crystal’s [111] axis. The two sharp jumps in the angular de-pendence (left) correspond to phase transitions between the cycloidal- andskyrmion-phase. For a better visualization τ is plotted against the projec-tion of the magnetic field on the [111] direction. The shift of the transitionto lower fields for 12K is in agreement with the literature values [90].
two-sublattice antiferromagnetic classical mean-field model was developed in [99], whichis in good agreement with the experiment, as discussed in the following.
6.2.1 Manganese Molybdenum Oxide
The investigated sample, Manganese Molybdenum Oxide, is a compound of theM2Mo3O8
(M = transition metal) crystal family, which belongs to the polar P63mc space group.Interest in this material group arises from the exhibition of a strong magnetoelectriceffect, which was recently observed in M = Fe and is considered the largest magneti-cally switchable electric polarization among single-phase multiferroic crystals [17; 100].Furthermore, a vast amount of different spin structures, which can be transformed intoeach other by an external magnetic field, were observed in this material class, which stillawaits for being fully described microscopically. For a first understanding of the mag-netic properties of this crystal family, the measurement of three magnetic phases in thecompound Mn2Mo3O8 offers a reasonable starting point [99]. The magnetic propertiesarise from the Mn2+-ions (S = 5/2, L = 0) occupying sites, which are half octahedrally
77

6 Identifying Quantum Phase Transitions by Torque Magnetometry
coordinated and half tetrahedrally coordinated by oxygen anions.
6.2.2 MagnetizationBelow the Néel temperature of TN = 41.5K the spins of the octa- and tetrahedralsites align antiparallel along the hexagonal axis of the crystal, i.e. the easy axis inthe ferrimagnetic ground state [88]. At the lowest temperature the magnetic momentsof both sites compensate each other, which is not the case at higher temperatures,indicating different temperature dependencies, giving rise to a spontaneous non-zero netmagnetization. However, at lowest temperature the compensation of both moments canbe lifted by the application of an external magnetic field [89], as measured in a VibratingSample Magnetometer for field strenghts of up to 14T and shown in Fig. 6.5. For fieldsperpendicular to the hexagonal c-axis a linear increase of magnetization is induced,while a field along the c-axis only induces a magnetization at field strengths above 4T.While the compensation of moments still holds below this field, a smooth increase ofthe magnetization is induced above this transition field indicating a spin-reorientation.A second transition emerges when the magnetization asymptotically reaches the linearsusceptibility of the H ⊥ c case, which remains constant for up to 14T.
6.2.3 Magnetic TorqueThe microscopic model of the magnetic moments is developed based on the magnetiza-tion curves (Fig. 6.5) and the measurements of the magnetic torque, measured for anglesaround the crystal’s c-axis. A plane-parallel c-cut sample was used for this investigation.Below the first transition µ0HC1 the magnetization curves are characteristic for easy
axis antiferromagnets, i.e. zero magnetization for fields along the easy axis and a constantsusceptibility for fields perpendicular to the easy axis. As visualized in Fig. 6.5 a,b themoments are assumed to be antiparallel along the crystal’s c-axis and cant for the appliedfield H ⊥ c, which leads to a non-zero magnetization along this direction. The relativelylow values of the critical fields along the c axis and the identical susceptibility for H ‖ cand H ⊥ c in fields above HC2 indicate a nearly isotropic spin-system.The smooth increase of the magnetization between the two transition fields, results
from competing anisotropies. The magnetization is not parallel to the external field, asillustrated in Fig. 6.5b and described by the enclosed angle θM in Fig. 6.5c. This angleshould lead to a non-zero magnetic torque (Eq. 2.3). However, the system is unstable formagnetic fields along the c-axis, since the magnetization component perpendicular tothe field has no preferred orientation in the ab-plane. Therefore the measurements of τwere performed not only for an angle between field direction and c-axis ϑ of ≈ 0, wherethe preferred canting direction is induced by a non-controlled misalignment, but alsowith a controlled offset of ϑ ≈ ±1 towards the crystal’s a-axis (Fig. 6.6). The modelcalculations provide a good explanation for those angles, as presented in Fig. 6.6b.The characteristic peak in the magnetic field dependence of the magnetic torque in the
78

6.3 Summary
HC1 < H < HC2 field regions, corresponds to the maximum of θM (Fig. 6.5c). The smallhysteresis observed at these fields for some angles are most likely explained by mechan-ical instabilities of the experimental setup. The constant torque above HC2 is due tothe compensation of the decreasing angle θM and the increasing magnetization ampli-tude (Fig. 6.5b). Due to the good agreement of calculation and experiment in Fig. 6.5and 6.6, we can conclude that the the magnetic properties are well described by thissimple microscopic model, which is further developed by THz absorption spectroscopy.The measurements of the spin-wave frequencies enables the extraction of the magneticexchange and g-factor parameters, as presented in [99].
6.3 SummaryWe were able to reveal the magnetic phase transitions of two systems by torque mag-netometry. The conventional measurement technique to determine the transition fieldsis by magnetization curves. The emergence of sharp features in the magnetic torqueproved to be an excellent complimentary experimental approach to accurately obtainthese transition fields. This is especially true for the cycloidal-skyrmion phase transitionin GaV4S8. In Mn2Mo3O8the canting of the magnetic moments could be resolved bycombining magnetization curves with measurements of the magnetic torque as well.
79

6 Identifying Quantum Phase Transitions by Torque Magnetometry
Figure 6.5: Magnetic field dependence of the magnetization of Mn2Mo3O8 at T = 2 K.Magnetic field is perpendicular (a) and parallel (b,c) to the c axis. The redsolid line corresponds to the experiment, while the blue dashed line corre-sponds to the model calculation. The orange and blue arrows illustrate themagnetic moments of the two sublattices in different magnetic fields pointinghorizontally/vertically for (a) and (b), respectively. The experimental curveof the H ⊥ c case is repeated in (b) as black dotted line for comparison.Panel (c) shows the calculated angle θM enclosed by the magnetization andthe magnetic field. The presented measurements (a,b) were performed by An-ton Jesche at the Center for Electronic Correlations and Magnetism of theUniversity of Augsburg and the model was calculated by David Szaller [99].
80

6.3 Summary
Figure 6.6: Magnetic field dependence of the magnetic torque in Mn2Mo3O8 at T = 2 K.(a) experiment and (b) model calculation. The angle included between the caxis and the magnetic field is denoted by ϑ, where the ± signs represent thedirections towards the ±a-axes.
81


7 Radiative Damping inYttrium-Iron-Garnet Films
In this chapter1 we present the investigation of the magnetic equivalent of electric super-radiance in yttrium iron garnet (YIG) thin films. The ferrimagnetic resonance is analyzedfor two samples of different thicknesses in a quasi-optical sub-THz transmission spec-troscopy with an applied magnetic field in two different geometries (Chapter 2.3). Themagnetic superradiance can be easily separated from the intrinsic damping, both of themleading to a broadening of the resonance signal, by a straightforward analysis, based onMaxwell’s equations.
7.1 IntroductionSince the current CMOS-based electronics is soon to reach its limitations [102], the designof fundamentally new ways to forward, process, and store information is of vital impor-tance. One possible direction is offered by magnonics, where information is manifestedin the magnetic state of matter and forwarded as an oscillating magnetic wave (magnon)[103]. The lifetime of such an excited state, usually in the microwave frequency range,is a crucial factor when designing potential applications. Besides their use in informa-tion technology, the research of magnonic systems with long-lifetime excitations is alsomotivated by their role as model systems of fundamental physical effects, such as Bose-Einstein condensation and other macroscopic quantum transport phenomena [104; 105].
Lifetime measurement of various excited states is an essential tool for analyzing physi-cal, chemical, and biological processes and making spectroscopic state assignments [106].The most direct way is to observe the transient optical signal following the excitationpulse, typically in luminescence, and by fitting the exponential decay, the lifetime ofthe corresponding excited state can be determined [107]. Another approach involves thephase shift of the response as compared to the modulated excitation signal [108].
The third method utilizes Heisenberg’s uncertainty principle, which connects the life-time of a state to the uncertainty of its energy [109], resulting in the natural line broaden-ing of the spectroscopic absorption or emission signal. However, starting from the earliestspectroscopic experiments, the intrinsic natural broadening is dominated by other phe-nomena, such as the collision between particles and the Doppler-effect due to thermal mo-tion in the atomic spectral lines of gases [110]. In case of microwave magnetic resonance
1This chapter is based on a paper that is about to be published [101].
83

7 Radiative Damping in Yttrium-Iron-Garnet Films
measurements, where the magnetic sample is coupled to the GHz-radiation typically by acoplanar waveguide, the two main contributions to the non-intrinsic linewidth result fromeddy currents induced either in the conducting sample [111] or in the waveguide [112],which effects are termed eddy-current- and radiative damping, respectively [113].In several cases when intrinsic damping is low and the density of oscillators is high,
the damping due to coherent radiation starts to dominate, the effect known as superra-diance [114]. Superradiance denotes coherent emission of uncoupled emitters when inter-acting with the same mode of electromagnetic wave, predicted in the Dicke-modell [115]and observed both in gases inside of an optical cavity [116; 117; 118], in metamateri-als [119; 120], and in two-dimensional electron gases [121; 122; 123; 124].The concept of superradiance was first discussed by Dicke for two-level molecules in a
gas [115]. More general, superradiance is now considered as the coherent radiative emis-sion by a system of uncoupled oscillators, which are connected only by their interactionwith the same mode of an electromagnetic wave. In recent years new interest arose (e.g.[114]) from the investigation of superradiance at the cyclotron resonance, which couplesto the electric field of the light, in two-dimensional electron gases [121]. In this case thesuperradiance can dominate the intrinsic damping, when an applied gate voltage leadsto a high density of oscillators. However, to achieve the dominance of superradiance inmagnetic oscillators is not as simple, since the material parameters limit the oscillatordensity and the magnetic coupling to the light wave is rather small. Therefore an ap-proach of separating the intrinsic and radiative contributions to the linewidth of theresonance signal is developed and applied to a wide range of measurements, which is ob-tained by the variation of resonance frequency, experimental geometry (Faraday/Voigt)and sample thickness.
7.2 Experimental Method
For this investigation two thin films of Y3Fe5O12 (YIG) grown by liquid epitaxy on aparamagnetic Gd3Ga5O12 (GGG) substrate were chosen due to the strong and sharpferrimagnetic resonance of YIG and the well known properties of both compounds. Thefirst sample is a 3µm thick YIG film on a 537µm GGG, while the second sample consistsof two 6.1µm YIG-films on both sides of a 471µm thick GGG substrate. Since thethickness of the thin films is crucial for the interpretation of the optical experiments, forquality control, static magnetization measurements were performed in a vibrating samplemagnetometer (Chapter 2.2) and in the temperature range of 5 - 300K, as shown inFig. 7.1. The thickness of the YIG layer in the sample was accurately determined from themagnitude of the observed magnetization step at a small magnetic field, correspondingto the switching of the ferrimagnetic magnetization of the YIG film (Fig. 7.1).The measurements were performed in Voigt geometry with a linearly polarized beam
in the phase-sensitive Mach-Zehnder setup and in Faraday geometry at the exact samefrequencies with a circularly polarized beam in the transmission-only mode (see Chap-
84

7.2 Experimental Method
Figure 7.1: The temperature dependent ferrimagnetic magnetization of the YIG film isshown for the sample consisting of one 3µm thick YIG layer and the sampleconsisting of two 6.1µm thick YIG layers on top of the GGG substrate. Inthe inset the magnetization as a function of magnetic field is shown for bothsamples, normalized with the area of the thin film. Therefore the magnitudeof the step in magnetization corresponds directly to the thickness of the films.
85

7 Radiative Damping in Yttrium-Iron-Garnet Films
ter 2.3). During the measurements, the sample temperature was kept at 200K.
7.3 Analyzing the Transmission Spectra andSeparating Intrinsic and Radiative Damping
The transmission spectra have been analyzed using the Fresnel optical equations fora multilayer system [125], assuming a Lorentzian line-shape for the ferri/paramagneticresonance in the magnetic permeability of the YIG film and the GGG substrate, respec-tively. As discussed below, to visualize the effects of magnetic superradiance, simplifiedexpressions for the transmission coefficient are more appropriate. This procedure allowsa direct estimate of the relevant material parameters from the spectra. The magneticresonances of the system are shown in Fig. 7.2.In the following we present the basic steps of the thin film approximation, which are
necessary to analyze the magnetic radiative damping. Similarly to the case of cyclotronsuperradiance in semiconducting films [114; 126], the effect can only be observed insamples which are thin compared to the radiation wavelength. In the opposite case ofthe thick sample, the "superradiated" wave is re-absorbed, thus forming the propagationwave within the material.The response of the magnetic moment M of YIG to an external magnetic field H is
given by the Landau-Lifshitz-Gilbert equation of motion [127]
dMdt
= −γµ0 (M×H) +α
M0
(M× M
dt
), (7.1)
where γ denotes the gyromagnetic ratio, M0 the saturation magnetization, α the dimen-sionless Gilbert damping parameter, and µ0 the vacuum permeability. Here we assumedthat the oscillation is coherent in the sample, due to the monochromatic incoming lightof the same phase and the small thickness of the films.In case of an incoming THz beam with frequency ω and within Faraday geometry
the magnetic field in the film is given by H =(hxe
iωt, hyeiωt, HF
0
). Here hx,ye
iωt is theoscillating (AC) field in the sample plane, HF
0 is the strength of the static (DC) magneticfield in the material given by HF
0 = |H0 − M0|, with the applied external field H0.Linearizing Eq. (7.1), we finally get the standard result for the magnetic susceptibilityfor the circularly polarized light in the Faraday geometry:
χF± =
m±h±
=γM0
ωF0 ∓ ω + iαω
, (7.2)
wherem±, h± are the circular AC magnetization and field, respectively, and ωF0 = γ|H0−
M0| is the ferromagnetic resonance frequency.Similarly, in the Voigt geometry with linearly polarized light H = (H0, hye
iωt, 0) the
86
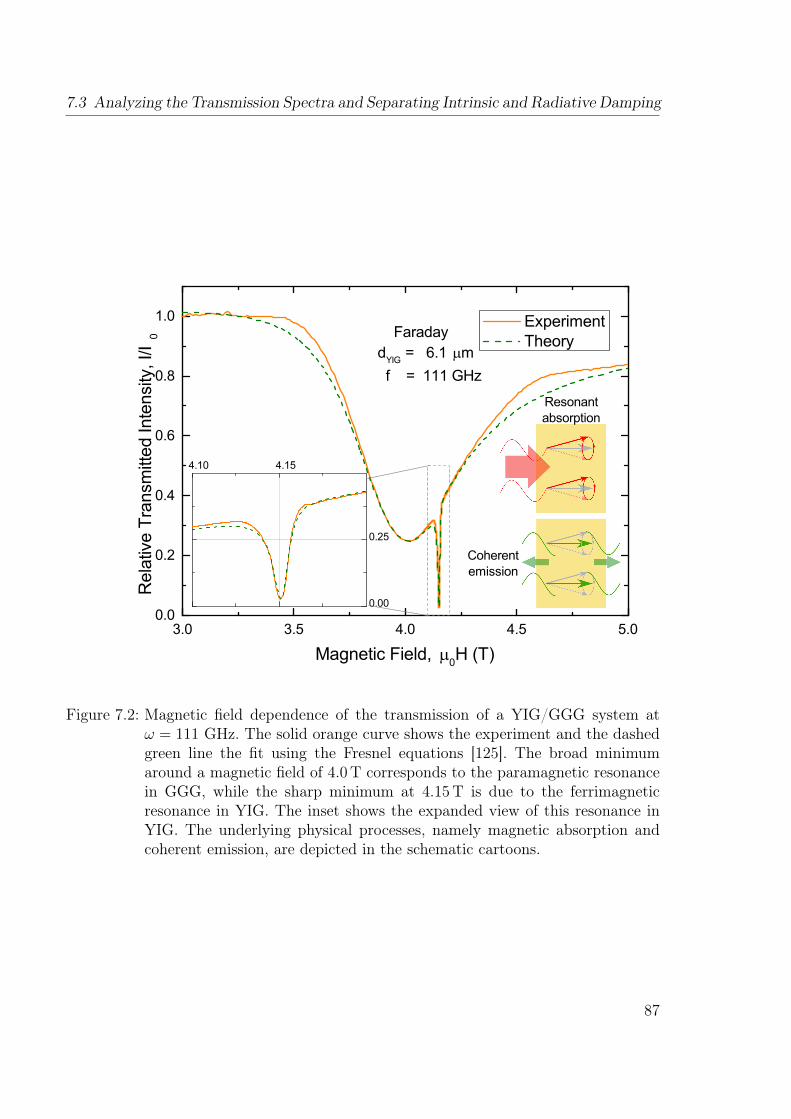
7.3 Analyzing the Transmission Spectra and Separating Intrinsic and Radiative Damping
3.0 3.5 4.0 4.5 5.00.0
0.2
0.4
0.6
0.8
1.0
4.10 4.15
0.00
0.25
Coherentemission
Experiment Theory
Rel
ativ
e Tr
ansm
itted
Inte
nsity
, I/I
0
Magnetic Field, 0H (T)
FaradaydYIG = 6.1 m f = 111 GHz
Resonantabsorption
Figure 7.2: Magnetic field dependence of the transmission of a YIG/GGG system atω = 111 GHz. The solid orange curve shows the experiment and the dashedgreen line the fit using the Fresnel equations [125]. The broad minimumaround a magnetic field of 4.0T corresponds to the paramagnetic resonancein GGG, while the sharp minimum at 4.15T is due to the ferrimagneticresonance in YIG. The inset shows the expanded view of this resonance inYIG. The underlying physical processes, namely magnetic absorption andcoherent emission, are depicted in the schematic cartoons.
87

7 Radiative Damping in Yttrium-Iron-Garnet Films
susceptibility is obtained as
χVy =
(ωV0 )2M0/H0
(ωV0 )
2+ (α− i)2 ω2
, (7.3)
with ωV0 = γ
√H0(H0 +M0) resonance frequency.
To obtain the radiative contribution to the damping, we consider the transmissionthrough a magnetic sample in the thin film approximation [128; 129]. In this approx-imation, the boundary conditions are rewritten, taking the thin film as a part of theboundary. For the Faraday geometry with circularly polarized light, we use the Maxwellequations ∮
∂A
E · dl = −∫∫
A
∂B
∂t· dA∮
∂A
H · dl =
∫∫A
∂D
∂t· dA
(7.4)
to obtain the fields on both sides of the film:
e0± − er± − et± = −iωdµ0 (h± +m±)
h0± + hr
± − ht± = iωde±εε0 .
(7.5)
On the left-hand side of Eq. (7.5), (e) and (h) are the AC electric and magnetic fieldsof the incident (0), reflected (r) and transmitted (t) wave. On the right-hand side, withinthe thin-sample approximation, the linear dependence of the AC electric and magneticfields along the surface normal of the sample is assumed. Thus, e±, h± and m± are themean values of the corresponding fields and of the magnetization inside the film. Hered denotes the sample thickness, and ε, ε0 stand for the electric permittivity of YIG andvacuum, respectively. To obtain Eq. (7.5), the integration path in the Maxwell equationsmust be taken across both sides of the sample.
The AC electric and magnetic fields are connected via e = Z0h/n1,2, where Z0 =√µ0/ε0 is the impedance of free space, and n1,2 is the refractive index of the dielectric
media on both sides of the film. To further simplify the final expressions, for frequenciesclose to the ferromagnetic resonance, we assume χF
± 1 and neglect all smaller terms.After some simple algebra, the transmission coefficient is obtained as:
tF± =ht±
h0±
=
(1
2+
1
2n+iωdµ0χ
F±
2Z0
)−1
, (7.6)
where n stands for the refractive index of the substrate (GGG in our case).
In order to obtain relative transmission due to the magnetic resonance in YIG, Eq. (7.6)
88

7.3 Analyzing the Transmission Spectra and Separating Intrinsic and Radiative Damping
should be normalized by the transmission2 through the pure substrate, t|d=0:
t±F
t±F |d=0
= 1− iΓFrad
ω0 − ω + iαω + iΓFrad
, (7.7)
where we introduce the radiative damping parameter as
ΓFrad =
n
Z0(n+ 1)ωdµ0γM0 = 2π
n
n+ 1
d
λγM0. (7.8)
Here λ is the radiation wavelength.In the case of Voigt geometry, the normalized transmission for a linearly polarized
wave with hy results in the same expression as in Eq. (7.7), where the superradiantdamping parameter is replaced by
ΓVrad =
ΓFrad
2. (7.9)
In the case of electric superradiance in thin films the corresponding equation reads [126]
Γrad = n2De2Z0/2m. (7.10)
Here n2D is the density, e the charge, and m the effective mass of two-dimensional elec-trons. In the electric case, to control the ratio between intrinsic and radiation damping,the electron density can be easily changed by variation of the gate voltage [126]. In themagnetic case the parameter responsible for the radiance intensity is the static mag-netization M0 that can be modified by tuning the temperature. An alternative way tocontrol the superradiance is by changing the sample thickness d, as seen in Eq. (7.8).
Eq. (7.7) provides an expression for a resonant minimum in transmission with an ef-fective width given by the sum of intrinsic (α) and radiative (ΓF
rad) parts. Since boththe amplitude and the linewidth of the peak in Eq. (7.7) contains ΓF
rad, the power ofthe secondary re-emitted wave grows with the square of the number of magnetic mo-ments due to ΓF
rad ∼ M0d. This scaling is characteristic for coherent radiation, such assuperradiance.
According to Eq. (7.7), compared to an intrinsic damping Γint = αω, the resonanceis additionally broadened by the radiative damping Γrad. As illustrated in Fig. 7.3, theanalysis of the linewidth and amplitude of the resonance according to Eq. (7.7) providesa way to directly obtain both damping parameters independently.Fig. 7.2 shows the typical magnetic field dependent transmission of YIG films on
GGG substrate. The sharp minimum at 4.14T that corresponds to the ferrimagneticresonance of YIG is observed on top of the broad paramagnetic resonance of the GGG
2In case of two films on both sides of the substrate the transmission in the same approximation isgiven by t(2d) = |t(d)|2.
89
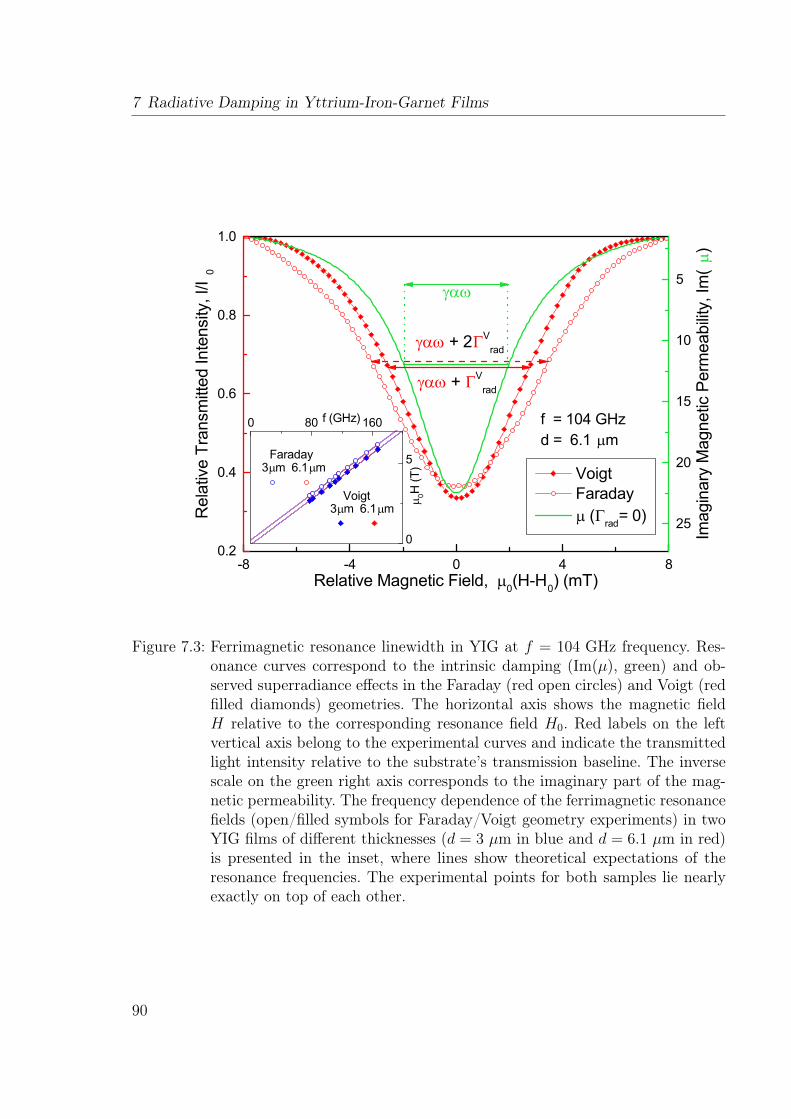
7 Radiative Damping in Yttrium-Iron-Garnet Films
0 80 160
0
5
-8 -4 0 4 80.2
0.4
0.6
0.8
1.0
Voigt Faraday ( rad= 0)
Relative Magnetic Field, 0(H-H0) (mT)
Rel
ativ
e Tr
ansm
itted
Inte
nsity
, I/I
0
25
20
15
10
5
+ 2 Vrad
Imag
inar
y M
agne
tic P
erm
eabi
lity, I
m(
)
f = 104 GHzd = 6.1 m
+ Vrad
3 m 6.1 m
Faraday
3 m 6.1 m
0H
(T)
f (GHz)
Voigt
Figure 7.3: Ferrimagnetic resonance linewidth in YIG at f = 104 GHz frequency. Res-onance curves correspond to the intrinsic damping (Im(µ), green) and ob-served superradiance effects in the Faraday (red open circles) and Voigt (redfilled diamonds) geometries. The horizontal axis shows the magnetic fieldH relative to the corresponding resonance field H0. Red labels on the leftvertical axis belong to the experimental curves and indicate the transmittedlight intensity relative to the substrate’s transmission baseline. The inversescale on the green right axis corresponds to the imaginary part of the mag-netic permeability. The frequency dependence of the ferrimagnetic resonancefields (open/filled symbols for Faraday/Voigt geometry experiments) in twoYIG films of different thicknesses (d = 3 µm in blue and d = 6.1 µm in red)is presented in the inset, where lines show theoretical expectations of theresonance frequencies. The experimental points for both samples lie nearlyexactly on top of each other.
90

7.3 Analyzing the Transmission Spectra and Separating Intrinsic and Radiative Damping
Figure 7.4: Frequency dependence of the intrinsic damping parameter, α, which is ex-tracted from fits of the resonance in transmission for samples with differentthicknesses (6.1µm - red, 3µm - blue). The measurement error is indicatedby bands of the corresponding colors.
substrate. The two resonances were fitted simultaneously using Fresnel equations for thetransmission of the layered system. The free parameters in such a fit are the saturationmagnetization of the YIG film M0, intrinsic damping α, and the resonance field Hres.The refractive index of the GGG substrate, n = 3.43, was obtained in a separate exper-iment [130]. The magnetic field dependence of the paramagnetic resonance frequency inGGG corresponds to a g-factor of gGGG = 2.26.
The ferrimagnetic resonance field Hres of YIG shows an approximately linear depen-dence on the frequency f (see inset in Fig. 7.3), which is expected in high magnetic fieldsH0 M0. From the fits to these data we estimate the values for the saturation magne-tization µ0M0(T = 200K) = 0.22 ± 0.05T, in reasonable agreement with the literaturevalues [131] and with the static data, µ0M
VSM0 = 0.198T, measured on the same sample
using vibrating sample magnetometry (Fig. 7.1).Fig. 7.3 demonstrates that the ferrimagnetic resonance linewidth of YIG in the trans-
mission is indeed substantially higher than the actual resonance linewidth in the mag-
91
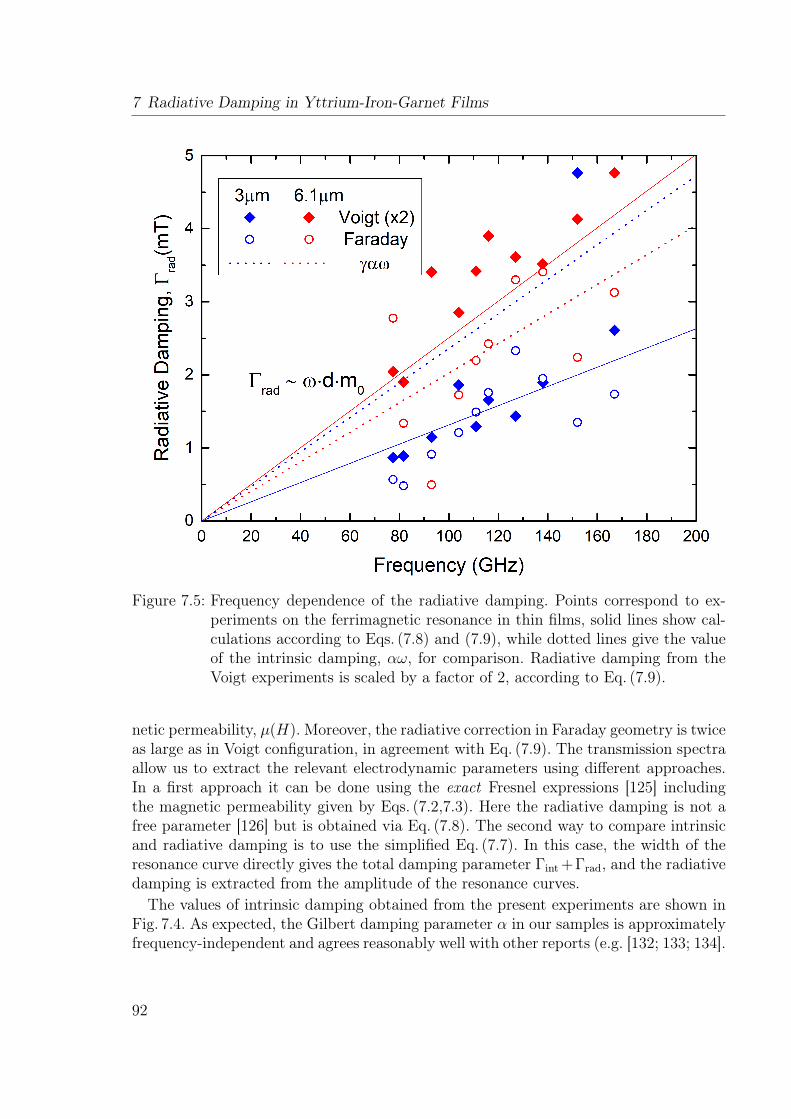
7 Radiative Damping in Yttrium-Iron-Garnet Films
Figure 7.5: Frequency dependence of the radiative damping. Points correspond to ex-periments on the ferrimagnetic resonance in thin films, solid lines show cal-culations according to Eqs. (7.8) and (7.9), while dotted lines give the valueof the intrinsic damping, αω, for comparison. Radiative damping from theVoigt experiments is scaled by a factor of 2, according to Eq. (7.9).
netic permeability, µ(H). Moreover, the radiative correction in Faraday geometry is twiceas large as in Voigt configuration, in agreement with Eq. (7.9). The transmission spectraallow us to extract the relevant electrodynamic parameters using different approaches.In a first approach it can be done using the exact Fresnel expressions [125] includingthe magnetic permeability given by Eqs. (7.2,7.3). Here the radiative damping is not afree parameter [126] but is obtained via Eq. (7.8). The second way to compare intrinsicand radiative damping is to use the simplified Eq. (7.7). In this case, the width of theresonance curve directly gives the total damping parameter Γint +Γrad, and the radiativedamping is extracted from the amplitude of the resonance curves.The values of intrinsic damping obtained from the present experiments are shown in
Fig. 7.4. As expected, the Gilbert damping parameter α in our samples is approximatelyfrequency-independent and agrees reasonably well with other reports (e.g. [132; 133; 134].
92
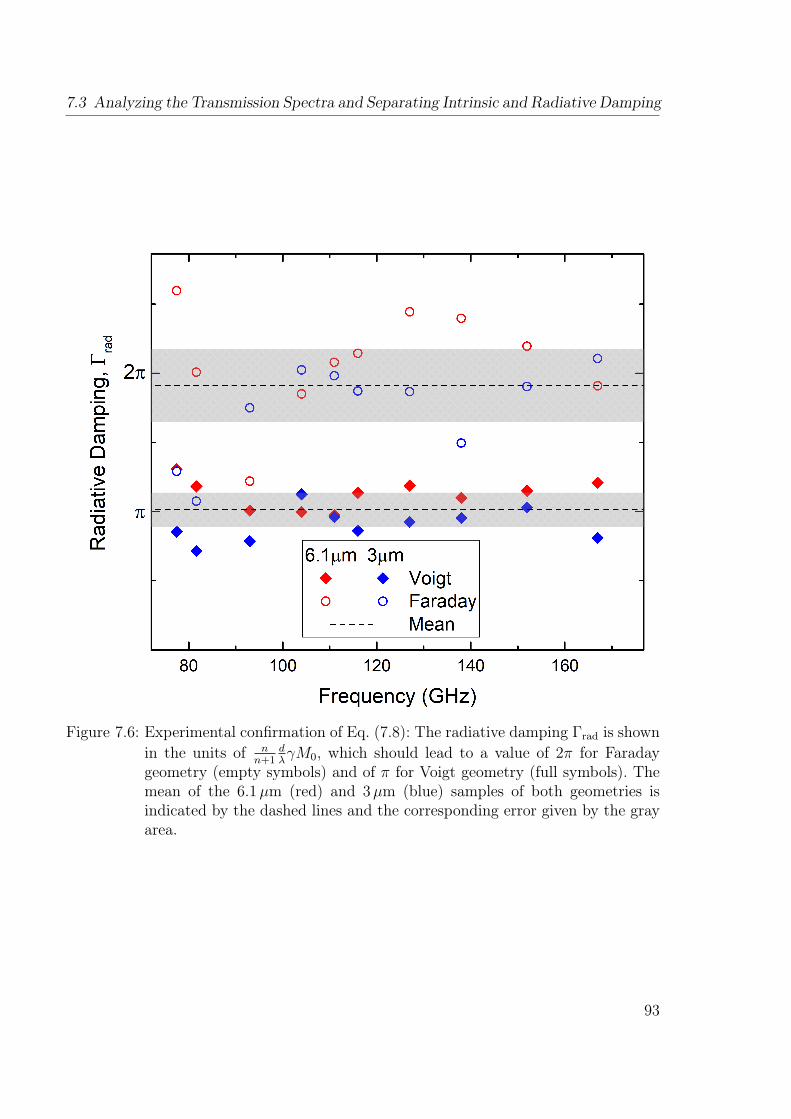
7.3 Analyzing the Transmission Spectra and Separating Intrinsic and Radiative Damping
Figure 7.6: Experimental confirmation of Eq. (7.8): The radiative damping Γrad is shownin the units of n
n+1dλγM0, which should lead to a value of 2π for Faraday
geometry (empty symbols) and of π for Voigt geometry (full symbols). Themean of the 6.1µm (red) and 3µm (blue) samples of both geometries isindicated by the dashed lines and the corresponding error given by the grayarea.
93

7 Radiative Damping in Yttrium-Iron-Garnet Films
Fig. 7.5 shows the frequency dependence of the radiative damping at the magneticresonance. Γrad is proportional to the frequency and to the sample thickness as ex-pected from Eq. (7.8). Comparing the values of the intrinsic (dotted lines) and radiativedamping, we see that in the thin film with d = 3µm, the intrinsic damping domi-nates. On the contrary in the thicker film both contributions are of comparable values:ωα ∼ Γrad(6.1µm).Finally, by plotting the radiative damping in the units of n
n+1dλγM0 the Eq. (7.8) could
be confirmed, since the remainder gives π and 2π for Voigt (see Eq. (7.9)) and Faradaygeometry, respectively, which can be well reproduced, as demonstrated in Fig. 7.6. Anoscillation around those values is especially visible for the Faraday measurements, whichcan be traced back to Fabry-Pérot interferences in the substrate.
7.4 SummaryWe have presented a method to separate the intrinsic and radiative contributions tomagnetic thin films’ resonance linewidth in optical absorption experiments, including anaccurate determination of the intrinsic Gilbert damping parameter α. The coherent na-ture of the radiative line broadening mechanism allows its identification as the magneticequivalent of superradiance, opening a fundamentally new way to study this collectivephenomenon in the dynamics of magnetic systems.
94

8 ConclusionsIn this work a diverse set of phenomena in magnetoelectric materials, obtained by awide range of experimental techniques, was presented and discussed. The selection ofstatic and dynamic setups enabled us for not only detecting the magnetoelectric effectdirectly by measuring the magnetically induced electric polarization, but also to inves-tigate further effects, like quantum phase transitions, an electron-phonon coupling andthe magnetic equivalence of superradiance.For two rare-earth magnetoelectrics the effect was measured and modelled. In samar-
ium ferroborate we applied an already developed model to the high-field effect, whichallowed for correcting the Sm-Fe molecular field and, by complementing already pub-lished measurements, to determine the g-factor of the samarium ions in this system.Moreover, we reported the discovery of a small magnetoelectric effect of the sixth order,which was not observed up to now.
In HoxLa3−xGa5SiO14 a profound study was conducted, revealing a puzzling magneto-electric effect, which cannot be classified in the classic categories of linear versus higher-order effects. The sixfold oscillation of the magnetically induced polarization, when themagnetic field is swept around the threefold symmetry axis, indicates a magnetoelectriceffect of the sixth order, similar to samarium ferroborate. However, the electric polar-ization becomes linearly dependent on the magnetic field strengths above a low fieldthreshold. In two steps we presented a simple phenomenological model, first solely basedon one easy axis for each of the three Ho-sites, which was then extended to also fit theexperimentally obtained magnetic anisotropy, by a two-easy axes approach. Both modelsgive a reasonable agreement of the magnetoelectric effect, whilst only the second modelgives a sufficient explanation of the magnetic torque and the angular dependent magneti-zation. Nevertheless, we formulated some open questions, which have to be answered fora complete understanding of the magnetic and magnetoelectric properties of the system.The lowest lying crystal field level was obtained by measurements of the paramagneticresonance and the electric polarization induced by strong magnetic fields. Even thoughit could indicate the energies of higher crystal field levels, a complete investigation ofthe exact energies would be desired. Furthermore a strong magnetic field dependent low-frequency excitation was discovered, which we identified as a phonon that seems to becoupled to the crystal field levels of the holmiums 4f -electrons and, therefore, narrowsin magnetic fields along the threefold symmetry axis.
The torque magnetometry was further used to identify transitions between differentspin configurations in transition metal multiferroics. GaV4S8 was reported to have arather fine magnetic phase diagram at low temperatures and small fields. We were able
95

8 Conclusions
to show that measurements of the magnetic torque provide an excellent experimentalconfirmation of the proposed phase transitions between cycloidal spin structures andNéel-skyrmions. Moreover, torque magnetometry was used to complement the magne-tization curves of Mn2Mo3O8 to reveal the uneven canting of the magnetic momentson two different sublattices. These studies prove the value of the experimental setup toidentify quantum phase transitions.For the well known yttrium-iron-garnet thin films, the ferrimagnetic resonance at dif-
ferent frequencies was thoroughly investigated. The exceptional resolution of the back-ward wave oscillators provided the opportunity to obtain small changes in the linewidthof the sharp absorption lines. The high frequency of this optical approach provided aprecise way to determine the intrinsic Gilbert damping parameter. Based on the Maxwellequations and the boundary conditions, we were able to derive that besides the inter-nal damping, a radiative damping term shortens the lifetime of the excitation, whichcould be verified by the experiments with different configurations of sample thicknessand magnetic field direction.This work demonstrates that magnetoelectric materials provide an intriguing research
topic, even apart from the linear magnetoelectric effect, which the research is oftenfocused on. Not only higher-order effects in highly symmetric paramagnetic compounds,but also dynamic phenomena, like magnetic superradiance or electron-phonon couplingare calling for further research.
96

Acknowledgments
In the past years I got much support from many people without whom I could neverhave completed this work. First, I want to thank the following people for making myPhD possible:
• Andrei Pimenov for the supervision of this work and my measurements in the pastyears. Andrei and Anna Pimenov for the coordination of our group.
• André Vogel for coordinating the Solids4Fun program. More importantly, thankyou for helping with the whole organization around my PhD, from filling out travelrequests to getting all the credit points I needed. I always knew that I could cometo your office and you would fix each and every problem I had.
• Our friendly secretaries for the administrative work.
I want to thank the following people for their scientific input:
• Andrei Pimenov for the guidance throughout my PhD. Thank you for alwayshaving an open door for me. I am very glad that I had the opportunity to exploremany different experimental setups and materials.
• Alexey Shuvaev for guiding me through the various challenges that came up inthe experimental work. When I had problems during the data analysis, you helpedme just enough, so that I could find the solutions by myself. Thank you for yourpatience, you are a perfect teacher. Thank you for proofreading the thesis.
• David Szaller for the supervision of many of the herein described experiments. I amespecially glad for the numerous ideas you had for new measurements. Thank youfor helping me understand the different theoretical concepts in long discussions.You encouraged me to ask the simplest questions by pretending that you couldstill learn something from it. Thank you for proofreading the thesis.
• Evan Constable for the supervision of measurements, which unfortunately did notmake it into this thesis. I learned a lot from our discussions, which we preferred tohave during lunch time or certain long evenings. Thank you for proofreading thethesis.
• Thomas Kain for introducing me to the PPMS and helping me especially in myfirst year of the PhD with many different experimental issues.
97

Acknowledgments
• Artem Kuzmenko for introducing me to the sub-THz setup, the langasites and theferroborates. Thank you for helping me regularly by answering many questions viae-mail.
• Uladzislau Dziom for helping me to tame the U4 setup and for the discussionsabout science, while you filled the office with music.
• Alexander Mukhin for patiently discussing various experiments with me and ex-plaining the theoretical concepts behind it. Thank you especially for encouragingme to share my thoughts on the measurements. Even during my first months ofthe PhD you took my suggestions seriously and discussed the ideas with me.
• Anna Pimenov for coordinating the group and the feedback on my contributionsin the group discussions. Thank you for showing me what happens when sciencemeets art.
• Jan Gospodarič, Lorenz Bergen and Janek Wettstein, my fellow PhD students,for the discussions in our office and in the group meetings. Thank you, Jan, forsharing your experience with the sub-THz setup and giving feedback on my pre-sentation skills. Thank you, Lorenz, for the discussions about our shared passion,the langasites, for explaining how the TU works and for accompanying me to themeasurements in Grenoble. Thank you, Janek, for the discussions about samariumferroborate.
• Ernst Bauer for teaching me how to measure with the pressure cell and the positiveand encouraging atmosphere in the lab.
• Milan Orlita and Jan Wyzula at the LNCMI in Grenoble for the collaboration andfor being wonderful hosts.
• Sumanta Chattopadhyay at the High Field Lab of the Helmholtz Zentrum Dresden-Rossendorf for measuring the magnetoelectric effect in pulsed fields with me.
• Michaela Kramer for helping me with the fitting of the YIG data.
Finally, I have to thank all my friends and family for the constant support. Especially,I want to mention the following people:
• All the new friends that I made in Vienna for being the main reason that the pastyears are among the best of my life.
• I am so grateful that my colleagues turned quickly into good friends. Thanks to you,my time in the office was characterized by a positive working atmosphere. I willnever forget the countless great evenings in Vienna and on the various conferences.
98

• The Akademische Bläserphilharmonie Wien, for giving me and my tuba a newmusical home. It was a gift to find so many good friends in this orchestra. In thisshort time, I made countless unforgettable experiences. From beautiful concertsand intensive rehearsals to hiking trips and memorable wine tastings. I will alwaysremember the long nights with even longer discussions about music, science andlife. Not only the work in the ’Weingarten’, but also the ’Gemüsegarten’ kept mesane during the past months. Special thanks to Berni Neustifter for supporting meeven through the lockdown with his infamous ’Neustifter-Selection’.
• My colleagues and friends from 5mcc, for inviting me into this awesome sciencecommunication project. I love to think ABAP with you!
• My companions from HDL for the good time in and around the Superstore.
• The Kramers for giving me a second home in Austria.
• My dear friends in Germany with whom I managed to stay in close contact. Thankyou for visiting me and for the open doors and beers, when I visited home.
• My parents for the love and support. My brothers for the fact that besides all thequarrel and fun I can always rely on you.
• Klara. For everything. I love you.
99

Bibliography
[1] J. C. Maxwell. VIII. A dynamical theory of the electromagnetic field. Philosophicaltransactions of the Royal Society of London , 155, pp. 459–512 (1865)
[2] W. C. Röntgen. Ueber die durch Bewegung eines im homogenen electrischen Feldebefindlichen Dielectricums hervorgerufene electrodynamische Kraft. Annalen derPhysik und Chemie 271, 10, pp. 264–270 (1888)
[3] P. Curie. Sur la symétrie dans les phénomènes physiques, symétrie d’un champélectrique et d’un champ magnétique. Journal de Physique Théorique et Appliquée3, 1, pp. 393–415 (1894)
[4] L. D. Landau, E. M. Lifshitz. Electrodynamics of continuous media. Course oftheoretical physics, Pergamon, Oxford. Trans. from the Russian (1960)
[5] D. Astrov. The magnetoelectric effect in antiferromagnetics. Sov. Phys. JETP 11,3, pp. 708–709 (1960)
[6] A. I. Popov, D. I. Plokhov, A. K. Zvezdin. Quantum theory of magnetoelectricityin rare-earth multiferroics: Nd, Sm, and Eu ferroborates. Physical Review B 87,2 (2013)
[7] A. M. Kadomtseva, Y. F. Popov, S. S. Krotov, G. P. Vorob’ev, E. A. Popova, A. K.Zvezdin, L. N. Bezmaternykh. Investigation of the anomalies of the magnetoelectricand magnetoelastic properties of single crystals of the ferroborate GdFe3(BO3)4 atphase transitions. Low Temperature Physics 31, 8, pp. 807–813 (2005)
[8] G. Kozlov, A. Volkov. Coherent source submillimeter wave spectroscopy. In Topicsin Applied Physics, pp. 51–109. Springer Berlin Heidelberg (1998)
[9] M. Fiebig. Revival of the magnetoelectric effect. Journal of Physics D: AppliedPhysics 38, 8, pp. R123–R152 (2005)
[10] J.-P. Rivera. A short review of the magnetoelectric effect and related experimentaltechniques on single phase (multi-) ferroics. The European Physical Journal B 71,3, pp. 299–313 (2009)
[11] M. Fiebig, T. Lottermoser, D. Meier, M. Trassin. The evolution of multiferroics.Nature Reviews Materials 1, 8, p. 16046 (2016)
101

BIBLIOGRAPHY
[12] N. A. Spaldin, R. Ramesh. Advances in magnetoelectric multiferroics. Naturematerials 18, 3, p. 203 (2019)
[13] G. T. Rado, V. J. Folen. Observation of the Magnetically Induced MagnetoelectricEffect and Evidence for Antiferromagnetic Domains. Physical Review Letters 7,8, pp. 310–311 (1961)
[14] T. H. O’Dell. An induced magneto-electric effect in yttrium iron garnet. Philo-sophical Magazine 16, 141, pp. 487–494 (1967)
[15] B. Krichevtsov, V. Pavlov, R. Pisarev. Giant linear magnetoelectric effect in garnetferrite films. Jetp Lett 49, 8, p. 535 (1989)
[16] E. Ascher. Higher-order magneto-electric effects. The Philosophical Magazine: AJournal of Theoretical Experimental and Applied Physics 17, 145, pp. 149–157(1968)
[17] T. Kurumaji, S. Ishiwata, Y. Tokura. Doping-Tunable Ferrimagnetic Phase withLarge Linear Magnetoelectric Effect in a Polar Magnet Fe2Mo3O8. Physical ReviewX 5, 3 (2015)
[18] A. Shuvaev, V. Dziom, A. Pimenov, M. Schiebl, A. A. Mukhin, A. C. Komarek,T. Finger, M. Braden, A. Pimenov. Electric Field Control of Terahertz Polarizationin a Multiferroic Manganite with Electromagnons. Physical Review Letters 111,22 (2013)
[19] S. Bluck, H. G. Kahle. Measurement and interpretation of the magneto-electriceffect in TbPO4. Journal of Physics C: Solid State Physics 21, 29, pp. 5193–5208(1988)
[20] T. H. O’Dell. The field invariants in a magneto-electric medium. PhilosophicalMagazine 8, 87, pp. 411–418 (1963)
[21] W. F. Brown, R. M. Hornreich, S. Shtrikman. Upper Bound on the MagnetoelectricSusceptibility. Physical Review 168, 2, pp. 574–577 (1968)
[22] H. Schmid. Magnetoelectric effects in insulating magnetic materials. InA. Lakhtakia, W. S. Weiglhofer, R. F. Messier (Editors), Complex Mediums. SPIE(2000)
[23] S. L. Hou, N. Bloembergen. Paramagnetoelectric Effects in NiSO4·6H2O. PhysicalReview 138, 4A, pp. A1218–A1226 (1965)
[24] C. Tabares-Munoz, J. P. Rivera, A. Bezinges, A. Monnier, H. Schmid. Measurementof the Quadratic Magnetoelectric Effect on Single Crystalline BiFeO3. JapaneseJournal of Applied Physics 24, S2, p. 1051 (1985)
102

BIBLIOGRAPHY
[25] B. Howes, M. Pelizzone, P. Fischer, C. Tabares-munoz, J. pierre Rivera, H. Schmid.Characterisation of some magnetic and magnetoelectric properties of ferroelectricPb(Fe1/2Nb1/2)O3. Ferroelectrics 54, 1, pp. 317–320 (1984)
[26] H. Schmid. On a magnetoelectric classification of materials. International Journalof Magnetism 4, 4, pp. 337–361 (1973)
[27] M. J. Cardwell. Measurements of the magnetic field dependent electric susceptibilityof yttrium iron garnet. Philosophical Magazine 20, 167, pp. 1087–1089 (1969)
[28] A. Shubnikov. Symmetry and Antisymmetry of Finite Figures. (1951)
[29] J. Curie, P. Curie. Piezoelectric and allied phenomena in Rochelle salt. Comptesrendus de l’Académie des sciences 91, pp. 294–297 (1880)
[30] W. Voigt, et al. Lehrbuch der Kristallphysik, volume 962. Teubner Leipzig (1928)
[31] G. T. Rado. Statistical Theory of Magnetoelectric Effects in Antiferromagnetics.Physical Review 128, 6, pp. 2546–2556 (1962)
[32] H. Grimmer. The piezomagnetoelectric effect. Acta Crystallographica Section AFoundations of Crystallography 48, 3, pp. 266–271 (1992)
[33] V. V. Shvartsman, S. Bedanta, P. Borisov, W. Kleemann, A. Tkach, P. M. Vilar-inho. (Sr,Mn)TiO3: A Magnetoelectric Multiglass. Physical Review Letters 101,16 (2008)
[34] K.-C. Liang, R. P. Chaudhury, B. Lorenz, Y. Y. Sun, L. N. Bezmaternykh, V. L.Temerov, C. W. Chu. Giant magnetoelectric effect in HoAl3(BO3)4. PhysicalReview B 83, 18 (2011)
[35] G. A. Gehring. On the microscopic theory of the magnetoelectric effect. Ferro-electrics 161, 1, pp. 275–285 (1994)
[36] I. Dzyaloshinsky. A thermodynamic theory of “weak” ferromagnetism of antiferro-magnetics. Journal of Physics and Chemistry of Solids 4, 4, pp. 241–255 (1958)
[37] T. Moriya. New Mechanism of Anisotropic Superexchange Interaction. PhysicalReview Letters 4, 5, pp. 228–230 (1960)
[38] H. Schmid. Multi-ferroic magnetoelectrics. Ferroelectrics 162, 1, pp. 317–338(1994)
[39] J. F. Scott. Applications of magnetoelectrics. Journal of Materials Chemistry 22,11, p. 4567 (2012)
103

BIBLIOGRAPHY
[40] M. Bibes, A. Barthélémy. Towards a magnetoelectric memory. Nature Materials7, 6, pp. 425–426 (2008)
[41] A. Pimenov, A. A. Mukhin, V. Y. Ivanov, V. D. Travkin, A. M. Balbashov,A. Loidl. Possible evidence for electromagnons in multiferroic manganites. NaturePhysics 2, 2, pp. 97–100 (2006)
[42] J. Seidel, L. W. Martin, Q. He, Q. Zhan, Y.-H. Chu, A. Rother, M. E. Hawkridge,P. Maksymovych, P. Yu, M. Gajek, N. Balke, S. V. Kalinin, S. Gemming, F. Wang,G. Catalan, J. F. Scott, N. A. Spaldin, J. Orenstein, R. Ramesh. Conduction atdomain walls in oxide multiferroics. Nature Materials 8, 3, pp. 229–234 (2009)
[43] J. H. Jung, M. Matsubara, T. Arima, J. P. He, Y. Kaneko, Y. Tokura. OpticalMagnetoelectric Effect in the PolarGaFeO3Ferrimagnet. Physical Review Letters93, 3 (2004)
[44] J. Wang. Epitaxial BiFeO3 Multiferroic Thin Film Heterostructures. Science 299,5613, pp. 1719–1722 (2003)
[45] K. Z. Rushchanskii, S. Kamba, V. Goian, P. Vaněk, M. Savinov, J. Prokleška,D. Nuzhnyy, K. Knížek, F. Laufek, S. Eckel, S. K. Lamoreaux, A. O. Sushkov,M. Ležaić, N. A. Spaldin. A multiferroic material to search for the permanentelectric dipole moment of the electron. Nature Materials 9, 8, pp. 649–654 (2010)
[46] H. Zheng. Multiferroic BaTiO3-CoFe2O4 Nanostructures. Science 303, 5658, pp.661–663 (2004)
[47] J. A. Mundy, C. M. Brooks, M. E. Holtz, J. A. Moyer, H. Das, A. F. Rébola, J. T.Heron, J. D. Clarkson, S. M. Disseler, Z. Liu, A. Farhan, R. Held, R. Hovden,E. Padgett, Q. Mao, H. Paik, R. Misra, L. F. Kourkoutis, E. Arenholz, A. Scholl,J. A. Borchers, W. D. Ratcliff, R. Ramesh, C. J. Fennie, P. Schiffer, D. A. Muller,D. G. Schlom. Atomically engineered ferroic layers yield a room-temperature mag-netoelectric multiferroic. Nature 537, 7621, pp. 523–527 (2016)
[48] J. Ma, J. Hu, Z. Li, C.-W. Nan. Recent Progress in Multiferroic MagnetoelectricComposites: from Bulk to Thin Films. Advanced Materials 23, 9, pp. 1062–1087(2011)
[49] P. K. Amiri, J. G. Alzate, X. Q. Cai, F. Ebrahimi, Q. Hu, K. Wong, C. Grezes,H. Lee, G. Yu, X. Li, M. Akyol, Q. Shao, J. A. Katine, J. Langer, B. Ocker, K. L.Wang. Electric-Field-Controlled Magnetoelectric RAM: Progress, Challenges, andScaling. IEEE Transactions on Magnetics 51, 11, pp. 1–7 (2015)
104

BIBLIOGRAPHY
[50] Y. Wang, D. Gray, J. Gao, D. Berry, M. Li, J. Li, D. Viehland, H. Luo. Improve-ment of magnetoelectric properties in Metglas/Pb(Mg1/3Nb2/3)O3–PbTiO3 lami-nates by poling optimization. Journal of Alloys and Compounds 519, pp. 1–3(2012)
[51] A. A. Bush, K. E. Kamentsev, V. F. Meshcheryakov, Y. K. Fetisov, D. V. Chashin,L. Y. Fetisov. Low-frequency magnetoelectric effect in a Galfenol-PZT planar com-posite structure. Technical Physics 54, 9, pp. 1314–1320 (2009)
[52] D. A. Keszler. Borates for optical frequency conversion. Current Opinion in SolidState and Materials Science 1, 2, pp. 204–211 (1996)
[53] J. A. Campá, C. Cascales, E. Gutiérrez-Puebla, M. A. Monge, I. Rasines, C. Ruíz-Valero. Crystal Structure, Magnetic Order, and Vibrational Behavior in Iron Rare-Earth Borates. Chemistry of Materials 9, 1, pp. 237–240 (1997)
[54] A. M. Kadomtseva, Y. F. Popov, G. P. Vorob’ev, A. P. Pyatakov, S. S. Krotov,K. I. Kamilov, V. Y. Ivanov, A. A. Mukhin, A. K. Zvezdin, A. M. Kuz’menko, L. N.Bezmaternykh, I. A. Gudim, V. L. Temerov. Magnetoelectric and magnetoelasticproperties of rare-earth ferroborates. Low Temperature Physics 36, 6, pp. 511–521(2010)
[55] A. K. Zvezdin, G. P. Vorob’ev, A. M. Kadomtseva, Y. F. Popov, A. P. Pyatakov,L. N. Bezmaternykh, A. V. Kuvardin, E. A. Popova. Magnetoelectric and mag-netoelastic interactions in NdFe3(BO3)4 multiferroics. JETP Letters 83, 11, pp.509–514 (2006)
[56] M. N. Popova, E. P. Chukalina, B. Z. Malkin, D. A. Erofeev, L. N. Bezmaternykh,I. A. Gudim. Crystal field and exchange interactions in the SmFe3(BO3)4 mul-tiferroic. Journal of Experimental and Theoretical Physics 118, 1, pp. 111–123(2014)
[57] E. Chukalina, M. Popova, L. Bezmaternykh, I. Gudim. Spectroscopic study of themagnetic ordering in SmFe3(BO3)4. Physics Letters A 374, 15-16, pp. 1790–1792(2010)
[58] A. I. Pankrats, G. A. Petrakovskii, L. N. Bezmaternykh, O. A. Bayukov. Antifer-romagnetic resonance and phase diagrams of gadolinium ferroborate GdFe3(BO3)4.Journal of Experimental and Theoretical Physics 99, 4, pp. 766–775 (2004)
[59] E. Eremin, N. Volkov, V. Temerov, I. Gudim, A. Bovina. Specific features ofmagnetic properties of rare-earth ferroborates Sm1−xLaxFe3(BO3)4. Physics of theSolid State 57, 3, pp. 569–575 (2015)
105

BIBLIOGRAPHY
[60] Z. Frait. The g-factor in pure polycrystalline iron. Czechoslovak Journal of Physics27, 2, pp. 185–189 (1977)
[61] L. Weymann, L. Bergen, T. Kain, A. Pimenov, A. Shuvaev, E. Constable, D. Sza-ller, B. V. Mill, A. M. Kuzmenko, V. Y. Ivanov, N. V. Kostyuchenko, A. I. Popov,A. K. Zvezdin, A. Pimenov, A. A. Mukhin, M. Mostovoy. Unusual magnetoelectriceffect in paramagnetic rare-earth langasite. npj Quantum Materials 5, 1 (2020)
[62] A. Kaminskii, B. Mill, I. Silvestrova, G. Khodzhabagian. The nonlinearly activematerial (La1−xNdx)3Ga5SiO14. IzSSR 47, pp. 1903–1909 (1983)
[63] I. Andreev, M. Dubovik. New piezoelectric langasit La3Ga5SiO14-material with zerotemperature-coefficient of elastic oscillation particles. Pisma V Zhurnal Tekhnich-eskoi Fiziki 10, 8, pp. 487–491 (1984)
[64] B. Mill, Y. Pisarevsky. Langasite-type materials: from discovery to present state.In Proceedings of the 2000 IEEE/EIA International Frequency Control Symposiumand Exhibition (Cat. No.00CH37052). IEEE (2000)
[65] H. Fritze, H. L. Tuller. Langasite for high-temperature bulk acoustic wave applica-tions. Applied Physics Letters 78, 7, pp. 976–977 (2001)
[66] M. Hamidon, V. Skarda, N. White, F. Krispel, P. Krempl, M. Binhack, W. Buff.Fabrication of high temperature surface acoustic wave devices for sensor applica-tions. Sensors and Actuators A: Physical 123-124, pp. 403–407 (2005)
[67] J. Stade, L. Bohaty, M. Hengst, R. Heimann. Electro-optic, Piezoelectric andDielectric Properties of Langasite (La3Ga5SiO14), Langanite (La3Ga5.5Nb0.5O14)and Langataite (La3Ga5.5Ta0.5O14). Crystal Research and Technology: Journal ofExperimental and Industrial Crystallography 37, 10, pp. 1113–1120 (2002)
[68] H. Kong, J. Wang, H. Zhang, X. Yin, S. Zhang, Y. Liu, X. Cheng, L. Gao, X. Hu,M. Jiang. Growth, properties and application as an electrooptic Q-switch of lang-asite crystal. Journal of Crystal Growth 254, 3-4, pp. 360–367 (2003)
[69] B. A. Maksimov, V. N. Molchanov, B. V. Mill, E. L. Belokoneva, M. K. Rabadanov,A. A. Pugacheva, Y. V. Pisarevskii, V. I. Simonov. Absolute structure ofLa3Ga5SiO14 langasite crystals. Crystallography Reports 50, 5, pp. 751–758 (2005)
[70] P. Bordet, I. Gelard, K. Marty, A. Ibanez, J. Robert, V. Simonet, B. Canals,R. Ballou, P. Lejay. Magnetic frustration on a Kagomé lattice in R3Ga5SiO14
langasites with R = Nd, Pr. Journal of Physics: Condensed Matter 18, 22, pp.5147–5153 (2006)
106

BIBLIOGRAPHY
[71] K. Marty, P. Bordet, V. Simonet, M. Loire, R. Ballou, C. Darie, J. Kljun,P. Bonville, O. Isnard, P. Lejay, B. Zawilski, C. Simon. Magnetic and dielectricproperties in the langasite-type compounds: A3BFe3D2O14 (A=Ba, Sr, Ca; B=Ta,Nb, Sb; D=Ge, Si). Physical Review B 81, 5 (2010)
[72] M. Loire, V. Simonet, S. Petit, K. Marty, P. Bordet, P. Lejay, J. Ollivier, M. En-derle, P. Steffens, E. Ressouche, A. Zorko, R. Ballou. Parity-Broken Chiral SpinDynamics in Ba3NbFe3Si2O14. Physical Review Letters 106, 20 (2011)
[73] M. Ramakrishnan, E. Constable, A. Cano, M. Mostovoy, J. S. White, N. Gurung,E. Schierle, S. de Brion, C. V. Colin, F. Gay, P. Lejay, E. Ressouche, E. Weschke,V. Scagnoli, R. Ballou, V. Simonet, U. Staub. Field-induced double spin spiral ina frustrated chiral magnet. npj Quantum Materials 4, 1 (2019)
[74] J. Robert, V. Simonet, B. Canals, R. Ballou, P. Bordet, P. Lejay, A. Stunault.Spin-Liquid Correlations in the Nd-Langasite Anisotropic Kagomé Antiferromag-net. Physical Review Letters 96, 19 (2006)
[75] J. Robert, V. Simonet, B. Canals, R. Ballou, P. Bordet, P. Lejay, A. Stunault.Erratum: Spin-Liquid Correlations in the Nd-Langasite Anisotropic Kagomé An-tiferromagnet. Physical Review Letters 97, 25 (2006)
[76] A. Konstantinova, T. Golovina, A. Dudka. Anisotropy of Optical Activity in Lan-gasite Family Crystals. Crystallography Reports 63, 2, pp. 200–206 (2018)
[77] A. K. Zvezdin, S. S. Krotov, A. M. Kadomtseva, G. P. Vorob’ev, Y. F. Popov, A. P.Pyatakov, L. N. Bezmaternykh, E. Popova. Magnetoelectric effects in gadoliniumiron borate GdFe3(BO3)4. Journal of Experimental and Theoretical Physics Letters81, 6, pp. 272–276 (2005)
[78] V. Y. Ivanov, A. Kuzmenko, A. A. Mukhin. Magnetoelectric effect in ytterbiumaluminum borate YbAl3(BO3)4. JETP Letters 105, 7, pp. 435–441 (2017)
[79] A. Zvezdin, R. Levitin, A. Popov, V. Silant’ev. Magnetic field strength dependenceof the magnetostriction of rare-earth iron garnets. Zhurnal Ehksperimental’noj iTeoreticheskoj Fiziki 80, 4, pp. 1504–1513 (1981)
[80] G. Babushkin, A. Zvezdin, R. Levitin, V. Orlov, A. Popov. Theoretical and exper-imental investigations of the magnetostriction of paramagnetic rare-earth garnetsTb3Ga5O12 and Dy3Al5O12. Zhurnal Eksperimental’noi i Teoreticheskoi Fiziki 85,4, pp. 1366–1376 (1983)
[81] N. Vedernikov, A. Zvezdin, R. Levitin, A. Popov. Magnetic linear birefringence inrare earth garnets. Zhurnal Ehksperimental’noj i Teoreticheskoj Fiziki 93, 12, pp.2161–2178 (1987)
107

BIBLIOGRAPHY
[82] N. Vedernikov, A. Zvezdin, R. Levitin, A. Popov. Magnetostriction of paramagneticrare-earth garnets. Zh. Eksp. Teor. Fiz 94, p. 370 (1988)
[83] J. H. Van Vleck. The theory of electric and magnetic susceptibilities. ClarendonPress (1932)
[84] C. Kittel. Einführung in die Festkörperphysik, 15. Aufl (2013)
[85] L. Bergen, L. Weymann, A. Kuzmenko, A. A. Mukhin, E. Constable, A. Pimenov.Low Frequency Phonons in Langasites. to be published (2020)
[86] R. Pocha, D. Johrendt, R. Pöttgen. Electronic and structural instabilities inGaV4S8 and GaMo4S8. Chemistry of materials 12, 10, pp. 2882–2887 (2000)
[87] E. Ruff, S. Widmann, P. Lunkenheimer, V. Tsurkan, S. Bordács, I. Kézsmárki,A. Loidl. Multiferroicity and skyrmions carrying electric polarization in GaV4S8.Science Advances 1, 10, p. e1500916 (2015)
[88] S. McAlister, P. Strobel. Magnetic order in M2Mo3O8 single crystals (M = Mn,Fe, Co, Ni). Journal of Magnetism and Magnetic Materials 30, 3, pp. 340–348(1983)
[89] T. Kurumaji, S. Ishiwata, Y. Tokura. Diagonal magnetoelectric susceptibility andeffect of Fe doping in the polar ferrimagnet Mn2Mo3O8. Physical Review B 95, 4(2017)
[90] I. Kézsmárki, S. Bordács, P. Milde, E. Neuber, L. M. Eng, J. S. White, H. M.Rønnow, C. D. Dewhurst, M. Mochizuki, K. Yanai, H. Nakamura, D. Ehlers,V. Tsurkan, A. Loidl. Néel-type skyrmion lattice with confined orientation in thepolar magnetic semiconductor GaV 4S8. Nature Materials 14, 11, pp. 1116–1122(2015)
[91] S. Muhlbauer, B. Binz, F. Jonietz, C. Pfleiderer, A. Rosch, A. Neubauer,R. Georgii, P. Boni. Skyrmion Lattice in a Chiral Magnet. Science 323, 5916,pp. 915–919 (2009)
[92] A. N. Bogdanov, D. Yablonskii. Thermodynamically stable “vortices” in magneti-cally ordered crystals. The mixed state of magnets. Zh. Eksp. Teor. Fiz 95, 1, p.178 (1989)
[93] W. Kang, Y. Huang, X. Zhang, Y. Zhou, W. Zhao. Skyrmion-Electronics: AnOverview and Outlook. Proceedings of the IEEE 104, 10, pp. 2040–2061 (2016)
[94] A. K. Nayak, V. Kumar, T. Ma, P. Werner, E. Pippel, R. Sahoo, F. Damay, U. K.Rößler, C. Felser, S. S. P. Parkin. Magnetic antiskyrmions above room temperaturein tetragonal Heusler materials. Nature 548, 7669, pp. 561–566 (2017)
108

BIBLIOGRAPHY
[95] M. M. Abd-Elmeguid, B. Ni, D. I. Khomskii, R. Pocha, D. Johrendt, X. Wang,K. Syassen. Transition from Mott Insulator to Superconductor in GaNb4Se8 andGaTa4Se8 under High Pressure. Physical Review Letters 93, 12 (2004)
[96] E. Dorolti, L. Cario, B. Corraze, E. Janod, C. Vaju, H.-J. Koo, E. Kan, M.-H.Whangbo. Half-Metallic Ferromagnetism and Large Negative Magnetoresistancein the New Lacunar Spinel GaTi3VS8. Journal of the American Chemical Society132, 16, pp. 5704–5710 (2010)
[97] K. Singh, C. Simon, E. Cannuccia, M.-B. Lepetit, B. Corraze, E. Janod, L. Cario.Orbital-Ordering-Driven Multiferroicity and Magnetoelectric Coupling in GeV4S8.Physical Review Letters 113, 13 (2014)
[98] C. Yadav, A. Nigam, A. Rastogi. Thermodynamic properties of ferromagneticMott-insulator GaV4S8. Physica B: Condensed Matter 403, 5-9, pp. 1474–1475(2008)
[99] D. Szaller, K. Szász, S. Bordács, J. Viirok, T. Rõõm, U. Nagel, A. Shuvaev, L. Wey-mann, A. Pimenov, A. A. Tsirlin, A. Jesche, L. Prodan, V. Tsurkan, I. Kézsmárki.Magnetic anisotropy and exchange paths for octa- and tetrahedrally coordinatedMn2+ ions in the honeycomb multiferroic Mn2Mo3O8. accepted for publication(2020)
[100] Y. Wang, G. L. Pascut, B. Gao, T. A. Tyson, K. Haule, V. Kiryukhin, S.-W.Cheong. Unveiling hidden ferrimagnetism and giant magnetoelectricity in polarmagnet Fe2Mo3O8. Scientific Reports 5, 1 (2015)
[101] L. Weymann, A. Shuvaev, A. Pimenov, A. A. Mukhin, D. Szaller. The magneticequivalent of electric superradiance: radiative damping in yttrium-iron-garnet films.to be published (2020)
[102] J. A. del Alamo. Nanometre-scale electronics with III–V compound semiconduc-tors. Nature 479, 7373, pp. 317–323 (2011)
[103] A. V. Chumak, V. I. Vasyuchka, A. A. Serga, B. Hillebrands. Magnon spintronics.Nature Physics 11, 6, pp. 453–461 (2015)
[104] S. O. Demokritov, V. E. Demidov, O. Dzyapko, G. A. Melkov, A. A. Serga, B. Hille-brands, A. N. Slavin. Bose–Einstein condensation of quasi-equilibrium magnonsat room temperature under pumping. Nature 443, 7110, pp. 430–433 (2006)
[105] D. A. Bozhko, A. A. Serga, P. Clausen, V. I. Vasyuchka, F. Heussner, G. A. Melkov,A. Pomyalov, V. S. L’vov, B. Hillebrands. Supercurrent in a room-temperatureBose–Einstein magnon condensate. Nature Physics 12, 11, pp. 1057–1062 (2016)
109

BIBLIOGRAPHY
[106] J. Demas. Excited state lifetime measurements. Elsevier (2012)
[107] J. Demas. Luminescence decay times and bimolecular quenching. An ultrafastkinetics experiment. Journal of Chemical Education 53, 10, p. 657 (1976)
[108] R. D. Spencer, G. Weber. Influence of Brownian Rotations and Energy Transferupon the Measurements of Fluorescence Lifetime. The Journal of Chemical Physics52, 4, pp. 1654–1663 (1970)
[109] E. A. Gislason, N. H. Sabelli, J. W. Wood. New form of the time-energy uncertaintyrelation. Physical Review A 31, 4, pp. 2078–2081 (1985)
[110] W. Voigt. Das Gesetz der Intensitätsverteilung innerhalb der Linien eines Gasspek-trums. Verlagd. KB Akad. d. Wiss. (1912)
[111] P. Pincus. Excitation of Spin Waves in Ferromagnets: Eddy Current and BoundaryCondition Effects. Physical Review 118, 3, pp. 658–664 (1960)
[112] G. Wende. Radiation damping in FMR measurements in a nonresonant rectangularwaveguide. Physica Status Solidi (a) 36, 2, pp. 557–567 (1976)
[113] M. A. W. Schoen, J. M. Shaw, H. T. Nembach, M. Weiler, T. J. Silva. Radia-tive damping in waveguide-based ferromagnetic resonance measured via analysis ofperpendicular standing spin waves in sputtered permalloy films. Physical ReviewB 92, 18 (2015)
[114] K. Cong, Q. Zhang, Y. Wang, G. T. Noe, A. Belyanin, J. Kono. Dicke superradiancein solids. Journal of the Optical Society of America B 33, 7, p. C80 (2016)
[115] R. H. Dicke. Coherence in Spontaneous Radiation Processes. Physical Review 93,1, pp. 99–110 (1954)
[116] N. Skribanowitz, I. P. Herman, J. C. MacGillivray, M. S. Feld. Observation ofDicke Superradiance in Optically Pumped HF Gas. Physical Review Letters 30, 8,pp. 309–312 (1973)
[117] M. Gross, P. Goy, C. Fabre, S. Haroche, J. M. Raimond. Maser Oscillation andMicrowave Superradiance in Small Systems of Rydberg Atoms. Physical ReviewLetters 43, 5, pp. 343–346 (1979)
[118] Y. Kaluzny, P. Goy, M. Gross, J. M. Raimond, S. Haroche. Observation of Self-Induced Rabi Oscillations in Two-Level Atoms Excited Inside a Resonant Cavity:The Ringing Regime of Superradiance. Physical Review Letters 51, 13, pp. 1175–1178 (1983)
110

BIBLIOGRAPHY
[119] Y. Sonnefraud, N. Verellen, H. Sobhani, G. A. Vandenbosch, V. V. Moshchalkov,P. V. Dorpe, P. Nordlander, S. A. Maier. Experimental Realization of Subradiant,Superradiant, and Fano Resonances in Ring/Disk Plasmonic Nanocavities. ACSNano 4, 3, pp. 1664–1670 (2010)
[120] M. Wenclawiak, K. Unterrainer, J. Darmo. Cooperative effects in an ensemble ofplanar meta-atoms. Applied Physics Letters 110, 26, p. 261101 (2017)
[121] Q. Zhang, T. Arikawa, E. Kato, J. L. Reno, W. Pan, J. D. Watson, M. J. Manfra,M. A. Zudov, M. Tokman, M. Erukhimova, A. Belyanin, J. Kono. Superradiant De-cay of Cyclotron Resonance of Two-Dimensional Electron Gases. Physical ReviewLetters 113, 4 (2014)
[122] T. Laurent, Y. Todorov, A. Vasanelli, A. Delteil, C. Sirtori, I. Sagnes, G. Beaudoin.Superradiant Emission from a Collective Excitation in a Semiconductor. PhysicalReview Letters 115, 18 (2015)
[123] Q. Zhang, M. Lou, X. Li, J. L. Reno, W. Pan, J. D. Watson, M. J. Manfra,J. Kono. Collective non-perturbative coupling of 2D electrons with high-quality-factor terahertz cavity photons. Nature Physics 12, 11, pp. 1005–1011 (2016)
[124] T. Maag, A. Bayer, S. Baierl, M. Hohenleutner, T. Korn, C. Schüller, D. Schuh,D. Bougeard, C. Lange, R. Huber, M. Mootz, J. E. Sipe, S. W. Koch, M. Kira.Coherent cyclotron motion beyond Kohn’s theorem. Nature Physics 12, 2, pp.119–123 (2015)
[125] A. M. Shuvaev, G. V. Astakhov, C. Brüne, H. Buhmann, L. W. Molenkamp, A. Pi-menov. Terahertz magneto-optical spectroscopy in HgTe thin films. SemiconductorScience and Technology 27, 12, p. 124004 (2012)
[126] J. Gospodarič, V. Dziom, A. Shuvaev, A. A. Dobretsova, N. N. Mikhailov, Z. D.Kvon, A. Pimenov. Superradiant and transport lifetimes of the cyclotron resonancein the topological insulator HgTe. Physical Review B 99, 11 (2019)
[127] A. G. Gurevich, G. A. Melkov. Magnetization Oscillations and Waves. Taylor &Francis Inc. ISBN 0849394600 (1996)
[128] M. Oksanen, S. Tretyakov, I. Lindell. Vector Circuit Theory for Isotropic andChiral Slabs. Journal of Electromagnetic Waves and Applications 4, 7, pp. 613–643 (1990)
[129] D. Szaller, A. Shuvaev, A. Mukhin, A. Kuzmenko, A. Pimenov. Controlling oflight with electromagnons. arXiv preprint arXiv:1910.05071 (2019)
111

BIBLIOGRAPHY
[130] A. Schneider, A. Shuvaev, S. Engelbrecht, S. O. Demokritov, A. Pimenov. Electri-cally Excited Inverse Electron Spin Resonance in a Split-Ring Metamaterial Res-onator. Physical Review Letters 103, 10 (2009)
[131] E. E. Anderson. Molecular Field Model and the Magnetization of YIG. PhysicalReview 134, 6A, pp. A1581–A1585 (1964)
[132] M. Chen, C. Patton, G. Srinivasan, Y. Zhang. Ferromagnetic resonance foldoverand spin-wave instability in single-crystal YIG films. IEEE Transactions on Mag-netics 25, 5, pp. 3485–3487 (1989)
[133] O. d’Allivy Kelly, A. Anane, R. Bernard, J. B. Youssef, C. Hahn, A. H. Molpeceres,C. Carrétéro, E. Jacquet, C. Deranlot, P. Bortolotti, R. Lebourgeois, J.-C. Mage,G. de Loubens, O. Klein, V. Cros, A. Fert. Inverse spin Hall effect in nanometer-thick yttrium iron garnet/Pt system. Applied Physics Letters 103, 8, p. 082408(2013)
[134] S. Kosen, A. F. van Loo, D. A. Bozhko, L. Mihalceanu, A. D. Karenowska. Mi-crowave magnon damping in YIG films at millikelvin temperatures. APL Materials7, 10, p. 101120 (2019)
112

Lukas WeymannCurriculum Vitae
Kölblgasse 32/381030, Vienna, AustriaH (+43) 678 1252369
Education2016-present Ph.D., Technische Universität Wien, Vienna, Austria.
Solid State Spectroscopy - Institute of Solid State Physics2014–2016 Master of Science, Leibniz University Hannover, Hannover, Germany.
Physics - Albert Einstein Institute of Hannover2011–2014 Bachelor of Science, Leibniz University Hannover, Hannover, Germany.
Physics - Institute for Theoretical Physics2011 Abitur, Ratsgymnasium Osnabrück, Osnabrück, Germany.
Masters ThesisTitle Long-Term Gamma-Ray Timing of an Extreme Black Widow Binary Pulsar
Supervisors Dr. Holger Pletsch & Prof. Domenico Giulini
Bachelors ThesisTitle Point Particles in a Five-Dimensional Reissner-Nordström-de-Sitter Space-
timeSupervisor Prof. Olaf Lechtenfeld
Communication SkillsPresentations within the Scientific Community
09/2019 Contributed Talk at "EASTMAG - 2019"03/2019 Contributed Talk at "DPG Spring Meeting of the Condensed Matter Section"03/2018 Contributed Talk at "DPG Spring Meeting of the Condensed Matter Section
and EPS-CMD27"02/2018 Contributed Talk at "33. Workshop on Novel Materials and Supercondutors"
1/2

Science Communication2020–present Producer/Host, "5MinutenClimateChance - Der Klimapodcast", Vienna,
Austria.2018 Local Co-Coordinator, "Wissensdurst-Festival", Vienna, Austria.2017 Teammember Physics, "Wissensdurst-Festival", Vienna, Austria.
Publications2020 D. Szaller et al. Magnetic anisotropy and exchange paths for octa- and tetra-
hedrally coordinated Mn2+ ions in the honeycomb multiferroic Mn2Mo3O8.accepted for publication
2020 L. Weymann et al. The magnetic equivalent of electric superradiance: ra-diative damping in yttrium-iron-garnet films. submitted
2020 L. Weymann et al. Unusual magnetoelectric effect in paramagnetic rare-earthlangasite. npj Quantum Materials, 5, 61 (2020)
2018 A. M. Kuzmenko et al. Switching of Magnons by Electric and MagneticFields in Multiferroic Borates. Phys. Rev. Lett. 120, 027203 (2018)
LanguagesGerman MothertongueEnglish Advanced
Programming LanguagesPython ExperiencedC/Java Basic
2/2