novel multiplex kit for screening cerebral amyloid
TRANSCRIPT
Page 1/18
Performance of the QPLEXTM Alz plus assay, anovel multiplex kit for screening cerebral amyloiddepositionJong-Chan Park
Seoul National University College of MedicineKeum Sim Jung
QuantaMatrix Inc.Jiyeong Kim
QuantaMatrix Inc.Ji Sung Jang
QuantaMatrix Inc.Sunghoon Kwon
QuantaMatrix inc.Min Soo Byun
Seoul National University Bundang HospitalDahyun Yi
Seoul National University HospitalGihwan Byeon
Seoul National University HospitalGijung Jung
Seoul National University HospitalYu Kyeong Kim
Seoul National University Seoul Metropolitan Government Boramae Medical CenterDong Young Lee
Seoul National University HospitalSun-Ho Han
Seoul National University College of MedicineInhee Mook-Jung ( [email protected] )
Seoul National University College of Medicine
Research
Keywords: Alzheimer’s disease, Pittsburgh compound B, cerebral amyloid deposition, blood-basedbiomarker, QPLEXTM Alz plus assay

Page 2/18
Posted Date: September 28th, 2020
DOI: https://doi.org/10.21203/rs.3.rs-37991/v2
License: This work is licensed under a Creative Commons Attribution 4.0 International License. Read Full License
Version of Record: A version of this preprint was published at Alzheimer's Research and Therapy onJanuary 6th, 2021. See the published version at https://doi.org/10.1186/s13195-020-00751-x.
Page 3/18
AbstractBackground: Alzheimer's disease (AD) is an irreversible neurodegenerative disease characterized by thehallmark �nding of cerebral amyloid deposition. Many researchers have tried to predict the existence ofcerebral amyloid deposition by using easily accessible blood plasma samples, but the effectiveness ofsuch strategies remains controversial.
Methods: We developed a new multiplex kit, the QPLEXTM Alz plus assay kit, which uses proteomics-based blood biomarkers to prescreen for cerebral amyloid deposition. A total of 300 participants whounderwent Pittsburgh compound B (PiB)-positron emission tomography (PET) which allows imaging ofcerebral amyloid deposition were included in this study. We compared the levels of QPLEXTM biomarkersbetween patients who were classi�ed as PiB-negative or PiB-positive, regardless of their cognitivefunction. Logistic regression analysis followed by receiver operating characteristic (ROC) curve analysiswas performed. The kit accuracy was tested using a randomized sample selection method.
Results: The results obtained using our assay kit reached 89.1% area under curve (AUC) with 80.0%sensitivity and 83.0% speci�city. Further validation of the QPLEXTM Alz plus assay kit using a randomizedsample selection method showed an average accuracy of 81.5%.
Conclusions: Our QPLEXTM Alz plus assay kit offers a highly effective way to predict cerebral amyloiddeposition through a convenient blood test, and should enable easy prediction of AD in daily life.
BackgroundAlzheimer’s disease (AD) is a neurological disease accompanied by the pathological features of beta-amyloid (A ) plaques and neuro�brillary tangles. AD is the most prevalent dementia and has a muchearlier pathological progress than the onset of clinical symptoms; thus, many research efforts havesought to discover bio-�uidic biomarkers in the blood or cerebral spinal �uid (CSF) that can be used forearly detection of the disease. Although direct brain-imaging methods using A -speci�c positron emissiontomography (PET) ligands have been developed, such as Pittsburgh compound B (PiB) and �orbetapir(1), PET is not an easily accessible method because of its high cost and radiation exposure. Especially inthe early stages of the disease, when pathological hallmarks exist in the brain but no clinical symptom isseen, patients would be unlikely to undergo a brain PET scan (2, 3). This a major obstacle when earlydiagnosis relies on PET. Many researchers and clinicians have noted that the use of e�cient, early, andeasily accessible diagnostic methods could prevent or delay the progress of AD pathology.
In a previous study, we revealed a novel blood-based biomarker panel for cerebral amyloid depositionconsisting of galectin-3 binding protein (LGALS3BP), A 1-40, angiotensin converting enzyme (ACE), andperiostin (POSTN) (3, 4). When assessed by logistic regression analysis and receiver operatingcharacteristic (ROC) curve analysis, our biomarker panel exhibited a high area under the curve (AUC) andgood sensitivity and speci�city when blood levels were quanti�ed through commercialized enzyme-linked

Page 4/18
immunosorbent assay (ELISA) kits or the xMAP technology. For clinical practice and large populationscreening, a readily accessible diagnostic kit capable of measuring these biomarkers could criticallyenable the quick prediction of cerebral amyloid deposition.
Here, we introduce a bioanalytical platform for AD diagnosis. We developed a new AD diagnostic kit, theQPLEXTM Alz plus assay kit, which predicts cerebral amyloid deposition using our previously developedblood biomarkers, LGALS3BP, Aβ1-40, ACE, and POSTN. In our prior work, these biomarkers wereindependently quanti�ed using individual ELISA kits. Here, we combined them and developed a newmultiplex kit with high e�ciency and accuracy. We tested the diagnostic e�cacy and accuracy of the kitfor 300 cognitively diverse individuals who underwent PiB-PET scans. The new QPLEXTM Alz plus assaykit demonstrated high-level performance and may be applicable in the clinic for the early diagnosis ofAD.
MethodsParticipants
In total, 300 participants were included in this study. They consisted of 149 cognitively normal individuals(CN group), 87 patients with amnestic mild cognitive impairment (MCI group), and 64 patients withclinically diagnosed AD dementia (DEM group). These individuals were recruited as part of the KoreanBrain Aging Study for the Early diagnosis and prediction of Alzheimer’s disease (KBASE). All participantswere given appropriate clinical and neuropsychological assessments according to the KBASEassessment protocol. The details of participant recruitment, clinical diagnosis criteria, and furtherinformation were described in our previous report (5).
Ethical approval
All participants and (where applicable) their legal representatives read and con�rmed the informedconsent documents. This project was approved by the Seoul National University Hospital InstitutionalReview Board.
PiB-PET
All participants underwent PiB-PET scans using a 3.0T PET-MR scanner (Siemens Healthineers, Erlangen,Germany). Brie�y, each individual was injected intravenously with 555 MBq of [11C] PiB (450-610MBq)PET tracer, which enabled visualization of cerebral amyloid deposition. The degree of amyloidaccumulation was calculated by the standardized uptake value ratio (SUVR), which was determined bythe automatic anatomic algorithm. The four regions of interest (ROIs) were the lateral temporal, lateralparietal, posterior cingulate-precuneus, and frontal regions. If the SUVR value was 1.4 or higher for atleast one of the four ROIs, the individual was de�ned as PiB-positive (PiB+). The details of the imagingprotocols were described in our previous paper (5).
Page 5/18
Blood sampling
All fasting blood samples were collected at 9:00 AM. Whole-blood samples were gathered in K2 EDTAtubes (BD Vacutainer Systems, Plymouth, UK) and centrifuged at 700 g for 5 min at room temperature(RT). The supernatants were collected, the centrifugation step was repeated, and the tubes were stored at−80°C.
QPLEXTM Alz plus assay (QPLEXTM)
Our QPLEXTM kit utilized the Quantamatrix’s multiplex diagnostics platform (QMAP; Quantamatrix Inc.,Seoul, Republic of Korea) with microdisk technology to perform multiplex analyses in a single well (6).This suspension bead array system uses graphically coded beads to expose antigens to the 3Denvironment. Brie�y, human plasma samples were diluted in the diluent buffer and incubated with thecoded beads and biotin-conjugated detection antibodies in the provided black 96-well plate for 90minutes at RT on a shaking incubator at 1000 rpm. The immunocomplexes, including the coded beads,were washed twice with washing buffer on a Biotek-510 magnetic wash station (Biotek, VT, USA). Fiftymicroliters of diluted R-phycoerythrin-conjugated streptavidin were added to each well, and the plate wasincubated for 15 minutes at RT on the same shaking incubator. After three washes, theimmunocomplexes were resuspended in 100 μl of washing buffer by tapping. Collectedimmunocomplexes were analyzed automatically by the QMAPTM system; approximately 30 beads wereused for the calculation of each biomarker concentration.
In-house ELISA (IH-ELISA)
ELISA plates were coated with capture antibodies diluted to a working concentration in Dulbecco’smodi�ed phosphate-buffered saline solution (DPBS; Invitrogen, Carlsbad, CA, USA) and incubated at RT.The remaining binding sites were blocked with 1 mg/ml bovine serum albumin (Sigma Aldrich, St. Louis,MO, USA) in DPBS. Human plasma samples were diluted in the same buffer that was provided with theQPLEXTM kit and incubated with the primary antibodies immobilized in the wells. Streptavidin-conjugatedhorseradish peroxidase was added to the wells, and the plate was incubated again for 20 minutes. Theimmunocomplexes were detected with a chromogenic substrate solution and the reaction was terminatedby the addition of 0.5 M HCl. Absorption was read at 450 nm using an ELISA plate reader (Biotek,Winooski, VT, USA).
Statistical analyses
All statistical analyses were performed using the Medcalc 17.2 software (Ostend, Belgium) and GraphPadPrism 8 (San Diego, CA, USA). Comparison analyses between two variables were conducted byindependent t-test or analysis of covariance (ANCOVA) with correction for age and sex. Correlationanalyses were performed using the Pearson’s correlation analysis method. To calculate the discriminatorypower, sensitivity, and speci�city for the biomarker panels, logistic regression, followed by receiver
Page 6/18
operating characteristic (ROC) curve analysis was performed. The basic formula of our algorithm used inour analyses was as follows:
(pi, predicted probabilities; an, coe�cient values, e.g. a1 = 0.008 for Aβ40, a2 = -0.0066 for ACE, a3 =-0.0007 for LGALS3BP, a4 = 0.1322 for POSTN; C, constant, e.g. C = 1.2478; Each biomarker level of thesamples was multiplied by coe�cient values and pi was calculated)
The formulas, coe�cients, and constants could be optimized since there were appropriate outliers andvarious logistic regression models. Multicollinearities were checked using the values of variance in�ationfactors (VIF). Finally, the accuracy of each model was calculated using a randomized sample selectionmethod. Randomizing analysis was used to create random groups with even distributions of age (thevariable for case identi�cation was ‘age’). In other words, each group had almost same average age(Group 1, average 71.8, range 56 to 86; Group 2, 72.3, range 61 to 84; Group 3, 70.1, range 55 to 85; …etc.). After the randomized sample selection and regrouping, each group was validated by the logisticregression models to calculate the accuracy of each biomarker panel. The average accuracy wascalculated as shown in Fig. 3. All statistical outliers were excluded from the cohort according to theGrubb’s double-side outlier test (p < 0.05).
ResultsCategorization of participants
This study included 300 participants (age, 55-88 years): 130 PiB− CN (CN−), 36 PiB+ CN (CN+), 31 PiB−MCI (MCI−), 56 PiB+ MCI (MCI+), 6 PiB− DEM (DEM−), and 58 PiB+ DEM (DEM+). The demographicdetails are described in Table 1.
Comparison between IH-ELISA and QPLEXTM kit performance
We previously reported a novel blood-based biomarker panel identi�ed from the results of a proteomicanalysis (4). In the prior work, we used four different commercially available ELISA kits to assess theindividual biomarkers. Here, we developed a new multiplex strategy. Before seeking to validate ourQPLEXTM kit using the main cohort samples, we compared the results obtained for these markersbetween IH-ELISA and our kit. All four biomarkers included in the kit showed a high correlation coe�cientand low intra or inter coe�cient of variation (CV, < 10%) (Fig. 1A). This indicated that our QPLEXTM kitcould show high performance similar to that achieved with IH-ELISA of the individual biomarkers.
Validation of QPLEXTM biomarkers for predicting PiB-PET positivity
Page 7/18
We divided all participants into two groups, PiB− (CN−, MCI−, and DEM−) and PiB+ (CN+, MCI+, DEM+),and compared the levels of QPLEXTM biomarkers (Fig. 1B). Similar to the results reported in our previouspaper (4), all QPLEXTM biomarkers showed signi�cant differences between the PiB− and PiB+ groups(Fig. 1C). There were several intra-subgroup differences (parentheses indicate markers that showedsigni�cant between-subgroup differences): CN− vs. CN+ (Aβ1-40, LGALS3BP, and POSTN), MCI− vs. MCI+(Aβ1-40, LGALS3BP, and POSTN) and DEM− vs. DEM+ (LGALS3BP) (Fig. 1C). Moreover, the QPLEXTM
biomarkers exhibited correlations with the degree of cerebral amyloid deposition (PiB-PET standardizeduptake value ratio; PiB-PET SUVR) with the exception of ACE, which exhibited a non-signi�cant tendency(p = 0.2) (Fig. 1D). ACE did, however, show a signi�cant association with PiB-PET SUVR in the multipleregression analysis (Table 2). Finally, we found that all of the QPLEXTM biomarkers were associated witheach other (Fig. 1E, left and middle). The low variance in�ation factors (VIF < 2) revealed that there wasno problem with multicollinearity (Fig. 1E, right). Together, these results con�rmed that our QPLEXTM
biomarkers appear appropriate for use in prescreening patients for cerebral amyloid deposition.
Discrimination power of QPLEXTM biomarkers
To verify the usefulness of the QPLEXTM biomarkers, we performed logistic regression analysis andreceiver operating characteristics (ROC) curve analysis (Fig. 2A, Table 3). We generated three regressionmodels (ApoE variable only, model I; QPLEXTM markers only, model II; ApoE + QPLEXTM markers, model III)with correction for age and sex (Fig. 2B). Model II showed a higher AUC (0.834 with 76.6% sensitivity and73.5% speci�city) than model I (0.783 with 76.7% sensitivity and 68.0% speci�city), and model III showeda signi�cantly higher AUC (0.891 with 80.0% sensitivity and 83.0% speci�city) than models I and II (Fig.2C, 2D). Furthermore, we performed the same analyses for CN or MCI group separately, it also showed theconsistent pattern of high performances (For CN group, 0.786 AUC for Model I, 0.896 AUC for Model II,0.907 AUC for Model III; For MCI group, 0.781 AUC for Model I, 0.791 AUC for Model II, 0.900 AUC forModel III) and similar tendency of AUC with Fig. 2C (Model I < Model II < Model III) (Supplementary Fig. 1).The results indicated that the model combining our QPLEXTM biomarkers and ApoE genotypiccharacteristics yielded a signi�cantly higher AUC value than that generated using only ApoEcharacteristics.
Accuracy test using randomized sample selection
Next, we tested the accuracy of our regression models by using randomized sample validation (Fig. 3A).First, we randomly divided the participants into 10 groups with even distributions of ages 55 to 88(variable for case identi�cation = ‘age’; for more detail on the randomized sample selection process, seeFig. 3B). We con�rmed that the average ages were almost the same (data not shown). We then testedhow many samples could be predicted accurately by models I, II, and III, in each group (e.g., for model I,correct predictions were obtained for 25 out of 30, 83%, for Group 1; 21 out of 30, 70%, for Group 2; 19 outof 30, 63%, for Group 3; … 19 out of 30, 63%, for Group 10). Finally, we calculated average accuracies formodels I, II, and III. Consistent with the results for the whole-population ROC curve analysis (Fig. 2C, 2D),
Page 8/18
model III showed the highest average accuracy (81.5%) compared to model I (71.5%) and model II(75.0%). The results obtained from our QPLEXTM prediction models suggest that this new method caneffectively discriminate PiB-PET-positive, and thus is ready to be put to practical use for the generalpublic.
DiscussionBlood-based biomarkers for AD theoretically should enable early-stage disease detection or screeningwhile also offering increased accessibility, greater convenience, and reduced cost (7). Various bloodbiomarkers for AD diagnosis have been published in the last few decades (7-10), but few have provenuseful for the development of diagnostic kits. Indeed, no blood-based biomarker kit for diagnosing ADhas yet been launched in the market. This likely re�ects the technical di�culty of composing a multiplexkit with detection accuracies that are consistently equivalent to those of the individual ELISA experimentsused during the discovery and validation stages of a given biomarker.
ELISA has long been used for biomarker detection in diverse body �uids, including blood and CSF (11,12); however, it requires intensive labor and typically shows intra- and inter-assay variability (13). Thenewly developed xMAP technology exhibits high sensitivity and low variability thanks to its use of pre-made calibrators (14). Comparative analysis showed that the detection values of ELISA and xMAP weregenerally (but not always) correlated, the results differed in terms of the absolute concentrationsidenti�ed (15-17). Comparison of the CSF Aβ42, t-tau, and p-tau181 levels detected by ELISA and xMAP(14, 18) showed that the levels were well correlated, supporting the idea that multiplex xMAP is anappropriate and potentially clinically relevant platform for biomarker detection (14).
Quantamatrix’s multiplexed diagnostics platform (QMAPTM) uses a proprietary microdisk technology toperform 1000 reactions in a single well. The microdisk is formed of a polymer that comprises a largeamount of 50-micron particles applied by a semiconductor process, and can easily be formed intovarious shapes (6). The microdisk is further coated with silica to improve its physical and chemicalstability, and to facilitate various chemical surface treatments (19). This microdisk-based multiplextechnology enhanced the detection ability of our QPLEXTM Alz plus assay kit for rare or volume-limitedsamples. Moreover, the graphical code used by our group is more stable than the �uorescence codewhich can be affected by light and heat. This high-level stability and the magnetic character make theQMAPTM system suitable for application in automated analysis equipment. The QMAPTM-based kitmeasures blood biomarkers by sandwich ELISA using capture antibodies and biotinylated detectionantibodies. The system can perform up to 1000 reactions in a single well with a suspension bead arraysystem that enables 3D incubation and provides fast results within 2 hours (excluding samplepreparation).
Our QPLEXTM Alz plus assay kit was developed using QMAPTM technology and four blood biomarkers wepreviously identi�ed as being useful for distinguishing cerebral amyloid deposition (3, 4): LGALS3BP, ACE,POSTN, and Aβ1-40. We validated the diagnostic accuracy of this diagnostic kit in a clinical trial with a
Page 9/18
300-person validation cohort of individuals who were imaged using PiB-PET. In the previous discoverystage, we utilized ELISA to detect LGALS3BP, ACE, and POSTN, and used xMAP to detect Aβ1-40; with thisstrategy, we used the developed kit to validate that there were differences in the blood levels of the fourbiomarkers between the PiB− and PiB+ groups (3, 4). In the QPLEXTM Alz plus assay kit, wesimultaneously detected LGALS3BP, ACE, POSTN, and Aβ1-40 using QMAP technology, which helpedmaximize the detection e�ciency for low-abundance blood proteins.
When assessed with the new assay kit, the blood levels of LGALS3BP, POSTN, and Aβ1-40 showed fairlydistinct and signi�cant differences between the PiB− and PiB+ groups and signi�cant correlations withcerebral amyloid deposition (SUVR); the level of ACE tended to be decreased and was correlated withcerebral amyloid deposition in the PiB+ group (Fig. 2B, C). Notably, previous studies showed that aspectsof ACE other than the blood concentration appear to be tightly related to AD pathology. For example,decreased ACE activity was found in CSF from AD patients (20) and the ACE D allele was associated withan increased risk for AD in two distinct population cohorts (21). This increased risk for AD wasindependent of ApoE4 genotype, and was equal to or greater in magnitude than the ApoE4 genotype-related risk of AD (21). Here, we found that the blood ACE level was also signi�cantly correlated with thelevels of two other AD-related blood biomarkers: LGALS3BP and Aβ1-40 (Fig. 2D). Given this, we proposethat ACE is associated with AD pathology and that the blood concentration and activity level of ACEshould be investigated further in a larger population cohort. We screened the medication history of allparticipants and con�rmed that there was no current use of an ACE-related medication, such as an ACEinhibitor. As ACE inhibitors are known to in�uence the activity or concentration of ACE in the blood (22),future studies are warranted to examine the possible effects associated with taking ACE inhibitors.
The ApoE genotype currently stands as the strongest known risk factor for late-onset AD (23), but thisgenetic risk factor does not re�ect the risk an aging individual acquires related to the accumulation of lifepattern- and environment-related factors. The biomarkers assessed in the QPLEXTM Alz plus assay kitrepresent a real-time risk assessment for the initiation and progression of AD pathology. Therefore, thecombined screening of ApoE and blood biomarkers can be used to improve disease diagnosis. Indeed,the results of our ROC curve analysis revealed that the AUC value of the QPLEXTM Alz plus assay kit washigher than that of ApoE alone (0.834 and 0.783, respectively), and that their use in combinationsigni�cantly increased the AUC value (up to 0.891) compared to that obtained with either strategy alone(Fig. 3). This result was supported by another validation study in which we used randomized subgroups(see Fig. 3). Again, we found that the accuracy of the QPLEXTM Alz plus assay kit (75.0%) was better thanthat of the ApoE genotype (71.5%), and the highest accuracy was achieved using both together (81.5%).The results suggest that this new assay kit can effectively discriminate PiB-PET-positivity.
LimitationsAlthough the e�cacy of our assay kit was further validated by the randomized selection methods (Fig.3), our new QPLEX Alz plus assay kit should be screened on other independent cohorts with the goal ofputting it to practical use. Going forward, we plan to apply the QPLEX Alz plus assay kit to a larger patient
Page 10/18
population and potentially seek to identify a better algorithm. Also, we need to test the QPLEX Alz plusassay kit in other neurodegenerative diseases in our future study to validate the selective effects ofdiscriminating PiB-PET-positivity regardless of disease types.
ConclusionsOur new developed QPLEXTM Alz plus assay kit showed high performance and the possibility of clinicalapplication for the early diagnosis of AD.
DeclarationsEthics approval and consent to participate
This project was approved by the Institutional Review Board (IRB) of the Seoul National UniversityHospital, South Korea, and the subjects of their legal representatives gave their written informed consent.
Consent for publication
Not applicable.
Availability of data and materials
Not applicable.
Competing interests
The authors declare that they have no competing interests.
Funding
This work was supported by grants from the National Research Foundation (NRF) of Korea(NRF2019R1I1A1A01063525 to S-H.Han), from the Korea Health Technology R&D Project through KoreaHealth Industry Development Institute (KHIDI), funded by the Ministry of Health & Welfare, Republic ofKorea (HI18C0630 and HI19C1132 to I. Mook-Jung), from the NRF (2018R1A5A2025964 to I. Mook-Jung,2014M3C7A1046042 to D.Y.Lee), and from KHIDI (HI18C0630 & HI19C0149 to D.Y.Lee).
Author contributions
J-C.P, S-H.H, and I.M-J conceptualized this study. J-C.P, K.S.J, J.K, J.S.J, and S.K carried out experiments.M.S.B, D.Y, G.B, and G.J obtained blood samples from the subjects and collected the cognitive and PiB-PET data. PiB-PET scan data were obtained, collected, and analyzed by Y.K.K, M.S.B, and D.Y. J-C.Panalyzed statistics. J-C.P organized all �gures and tables. D.Y.L provided the resources. J-C.P, S-H.H, andI.M-J wrote the original draft. D.Y.L and I.M-J reviewed and edited the manuscript. All authors read andapproved the �nal manuscript.

Page 11/18
Acknowledgments
The authors thank the patients, staffs of hospitals, and volunteers for the participation in this project.
AbbreviationsAD: Alzheimer’s disease; A : beta-amyloid; CSF: cerebral spinal �uid; PET: positron emission tomography;PiB: Pittsburgh compound B; LGALS3BP: galectin-3 binding protein; ACE: angiotensin converting enzyme;POSTN: periostin; ROC: receiver operating characteristics; AUC: area under curve; PV, predictive value;ELISA: enzyme-linked immunosorbent assay; CN: cognitively normal; MCI: mild cognitive impairment;DEM: clinically diagnosed AD dementia; KBASE: Korean Brain Aging Study for the Early diagnosis andprediction of Alzheimer’s disease; SUVR: standardized uptake value ratio; ROI: region of interest; QMAP:Quantamatrix’s multiplex diagnostics platform; ANCOVA: analysis of covariance; VIF: variance in�ationfactors; ApoE: Apolipoprotein E
References1. Uzuegbunam BC, Librizzi D, Hooshyar Youse� B. PET Radiopharmaceuticals for Alzheimer's Disease
and Parkinson's Disease Diagnosis, the Current and Future Landscape. Molecules. 2020;25(4).
2. Armstrong RA. beta-amyloid (Abeta) deposition in cognitively normal brain, dementia with Lewybodies, and Alzheimer's disease: a study using principal components analysis. Folia Neuropathol.2012;50(2):130-9.
3. Park JC, Han SH, Cho HJ, Byun MS, Yi D, Choe YM, et al. Chemically treated plasma Abeta is apotential blood-based biomarker for screening cerebral amyloid deposition. Alzheimers Res Ther.2017;9(1):20.
4. Park JC, Han SH, Lee H, Jeong H, Byun MS, Bae J, et al. Prognostic plasma protein panel for Abetadeposition in the brain in Alzheimer's disease. Prog Neurobiol. 2019;183:101690.
5. Byun MS, Yi D, Lee JH, Choe YM, Sohn BK, Lee JY, et al. Korean Brain Aging Study for the EarlyDiagnosis and Prediction of Alzheimer's Disease: Methodology and Baseline Sample Characteristics.Psychiatry Investig. 2017;14(6):851-63.
�. Chung SE, Park W, Park H, Yu K, Park N, Kwon S. Opto�uidic maskless lithography system for real-time synthesis of photopolymerized microstructures in micro�uidic channels. Appl Phys Lett.2007;91(4).
7. Hampel H, O'Bryant SE, Molinuevo JL, Zetterberg H, Masters CL, Lista S, et al. Blood-basedbiomarkers for Alzheimer disease: mapping the road to the clinic. Nat Rev Neurol. 2018;14(11):639-52.
�. Han SH, Park JC, Mook-Jung I. Amyloid beta-interacting partners in Alzheimer's disease: Fromaccomplices to possible therapeutic targets. Prog Neurobiol. 2016;137:17-38.
Page 12/18
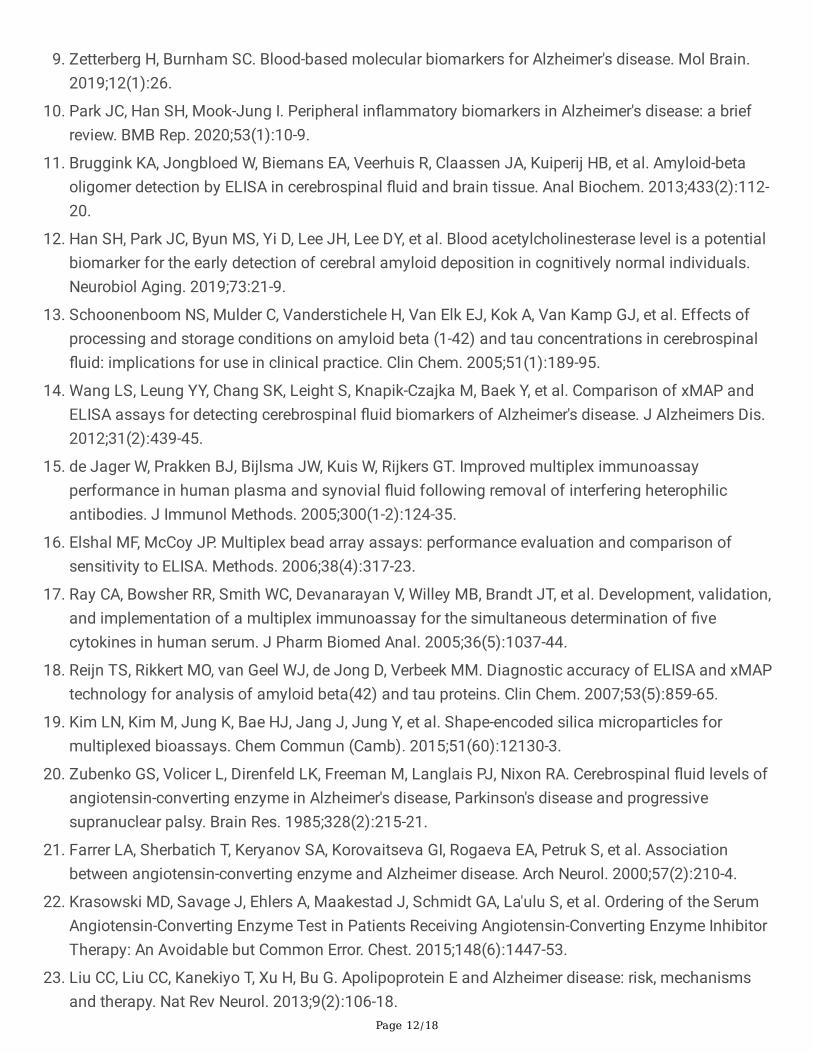
9. Zetterberg H, Burnham SC. Blood-based molecular biomarkers for Alzheimer's disease. Mol Brain.2019;12(1):26.
10. Park JC, Han SH, Mook-Jung I. Peripheral in�ammatory biomarkers in Alzheimer's disease: a briefreview. BMB Rep. 2020;53(1):10-9.
11. Bruggink KA, Jongbloed W, Biemans EA, Veerhuis R, Claassen JA, Kuiperij HB, et al. Amyloid-betaoligomer detection by ELISA in cerebrospinal �uid and brain tissue. Anal Biochem. 2013;433(2):112-20.
12. Han SH, Park JC, Byun MS, Yi D, Lee JH, Lee DY, et al. Blood acetylcholinesterase level is a potentialbiomarker for the early detection of cerebral amyloid deposition in cognitively normal individuals.Neurobiol Aging. 2019;73:21-9.
13. Schoonenboom NS, Mulder C, Vanderstichele H, Van Elk EJ, Kok A, Van Kamp GJ, et al. Effects ofprocessing and storage conditions on amyloid beta (1-42) and tau concentrations in cerebrospinal�uid: implications for use in clinical practice. Clin Chem. 2005;51(1):189-95.
14. Wang LS, Leung YY, Chang SK, Leight S, Knapik-Czajka M, Baek Y, et al. Comparison of xMAP andELISA assays for detecting cerebrospinal �uid biomarkers of Alzheimer's disease. J Alzheimers Dis.2012;31(2):439-45.
15. de Jager W, Prakken BJ, Bijlsma JW, Kuis W, Rijkers GT. Improved multiplex immunoassayperformance in human plasma and synovial �uid following removal of interfering heterophilicantibodies. J Immunol Methods. 2005;300(1-2):124-35.
1�. Elshal MF, McCoy JP. Multiplex bead array assays: performance evaluation and comparison ofsensitivity to ELISA. Methods. 2006;38(4):317-23.
17. Ray CA, Bowsher RR, Smith WC, Devanarayan V, Willey MB, Brandt JT, et al. Development, validation,and implementation of a multiplex immunoassay for the simultaneous determination of �vecytokines in human serum. J Pharm Biomed Anal. 2005;36(5):1037-44.
1�. Reijn TS, Rikkert MO, van Geel WJ, de Jong D, Verbeek MM. Diagnostic accuracy of ELISA and xMAPtechnology for analysis of amyloid beta(42) and tau proteins. Clin Chem. 2007;53(5):859-65.
19. Kim LN, Kim M, Jung K, Bae HJ, Jang J, Jung Y, et al. Shape-encoded silica microparticles formultiplexed bioassays. Chem Commun (Camb). 2015;51(60):12130-3.
20. Zubenko GS, Volicer L, Direnfeld LK, Freeman M, Langlais PJ, Nixon RA. Cerebrospinal �uid levels ofangiotensin-converting enzyme in Alzheimer's disease, Parkinson's disease and progressivesupranuclear palsy. Brain Res. 1985;328(2):215-21.
21. Farrer LA, Sherbatich T, Keryanov SA, Korovaitseva GI, Rogaeva EA, Petruk S, et al. Associationbetween angiotensin-converting enzyme and Alzheimer disease. Arch Neurol. 2000;57(2):210-4.
22. Krasowski MD, Savage J, Ehlers A, Maakestad J, Schmidt GA, La'ulu S, et al. Ordering of the SerumAngiotensin-Converting Enzyme Test in Patients Receiving Angiotensin-Converting Enzyme InhibitorTherapy: An Avoidable but Common Error. Chest. 2015;148(6):1447-53.
23. Liu CC, Liu CC, Kanekiyo T, Xu H, Bu G. Apolipoprotein E and Alzheimer disease: risk, mechanismsand therapy. Nat Rev Neurol. 2013;9(2):106-18.

Page 13/18
TablesTable 1. Demographic data of the participants (N = 300)
Characteristics (n) CN−(113)
CN+(36)
MCI−(31)
MCI+(56)
DEM−(6)
DEM+ (58) P-value
Gender, M/F 46/67 20/16 10/21 17/39 2/4 18/40 > 0.1†
Age, years, mean± SEM
67.32 ±0.8
74.47 ±1.0
73.58 ±0.1
73.23 ±0.9
75.66 ±4.3
72.28 ±1.0
<0.001*
Education, mean ±SEM
11.39 ±0.5
12.08 ±0.8
9.2 ±0.8
10.16 ±0.6
6.00 ±1.7
9.67 ± 0.7 <0.01*
MMSE, mean ±SEM
26.96 ±0.2
27.16 ±0.4
22.93 ±0.6
21.73 ±0.4
18.17 ±3.0
16.59 ±0.5
<0.001*
MMSE z, mean ±SEM
0.29 ±0.1
0.44 ±0.1
-0.91 ±0.2
-1.54 ±0.2
-2.08 ±0.2
-3.23 ± 0.2 <0.001*
CDR (n) 0 (113) 0 (36) 0.5 (31) 0.5 (56) 0.5 (2), 1(4)
0.5 (17), 1(41)
<0.001†
ApoE4 status,ε4+/N
20/113 12/36 2/31 33/56 0/6 40/58 <0.001†
PiB (SUVR), mean± SEM
1.10 ±0.01
1.62 ±0.05
1.13 ±0.01
1.92 ±0.04
1.10 ±0.02
2.10 ±0.05
<0.001*
- CN, cognitively normal; MCI, mild cognitive impairment; DEM, clinically dementia; PiB, Pittsburghcompound B; − or +, PiB positivity; SEM, Standard Error of Mean; n, number of participants; MMSE, Mini-Mental State Examination; MMSE z score, a revised value of the MMSE score with consideration for age,gender, and education level; CDR, Clinical Dementia Rating; ApoE, Apolipoprotein E; SUVR, standardizeduptake value ratio; N, total number of participants of each group.- *, signi�cance by one-way analysis of variance test (ANOVA); †, signi�cance by chi-squared test.
Table 2. Multiple regression analysis

Page 14/18
QPLEXTM markers
Dependent Y Cerebral amyloid deposition (SUVR)
Sample size 292
Coe�cient of determination R2 0.1925
R2- adjusted 0.1813
Multiple correlation coe�cient 0.4388
Residual standard deviation 0.4401
Ind. variables Coe�cient Std. Error t P rpartial rsemipartial VIF
(Constant) 1.6344
Aβ1-40 0.0009742 0.0004063 2.397 0.0171 0.1401 0.1272 1.065
LGALS3BP -0.00007365 0.00001310 -5.623 <0.0001 -0.3150 0.2983 1.075
ACE -0.0008671 0.0002836 -3.057 0.0024 -0.1776 0.1621 1.342
POSTN 0.01510 0.002555 5.908 <0.0001 0.3293 0.3134 1.332
*Abbreviations: SUVR, standardized uptake value ratio; Ind., independent; VIF, variance in�ation factor;LGALS3BP, galectin-3 binding protein; ACE, angiotensin converting enzyme; POSTN, periostin; ApoE,apolipoprotein E
Table 3. Details for logistic regression analyses and criterion values from the ROC curves
Logistic regression Criterion values
Model n Signi�cance R2 Chi2 Cut-off Sensitivity, %(95% CI)
Speci�city, % (95% CI)
ApoE 300 < 0.0001 0.32 81.9 >0.4067
76.67 (69.1-83.2) 68.00 (59.9-75.4)
QPLEXTM 292 < 0.0001 0.45 120.8 >0.4566
76.55 (68.8-83.2) 73.47 (65.6-80.4)
ApoE +QPLEXTM
292 < 0.0001 0.59 172.5 >0.4214
80.00 (72.6-86.2) 82.99 (75.9-88.7)
*Abbreviation: R2, Nagelkerke R2; Chi2, Chi-squared test; CI, con�dence interval; ROC, receiver operatingcharacteristics
Page 15/18
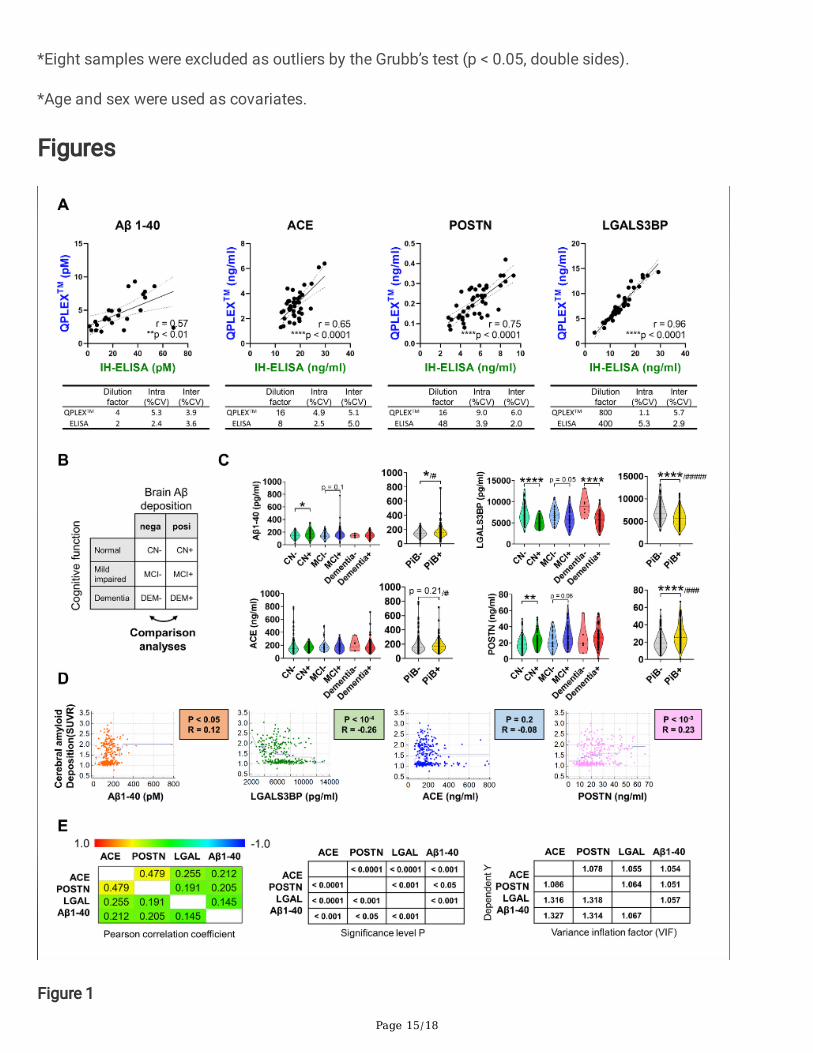
*Eight samples were excluded as outliers by the Grubb’s test (p < 0.05, double sides).
*Age and sex were used as covariates.
Figures
Figure 1
Page 16/18
The levels of QPLEXTM biomarkers and their correlation to cerebral amyloid deposition. (A) Correlationbetween IH-ELISA and QPLEXTM biomarkers and inter- or intra- CV. Signi�cant outliers were excluded bythe Grubb’s test method. (B) Classi�cation of participants. Participants were divided into two group(cerebral amyloid deposition; − or + means PiB− vs. PiB+) or three groups (depending on their cognitivestatus; CN normal, MCI mild cognitive impaired, Dementia). Comparison analyses for PiB− vs. PiB+ wereconducted. (C) The levels of QPLEXTM biomarkers. *p < 0.05, **p < 0.01, independent t-test; #p < 0.10,###p < 0.001, #####p < 0.0001, ANCOVA test with the correction of age, sex, ApoE, and/or MMSE score.(D) Correlation between cerebral amyloid deposition and QPLEXTM biomarkers. (E) Inter-correlationsbetween the markers (Pearson’s correlation coe�cient, p-values, and variance in�ation factor).
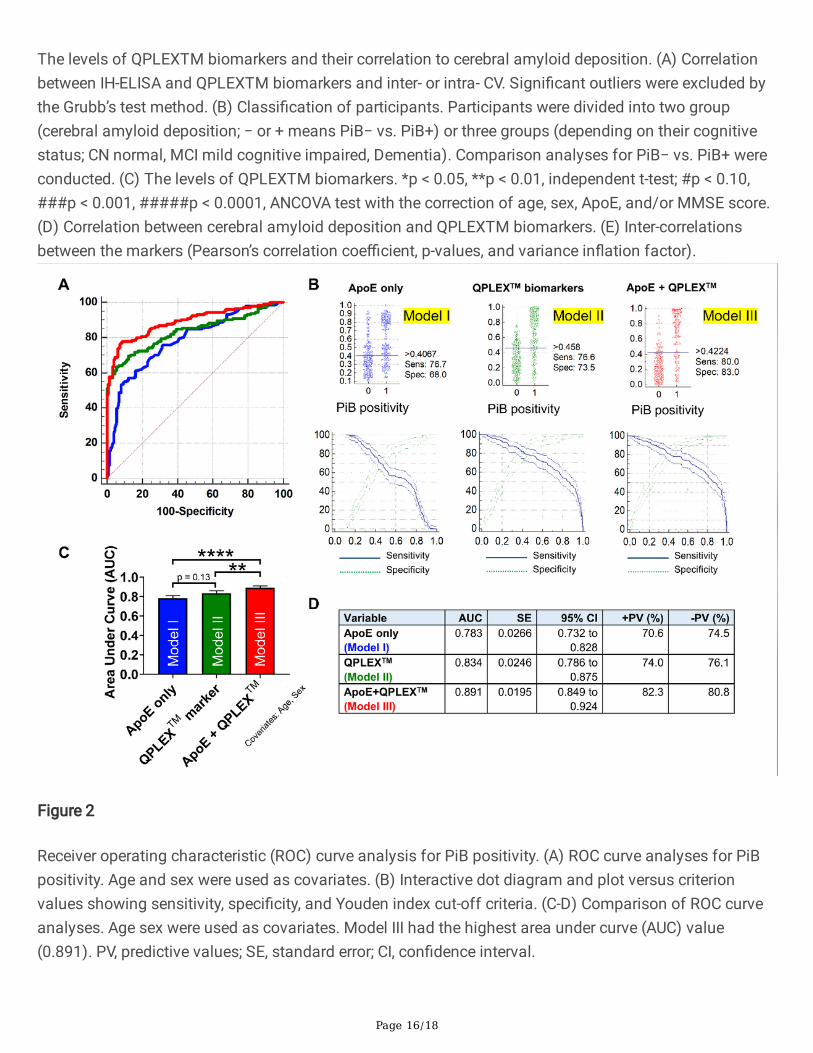
Figure 2
Receiver operating characteristic (ROC) curve analysis for PiB positivity. (A) ROC curve analyses for PiBpositivity. Age and sex were used as covariates. (B) Interactive dot diagram and plot versus criterionvalues showing sensitivity, speci�city, and Youden index cut-off criteria. (C-D) Comparison of ROC curveanalyses. Age sex were used as covariates. Model III had the highest area under curve (AUC) value(0.891). PV, predictive values; SE, standard error; CI, con�dence interval.
Page 17/18
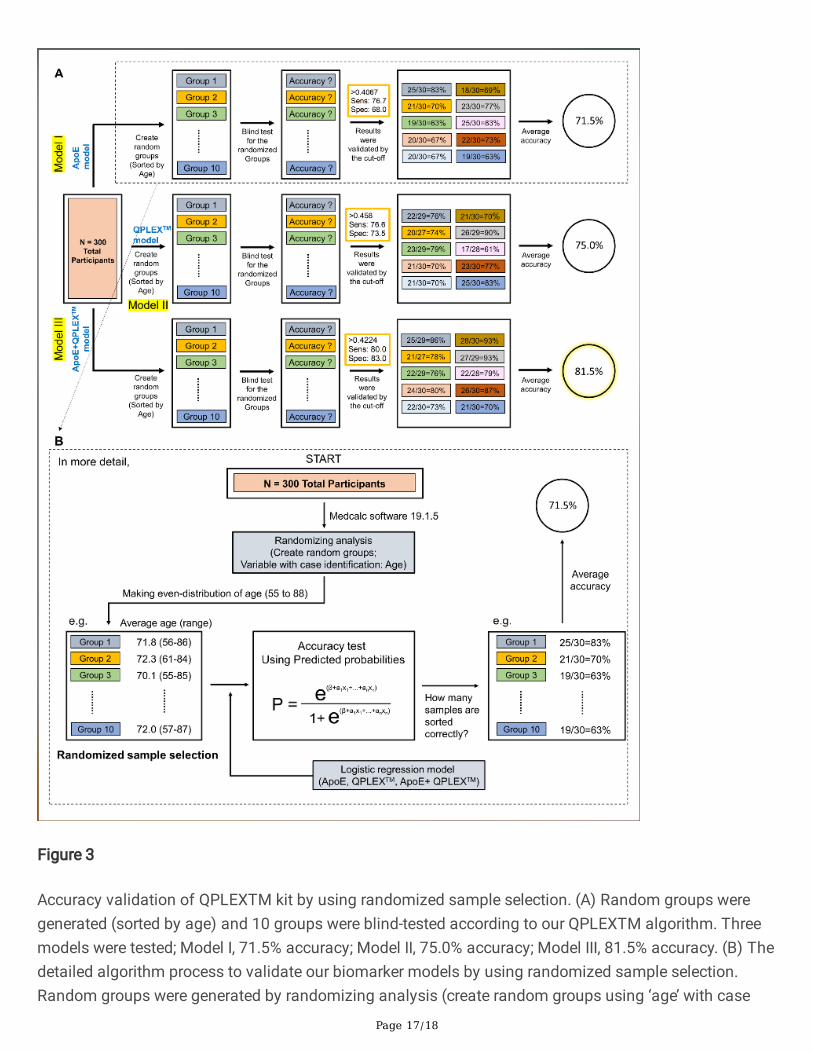
Figure 3
Accuracy validation of QPLEXTM kit by using randomized sample selection. (A) Random groups weregenerated (sorted by age) and 10 groups were blind-tested according to our QPLEXTM algorithm. Threemodels were tested; Model I, 71.5% accuracy; Model II, 75.0% accuracy; Model III, 81.5% accuracy. (B) Thedetailed algorithm process to validate our biomarker models by using randomized sample selection.Random groups were generated by randomizing analysis (create random groups using ‘age’ with case

Page 18/18
identi�cation). Three hundred participants were classi�ed as 10 groups and validated using theirpredicted probabilities (P). Accuracy (correct number of participants/total number of participants, %) ofeach group were calculated and averaged.
Supplementary Files
This is a list of supplementary �les associated with this preprint. Click to download.
RevsuppFigure1.TIF
RevRefFigure1.TIF