novel insights into the metal binding ability of zint
TRANSCRIPT

Novel insights into the metal binding ability of ZinT periplasmic
protein from Escherichia coli and Salmonella enterica
Denise Bellotti,a,b Magdalena Rowińska-Żyrek,b Maurizio Remelli*a
aDepartment of Chemical and Pharmaceutical Sciences, University of Ferrara, Via L.
Borsari 46, 44121, Ferrara, Italy. E-mail: [email protected]
bFaculty of Chemistry, University of Wrocław, F. Joliot-Curie 14, 50-383, Wrocław, Poland
Electronic Supplementary Information (ESI)
Electronic Supplementary Material (ESI) for Dalton Transactions.This journal is © The Royal Society of Chemistry 2020
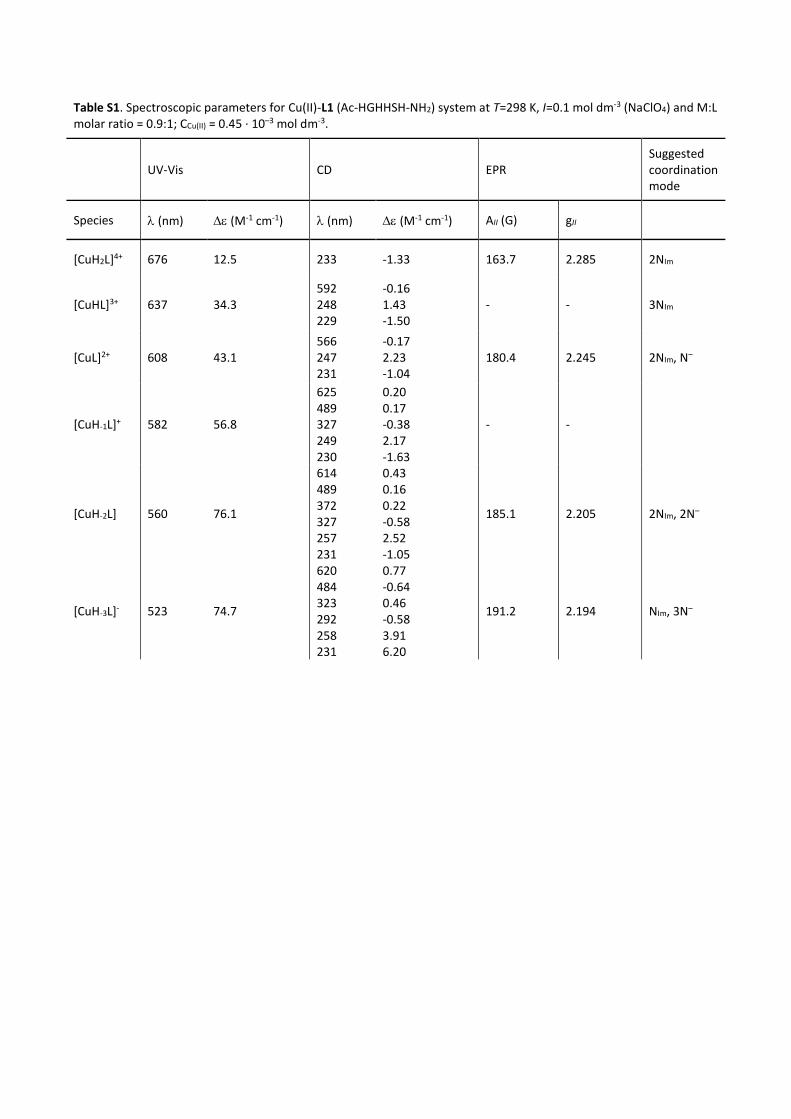
Table S1. Spectroscopic parameters for Cu(II)-L1 (Ac-HGHHSH-NH2) system at T=298 K, I=0.1 mol dm-3 (NaClO4) and M:L molar ratio = 0.9:1; CCu(II) = 0.45 ∙ 10–3 mol dm-3.
UV-Vis CD EPR Suggested coordination mode
Species (nm) (M-1 cm-1) (nm) (M-1 cm-1) AII (G) gII
[CuH2L]4+ 676 12.5 233 -1.33 163.7 2.285 2NIm
[CuHL]3+ 637 34.3 592 248 229
-0.16 1.43 -1.50
- - 3NIm
[CuL]2+ 608 43.1 566 247 231
-0.17 2.23 -1.04
180.4 2.245 2NIm, N–
[CuH-1L]+ 582 56.8
625 489 327 249 230
0.20 0.17 -0.38 2.17 -1.63
- -
[CuH-2L] 560 76.1
614 489 372 327 257 231
0.43 0.16 0.22 -0.58 2.52 -1.05
185.1 2.205 2NIm, 2N–
[CuH-3L]- 523 74.7
620 484 323 292 258 231
0.77 -0.64 0.46 -0.58 3.91 6.20
191.2 2.194 NIm, 3N–
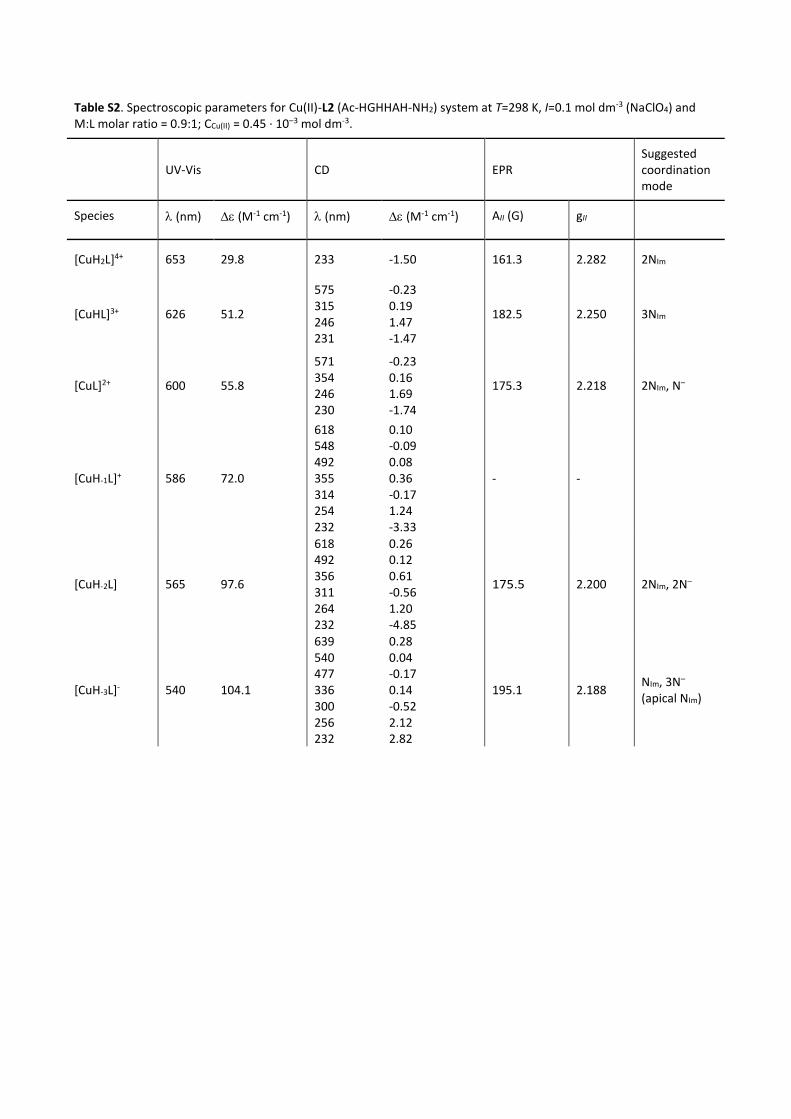
Table S2. Spectroscopic parameters for Cu(II)-L2 (Ac-HGHHAH-NH2) system at T=298 K, I=0.1 mol dm-3 (NaClO4) and M:L molar ratio = 0.9:1; CCu(II) = 0.45 ∙ 10–3 mol dm-3.
UV-Vis CD EPR Suggested coordination mode
Species (nm) (M-1 cm-1) (nm) (M-1 cm-1) AII (G) gII
[CuH2L]4+ 653 29.8 233 -1.50 161.3 2.282 2NIm
[CuHL]3+ 626 51.2
575 315 246 231
-0.23 0.19 1.47 -1.47
182.5 2.250 3NIm
[CuL]2+ 600 55.8
571 354 246 230
-0.23 0.16 1.69 -1.74
175.3 2.218 2NIm, N–
[CuH-1L]+ 586 72.0
618 548 492 355 314 254 232
0.10 -0.09 0.08 0.36 -0.17 1.24 -3.33
- -
[CuH-2L] 565 97.6
618 492 356 311 264 232
0.26 0.12 0.61 -0.56 1.20 -4.85
175.5 2.200 2NIm, 2N–
[CuH-3L]- 540 104.1
639 540 477 336 300 256 232
0.28 0.04 -0.17 0.14 -0.52 2.12 2.82
195.1 2.188 NIm, 3N– (apical NIm)
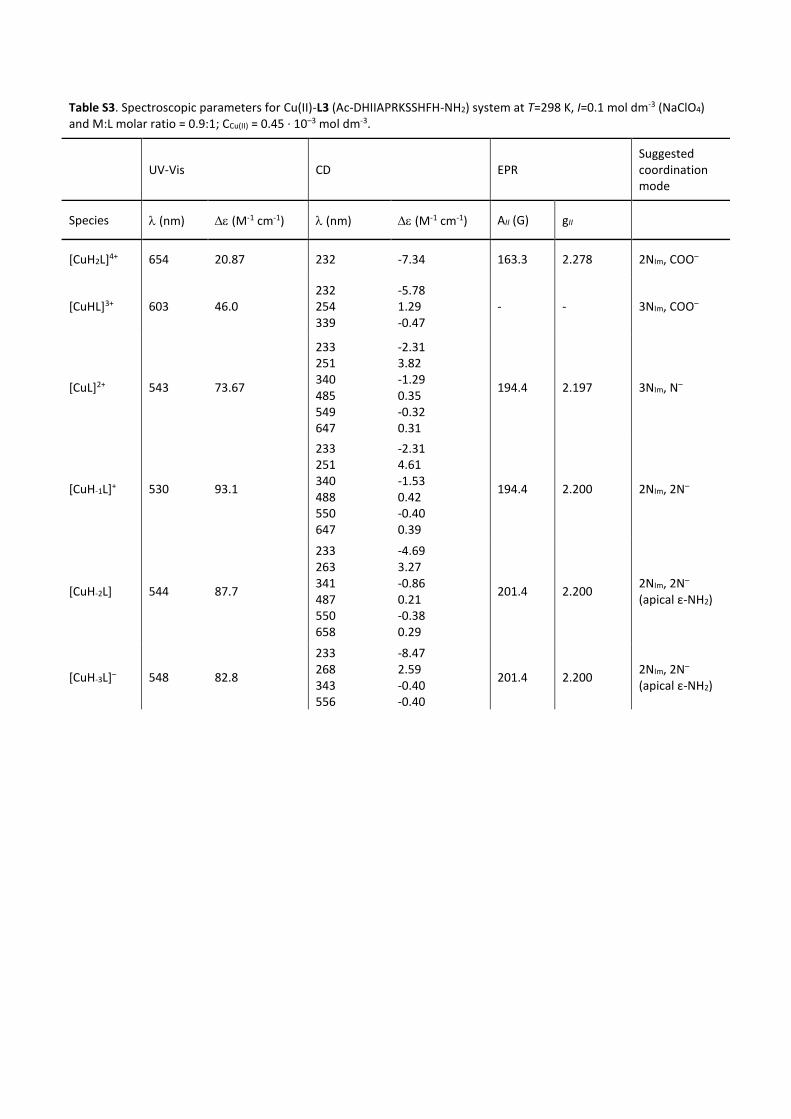
Table S3. Spectroscopic parameters for Cu(II)-L3 (Ac-DHIIAPRKSSHFH-NH2) system at T=298 K, I=0.1 mol dm-3 (NaClO4) and M:L molar ratio = 0.9:1; CCu(II) = 0.45 ∙ 10–3 mol dm-3.
UV-Vis CD EPR Suggested coordination mode
Species (nm) (M-1 cm-1) (nm) (M-1 cm-1) AII (G) gII
[CuH2L]4+ 654 20.87 232 -7.34 163.3 2.278 2NIm, COO–
[CuHL]3+ 603 46.0 232 254 339
-5.78 1.29 -0.47
- - 3NIm, COO–
[CuL]2+ 543 73.67
233 251 340 485 549 647
-2.31 3.82 -1.29 0.35 -0.32 0.31
194.4 2.197 3NIm, N–
[CuH-1L]+ 530 93.1
233 251 340 488 550 647
-2.31 4.61 -1.53 0.42 -0.40 0.39
194.4 2.200 2NIm, 2N–
[CuH-2L] 544 87.7
233 263 341 487 550 658
-4.69 3.27 -0.86 0.21 -0.38 0.29
201.4 2.200 2NIm, 2N–
(apical ε-NH2)
[CuH-3L]– 548 82.8
233 268 343 556
-8.47 2.59 -0.40 -0.40
201.4 2.200 2NIm, 2N–
(apical ε-NH2)
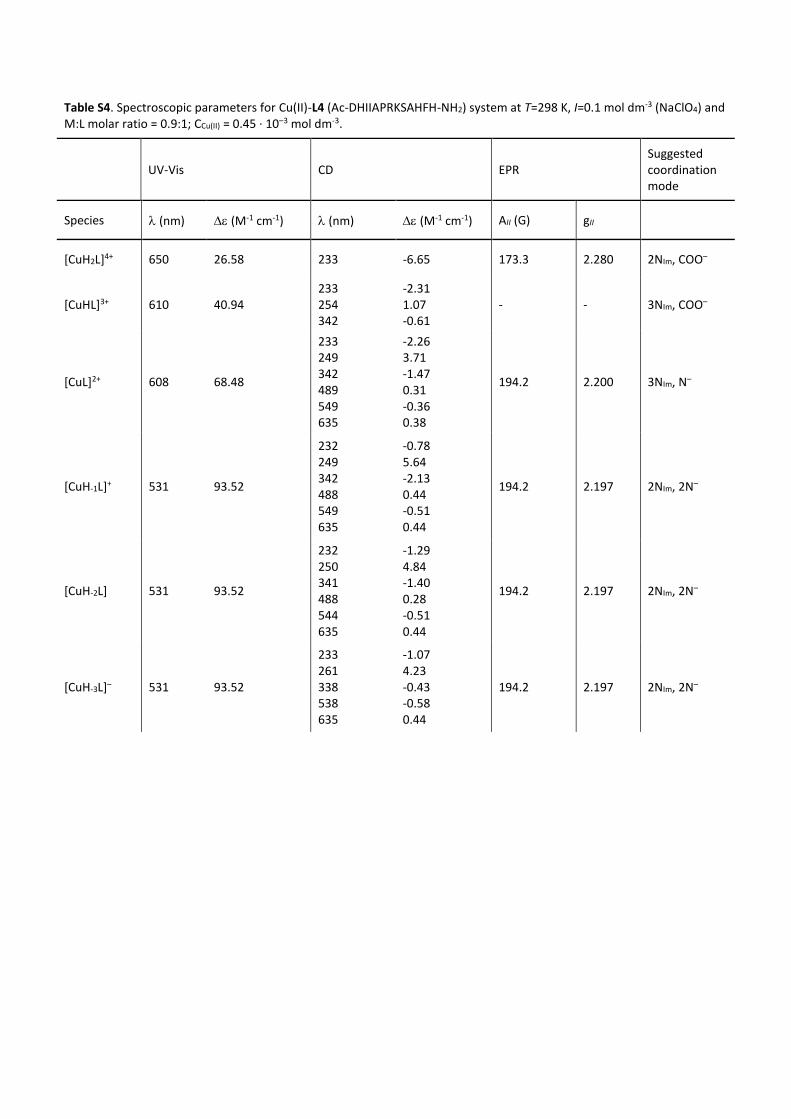
Table S4. Spectroscopic parameters for Cu(II)-L4 (Ac-DHIIAPRKSAHFH-NH2) system at T=298 K, I=0.1 mol dm-3 (NaClO4) and M:L molar ratio = 0.9:1; CCu(II) = 0.45 ∙ 10–3 mol dm-3.
UV-Vis CD EPR Suggested coordination mode
Species (nm) (M-1 cm-1) (nm) (M-1 cm-1) AII (G) gII
[CuH2L]4+ 650 26.58 233 -6.65 173.3 2.280 2NIm, COO–
[CuHL]3+ 610 40.94 233 254 342
-2.31 1.07 -0.61
- - 3NIm, COO–
[CuL]2+ 608 68.48
233 249 342 489 549 635
-2.26 3.71 -1.47 0.31 -0.36 0.38
194.2 2.200 3NIm, N–
[CuH-1L]+ 531 93.52
232 249 342 488 549 635
-0.78 5.64 -2.13 0.44 -0.51 0.44
194.2 2.197 2NIm, 2N–
[CuH-2L] 531 93.52
232 250 341 488 544 635
-1.29 4.84 -1.40 0.28 -0.51 0.44
194.2 2.197 2NIm, 2N–
[CuH-3L]– 531 93.52
233 261 338 538 635
-1.07 4.23 -0.43 -0.58 0.44
194.2 2.197 2NIm, 2N–
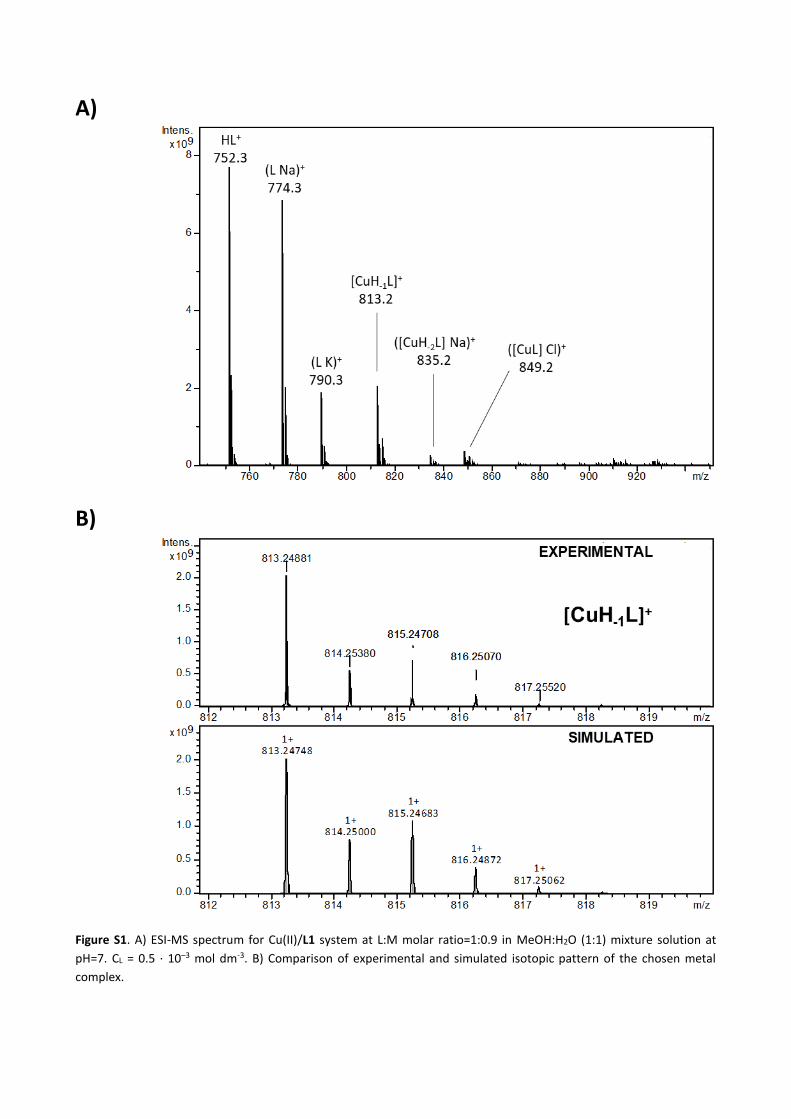
A)
B)
Figure S1. A) ESI-MS spectrum for Cu(II)/L1 system at L:M molar ratio=1:0.9 in MeOH:H2O (1:1) mixture solution at
pH=7. CL = 0.5 ∙ 10–3 mol dm-3. B) Comparison of experimental and simulated isotopic pattern of the chosen metal
complex.
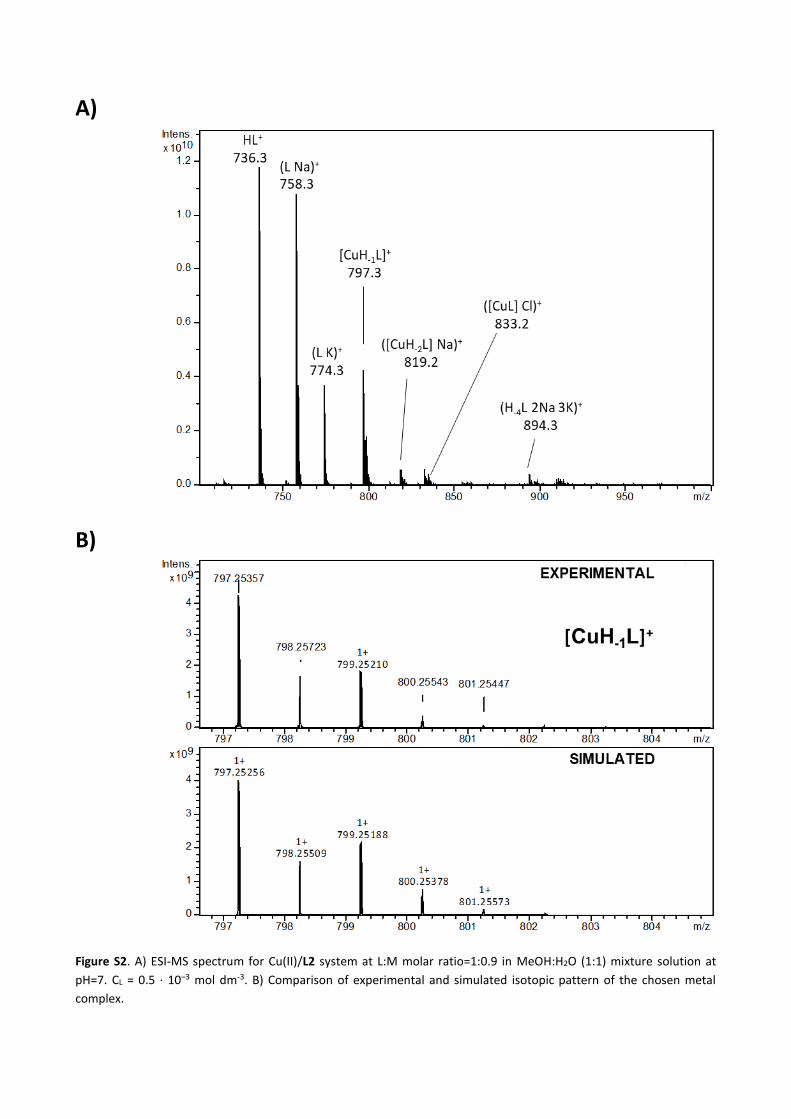
A)
B)
Figure S2. A) ESI-MS spectrum for Cu(II)/L2 system at L:M molar ratio=1:0.9 in MeOH:H2O (1:1) mixture solution at
pH=7. CL = 0.5 ∙ 10–3 mol dm-3. B) Comparison of experimental and simulated isotopic pattern of the chosen metal
complex.
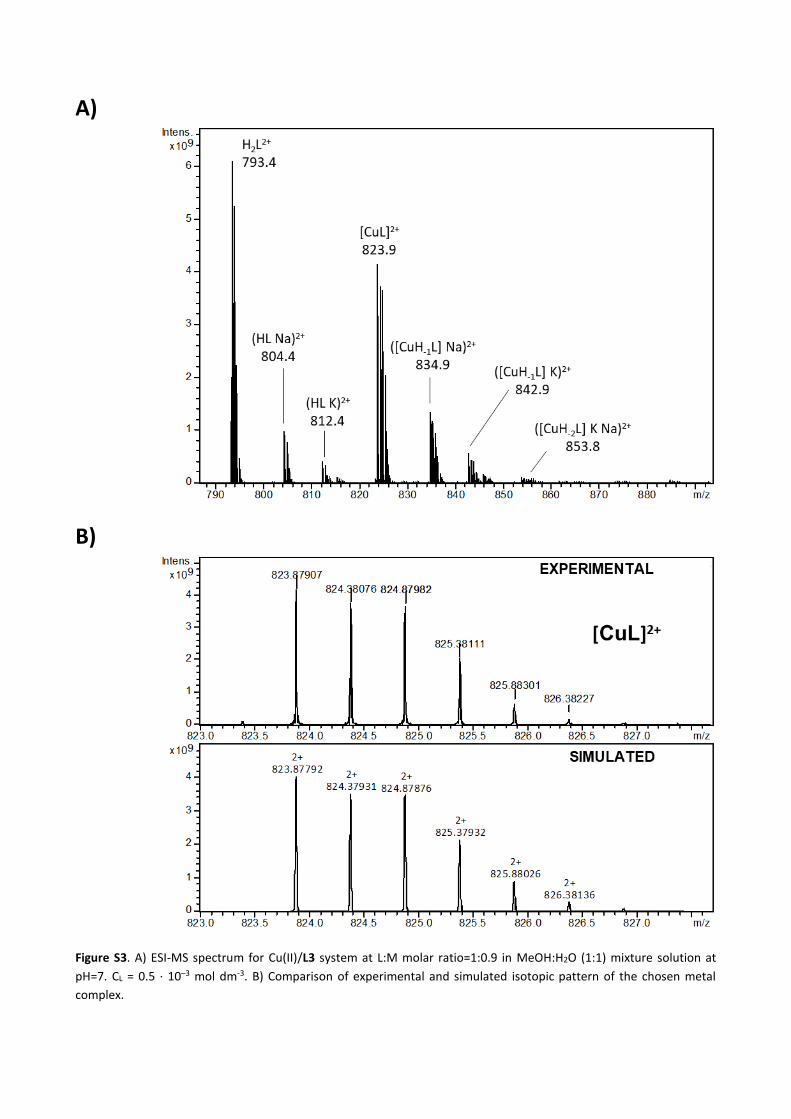
A)
B)
Figure S3. A) ESI-MS spectrum for Cu(II)/L3 system at L:M molar ratio=1:0.9 in MeOH:H2O (1:1) mixture solution at
pH=7. CL = 0.5 ∙ 10–3 mol dm-3. B) Comparison of experimental and simulated isotopic pattern of the chosen metal
complex.

A)
B)
Figure S4. A) ESI-MS spectrum for Cu(II)/L4 system at L:M molar ratio=1:0.9 in MeOH:H2O (1:1) mixture solution at
pH=7. CL = 0.5 ∙ 10–3 mol dm-3. B) Comparison of experimental and simulated isotopic pattern of the chosen metal
complex.
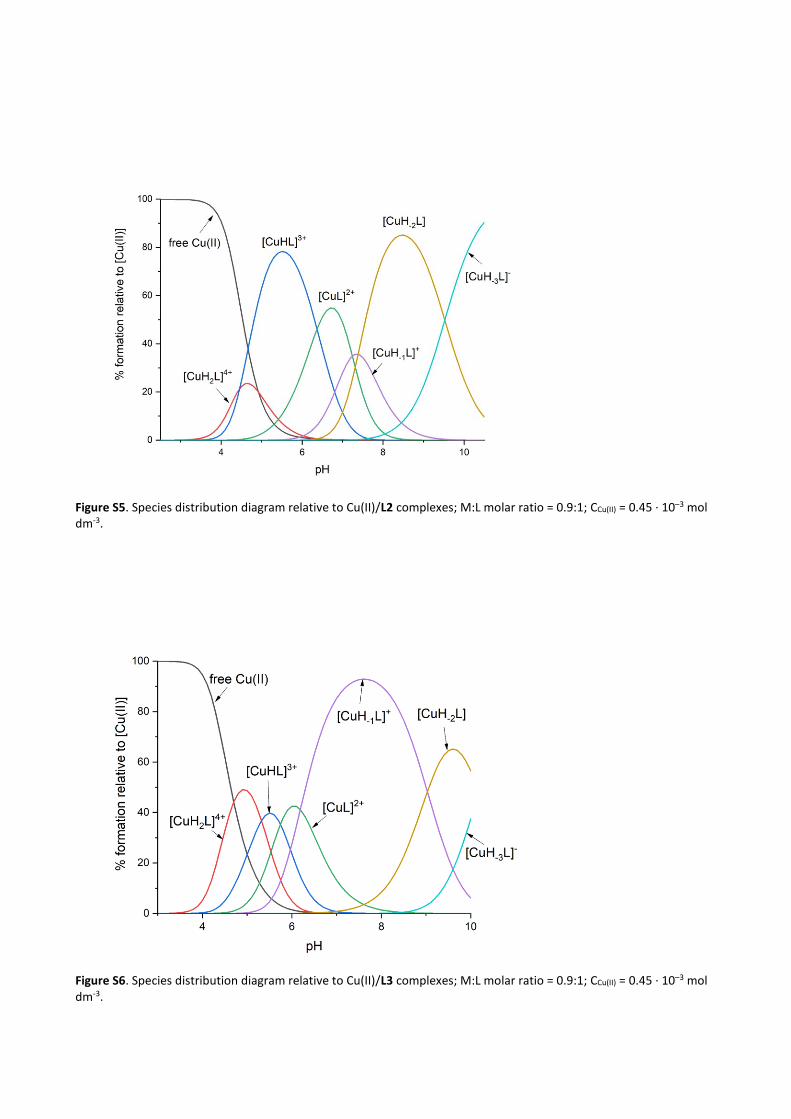
Figure S5. Species distribution diagram relative to Cu(II)/L2 complexes; M:L molar ratio = 0.9:1; CCu(II) = 0.45 ∙ 10–3 mol dm-3.
Figure S6. Species distribution diagram relative to Cu(II)/L3 complexes; M:L molar ratio = 0.9:1; CCu(II) = 0.45 ∙ 10–3 mol dm-3.
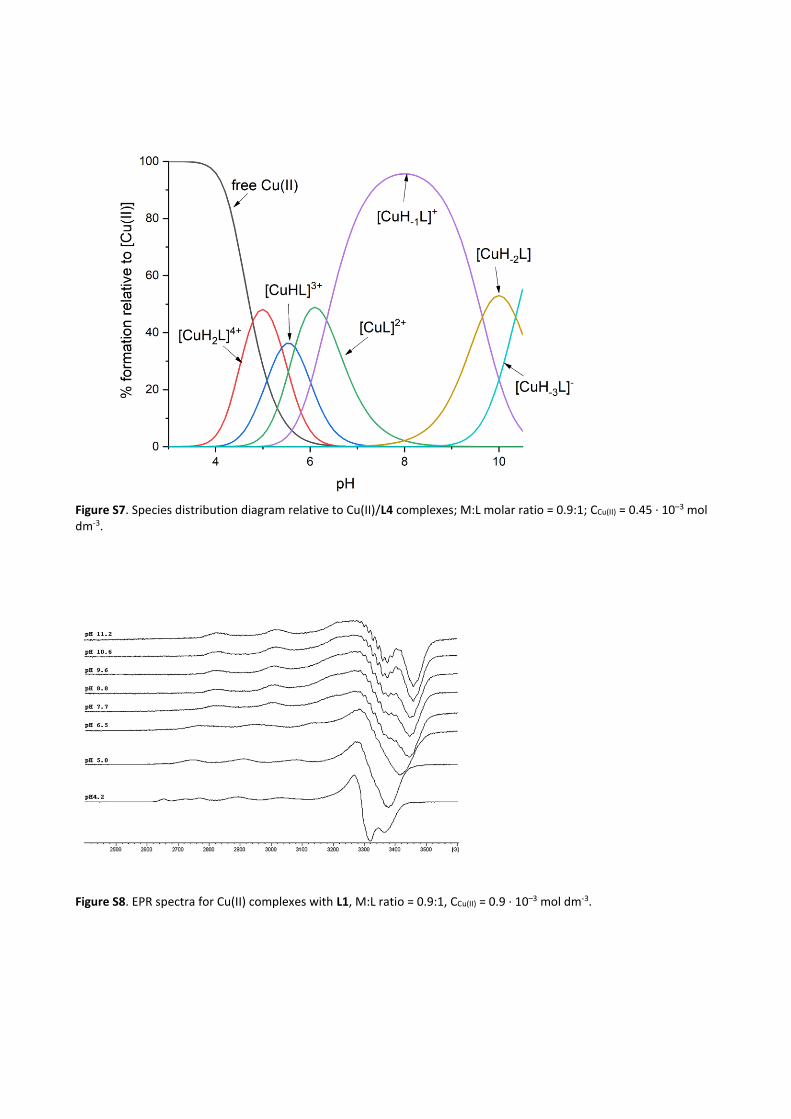
Figure S7. Species distribution diagram relative to Cu(II)/L4 complexes; M:L molar ratio = 0.9:1; CCu(II) = 0.45 ∙ 10–3 mol dm-3.
Figure S8. EPR spectra for Cu(II) complexes with L1, M:L ratio = 0.9:1, CCu(II) = 0.9 ∙ 10–3 mol dm-3.
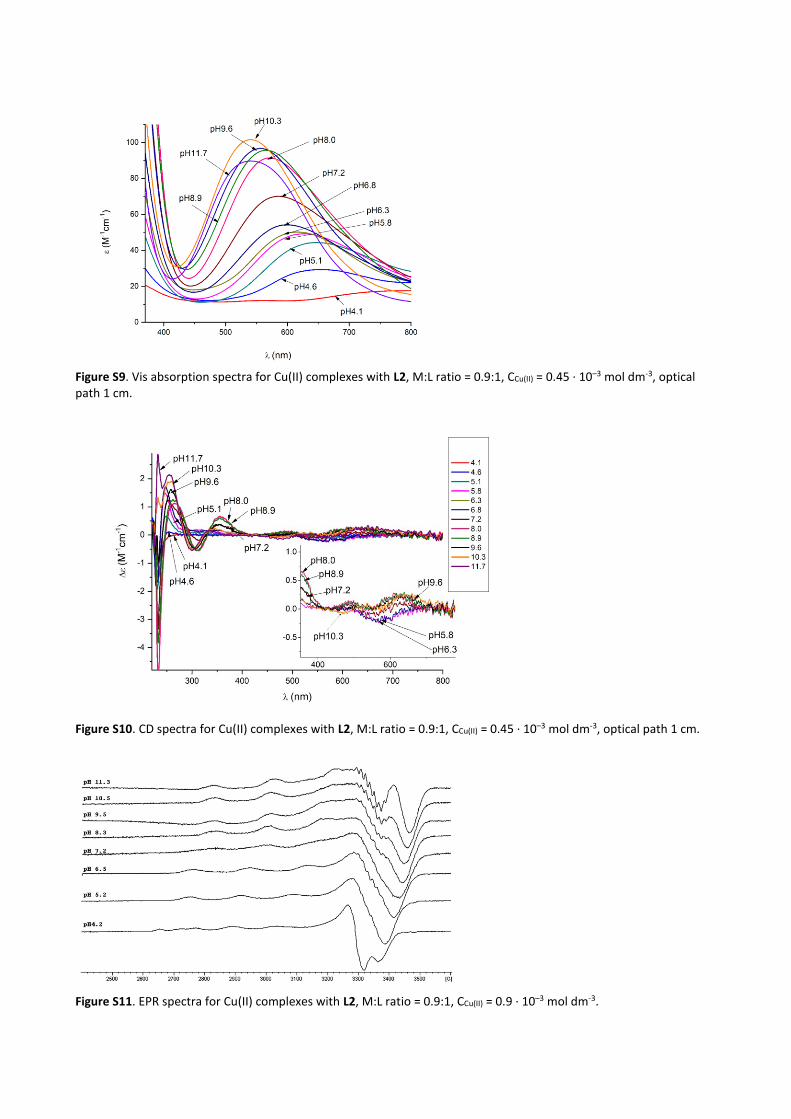
Figure S9. Vis absorption spectra for Cu(II) complexes with L2, M:L ratio = 0.9:1, CCu(II) = 0.45 ∙ 10–3 mol dm-3, optical path 1 cm.
Figure S10. CD spectra for Cu(II) complexes with L2, M:L ratio = 0.9:1, CCu(II) = 0.45 ∙ 10–3 mol dm-3, optical path 1 cm.
Figure S11. EPR spectra for Cu(II) complexes with L2, M:L ratio = 0.9:1, CCu(II) = 0.9 ∙ 10–3 mol dm-3.
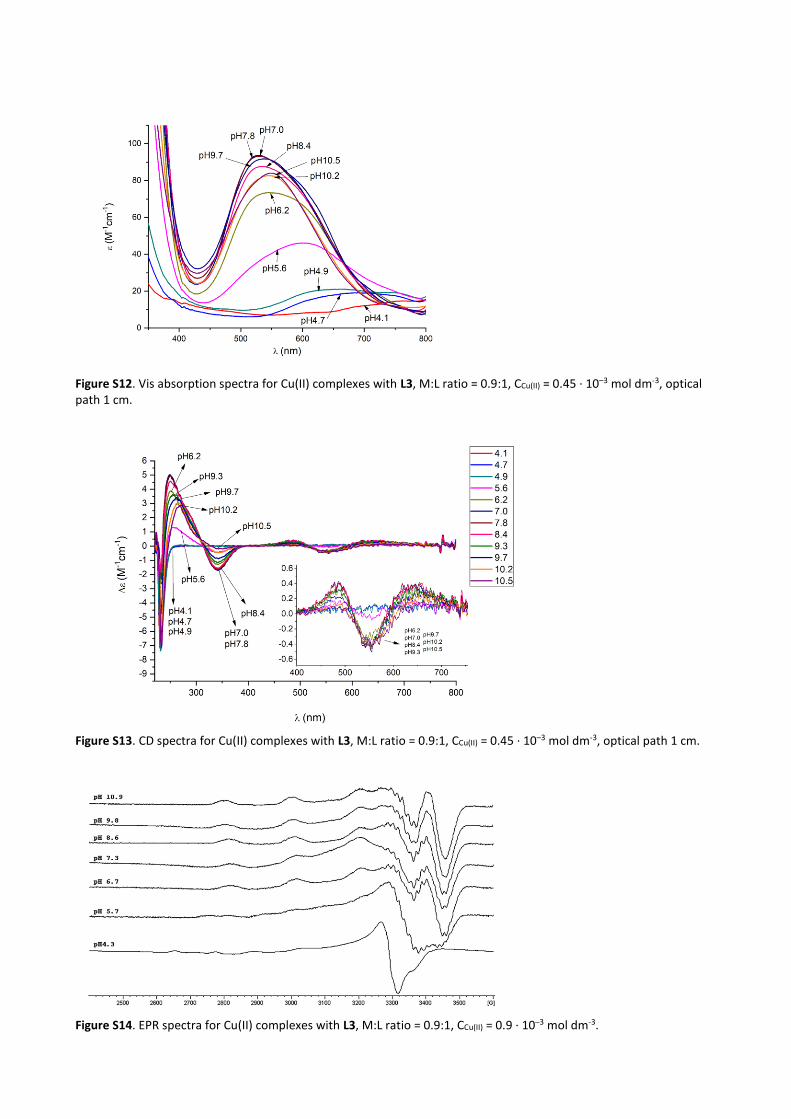
Figure S12. Vis absorption spectra for Cu(II) complexes with L3, M:L ratio = 0.9:1, CCu(II) = 0.45 ∙ 10–3 mol dm-3, optical path 1 cm.
Figure S13. CD spectra for Cu(II) complexes with L3, M:L ratio = 0.9:1, CCu(II) = 0.45 ∙ 10–3 mol dm-3, optical path 1 cm.
Figure S14. EPR spectra for Cu(II) complexes with L3, M:L ratio = 0.9:1, CCu(II) = 0.9 ∙ 10–3 mol dm-3.
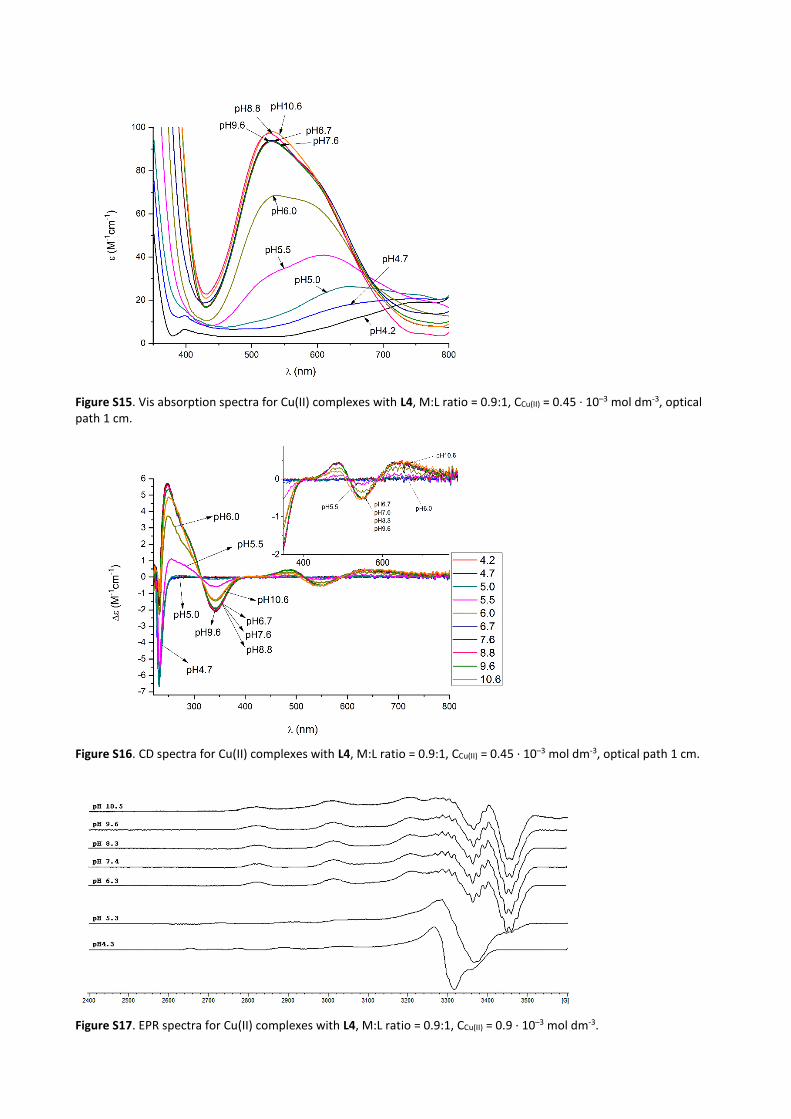
Figure S15. Vis absorption spectra for Cu(II) complexes with L4, M:L ratio = 0.9:1, CCu(II) = 0.45 ∙ 10–3 mol dm-3, optical path 1 cm.
Figure S16. CD spectra for Cu(II) complexes with L4, M:L ratio = 0.9:1, CCu(II) = 0.45 ∙ 10–3 mol dm-3, optical path 1 cm.
Figure S17. EPR spectra for Cu(II) complexes with L4, M:L ratio = 0.9:1, CCu(II) = 0.9 ∙ 10–3 mol dm-3.
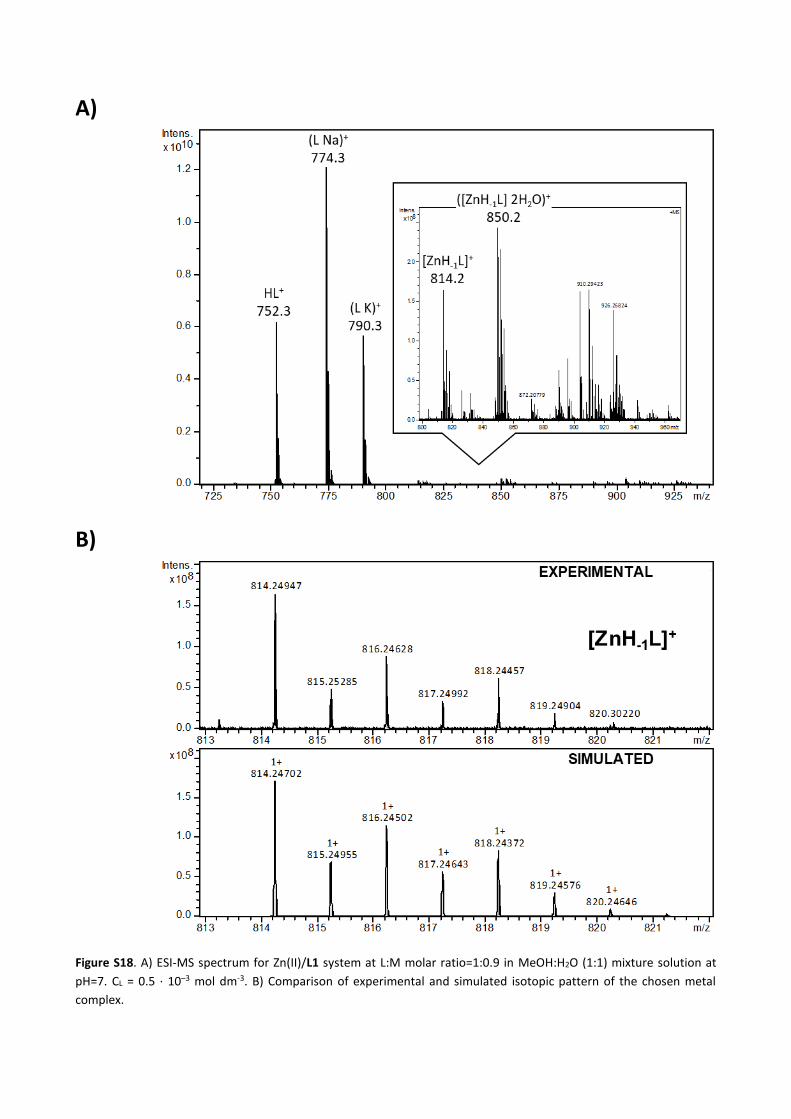
A)
B)
Figure S18. A) ESI-MS spectrum for Zn(II)/L1 system at L:M molar ratio=1:0.9 in MeOH:H2O (1:1) mixture solution at
pH=7. CL = 0.5 ∙ 10–3 mol dm-3. B) Comparison of experimental and simulated isotopic pattern of the chosen metal
complex.

A)
B)
Figure S19. A) ESI-MS spectrum for Zn(II)/L2 system at L:M molar ratio=1:0.9 in MeOH:H2O (1:1) mixture solution at
pH=7. CL = 0.5 ∙ 10–3 mol dm-3. B) Comparison of experimental and simulated isotopic pattern of the chosen metal
complex.
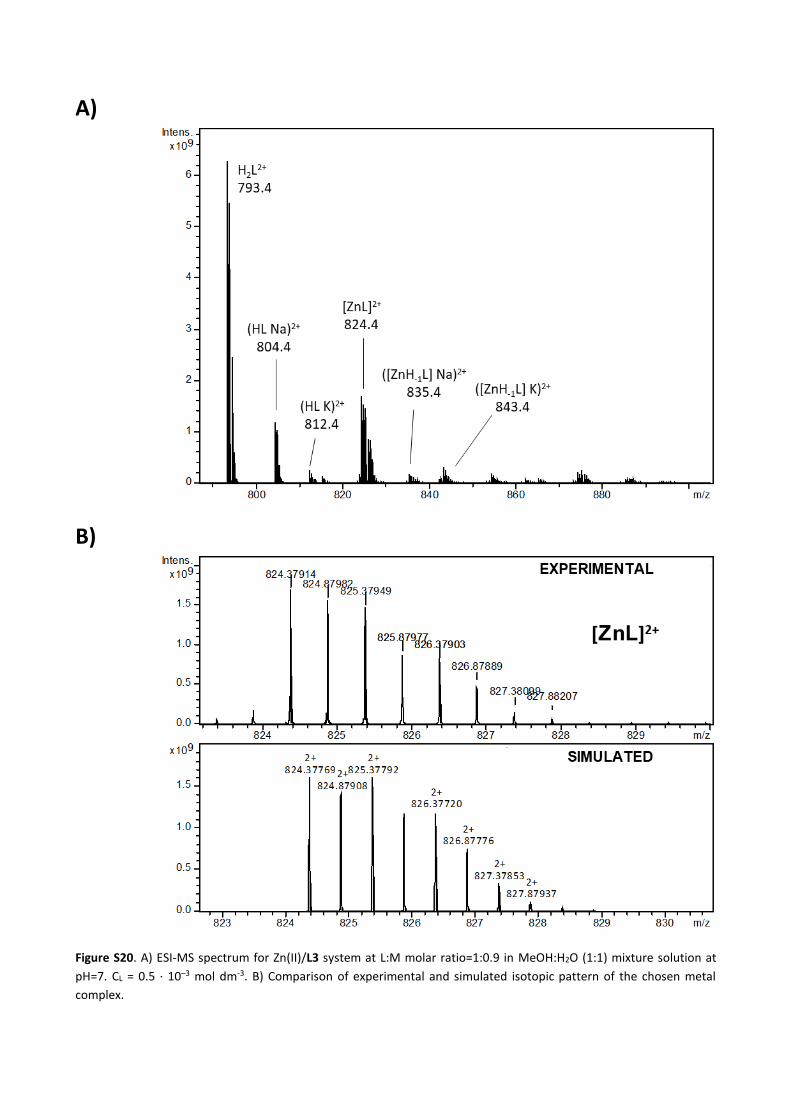
A)
B)
Figure S20. A) ESI-MS spectrum for Zn(II)/L3 system at L:M molar ratio=1:0.9 in MeOH:H2O (1:1) mixture solution at
pH=7. CL = 0.5 ∙ 10–3 mol dm-3. B) Comparison of experimental and simulated isotopic pattern of the chosen metal
complex.

A)
B)
Figure S21. A) ESI-MS spectrum for Zn(II)/L4 system at L:M molar ratio=1:0.9 in MeOH:H2O (1:1) mixture solution at
pH=7. CL = 0.5 ∙ 10–3 mol dm-3. B) Comparison of experimental and simulated isotopic pattern of the chosen metal
complex.

Figure S22. Species distribution diagram relative to Zn(II)/L2 complexes; M:L molar ratio = 0.9:1; CZn(II) = 0.45 ∙ 10–3 mol dm-3.
Figure S23. Species distribution diagram relative to Zn(II)/L3 complexes; M:L molar ratio = 0.9:1; CZn(II) = 0.45 ∙ 10–3 mol dm-3.
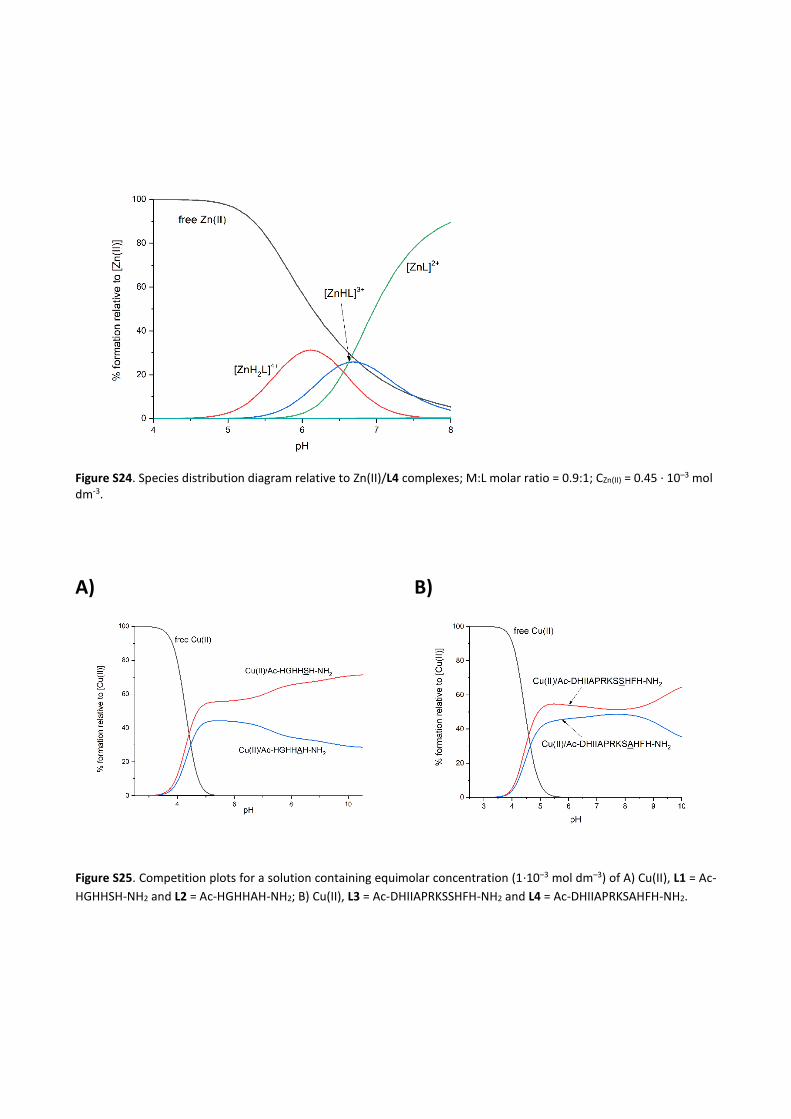
Figure S24. Species distribution diagram relative to Zn(II)/L4 complexes; M:L molar ratio = 0.9:1; CZn(II) = 0.45 ∙ 10–3 mol dm-3.
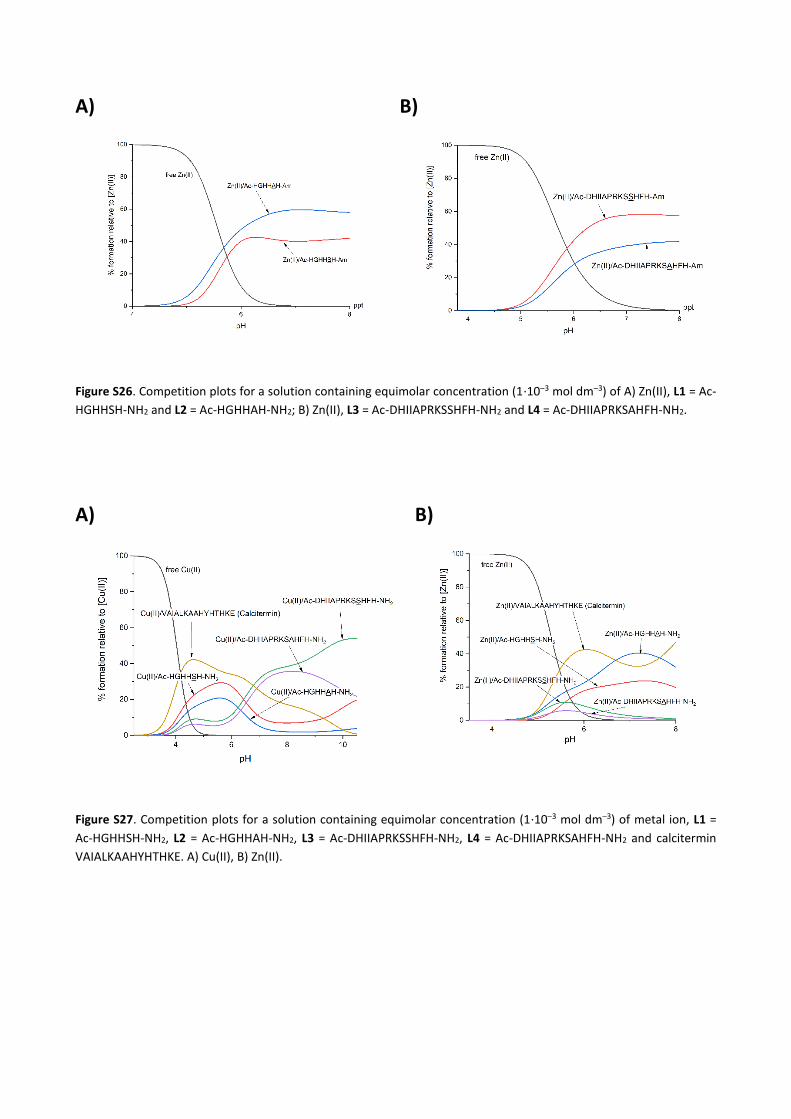
A)
B)
Figure S25. Competition plots for a solution containing equimolar concentration (1∙10–3 mol dm–3) of A) Cu(II), L1 = Ac-
HGHHSH-NH2 and L2 = Ac-HGHHAH-NH2; B) Cu(II), L3 = Ac-DHIIAPRKSSHFH-NH2 and L4 = Ac-DHIIAPRKSAHFH-NH2.
A)
B)
Figure S26. Competition plots for a solution containing equimolar concentration (1∙10–3 mol dm–3) of A) Zn(II), L1 = Ac-
HGHHSH-NH2 and L2 = Ac-HGHHAH-NH2; B) Zn(II), L3 = Ac-DHIIAPRKSSHFH-NH2 and L4 = Ac-DHIIAPRKSAHFH-NH2.
A)
B)
Figure S27. Competition plots for a solution containing equimolar concentration (1∙10–3 mol dm–3) of metal ion, L1 =
Ac-HGHHSH-NH2, L2 = Ac-HGHHAH-NH2, L3 = Ac-DHIIAPRKSSHFH-NH2, L4 = Ac-DHIIAPRKSAHFH-NH2 and calcitermin
VAIALKAAHYHTHKE. A) Cu(II), B) Zn(II).

A)
B)
Figure S28. Competition plots for a solution containing equimolar concentration (1∙10–3 mol dm–3) of metal ion, L1 =
Ac-HGHHSH-NH2, L2 = Ac-HGHHAH-NH2, L3 = Ac-DHIIAPRKSSHFH-NH2, L4 = Ac-DHIIAPRKSAHFH-NH2, E. coli ZnuA
peptide Ac-MKSIHGDDDDHDHAEKSDEDHHHGDFNMHLW-NH2 and E. coli ZnuA peptide Ac-GHFTVNPEIQPGAQRLHE-
NH2. A) Zn(II), B) Cu(II).
A) B) C)
Figure S29. Comparison of near-UV CD spectra of L3 apo-peptide and its Cu(II) and Zn(II) complexes. M:L molar ratio =
0.9:1, CL = 0.1 ∙ 10–3 mol dm-3. Optical path 0.01 cm. A) pH = 4.5; B) pH = 7; C) pH = 9.
A) B) C)
Figure S30. Comparison of near-UV CD spectra of L4 apo-peptide and its Cu(II) and Zn(II) complexes. M:L molar ratio =
0.9:1, CL = 0.1 ∙ 10–3 mol dm-3. Optical path 0.01 cm. A) pH = 4.5; B) pH = 7; C) pH = 9.