novel indirect additive manufacturing for processing
TRANSCRIPT

Novel Indirect Additive Manufacturing for Processing Biomaterials
Shah Fenner Khan Mohamad Khan
This dissertation is submitted for partial fulfilment for the
degree of Doctor of Philosophy.
School of Mechanical and System Engineering
Newcastle University
Newcastle upon Tyne, United Kingdom.
September 2015

Abstract
The aim of this work was to identify methods for the production of patient-specific
biomedical devices via indirect additive manufacturing (AM) methods. Additive
manufacturing has been shown to provide a good solution for the manufacture of patient
specific implants, but in a limited range of materials, and at a relatively high cost. This
research project considered what are known as “indirect” AM approaches, which typically
consider AM in combination with one or more subsequent processes in order to produce a
part, with a maxillofacial plate and mandible resection used as a demonstrator application.
Three different approaches were considered: (i) using AM to produce moulds for powder
pressing of bioceramic green parts for subsequent sintering; (ii) using AM to produce moulds
for biopolymer sintering; and (iii) 3D printing of bioceramic powders into green parts for
subsequent sintering.
Apatite wollastonite glass ceramic (AW) and poly-Lactide-co-glycolide (PLGA) were
selected as the bioceramic and biopolymer materials to process. These were characterised
before and after processing in order to ensure that the processing route did not affect the
material properties. Geometric dimensions, the morphological structure and mechanical
properties were studied to establish the accuracy, shrinkage and strength of the fabricated
biomaterial implants.
The use of AM processes to produce moulds for PLGA sintering, and the 3D printing of
bioceramic powders formed the best overall results in terms of the definition and properties of
the manufactured parts. Parts produced were accurate to within 5% of the as designed
dimensions for both the PLGA sintering and the bioceramic powders 3D printing. The
indirect AM methods are considered to be promising processing routes for medical devices.
iii

Dedication
This work is dedicated to my beloved late parents,
Noor Aini Abdullah
1939 – 1984
Mohamad Khan Shoumuz Khan
1937 – 2014
“Semoga Allah swt mencucuri rakhmat ke atas roh mereka.
Tiada yang mustahil dicapai sekiranya berusaha tanpa mengalah.”
Nothing is impossible to accomplish if one persevere without giving in.
iv

Personal statement
During the time spend in doing this research it had broadened my view as an academician as
well as a human being. Doing research is just not about academic materials purely but also
involved the interpersonal domain. How one communicates and respects others that surround
the daily activities in carrying out the research play an important and significant role in the
success of the research. The more one seek to understand one thing the more one will realise
the need to understand a lot of others related things.
v
Declaration
This dissertation is the result of my work and includes nothing, which is the outcome of the
work done in collaboration except where specifically indicated in the text. It has not been
previously submitted, in part or whole, to any university of institution for any degree,
diploma, or other qualification.
In accordance with the Faculty of Science, Agriculture and Engineering guidelines, this thesis
does not exceed 80,000words.
Signed: _ _ Date: 23rd September 2015 Shah Fenner Khan Mohamad Khan MSc. (UK), BSc. (USA)
Student ID: A079082150
School of Mechanical and Systems Engineering
Newcastle University, UK.
vi

Acknowledgements
In the duration of my study in Newcastle University, I am ever grateful to all the individuals
who have contributed to my quest of knowledge as a Ph.D. student.
First of all, I would to extend gratitude and appreciation to my supervisors Prof. Dr. Kenneth
W. Dalgarno and Dr. Matthew German (School of Dental Sciences) for their insightful inputs,
invaluable assistance, guidance and supports throughout this research journey. This research
would not have been possible without their supervision and encouragement as supervisors and
as friends.
I too would like to express my appreciation to the technical team; Ken Madden, Malcolm
Black, Michael Foster, Stephen Charlton and Brian Stoker for all the technical assistances
and helpful advices during practical works. I would also like to thank Andrew Yates (School
of Dental Sciences) for assistance in the operation of DSC analysis and Instron tensile testing
equipment, Maggie White (School of Chemical Engineering and Advanced Materials) for
helping in XRD analysis, Pauline Carrick (ACMA) and Tracey Davey (Medical School) for
SEM works and Neville Dickman (School of Chemical Engineering and Advanced Materials)
for assistance in operation of Carbolite furnace. My gratitude also extended to Phil Heslop
(Computing Science) for 3D printing the parts that were used in the research.
I would also like to thanks to my colleagues for their suggestions, wishes and help during the
four years study.
Furthermore, I would like to thank University Malaysia Perlis and the Malaysian Higher
Education Ministry for sponsoring me and giving me the opportunity for doing research in
Newcastle University.
And most of all, I would like to express my endless love to my family for their understanding
and support through the duration of my study. Very special thanks to my children;
Nurdiyanah Nasuha, Muhammad Zulhanis, Nurliyanah Atiqah, NurIffah Syahirah and
NurIzzah Syakirah, for bringing smiles and laughter. For them, there are my sparks of
encouragement to carry on when I am down.
Finally, for my ever dearest wife, Salma Mohamad Isa for the wishes, love and support, as
well as being always by my side.
vii

viii

Table of Contents
Abstract ............................................................................................................................ iii
Dedication ........................................................................................................................ iv
Personal statement ............................................................................................................ v
Declaration....................................................................................................................... vi
Acknowledgements ........................................................................................................ vii
Table of Contents ............................................................................................................ ix
List of Tables .................................................................................................................. xv
List of Figures ................................................................................................................ xvi
List of Abbreviations and Acronyms ............................................................................ xxi
Introduction ..................................................................................................... 1 Chapter 1:
Introduction ............................................................................................................ 1 1.1
Research Problem ................................................................................................... 2 1.2
Research Aim and Objectives................................................................................. 4 1.3
Aim .................................................................................................................. 4 1.3.1
Objectives ........................................................................................................ 4 1.3.2
Research Framework .............................................................................................. 4 1.4
Thesis Outline ......................................................................................................... 5 1.5
Literature Review ........................................................................................... 7 Chapter 2:
Introduction ............................................................................................................ 7 2.1
Fundamentals of Additive Manufacturing (AM).................................................... 7 2.2
Process categories of AM Systems ....................................................................... 10 2.3
Vat photopolymerisation ............................................................................... 10 2.3.1
Powder bed fusion ......................................................................................... 11 2.3.2
Directed energy deposition ............................................................................ 12 2.3.3
Binder jetting ................................................................................................. 14 2.3.4
Material Jetting .............................................................................................. 15 2.3.5
ix

Material Extrusion.......................................................................................... 15 2.3.6
Sheet Lamination ........................................................................................... 17 2.3.7
Type of Application in AM ................................................................................... 18 2.4
Rapid prototyping .......................................................................................... 20 2.4.1
Rapid tooling .................................................................................................. 20 2.4.2
Rapid manufacturing ...................................................................................... 21 2.4.3
Indirect AM ........................................................................................................... 22 2.5
Design in AM ........................................................................................................ 23 2.6
STL file format...................................................................................................... 26 2.7
Natural Bone ......................................................................................................... 28 2.8
Bone Graft Substitute (BGS) Materials. ........................................................ 29 2.8.1
Fixation of bone graft substitute. ................................................................... 31 2.8.2
Bioceramic and glass-ceramics ............................................................................. 32 2.9
Glass-Ceramic ................................................................................................ 34 2.9.1
Apatite Wollastonite glass-ceramics .............................................................. 37 2.9.2
Biodegradable polymer ....................................................................................... 39 2.10
Polylactide-co-Glycolide Acid (PLGA)....................................................... 43 2.10.1
Biocomposite ...................................................................................................... 44 2.11
Forming Processes of Biomaterials in the Manufacturing of Medical Devices 2.12
and Implants ........................................................................................................ 44
Fabrication methods in ceramic material ..................................................... 45 2.12.1
Methods in processing of biopolymers ........................................................ 46 2.12.2
Sintering .............................................................................................................. 47 2.13
Solid-state and liquid state sintering ............................................................ 48 2.13.1
Materials Characterisations and Analysis ........................................................... 50 2.14
Density Measurement using Pycnometer ..................................................... 51 2.14.1
DSC .............................................................................................................. 52 2.14.2
SEM ............................................................................................................. 54 2.14.3x

XRD ............................................................................................................. 56 2.14.4
Mechanical Testing...................................................................................... 57 2.14.5
Methodology ....................................................................................................... 59 2.15
3D Printed Moulds for Lost Wax Casting of Apatite Wollastonite Powder 61 Chapter 3:
Introduction .......................................................................................................... 61 3.1
Material Characterisations and Methods .............................................................. 61 3.2
Materials ........................................................................................................ 62 3.2.1
Powder Mixing .............................................................................................. 66 3.2.2
DSC Analysis ................................................................................................ 68 3.2.3
Fabrication of AW glass ceramic specimens ................................................. 69 3.2.4
Characterisation of sintered specimens ......................................................... 70 3.2.5
XRD and EDX evaluation of material after fabrication process ................... 83 3.2.6
Assessment of moulding process .......................................................................... 88 3.3
SLA mould .................................................................................................... 90 3.3.1
Aluminium (Al) block mould ........................................................................ 91 3.3.2
Aluminium shell mould ................................................................................. 91 3.3.3
FDM with aluminium sheet shell mould ....................................................... 92 3.3.4
Different moulding system outcome ............................................................. 94 3.3.5
Case Study ............................................................................................................ 95 3.4
Specific Case Study Background .................................................................. 95 3.4.1
Design and AM manufacturing of Implant Moulding System ...................... 96 3.4.2
DFMA methodology in design of mandible implant .................................... 97 3.4.3
Design of Implants for mandible reconstruction ........................................... 98 3.4.4
Fabrication and Attachment of Implants for mandible reconstruction .......... 98 3.4.5
Integration Indirect AM and lost wax process. ........................................... 100 3.4.6
AM Indirect tooling. .................................................................................... 100 3.4.7
AM in soft tooling ....................................................................................... 104 3.4.8
xi
Discussion ........................................................................................................... 107 3.5
Comparison of AM in indirect tooling and soft tooling ............................... 107 3.5.1
Conclusions ......................................................................................................... 108 3.6
3D Printing of bioceramics powder ............................................................ 110 Chapter 4:
Introduction ......................................................................................................... 110 4.1
Materials and Methods ........................................................................................ 110 4.2
Process ......................................................................................................... 111 4.2.1
Materials....................................................................................................... 113 4.2.2
Powder Blending .......................................................................................... 115 4.2.3
Binder Preparation ....................................................................................... 117 4.2.4
Process Development .......................................................................................... 117 4.3
Binder Evaluation ........................................................................................ 117 4.3.1
Powder Blend Evaluation............................................................................. 120 4.3.2
Sintering ....................................................................................................... 130 4.3.3
Accuracy ...................................................................................................... 132 4.3.4
Mechanical Properties .................................................................................. 136 4.3.5
XRD analysis of sintered parts fabricated using 3DP .................................. 140 4.3.6
Discussion ........................................................................................................... 143 4.4
Conclusion .......................................................................................................... 143 4.5
3D Printed Moulds for Biopolymers ........................................................... 145 Chapter 5:
Introduction to Chapter ....................................................................................... 145 5.1
Material Characterisation .................................................................................... 145 5.2
Material and DSC Analysis.......................................................................... 145 5.2.1
Moulding Process Development ......................................................................... 151 5.3
Load and Temperature Combination Optimum Process Setting ................. 152 5.3.1
Evaluation and Analysis ............................................................................... 154 5.3.2
Results .......................................................................................................... 155 5.3.3
xii

DSC Evaluation of material after fabrication process ................................. 163 5.3.4
Case Study .......................................................................................................... 164 5.4
Specific Case Study Background ................................................................ 164 5.4.1
Design and AM manufacturing of Patch Moulding System........................ 166 5.4.2
Mould Design and Manufacture .................................................................. 170 5.4.3
Attachment of a personalised fixation patch ............................................... 171 5.4.4
Results ................................................................................................................ 171 5.5
Discussion ........................................................................................................... 173 5.6
General Discussion ..................................................................................... 175 Chapter 6:
Introduction ........................................................................................................ 175 6.1
Discussion ........................................................................................................... 175 6.2
Moulding of AW scaffolds by aluminium sheet mould .............................. 176 6.2.1
Shell moulding Process of AW 3D artefacts by mean of Rapid Tooling (RT)6.2.2
................................................................................................................... 177
Lost wax casting (LWC) process of bioceramic 3D artefacts by mean of 6.2.3
Rapid Tooling (RT) ................................................................................... 177
3D printing process of bioceramic 3D artefacts by indirect AM ................ 177 6.2.4
Crystallography Phase Comparison of Sintered AW parts from Moulding and 6.2.5
3D Printing. ............................................................................................... 178
Melt moulding processing of biopolymer 3D artefacts by mean of Rapid 6.2.6
Tooling (RT) .............................................................................................. 179
Conclusion and Future Work. ..................................................................... 181 Chapter 7:
Conclusion .......................................................................................................... 181 7.1
Future Work ........................................................................................................ 182 7.2
References .................................................................................................................... 184
Appendix A – Academic contribution. ......................................................................... 203
Appendix B Data .......................................................................................................... 206
Appendix C Mould drawing and RTV moulding steps. ............................................... 233
xiii

xiv

List of Tables
Table 3.1 List of equipment used in the study. ............................................................... 62
Table 3.2 Average Tg of PMMA at midpoint. ............................................................... 69
Table 3.3 Samples average geometrical measurements. ................................................ 75
Table 3.4 Density and porosity measurements of AW as determine using pycnometer. 77
Table 3.5 Flexural Modulus and Modulus of Rupture (Flexural Strength). ................... 82
Table 3.6 Samples of different AW-PMMA ratio tested on different mould................. 94
Table 3.7 Materials cost for fabricating a unit of AM soft tooling. ............................. 105
Table 3. 8 Mechanical Properties of Natural bone and bioceramics. ........................... 107
Table 4.1 List of equipment used in the study. ............................................................. 110
Table 4.2 Ratio of AW mixture preparation. ................................................................ 115
Table 4.3 Components of ZP18 binder solution. .......................................................... 117
Table 4.4 Result of spraying different binder solution to AW maltodextrine powder
mixture. ......................................................................................................................... 118
Table 4.5 Accuracy of 3D printed green specimens ..................................................... 133
Table 4.6 Accuracy of sintered 3D printed specimens ................................................. 134
Table 4.7 Young’s modulus and Flexural strength of printed 3D specimens. ............. 140
Table 5.1 Properties of Lactide:Glycolide co-polymer. ............................................... 146
Table 5. 2 Glass transition temperature of biopolymer PLGA. .................................... 146
Table 5.3 Glass transition temperature of SLA material .............................................. 151
Table 5.4 Results of different parameter settings in melt moulding of PLGA pellets. 153
Table 5.5 Statistical Analysis for Mechanical Properties of PLGA fabricated under
heating profile and load of 15lbs (kg) as described in 5.3.1. ........................................ 158
Table 5.7 Mean value for 95% confidence interval for sintered test sample of PLGA.160
xv

List of Figures
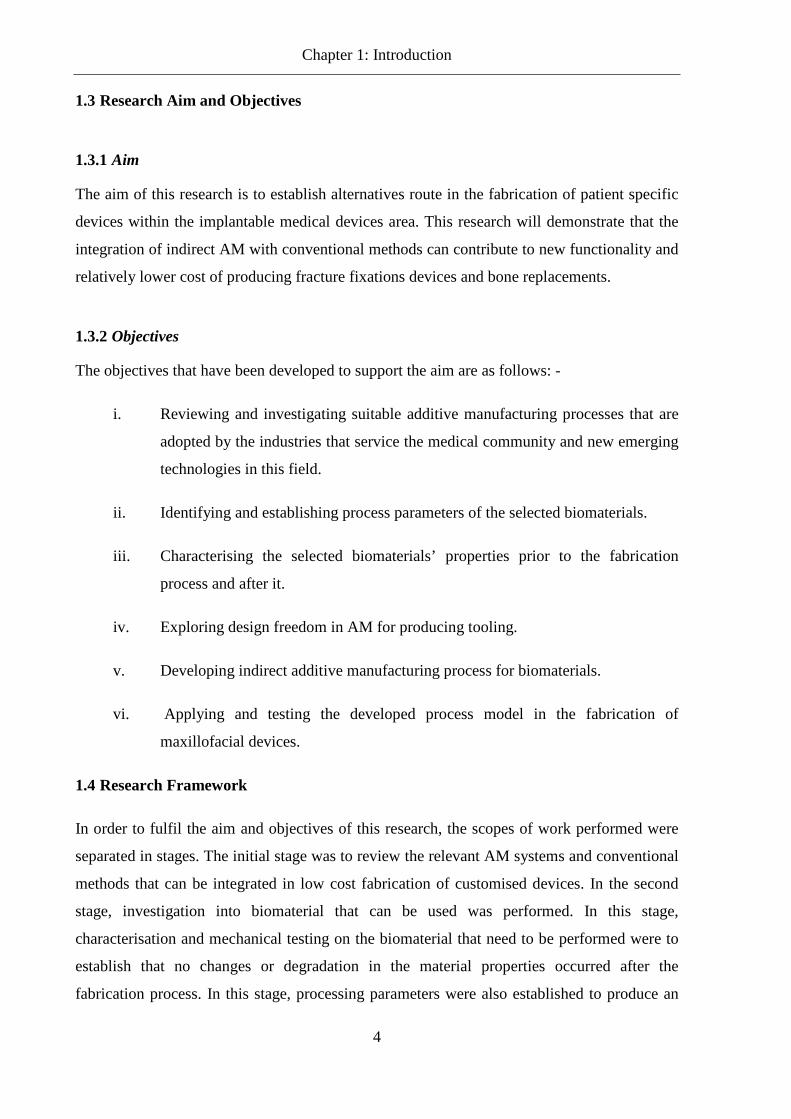
Figure 2.1 Generalised AM process flow from the CAD model created from data
captured to AM fabricated artefact. .................................................................................. 9
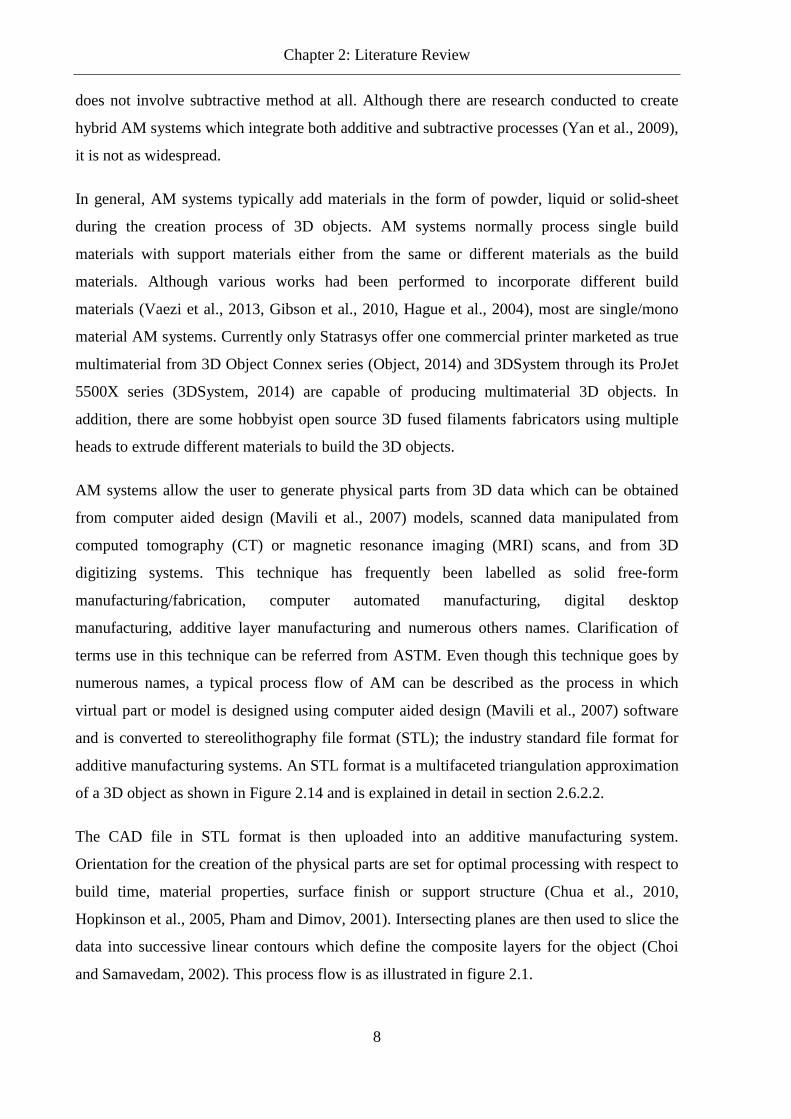
Figure 2.2 Vat photopolymerisation AM system configuration for stereolithography
apparatus (SLA)(SD3DPrinting, 2013)........................................................................... 11
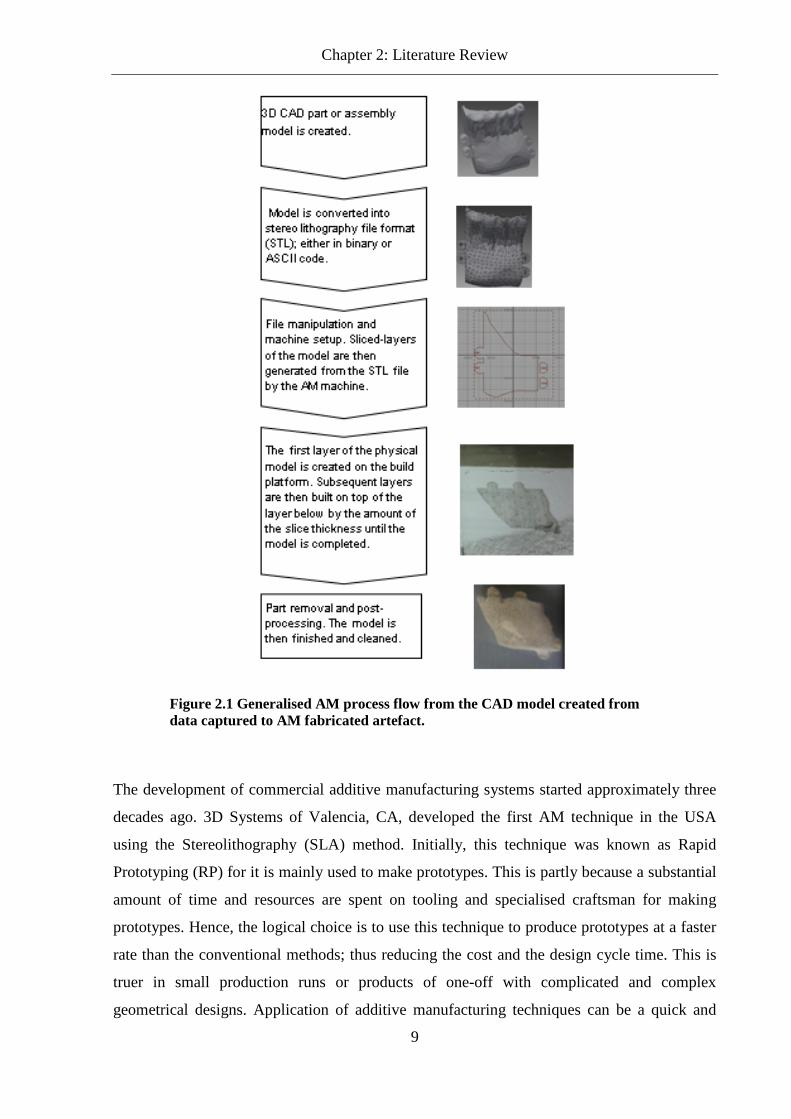
Figure 2.3 Powder bed fusion AM system for Selective Laser Sintering (SLS) Process
overall configuration (VG, 2012).................................................................................... 12
Figure 2.4 Direct energy deposition AM system, (a) Electron beam melting (EBM)
(Arcam, 2013) (b) laser engineered net shape (LENS) (Mechanicalengineeringblog,
2012). .............................................................................................................................. 13
Figure 2.5 Binder jetting AM system, Colour 3DP (dreams.me.vt.edu, 2009). ............. 14
Figure 2.6 Material jetting schematic arrangement (Objet, 2008) .................................. 15
Figure 2.7 Material extrusion Fused Deposition Modeling (FDM) System overall
configuration (3DParts, 2011) ......................................................................................... 16
Figure 2.8 Sheet lamination AM system configuration LOM (Custompartnet, 2012). .. 17
Figure 2.9 Sheet lamination AM system configuration UAM. (Fabrisonic, 2012). ....... 18
Figure 2.10 Applications areas in general subset of AM. These include RP, RT and RM
in various form of usage in the medical fields (Khan, 2010). ......................................... 19
Figure 2.11 Titanium implants with original RP as a master pattern in investment
casting(a) and injection mould inserts(b) (CUT-CRPM, 2014, Turner, 2007) ............... 21
Figure 2.12 Some RM customised parts dental coping (a) and Cranial Implants(b)
(EOS, 2011).(Source: EOS GmbH). ............................................................................... 22
Figure 2.13 Format of a triangular facet for STL file. .................................................... 27
Figure 2.14 An STL file format model of a section of a mandibular image showing the
surface triangulation with mesh reduction using Meshlab software. (a) Low number of
triangulation and (b) High number of triangulation. ....................................................... 27
Figure 2.15 Bone remodelling cycle(Umich.edu, 2005). ................................................ 30
Figure 2.16 Manufacturing schedule for the production of glass ceramics. ................... 35
Figure 2.17 Clinical uses of bioceramics (Hench and Wilson, 2013). ............................ 36
Figure 2.18Categories of sintering in a phase diagram. .................................................. 48
Figure 2.19 Classical sintering model of two adjacent particles (German, 1996) .......... 49
Figure 2.20 Diffusion pathways (German, 1996). .......................................................... 50
Figure 2. 21 Density bottle (Impact-test, 2013, Jaytecglass, 2012). ............................... 51
xvi

Figure 2.22 Schematic of a DSC (Colby, 2007). ............................................................ 53
Figure 2.23 Schematic DSC thermogram of semi-crystalline polymer which denote the
point of glass transition temperature Tg, crystallisation temperature Tc, melting
temperature Tm and decomposition temperature Td (Braun et al., 2012). ...................... 53
Figure 2. 24 Various signal from electron-sample interactions when the incident
electrons are decelerated in the solid sample (Nanoscience, 2014). .............................. 54
Figure 2.25 schematic of SEM and x-ray optics (Swapp, 2007). ................................... 55
Figure 2. 26 Bragg's Law reflection. The diffracted X-rays exhibit constructive
interference when the distance between paths ABC and A'B'C' differs by an integer
number of wavelengths (λ) (Henry et al., 2007). ............................................................ 57
Figure 2.27 Typical stress-strain diagram for ductile materials. .................................... 58
Figure 2.28 Specimen’s initial position at start of test (BSI, 2011). .............................. 59
Figure 2.29 Methodology flow chart used in the proposed study. ................................. 60
Figure 3.1 AW frits as obtained (a)batch1 and (b)batch2, mostly in the range of 53-
90µm with few larger than 90µm; scale bar at top left, top right, bottom left and bottom
right are 500µm, 200µm, 100µm and 20µm respectively. ............................................. 64
Figure 3.2 PMMA particles of mostly below the size 4um as obtained (a) GM0600
fairly dispersed and (b) GM0800 closely lumped; scale bar at top left, top right, bottom
left and bottom right are 500µm, 200µm, 50µm and 20µm respectively. ..................... 65
Figure 3.3 AW-PMMA powder mixtures (a) PMMA GM0600 adheres well to A-W and
(b) PMMA GM0800 did not blend well with A-W. The scale bar at top left, top right,
bottom right and bottom right are 500µm, 200µm, 50µm and 20µm respectively. ....... 67
Figure 3.4 DSC tests of four out of six PMMA powder samples. .................................. 68
Figure 3.5 Process flow in preparing sintered test specimens. ....................................... 71
Figure 3.6 Heating Profile for sintering AW green parts. .............................................. 72
Figure 3.7 Three Measurements were taken on sintered specimens (a), (b), (c) and (d)
where variation is not significant; scale bar on images is 1000µm. ............................... 74
Figure 3. 8 Image (a) and (b) of the cross section of sintered AW samples................... 77
Figure 3.9 SEM images (a) and (b) of sintered porous A-W glass ceramic 80%wt on the
external surface of two samples at 500X and 5000X magnification indicating micro-
porosity; scale for left image and right image are 50µm and 5µm respectively. ........... 78
xvii

Figure 3.10 Scaffolds as produced by the proposed method (top) and scaffolds produced
by SLS. ............................................................................................................................ 79
Figure 3.11 Bending test diagram as based on BS (BSI, 2008). ..................................... 80
Figure 3.12 Load versus Deflection for 2 batches of AW cylindrical specimens from 3
Point bending test. ........................................................................................................... 81
Figure 3.13 XRD analysis of the sintered AW cylindrical specimens indicating the
consistent peaks pattern using newer ICDD database (a-b) 2003 and (c-d) 2009. ......... 86
Figure 3.15 EDX results for sintered two samples specimen fabricated using aluminium
sheet mould using the same batch of AW-PMMA powder mixture. .............................. 88
Figure 3.16 Different moulds designed to assess the viability for used in AW scaffold
round specimens fabrication; (a) two different designs for aluminium block mould
without ejector, (b) CAD design (left) and SLA mould (right)for moulding system with
ejector, (c) alternative CAD designs and (d) simple Al sheet mould. ............................ 89
Figure 3.17 Greenpart inside (a) SLA mould, and (b) greenpart as removed from mould.
......................................................................................................................................... 90
Figure 3.18 Simple rolled-up Aluminium sheet mould of diameter 3.0mm. .................. 92
Figure 3.19 Two designs of mould that use aluminium foil to ease removal of moulded
part (a) 2-piece Al mould with end-cover (b) 2-piece mould incorporating end cover,
and (c) Al sheet on the fabricated mould with top view and assembled front view. ...... 93
Figure 3.20 (a) Conventional implant fixation method. (b) A section cut-out for implant
with slotted joint.............................................................................................................. 97
Figure 3.21 (a) CAD implants model, (b) CAD multiple parts mould of implants and (c)
FDM fabricated mould with one-half of the mould filled with modelling wax as used in
LWC. ............................................................................................................................... 98
Figure 3.22 Aluminium foil as pressed into the cavity of the AM mould. ..................... 99
Figure 3.23 Sintered AW implant from green part of implant produced from FDM
mould with Al sheet shell mould. ................................................................................... 99
Figure 3.24 (a) Initial design and (b) redesign for better heat penetration. .................. 100
Figure 3.25 (a) Show Comparison between FDM model (left) with a wax model
(middle) and AW part, while (b) show the outcome of several AW parts that were
produced. Some improvements were noted on the parts in term of reducing crack, and
the geometrical shape is near to the model geometry. .................................................. 102
Figure 3.26 Processing flow in indirect fabrication of customised AW medical implants.
....................................................................................................................................... 103
xviii
Figure 3.27 (a) Preparation for soft tooling moulding with FDM master pattern and (b)
wax pattern as duplicated from RTV silicone mould of the FDM master pattern. ...... 104
Figure 3.28 (a) Wax model (left) obtained from RTV silicone moulding process
comparing to the FDM master pattern (b) minor deviation of features........................ 105
Figure 3.29 Processing flow in fabricating customised AW medical implants by indirect
AM with the integration of RTV silicone mould and LWC process. ........................... 106
Figure 3.30 Comparison of the wax model with FDM model. Model from modelling
wax showing higher loss definition of the feature as compared to the wax model from
RTV soft tooling. .......................................................................................................... 108
Figure 4.1 Ball mill machine that was used in the milling process of AW powders. .. 112
Figure 4.2 Process Flow and Characterisation of AW powder mixture. ...................... 113
Figure 4.3 Particles of AW 53µm -90µm and maltodextrine below 53mm as received114
Figure 4.4 SEM images of different preparations. ....................................................... 116
Figure 4.5 The influence of the amount of binder solution to the layer thickness. ...... 120
Figure 4. 6 (a)Printing orientation of AW test specimens on Z-Corp 310Plus 3D printer,
(b) different distortion in green part specimens and (c)samples of sintered part where the
bottom surface are straighter than the top surface. Circled areas showing the effect of
curling. .......................................................................................................................... 121
Figure 4.7 Printing effects (a), (b) and (c) on the geometrical accuracy of 3D artefacts.
...................................................................................................................................... 124
Figure 4.8 Surface texture of top, bottom and side of printed samples (a), (b) and (c).129
Figure 4.9 Specimens printed using the prepared AW-maltodextrine mixture with
ethanol-Darvan-C based binder solution. ..................................................................... 130
Figure 4.10 Equipment used in sintering AW green parts. .......................................... 131
Figure 4.11 SEM images of sample at (a) outer surface and (b) at bending failure
surface (from left to right) at 20X magnification (2mm scale bar), 117X (200µm scale
bar), and 1170X (20µm scale bar) . .............................................................................. 132
Figure 4.12 3D printed artefacts showing minor geometrical deviation from the CAD
model, (a) curling of printed parts, and (b) different in surface profile in top and bottom
surface of AW fracture patch........................................................................................ 135
Figure 4. 13 Comparison of outcomes from two different approaches; indirect tooling
and 3D printing. ............................................................................................................ 136
Figure 4.14 AW green parts stress-strain curve. .......................................................... 137 xix

Figure 4.15 AW sanded sintered parts stress-strain curve. ........................................... 138
Figure 4. 16 AW unsanded sintered parts stress-strain curve. ...................................... 139
Figure 4.18 XRD analysis using 2 different ICCD database for samples which used
maltodextrine binder and PVA solution. ....................................................................... 143
Figure 5.1 DSC analysis of various ratio of PLGA. ..................................................... 150
Figure 5.2 Processing of PLGA Specimens .................................................................. 152
Figure 5.3 (a) SLA mould in the heating setup and (b) PLGA pellets in SLA mould.. 152
Figure 5.4 Heating profile for the sintering process of PLGA. ..................................... 154
Figure 5.5 Bending test diagram and the actual test on a universal testing machine rig.154
Figure 5.6 Stress-Strain curves of PLGA co-polymers................................................. 157
Figure 5.7 Fracture of PLGA 50:50(above) and PLGA 65:35 (below) obtained from
bending test showing the region of tension at the top with craze. ................................ 161
Figure 5.8 SEM images at outer surface of specimens ................................................. 162
Figure 5.9 SEM images at fracture surface from 3 point bending test. ........................ 162
Figure 5.10 Comparison of virgin to sintered PLGA 65:35. ........................................ 163
Figure 5.11 Fracture Occurrence for Regions of the Mandible (Natu et al., 2012). .... 164
Figure 5.12 Bone Plate Used in an Open Reduction Internal Fixation Procedure(ORIF)
(Bhagol et al., 2013). ..................................................................................................... 165
Figure 5.13 Step in reverse engineered the fracture patch. ........................................... 168
Figure 5. 14 Process flow in design and manufacture of moulding for customised
fracture patch. ................................................................................................................ 167
Figure 5.15 Various fixation plates were created for high occurrence sites of fracture.169
Figure 5.16 FDM model of the fixation plate for form fitting test. .............................. 169
Figure 5.17 Individual part of the mould assembly as design from Autodesk Inventor.
Design steps are as displayed in Browser Panel. .......................................................... 170
Figure 5.18 CAD model of the moulding assembly and exploded view. ..................... 171
Figure 5.19 PLGA before and after sintering in SLA mould ........................................ 172
Figure 5.20 (a) PLGA 50:50, (b) PLGA 65:35 and (c) CAD model of the fracture plate.
....................................................................................................................................... 172
xx

List of Abbreviations and Acronyms
3D - Three dimensional
3DP - 3D Printing/Printer
ABS - Acrylonitrile butadiene styrene
AM - Additive Manufacturing
ASTM - American Society for Testing and Materials
AW-GC - Apatite-Wollastonite glass ceramic
BGS – Bone graft substitute
CAED - Computed Aided Engineering Design
CAD - Computed Aided Design
CNC - computer numerical control
CT – Computer tomography
DLS - Direct Laser Sintering
DMLS - Direct Metal Laser Sintering
DOF - Degree Of Freedom
EBM - Electron Beam Melting
FDM - Fused Deposition Modelling
FE – Finite element
FGM - functional graded material
HIP - Hot Isostatic Pressing
IC - Investment Casting
LWC - Lost wax casting xxi

LENS - Laser Engineering Net Shape
LOM - Laminated Object Manufacturing
MJM - Multi-Jet Modelling
MRI - Magnetic Resonance Imaging
MVA - motor vehicle accidents
PE - Polyethylene
PLGA - poly-lactide-co-glycolide
RE - Reverse Engineering
RM - Rapid Manufacturing
RP - Rapid Prototyping
RT - Rapid Tooling
SFF - Solid Freeform Fabrication
SLA - Stereolithography
SLM - Selective Laser Melting
SLS - Selective Laser Sintering
STL – Stereolitographic /surface tessellation (triangulation) language file format
UAM –Ultrasonic AM
UV - ultra violet
xxii

Introduction Chapter 1:
Introduction 1.1
Additive manufacturing technologies were initially envisioned to be tools for rapid fabrication
of prototypes. Hence, in the early development of these technologies, the phrase rapid
prototyping system was often used to describe additive manufacturing technologies. After
almost 30 years of development, advancements in materials development for additive
manufacturing systems have pushed the boundary of these technologies from merely
producing prototypes to producing functional parts. In 2009, ASTM agreed upon the term
additive manufacturing as the standard term in acknowledging this recent development
(ASTM, 2012). However, it is still far from being able to use all the traditional materials
available in a typical manufacturing environment. Additive manufacturing (AM) technologies
allow physical three dimensional (3D) artefacts to be built directly from virtual models of
almost any geometry created from computer aided design (CAD) systems (Mavili et al.,
2007). These 3D artefacts are built in a layer wise manner where materials are added layer-
by-layer. Therefore, needs for dedicated moulds, dies, or tooling are not required during
fabrication. As AM systems’ main source of data input are from CAD models, these
technologies are well suited for the medical field. Computed tomography (CT) and magnetic
resonance imaging (MRI) methods for scanning bodies and creating computer images of the
skeletal structure use slicing technique to capture images in layers, much like the way AM
build 3D artefacts. The images are used to generate 3D computer models and can be used as
input data for the AM system. This method had been established in creating 3D models for
surgical visualisation, planning and communication (Esses et al., 2011, Sanghera, 2001,
Winder, 1999).
The changing role of additive manufacturing technologies from rapid prototyping to rapid
manufacturing have influenced the optimistic view of medical practitioners of using additive
manufacturing technologies for medical applications far beyond the scope of pre-surgical
visualization and planning. Defects of the skeletal system caused by trauma, disease,
congenital abnormalities or bone deficiency, osteoarthritis and wear, pose a major challenge
to overcome. Clinical needs for anatomically shaped biomaterials to replace the skeletal
defects not only confined to the healing of bone but also to the functional and aesthetical
aspects. Recent developments have shown the capabilities of additive manufacturing methods
in providing improvements for patients care in traumatic injuries and congenital defects
1

Chapter 1: Introduction
(Douglas, 2014, Melchels et al., 2010, Wang et al., 2009, Parthasarathy et al., 2009, Cohen et
al., 2009). Even though AM systems are capable of fabricating freeform shape, replacement
of human parts that mimic nature in structure and function remains distant.
Bone as a living tissue, considered a composite material, is comprised of trabecular
(cancellous) bone and cortical (compact) bone. It can heal and remodel by responding with
adaptation in its structure to loading stress or injury such as fracture. Even though bone has
this natural ability to heal and remodel; external mechanical means are required in helping to
stabilize and realign fractured bone during the healing process, thus encouraging faster
healing. In addition, bone is only capable of automatically fulfilling their regenerative
function within voids of limited size. Therefore, bone is unlikely to remodel itself in major
bone losses. Hence, if the defect is too large, bone replacements are required to fill the gap
and bridge the defects. Most of these types of major bone repairs are treated by bone grafting
that use the patient’s bone (autografts) or donor bone (allografts). The advantages of these
grafts include rapid and excellent osseous integration, which justified their usage in more than
half of bone grafting procedures. However, the need of further surgery, risk of transmitted
disease, immunogenic rejection, donor site morbidity and limited material from donor site
pose some limitations to the current practices (Zwingenberger, 2012, Ogilvie et al., 2009,
Goldberg, 2005, Getty and Peabody, 1999, Strong, 1996). Therefore, increasing attention
towards alternative techniques and implant materials and devices as solutions to these
problems has encouraged much research over recent years.
Bone graft substitute (BGS) of synthetic materials such as metals, alloys, polymers, glass and
ceramics have been applied and studied as reinforcement or replacement in bone defects.
Although, an ideal to date, the traditional methods for producing these devices that mimics the
natural bone and the anatomy of the recipients are yet to be fully achieved.
Research Problem 1.2
AM systems had seen a flourishing development in recent research and usage for medical
applications in which an increase from 8.8% in 2001 to 16.4% in 2013 was noted (Wohlers,
2013). Depending on the parts and materials required, different approaches are used in
producing the medical artefacts. Additive manufacturing (AM) can produces parts by either
using the direct or indirect method. Additive manufacturing used to produce directly end user
parts is termed as rapid manufacturing (RM). However, the cost of acquiring such a machine
is high. A couple of the AM machines that have been used in recent research for RM are 2

Chapter 1: Introduction
electron beam melting (EBM) and direct metal laser sintering (DMLS) which cost from
£723,000 and £482,000 upward, respectively. The EBM machine was used in studies to
produce implantable parts for the application in maxillofacial surgery (Jamshidinia et al.,
2014, Poukens et al., 2010) while DMLS system was used in orbital implants fabrication
(Salmi et al., 2012). Since most of the systems used for direct additive manufacturing are
costly, the overhead cost for producing patient specific part tends to increase. It was pointed
out from a comparison study between EBM and conventional method that the manufacturing
cost contribution of parts produced by EBM as compared to conventional method is 130%
even though the total cost to produce the parts is only 65% overall of the conventional method
(Cronskar et al., 2013). Furthermore, fixation and reconstruction of defective bone involved
high health care costs and, therefore, are often not easily reachable for patients in most of the
developing countries. The cost of surgery is very high due partly to the cost of the device used
as well as the time needed for pre- and post-operation. Patients facing this ordeal find it
difficult to afford a corrective action; especially for patients from the low income and newly
developed countries as well as lower income group in developed countries. The appearance of
the facial features cause by fracture and deformation to the mandible often produce
undesirable emotional stress and discomfort. Thus, healthy life style can be jeopardised.
Patients will have serious problems with ingestion and communication as well as appearance
that have negative effects on their social life (Simon et al., 2013). It has been highlighted that
high occurrences of bone fractures are caused by motor vehicle accidents (MVA) involving
motorbikes and alcohol abuse and of these incidents; most are from the lower income group
(Nordin et al., 2014, Rahman et al., 2007, Brasileiro and Passeri, 2006).
Even though AM systems are capable of producing end-user products and at reducing
manufacturing time, AM use is dampened by the high initial investment cost and the high cost
of producing usable raw materials for the AM systems (White and Lynskey, 2013). Hence, in
order to contribute to the achievement of healthy life style, affordable and reasonable
customised devices which can indirectly reduce the time and cost for reconstruction of
defective mandibular bone of these patients would contribute toward improving their quality
of life. In order to do these, new manufacturing routes to produce affordable customised
implantable devices need to be addressed. One approach is to use indirect AM method as
indirect application of AM method has been proven in studies conducted at producing tooling
and patterns for industrial applications (Park et al., 2014, Eggbeer et al., 2012, Pham and
Dimov, 2003).
3
Chapter 1: Introduction
Research Aim and Objectives 1.3
Aim 1.3.1
The aim of this research is to establish alternatives route in the fabrication of patient specific
devices within the implantable medical devices area. This research will demonstrate that the
integration of indirect AM with conventional methods can contribute to new functionality and
relatively lower cost of producing fracture fixations devices and bone replacements.
Objectives 1.3.2
The objectives that have been developed to support the aim are as follows: -
i. Reviewing and investigating suitable additive manufacturing processes that are
adopted by the industries that service the medical community and new emerging
technologies in this field.
ii. Identifying and establishing process parameters of the selected biomaterials.
iii. Characterising the selected biomaterials’ properties prior to the fabrication
process and after it.
iv. Exploring design freedom in AM for producing tooling.
v. Developing indirect additive manufacturing process for biomaterials.
vi. Applying and testing the developed process model in the fabrication of
maxillofacial devices.
Research Framework 1.4
In order to fulfil the aim and objectives of this research, the scopes of work performed were
separated in stages. The initial stage was to review the relevant AM systems and conventional
methods that can be integrated in low cost fabrication of customised devices. In the second
stage, investigation into biomaterial that can be used was performed. In this stage,
characterisation and mechanical testing on the biomaterial that need to be performed were to
establish that no changes or degradation in the material properties occurred after the
fabrication process. In this stage, processing parameters were also established to produce an
4

Chapter 1: Introduction
optimum setting for the fabrication process. The next stage was to identify suitable
applications where contributions and opportunities of using AM can be tapped. In the final
stage, case studies were presented.
Thesis Outline 1.5
This thesis consists of seven chapters. The first chapter is the introduction in which the
general idea of the research project is presented. The second chapter proceed with the bulk of
the information essential for understanding the research study. It provides comprehensive
reference materials and literatures which encompasses additive manufacturing methods and
applications, and the range of conventional manufacturing processes of biomaterials. In
addition, physiology of human bone and causes of defect to the bone as well as the fixation of
it are described. Experimental methods used in this research are presented toward the end of
this chapter. Finally, the generalised methodology for this research project is outlined.
The third chapter establishes the appropriate process parameters and material characterisation
and properties from AM processed bioceramics. It describes the new route for producing
patient specific bioceramic medical devices where the integration of CAD, AM technologies
and lost wax casting (LWC) are used. Two different approaches of indirect AM tooling were
implemented and described. The mandibular geometry created using the proposed route was
assessed for feature definition and repeatability as well as accuracy. The results are presented
and discussed.
The fourth chapter describes the steps taken for developing the process of indirect three
dimensional printing (3DP) of bioceramic. Process parameters and characterisation for the in-
house medium used are established prior to using a commercial 3D Printer (3DP) machine.
Morphology analysis and mechanical testing are performed to study the characteristics of the
printed artefacts. Mandible implant and fracture fixation patch are used as case studies to
determine the feasibility of the indirect AM process using 3DP for bioceramic.
In chapter five, the research work was on creating artefacts from biopolymer. It describes the
method developed for the fabricating personalised polymer structures by sintering poly-
lactide-co-glycolide (PLGA) granules in a mould manufactured from stereolithography (SLA)
process. The explanations on the indirect AM method utilising the tooling created from SLA
and adoption of the melt-moulding process as the overall process for fabrication are
exemplified by the steps taken in the evaluation of the manufacturing parameters with
5

Chapter 1: Introduction
material and mechanical properties assessments. A customised fracture patch was moulded to
illustrate the feasibility of this process and its ability to create and maintain physiologically
shaped parts throughout the process.
The results are then summarised and discussed in chapter six. The thesis then concludes with
chapter seven in which conclusion are drawn, and impending works are suggested.
This thesis itself is based on research articles presented and published in refereed conferences
and journals. The listing of the research articles are as in appendix A.
6

Literature Review Chapter 2:
Introduction 2.1
The literature survey presented in this chapter forms the basis for conducting this research
study. It serves as the foundation from which the rationales for this research study; and
subsequently aims and objectives, are established and justified.
In order to implement a recent technology of manufacturing such as additive manufacturing
(AM) techniques into the mature manufacturing industries for medical devices, a thorough
understand of the techniques is deemed appropriate. In addition, it is also necessary to gain
knowledge in a broad range of subjects including: common additive manufacturing
techniques, bone physiology and transplantation, bone fracture and fixation methods, medical
biomaterials and manufacturing techniques, medical applications using additive
manufacturing techniques, methods in characterisation and mechanical testing of materials as
well as AM in design and manufacturing.
The chapter starts with describing the working principle of each different AM techniques and
discussing the various applications of AM. A review of AM roles in design and
manufacturing is presented besides medical applications of AM. Traditional medical devices
manufacturing methods are also reviewed and discussed to form the foundation to which AM
techniques to use. This chapter also addresses the tools used in the materials’ characterisation
and analysis.
Fundamentals of Additive Manufacturing (AM) 2.2
In manufacturing industries, objects/parts can be manufactured either by removing or by
adding materials. The addition of materials in conventional manufacturing methods can be
performed by joining such as either through adhesion, welding or mechanical joint of
subcomponents to make up the end objects/parts. However, the subcomponents are normally
fabricated using subtractive methods where materials are removed to create the object.
Besides these conventional additive methods, another technique that is considered an additive
method is additive manufacturing (AM). However, its’ working principle is different. The
stark difference in AM as opposed to conventional manufacturing processes by additive
methods are that the automatic process of adding material is in the form of predefined layer
by layer manner to incrementally shape the three dimensional (3D) objects. AM normally
7
Chapter 2: Literature Review
does not involve subtractive method at all. Although there are research conducted to create
hybrid AM systems which integrate both additive and subtractive processes (Yan et al., 2009),
it is not as widespread.
In general, AM systems typically add materials in the form of powder, liquid or solid-sheet
during the creation process of 3D objects. AM systems normally process single build
materials with support materials either from the same or different materials as the build
materials. Although various works had been performed to incorporate different build
materials (Vaezi et al., 2013, Gibson et al., 2010, Hague et al., 2004), most are single/mono
material AM systems. Currently only Statrasys offer one commercial printer marketed as true
multimaterial from 3D Object Connex series (Object, 2014) and 3DSystem through its ProJet
5500X series (3DSystem, 2014) are capable of producing multimaterial 3D objects. In
addition, there are some hobbyist open source 3D fused filaments fabricators using multiple
heads to extrude different materials to build the 3D objects.
AM systems allow the user to generate physical parts from 3D data which can be obtained
from computer aided design (Mavili et al., 2007) models, scanned data manipulated from
computed tomography (CT) or magnetic resonance imaging (MRI) scans, and from 3D
digitizing systems. This technique has frequently been labelled as solid free-form
manufacturing/fabrication, computer automated manufacturing, digital desktop
manufacturing, additive layer manufacturing and numerous others names. Clarification of
terms use in this technique can be referred from ASTM. Even though this technique goes by
numerous names, a typical process flow of AM can be described as the process in which
virtual part or model is designed using computer aided design (Mavili et al., 2007) software
and is converted to stereolithography file format (STL); the industry standard file format for
additive manufacturing systems. An STL format is a multifaceted triangulation approximation
of a 3D object as shown in Figure 2.14 and is explained in detail in section 2.6.2.2.
The CAD file in STL format is then uploaded into an additive manufacturing system.
Orientation for the creation of the physical parts are set for optimal processing with respect to
build time, material properties, surface finish or support structure (Chua et al., 2010,
Hopkinson et al., 2005, Pham and Dimov, 2001). Intersecting planes are then used to slice the
data into successive linear contours which define the composite layers for the object (Choi
and Samavedam, 2002). This process flow is as illustrated in figure 2.1.
8
Chapter 2: Literature Review
Figure 2.1 Generalised AM process flow from the CAD model created from data captured to AM fabricated artefact.
The development of commercial additive manufacturing systems started approximately three
decades ago. 3D Systems of Valencia, CA, developed the first AM technique in the USA
using the Stereolithography (SLA) method. Initially, this technique was known as Rapid
Prototyping (RP) for it is mainly used to make prototypes. This is partly because a substantial
amount of time and resources are spent on tooling and specialised craftsman for making
prototypes. Hence, the logical choice is to use this technique to produce prototypes at a faster
rate than the conventional methods; thus reducing the cost and the design cycle time. This is
truer in small production runs or products of one-off with complicated and complex
geometrical designs. Application of additive manufacturing techniques can be a quick and
9

Chapter 2: Literature Review
cost effective manufacturing processes (Pham and Dimov, 2003, Hopkinson and Dicknes,
2003) in these instances. Since then, a number of different methods have become available.
Process categories of AM Systems 2.3
There are 24 different commercial AM technologies offering different functionality to
different segments of industries or user groups (Wohlers, 2010) with significant numbers of
research on processes and materials for AM conducted up to now. Since AM technologies
depend on the materials and methods used, the industries as well as academic seem to have
differences in conjugating a common term for the technologies used in AM. Initial
classification on AM was based on the physical state of the pre-process build materials and
was characterised into liquid, powder and solid (Kruth et al., 1998, Pham and Gault, 1998).
As of 2011, AM systems were reclassified based on process similarity and characterised into
vat photopolymerization, powder bed fusion, direct energy deposition, binder jetting, material
jetting, material extrusion and sheet lamination (ASTM, 2012). All these technologies are
described in the following subsections.
Vat photopolymerisation 2.3.1
Vat photopolymerization is an AM process in which liquid photopolymer in a vat is
selectively cured by light-activated polymerisation (Figure 2.2). The technique produces
models from liquid photosensitive polymers that solidify when exposed to ultraviolet light
from helium-cadmium or argon ion laser. A highly focused laser beam is used to trace out the
2D cross-sectional profile of the model in a vat of liquid epoxy or acrylate resin which
containing a vertically moving platform situated just below the vat surface. The model under
construction is supported by the platform that moves downward once a layer is fully traced by
a layer thickness for each layer. The process is repeated until the model is fully built. Parts of
the model that need support are built the same way at the same time as the model. When the
model is completed, the base plate is then raised to lift the model out. Any supports for
overhang are removed. The model is then placed in an ultraviolet oven for complete curing
(Noorani, 2006, Pham and Dimov, 2003) to avoid toxicity. The advantage of using vat
photopolymerisation is that it provides better accuracy among all the AM processes (Melchels
et al., 2010). However, it is limited to direct production of plastic parts, although attempts had
been made to indirectly produce ceramic parts by suspension of ceramic particle in light
sensitive monomer/oligomer resin (Tomeckova and Halloran, 2012, Chartier, 2012).
10
Chapter 2: Literature Review
Figure 2.2 Vat photopolymerisation AM system configuration for stereolithography apparatus (SLA)(SD3DPrinting, 2013).
Powder bed fusion 2.3.2
The process in this AM system involves selective fusing of regions of a powder bed by
thermal energy. AM system such as Selective Laser Sintering (SLS), and Direct Metal Laser
Sintering (DMLS) are examples of this process and are comparable in principle to SLA where
fine heat-fusible compacted powder is used instead of liquid resin. Once the powder is spread
on to a build platform by the roller from the powder-feed platform, a concentrated heating
laser beam selectively sintered the powder into the desired shape for each layer. The entire
fabrication is performed in a sealed nitrogen atmosphere chamber with maintained
temperature-control. The build platform moves down along with loose powder around the
formed layer; acting as a support for the next powder layer. Thus, no supports are required
with this method since the solid powder bed supports both overhangs and undercuts. This
saves some finishing time compared to vat photopolymerisation. Powder is spread with a
roller for the next layer and the process repeats until full object is formed. Excess powder is
simply brushed away, and final manual finishing may be carried out. Process parameters, such
as laser scanning speed and power, can be adjusted to control the strength and porosity of the
material (Hon and Gill, 2003, Pham and Dimov, 2003). No final curing is required as in vat
photopolymerisation; however, it may be necessary to infiltrate the object with another
material to improve the mechanical properties. SLS has a wider variety of materials available
11
Chapter 2: Literature Review
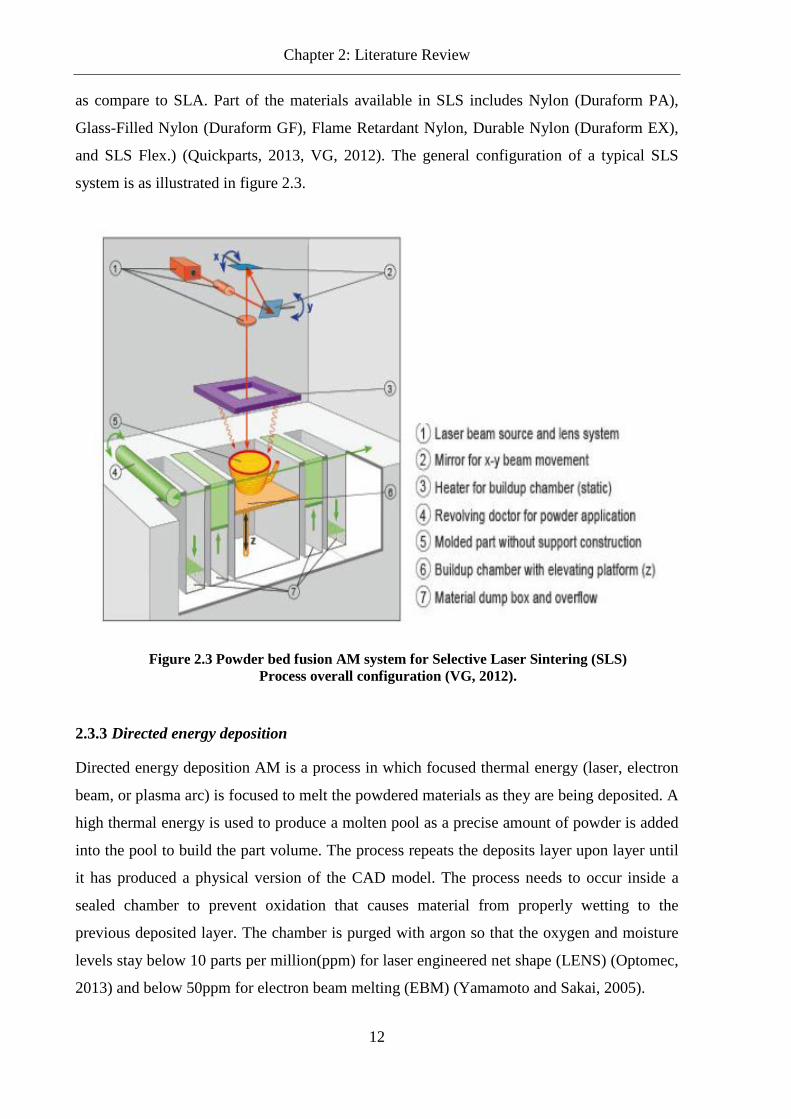
as compare to SLA. Part of the materials available in SLS includes Nylon (Duraform PA),
Glass-Filled Nylon (Duraform GF), Flame Retardant Nylon, Durable Nylon (Duraform EX),
and SLS Flex.) (Quickparts, 2013, VG, 2012). The general configuration of a typical SLS
system is as illustrated in figure 2.3.
Directed energy deposition 2.3.3
Directed energy deposition AM is a process in which focused thermal energy (laser, electron
beam, or plasma arc) is focused to melt the powdered materials as they are being deposited. A
high thermal energy is used to produce a molten pool as a precise amount of powder is added
into the pool to build the part volume. The process repeats the deposits layer upon layer until
it has produced a physical version of the CAD model. The process needs to occur inside a
sealed chamber to prevent oxidation that causes material from properly wetting to the
previous deposited layer. The chamber is purged with argon so that the oxygen and moisture
levels stay below 10 parts per million(ppm) for laser engineered net shape (LENS) (Optomec,
2013) and below 50ppm for electron beam melting (EBM) (Yamamoto and Sakai, 2005).
Figure 2.3 Powder bed fusion AM system for Selective Laser Sintering (SLS) Process overall configuration (VG, 2012).
12

Chapter 2: Literature Review
The AM systems included in this category are selective laser melting (SLM), electron beam
melting (EBM) (Figure 2.4a) and laser engineered net shape (LENS) (Figure 2.4b). Materials
that can be processed include stainless steel, aluminium alloys, titanium, cobalt-chrome and
tool steel (Wohlers, 2010). This AM method has an advantage over the powder bed fusion as
it can directly produce fully dense parts approaching the bulk material properties (Yasa et al.,
2011, Zhao et al., 2009). However, these AM systems are among the costliest with high
maintenance cost (refer Table 2.1)
Figure 2.4 Direct energy deposition AM system, (a) Electron beam melting (EBM) (Arcam, 2013) (b) laser engineered net shape (LENS) (Mechanicalengineeringblog, 2012).
13

Chapter 2: Literature Review
Binder jetting 2.3.4
The AM systems under binder jetting is rather similar to selective laser sintering, except that
an inkjet head is used to deposit a liquid adhesive compound onto the top layer of a bed of
compacted powder object material in place of the laser (Figure 2.5). This AM system derived
its concept from the printer and plotter industry. It utilizes inkjet technology to spurt
minuscule droplets to form layers of a 3D AM model onto a platform from the print head. The
particles of the powder become bonded in the areas where the adhesive is deposited. Once a
layer is completed, the piston moves down by the thickness of a layer. The ZPrinter from Z-
Corp uses this process. The materials available from this system are generally made from
starch.
Besides the normally uses natural polymers as well as plaster of Paris in combination with a
water-based ink, starch-based polymer and ceramic with organic binder had been used for 3D
printing (Warnke et al., 2010, Klammert et al., 2010, Khalyfa et al., 2007, Derby, 2005, Lam
et al., 2002). These AM systems are price at the lower end as compare to others AM systems
(Table 2.1).
Figure 2.5 Binder jetting AM system, Colour 3DP (dreams.me.vt.edu, 2009).
14

Chapter 2: Literature Review
Material Jetting 2.3.5
As with binder jetting AM system, this AM process too derived it concept from the printer
industry. Each individual jet dispenses on demand droplets of thermoplastic build material to
selective regions (Figure 2.6). Once the material is jetted on the build platform ultraviolet
lights (UV) that turn the resin into solid layer cure it. UV light, which is mounted alongside
the jetting head, is use to cure and harden each layer. The jetting head and platform which are
numerically controlled by the computer moves relatively to each other in the X, Y and Z
coordinate system to form each layer. Depending on the technique used either the jetting head
or the platform move in the Z direction to allow the jets to form subsequent layers. There are
various material jetting systems in the market, such as Sanders ModelMaker™, 3DS Multi-Jet
Modeling™, and 3DObject PolyJet™.
Figure 2.6 Material jetting schematic arrangement (Objet, 2008)
Material Extrusion 2.3.6
The AM process in which material is selectively dispensed through a nozzle or orifice is
classified as material extrusion AM system (Figure 2.7). Stratasys’ Fused Deposition
15

Chapter 2: Literature Review
Modelling system (FDM) is an example of this process as well as numerous open-source
material extrusions AM systems such as Fab@home, RepRap, Makerbot and Replicator.
The working principle of most material extrusion AM systems; except Fab@home that
extrude putties, involves heating thermoplastic polymer filament wire which is fed through a
heated extrusion nozzle head that is controlled numerically. The first layer is formed by the
deposition of very thin droplet of material onto the build platform. The temperature at the
platform is maintained lower than the heated thermoplastic filament in order for the
deposition to quickly harden. Consecutive layers are built layer by layer in the increment of
the slice thickness generated from the STL file by the FDM machine. Supports are built along
the way, fastened to the part either with a second, weaker material or with a perforated
junction. Upon removal of the part from the chamber, it hardens immediately when exposed
the temperature of the environment. Acrylonitrile butadiene styrene (ABS) elastomer,
polycarbonate, polyphenolsulfone, and investment casting wax are some of the materials use
in FDM. Material choices include production-quality ABS (red, yellow, green, blue, white,
and black), Polycarbonate (white), PC-ABS (black) and Food-grade ABSi material (Stratasys,
2014, Novakova-Marcincinova and Kuric, 2012).
Figure 2.7 Material extrusion Fused Deposition Modeling (FDM) System overall configuration (3DParts, 2011)
16

Chapter 2: Literature Review
Sheet Lamination 2.3.7
Sheet lamination AM process uses adhesive bonding or interfacial bonding (ultrasonic) to
form 3D objects. The first step is to create a base on which the sheet/foil can attach itself. For
adhesive bonding, a heated roller is used to melt the adhesive/polyethylene coating on the
paper so that each new layer will adhere to the previous layer whereas for interfacial bonding,
ultrasonic vibrations are locally applied to consolidate metal foil materials as solid-state
welding, held together under pressure. Materials are fed through with the aid of rollers.
Excess materials are trimmed off to create the required shape for the given layer in which, for
adhesive bonding, carbon-dioxide laser is used while in interfacial bonding, a computer
numerical control (CNC) contour milling is used. The deposit, trim and finish cycle continues
until the finished object has been manufactured; at which point it is taken off the base plate
and finished. Figure 2.8 shows the adhesive bonding AM process of a laminated object
modelling (LOM) system while figure 2.9 shows the interfacial bonding AM process of a
ultrasonic consolidation AM (UAM) system (Obielodan et al., 2010).
Figure 2.8 Sheet lamination AM system configuration LOM (Custompartnet, 2012).
17

Chapter 2: Literature Review
Figure 2.9 Sheet lamination AM system configuration UAM. (Fabrisonic, 2012).
Type of Application in AM 2.4
Since AM depends on the materials and methods use, the industries as well as academic seem
to have differences in conjugating a common term for this technique. Additive manufacturing
had been classified into liquid photopolymer solidification, molten material deposition,
discrete powder solidification, and solid sheets lamination (Levy et al., 2003, Pham and
Dimov, 2003, Pham and Dimov, 2001, Kruth et al., 1998). Depending on the material that is
being used, AM can be further subset into three general areas of applications; rapid
prototyping (RP), rapid tooling (RT), and rapid manufacturing (RM) (Mellor et al., 2014,
Gibson et al., 2010, Hon, 2007, Kamrani and Nasr, 2006, Noorani, 2006, Levy et al., 2003,
Kruth et al., 1998) as shown in figure 2.10 (Khan, 2010). Figure 2.10 illustrate AM
applications and their usage in numerous fields. The use of AM in the medical field can be
seen to being applied from the visualisation to mass customisation. This is not an exhaustive
list as further researches and new developments are realised; the application areas can be
expanded.
18

C
hapter 2: Literature R
eview
19
Figure 2.10 Applications areas in general subset of AM. These include RP, RT and RM in various form of usage in the medical fields (Khan, 2010).

Chapter 2: Literature Review
Rapid prototyping 2.4.1
Rapid Prototyping (RP) can be defined as building three-dimensional physical models directly
from 3D computer-aided design (Mavili et al., 2007) for the purpose of prototyping,
visualising, validating, form fitting, testing, surgical planning, diagnostic visualisation, and
training aids. These models can simplify significantly specialist communication on all levels,
minimise miscommunication and breakdown in communication between designers,
manufacturing engineers, and end-users during the design process became possible; or
between members of a surgery teams; the doctor, the radiologist and surgeon as well the
patient during surgical planning (Douglas, 2014, Melchels et al., 2010, Truscott et al., 2008,
Berce et al., 2005)
Moreover, RP process provide an alternative route for making prototypes of complex shapes,
intricate internal structures, parts within parts, and very thin-wall features and functional
models in a relatively cost-effective manner and faster as compared to the conventional
methods as prototype’s tooling is not required (Gibson et al., 2010, Bartolo and Bidanda,
2008, Hopkinson et al., 2005).
Uses of AM in product design development cycle have a positive influence on time and cost
(Wohlers, 2010, Bibb et al., 2000, Webb, 2000)
Rapid tooling 2.4.2
The utilizing of AM to produce tooling is referred to as rapid tooling (RT). RT constitute two
main categories, indirect tooling that use master patterns to produce a mould or die and direct
tooling that fabricate the actual core and cavity mould inserts (Nyembwe et al., 2013,
Nagahanumaiah et al., 2008, Dotchev and Soe, 2006). As AM began to evolve in terms of
materials and process, foundry and plastics industries began to apply AM to produce rapidly
patterns for casting in foundry and plastics industries, investment and die casting for medical
and dentistry, moulds and mould inserts, and small lot cast parts (Maji et al., 2008, Cheah et
al., 2005, Pham and Dimov, 2003, Levy et al., 2003). Figure 2.11 shows a couple of AM
methods that are used in RT applications.
20

Chapter 2: Literature Review
(a) (b)
Figure 2.11 Titanium implants with original RP as a master pattern in investment casting(a) and injection mould inserts(b) (CUT-CRPM, 2014, Turner, 2007)
Not only have numerous studies had been carried out on RT for use in the manufacturing and
engineering fields but also various works had been done in using RT for the production of
customised medical devices and implants such as stent and bone replacement applications
such as jaw bone, elbow bone, and knee (Melgoza et al., 2014, Warnke et al., 2010, Cohen et
al., 2009, Maji et al., 2008, Goodridge et al., 2006b, Chiang et al., 2005).
Rapid manufacturing 2.4.3
The application of using additive manufacturing system to produce end user products or parts
from CAD data directly is termed as Rapid Manufacturing (RM). It is the use of a CAD based
automated AM process to build or produce parts that can be directly used (Yan et al., 2009,
Hon, 2007). The underlying advantages of RM over CNC machining and injection moulding
are that; it provides geometric freedom in part design, capability of functional graded
material (FGM), potential of zero tooling, lowered or zero inventory requirements, single
material, single piece component in place of an assembly and after post sale, and mass
customisation (Hopkinson, 2006). Designers will have the creative freedom for producing
new designs that were impossible or impractical to manufacture with the removal of tooling
and manufacturing constraints. Rapid Manufacturing for customisation may involve the
production of custom part, replacement part, low volume part, or a series of mass produce
parts. Increasingly, rapid manufacturing is being applied to automotive, motor sports,
jewellery, dentistry, orthodontics, medicine, consumer products, and collectibles where there
21
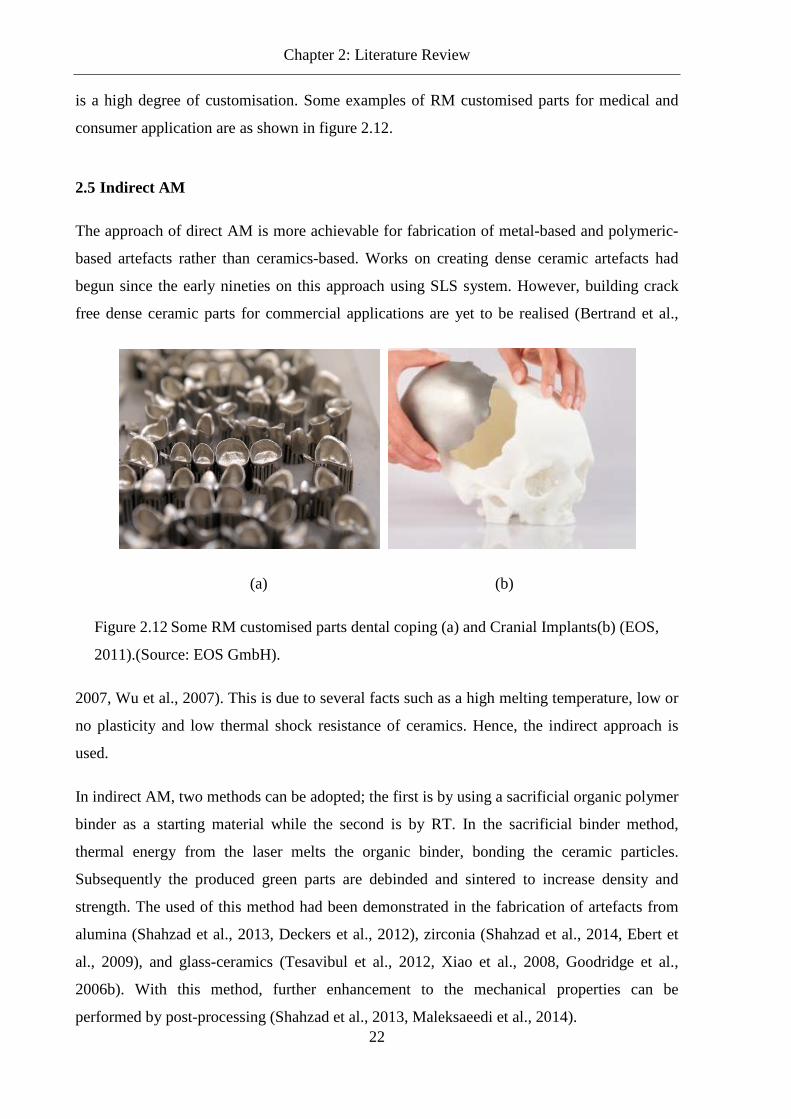
Chapter 2: Literature Review
is a high degree of customisation. Some examples of RM customised parts for medical and
consumer application are as shown in figure 2.12.
Indirect AM 2.5
The approach of direct AM is more achievable for fabrication of metal-based and polymeric-
based artefacts rather than ceramics-based. Works on creating dense ceramic artefacts had
begun since the early nineties on this approach using SLS system. However, building crack
free dense ceramic parts for commercial applications are yet to be realised (Bertrand et al.,
2007, Wu et al., 2007). This is due to several facts such as a high melting temperature, low or
no plasticity and low thermal shock resistance of ceramics. Hence, the indirect approach is
used.
In indirect AM, two methods can be adopted; the first is by using a sacrificial organic polymer
binder as a starting material while the second is by RT. In the sacrificial binder method,
thermal energy from the laser melts the organic binder, bonding the ceramic particles.
Subsequently the produced green parts are debinded and sintered to increase density and
strength. The used of this method had been demonstrated in the fabrication of artefacts from
alumina (Shahzad et al., 2013, Deckers et al., 2012), zirconia (Shahzad et al., 2014, Ebert et
al., 2009), and glass-ceramics (Tesavibul et al., 2012, Xiao et al., 2008, Goodridge et al.,
2006b). With this method, further enhancement to the mechanical properties can be
performed by post-processing (Shahzad et al., 2013, Maleksaeedi et al., 2014).
(a) (b)
Figure 2.12 Some RM customised parts dental coping (a) and Cranial Implants(b) (EOS,
2011).(Source: EOS GmbH).
22

Chapter 2: Literature Review
As for the second method, AM parts are used as master patterns (positive) or as sacrificial
patterns as practice in traditional casting techniques. Special materials have been created
precisely for this purpose, and it is a fast and inexpensive method in comparison to some
traditional methods, such as high-speed milling (Pham and Dimov, 2003). In this method
where special materials (Quickcast, RapidTool) are used, it is usually for validation of the tool
design before final production tooling is made. Conventional manufacturing processes such
RTV silicone rubber moulding, vacuum casting, reaction injection moulding (RIM), spin
casting, cast resin tooling were revised toward AM pattern-based processes for developing
mould rapidly, with varying costs, lead-times and process capabilities. The accuracy of these
processes depends much in part on the accuracy of the AM process used to create the pattern
(Dickens et al., 2000). Quail et. al (Quail et al., 2010), Rahmati et. al (Rahmati et al., 2007)
and Ramos and Simoes (Ramos and Simoes, 2009) performed research work in evaluating the
accuracy wax patterns created through RTV rubber moulding of AM master-pattern in the
suitability of this technique for the manufacturing of lost wax parts.
Table 2.1 list some of the AM systems that are can be used in direct and indirect rapid tooling.
The AM systems that are capable of direct RM of polymer and metal are expensive with price
starting from £130,000 onward especially for direct metal AM systems.
Design in AM 2.6
The approach in producing artefacts using AM is the opposite of subtractive manufacturing
processes. A lot of design guides have been developed for these subtractive processes.
However, when designing artefacts that are to be manufactured by utilising AM as the
manufacturing process, designers need a different approach. Most AM systems have the
benefits of freedom in geometrical shape definition as well as tooling independent (Hoque et
al., 2012, Mansour and Hague, 2003, Hollister et al., 2002, Bernard and Fischer, 2002).
Hence, one of the pulling factors for using AM is in the design environment as it offers the
capacity of producing parts with unlimited geometry complexity and shape of complex
organic structures can be designed and be fabricated (Liu et al., 2014, Rainer et al., 2012,
Parthasarathy et al., 2011, De Beer et al., 2008). Conventional manufacturing’s cost is highly
dependent to the geometry complexity, therefore with lower cost combined with design
freedom; both manufacturer and customer will benefit (Hoque et al., 2012, Truscott et al.,
2008, Ruffo et al., 2006). With the help from AM, designers have unrestrained freedom to
design for customisation rather than to design for manufacturing and assembly. So products
23

Chapter 2: Literature Review
can be designed to fit the user rather than the other way around. The only limitation is the
designer’s imagination and the design tools. So with the opportunities created from AM
technologies, the concept of Design-for-Manufacturing and Assembly (DFMA) can evolve
into Manufacturing-for-Design using AM (AMFD) with new design guidelines (Hoque et al.,
2012, Diegel et al., 2011, Hopkinson et al., 2006, Hague et al., 2004).
The AM design rules can be summarized as the following (Atzeni et al., 2010):
• Avoid observing, reverse engineering, and designing to conventional manufacturing
guidelines and design principles,
• Take advantages from AM technologies capabilities,
• Rethink the whole assembly towards integrated freeform design,
• Reduce the parts count by intelligent integration of functions and
• Optimise the design towards maximum strength with minimal materials usage (and
therefore as little energy as possible).
Ponche et al. (Ponche et al., 2012) suggested that a global approach in DFM be structured on
the issues of manufacturing process characteristics and parts design functional specifications.
Thus, designers can optimise the geometry to address functional specifications and choose the
ideal AM process characteristics for fabrication. Various research works had been conducted
on these issues which involved developing tools for the selection of AM system with regard
to design (Borrille and Gomes, 2011, Ghazy, 2012) and topology optimisation using AM
(Brackett et al., 2011, Gardan, 2014).
Table 2.1 AM machine specifications as adapted (Aniwaa, 2014, Namii, 2013). AM Process Categories
Entry Level Method Printable Materials
Pric
e
USD
1000
(£10
00)
Bui
lt A
rea
in
ches
(mm
)
Res
olut
ion
(mm
)
Dir
ect
Indi
rect
Met
als
Plas
tics
Cer
amic
s
Bio
Binder Jetting
Z-Corp USD15 (£9.3)
9.3x7.3x5.0 (236x185x127) 0.1 X X
ExOne USD150 (£95)
1.5x2.3x1.5 (38x58x33) 0.100 X X X
24

Chapter 2: Literature Review
Directed Energy
Deposition
Electron Beam
Direct
Manufacturing
(EBDM)
See manufacturer
7.87x7.87x7.09 (200x200x180) 0.050 M, P X X
Direct Metal
Deposition (DMD) See
manufacturer See manufacturer M X X
Laser
Engineered
Net Shaping
(LENS)
See manufacturer See manufacturer M, P X X
Material Extrusion
Fused Deposition
Modeling (FDM) USD35 (£23)
10x10x12 (254x254x305) 0.178 P X X
Fused Filament
Fabrication (FFF) USD10 (£6.3)
5x5x5 (127x127x127) 0.178 P X X X
Bio plotter USD125 (£77.7)
5.91x5.91x5.51 (150x150x140)
0.001 X X
Powder Bed Fusion
Direct Metal Laser
Sintering DMLS USD210 (£130.6)
1.97x1.97x3.15 (50x50x80) 0.05 M X X
Selective Laser
Sintering (SLS) USD725 (£559)
22x22x18 (560x560x457) P X X X
Sheet Lamination X X
LOM USD39 (£24.2)
10.08x6.65x5.91 (256x170x150) 0.19 X X
UAM P, M X X X
Vat Photopolymerization
Stereolithography
Apparatus (SLA) USD200 (£132)
10x10x10 (254x254x254) 0.050 P X X X
Digital Light
Projection(DLP) USD15 (£9.3)
1.57x1.18x3.94 (40x30x100) 0.100 P X X X
Material Jetting
25

Chapter 2: Literature Review
Aerosol Jet (AJ) USD299 (£127)
3.9x3.9x3.9 (99x99x99) 0.025 M X X X X
Thermal Spray (TS) M X
Ink jet (IJ) USD30 (£19.8)
8x10x8 (203x254x203) 0.100 X X X X
Laser Direct
Structuring (LDS)
See manufacturer See manufacturer M X
STL file format. 2.7
The common factor in all of the AM technologies uses the same file format to print the 3D
artefacts. Standard Tessellation Language or commonly known as stereolithography file
format (STL) is the use of surface tessellation to define the original 3D part. The STL model
is essentially a triangulated surface model of the original part. The STL format is an
approximate representation of a true solid-surface model, and a huge amount of STL data is
needed to provide sufficient accuracy for AM. STL files are surface approximations of
models generated by CAD, reverse engineering (RE) data or 3D reconstruction data from 3D
image processing.
As mentioned, the STL format is the dominating data format in AM data processes. The basis
of an STL data set is the description of model surfaces by triangulation. The STL format is a
tessellation representation, which defines a 3D object by a series of triangular facets. Each
triangular facet is defined by three vertices and a unit normal vector for the facet where the
normal vector direction indicates the outside of the object (Lin and Liang, 2002). Figure 2.13
shows the description of a triangular facet needed for triangulation. The attributes and
coordinates of an STL data set can be written as an ASCII (American Standard Code for
Information Interchange) file or a binary file. The STL format allows for both ASCII and
binary representations. A binary file creates a small data volume as compared to ASCII source
code; which is easier to read.
In a triangulated model, all surfaces of the part are transformed to a mesh of triangles.
Generally, increasing the number of triangles increase the dimensional accuracy of the
complex and curved surfaces in the original part but also the amount of data.
26

Chapter 2: Literature Review
The more triangles are used; the more accurate the representation is (Figure 2.14). As shown
in Figure 2.14a the number of vertices and faces are 622 and 1240 with a file size of 61KB
respectively while in Figure 2.14b the number of vertices and faces are 2481 and 4958 with a
file size of 243KB, an increase of 4 folds. Thus, when higher surface qualities are required,
the volume of data tends to increase disproportionately to the designated accuracy.
Figure 2.13 Format of a triangular facet for STL file.
Figure 2.14 An STL file format model of a section of a mandibular image showing the surface triangulation with mesh reduction using Meshlab software. (a) Low number of triangulation and (b) High number of triangulation.
27

Chapter 2: Literature Review
Various algorithms are used in extracting medical imaging data. One of which is marching
cubes algorithms (Lorensen and Cline, 1987) and is normally used in extracting isosurfaces
from MRI or CT datasets for reconstruction of the human organs in medical visualisation.
But the marching cubes algorithms produce meshes with redundant information as with other
algorithms. Hence, the amounts of data from 3D reconstructions medical imaging are
predictably high. To improve work with medical models, mesh reduction and smoothing
algorithms are frequently used before the models are imported into virtual reality environment
(Riener and Harders, 2012). In order to utilise low-to-midrange software and hardware, some
compromises need to be made such that the data generated are within the capability of the
low-to-midrange CAD system and the acceptable accuracy of the medical model. Otherwise,
without post-processing of the acquired imaging data, specialised software and hardware will
be required to create and model medical artefacts. This will increase the initial fix cost and the
computing cost. However, it should be pointed out that it is crucial to keep the CAD model
accuracy as close to the medical imaging data model as possible. With accurate post-
processing using suitable algorithms on medical imaging, the dataset can be maintained low
and aided in faster arithmetic operations for the CAD system. This has been proven with work
by Young (Young, 2008) in which by using grid-based segmentation algorithm for mesh
reduction, inexpensive and commonly available hardware platforms can generate structural
models from scaffolds through to complete human head in a straightforward, robust, accurate
and efficient manner. Difficult problems in CAED simulations and numerical analysis can
now be performed from on accurate medical models generated from mesh reduction
algorithm.
In AM for medical applications, most of the CAD software can translate the original CAD
model into STL format and is usually sufficient for practical purposes. However, 3D scanner
data model either from magnetic resonance imaging (MRI), 3D scanner or computed
tomography (CAT) scanner is not suitable to be used as design model for CAD software as it
is always exported in 3D stl format. The STL file needs to be post-processed before it can be
used in CAD software as most CAD software are either based on parametric constructive
solid geometry (CSG) or non-uniform boundary representation solid (NURBS).
Natural Bone 2.8
Natural bone is a dense connective and highly vascular tissue that plays a vital part providing
essential functions and protection for both muscles and organs. Bone is a composite material
28

Chapter 2: Literature Review
containing both organic (living cells such as osteoblasts, osteocytes and osteoclasts and
extracellular matrix) and inorganic components (mineral; predominantly calcium phosphate)
which by weight contains about 60% mineral, 30% matrix and 10% water (Athanasiou et al.,
2000). The organic component is predominantly responsible for the tensile strength while the
mineral component of calcium phosphate is accountable for the compressive strength. In
general, bone consists of two different structures: compact bone (cortical bone) and spongy
bone (trabecular or cancellous bone). Cancellous, the inner part of the bone is spongy in
nature having 50% to 90vol% porosity while cortical bone is the dense outer layer of bone
with less than 10vol% porosity. Compact bone has a compressive strength in the range of 131
to224 MPa, and a Young’s modulus ranging from 17 to 20GPa, while compressive strength
and Young’s modulus for trabecular bones are 5 to 10MPa and 50 to 100MPa, respectively
(Navarro et al., 2008, Athanasiou et al., 2000, Yaszemski et al., 1996). Thus, bone is also a
porous material with continuously varying degree of porosity in the mature bone at 5% to
95%. The porosity and pore size of cancellous bone is much greater than that of cortical bone:
cancellous bone has 75% to 85% porosity with 300 to 600µm diameter pores and cortical
bone has 5% to 10% porosity with 10 to 50µm diameter pores. In its natural hydrated state,
cortical bone has a compressive strength (σ) of 110 to 150MPa, and Young’s modulus (E) of
18 to 22GPa, while cancellous bone has a compressive strength and Young’s modulus of 2 to
6MPa and 0.1 to 0.3GPa, respectively (Novitskaya et al., 2011, Chen and McKittrick, 2011).
Bone Graft Substitute (BGS) Materials. 2.8.1
As bone is a living tissue that continuously remodels, bone undergoes dynamic remodelling,
maturation, differentiation, and resorption. Figure 2.15 shows the cycle of bone remodelling.
Remodelling tend to occur on bone surfaces in which the removal of old bone tissues by
osteoclasts are replaced with mineralised osteoblast cells within the formed cavity.
29

Chapter 2: Literature Review
Figure 2.15 Bone remodelling cycle(Umich.edu, 2005).
The remodelling process is governed and induced by biological and mechanical means (Hill,
1998). As bone and bone tissue are prone to degradation due to aging and damage from
trauma, disease wear or congenital defects, replacement materials are needed to support the
bone regeneration. However; for large-scale bone defects, it cannot be healed completely by
the body. In most cases, external intervention is needed to restore normal operations (Seitz et
al., 2009, Jones et al., 2007).The surgical procedure of autografts (bone taken from the same
person’s body) and allografts (bone tissue from donor) as well as artificially synthesized
materials are the main methods use for bone repair. The pre- and post-surgical procedures of
bone repair and implantation through bone grafting are costly. In 2005 there were more than
500,000 bone graft procedures performed in the U.S. costing USD2.5 billion (Laurencin et al.,
2006) and in the United Kingdom 150,000 fractures each year costing £900 million
(Chrischilles et al., 1994) This will tend to increase as the populations are living longer.
Although autografting has been the golden standard, it has several limitations including
patient pain, cost, and limited supply. As alternatives, allograft and xenograft have been
studied due to its abundant source. However, both alternatives had theirs drawbacks that
include the uncertainty of compatibility and disease transmission. To overcome the limitations
of autograft, allograft and xenograft, synthetic materials have been developed as
replacements. As it is essential not only to replace bone tissues with materials that provide
mechanical support but also a mechanism for tissue propagation. Hence, increasing bone
30

Chapter 2: Literature Review
tissue engineering or bone scaffolds researchers are focusing in methods to synthesize,
regenerate bone for restoration, maintenance or improvement from biocompatible and
bioactive materials. Thus, in order for defective bone to be remodelled and regenerated, the
bone graft substitute must not only be biocompatible but must also needs to be integrated with
the host tissues (osseointegration) and provide a 3D template upon which cells may adhere,
proliferation and eventually produce (ECM) (osteoinductive and osteoconductive). With these
requirements, a move toward ‘bioactive’ materials from ‘bio-inert’ materials in the design of
implantations have prompt much research work in the last two decades in materials such as
either bioactive ceramics, bioactive glasses, biological or synthetic polymers, biodegradable
polymers, and composites of all these bioactive and biodegradable materials (Tan et al., 2013,
Hench and Polak, 2002).
Fixation of bone graft substitute. 2.8.2
Attachment of BGS can be categorised as temporary implants and permanent implants.
Temporary implants require the use of removable parts such as plates, nails, screws, pins,
wires, and rods in order to secure the fixation. A secondary operation is often performed to
remove temporary fixator after bone healing. This often creates additional discomfort to the
patient and extra financial burden.
Permanent implants on the hand do not require a secondary operation after healing as these
implants will last much longer than the temporary implants. More often it will last longer with
little wear in 20 years (Dowson, 2006). Hence, the permanent implants need to be durable. As
such most of the permanent implants are made from bioinert metal. These metal prostheses
frequently deployed in the treatment of hip and knee replacement are normally fabricated as
solid, dense components. Therefore, the fixations of the prostheses are by morphological
technique. In this technique the implants are secured by bone in-growth on to the surface
irregularities either from press–fitting, cementing using bone cement like PMMA or joining
using threaded components. However, there is a compromise as most of these implants
usually has much higher modulus than the bone. This resulted in implants loosening due to
stress shielding as load is relocated from the bone to the implants, a condition known as bone
resorption.
Due the shortcoming in metallic implants, biomimetic implants have been foreseen as the
most logical solution. Biomimetic scaffolds are defined as scaffolds that have material
31

Chapter 2: Literature Review
characteristics, morphology, and structural properties that mimic the natural bone graft
(Simske et al., 1997). Hence, a secure fixation can be achieved by having the scaffolds fulfil
the biological, mechanical and geometrical constraints of the natural bone. The fixation can be
achieved through biological fixation technique or bioactive fixation.
In biological fixation technique, textured or porous implant allows tissue ingrowth into the
openings, thus stabilising it. In order to encourage bone regeneration, the pores size should be
in the range of between 100-500µm and interconnected (Karageorgiou and Kaplan, 2005).
However, the manufacturing complexity in producing this type of porous implants using
conventional manufacturing methods cause the price of the prostheses to be costlier than
dense prostheses. As for bioactive fixation technique, fixations are attained through the
formation of direct physiochemical bond with the bone tissue. The material used in forming
these types of prostheses is bioactive ceramics or bioactive composite.
In order to satisfy bone healing and regeneration mechanisms, various research works
conducted using different materials and designs were based on either biodegradable, bioactive
or biocomposite (Butscher et al., 2011b, Warnke et al., 2010, Saito et al., 2010, Wang et al.,
2009, Ramin and Harris, 2009, Porter et al., 2009). These materials are mainly from the
bioceramics families and biopolymers families.
Bioceramic and glass-ceramics 2.9
Ceramics and glasses have been used for a long time in the medical industry, and the first
cited implementation of bioceramics as biomaterials was in 1963 (Smith, 1963, Hulbert et al.,
1982). Ceramics and glasses utilized in the repair and reconstruction of diseased, damaged, or
worn-out parts of the body musculoskeletal system are termed bioceramics. Bioceramics may
be bioinert such alumina and zirconia; resorbable such tricalcium phosphate; bioactive such
hydroxyapatite, bioactive glasses, and apatite-wollastonite glass ceramics; or porous for tissue
ingrowth such metal-coated hydroxyapatite and alumina (Hench, 1998). The potential of
bioceramics as implants is based on their compatibility with the physiological environment.
The biocompatibility is related to their compositions that contain ions, such as sodium,
potassium, calcium, magnesium, phosphorus, and ions showing limited toxicity to body
tissues, such as alumina, zirconium, and titanium, commonly found in the physiological
environment (Hench and Wilson, 1995, Hench and Andersson, 1993, Hench, 1991).
Bioceramic applications included replacement of hips, knees, teeth, tendons, and ligaments
32

Chapter 2: Literature Review
and repair of periodontal disease, maxillofacial reconstruction, augmentation and stabilization
of the jaw skeletal substance, iliac spacers, spinous spacer, intervertebral spacers, middle-ear
implants and bone fillers after tumour surgery and to augment both hard and soft tissues.
Table 2.2 and figure 2.17 summarized the forms and phases of bioceramics and their many
different functions in the repair of the body (Hench and Wilson, 2013). In many applications,
bioceramic materials in bulk form are used for implants and prosthetic devices while the
granule and powder are used for space fillers and coating, or as a secondary phase in the
production of composite to improve both mechanical and biochemical properties (Hench and
Wilson, 1995, Kokubo, 1991a). Glass-ceramics have generated interest as possible choice
material for the repair and reconstruction of diseased, damaged, or worn out parts of the hard
tissues of the body, owing to their biocompatibility with living tissues (Chevalier and
Gremillard, 2009, Arcos et al., 2009, Vitale-Brovarone et al., 2007, Navarro et al., 2004).
Some of the approved glass-ceramics have been marketed under commercial trade name such
as Bioglass®45S5 Novamin, Cerabone® ( apatite-wollastonite), BonAlive®, NovaBone®,
Dicor® (mica glass-ceramic), Ceravital® (apatite devitraite glass-ceramic), Ilmaplant L1,
Bioverit® I (mica-apatite glass-ceramic) and Bioverit® II (mica glass-ceramic). Table 2.3
gives some of the mechanical properties of natural and bioceramics materials.
Table2.2 Form, Phase and Function of Bioceramics (Hench and Wilson, 2013, Hench
and Kokubo, 1998).
Form Phase Applications Function
Powder Polycrystalline, Glass Repair of periodontal
defects, fixation of
revision arthroplasty,
cranial repair
Space-filling,
therapeutic treatment,
regeneration of tissues
Coating Polycrystalline, Glass Fixation of hip prostheses Tissue bonding,
thromboresistance,
Corrosion protection Glass-Ceramic
Bulk Single Crystal Middle ear prostheses,
vertebral prostheses,
orbital floor prostheses,
Iliac crest prostheses
Replacement and
augmentation of
tissue, replace
functioning parts
Polycrystalline, Glass
Glass-Ceramic Composite
(Multi-Phase)
33

Chapter 2: Literature Review
Glass-Ceramic 2.9.1
Materials which are produced as glasses initially and then converted to ceramics by
rearrangement of a random structure (glass) to an ordered structure (crystalline) through
heating to improve their properties are known as glass-ceramics. Glass-
ceramics are polycrystalline materials formed by controlled crystallization of a base glass, in
which the crystalline phases are nucleated and grown in a glass by means of a heat treatment
or heat treatment together with pressure application (El-Meliegy and van Noort, 2012, Holand
and Beall, 2012, Rawlings et al., 2006). Their properties are controlled by the mineral phases
created. The relation between the mineral phases (the primary phases), the glassy phase (the
secondary phases), and the incorporated porosity in medical ceramic is termed ceramic
microstructure. The microstructure and chemical composition of a glass-ceramic both
determine the general physical, chemical, optical, biological, and mechanical properties of the
final material (El-Meliegy and van Noort, 2012, Holand and Beall, 2012). Thus, glass-ceramic
materials share many properties with both glasses and ceramics.
Glass–ceramics are generally fabricated from starting materials, which naturally occur as
minerals and rocks or their extracted reagent grade derivatives. The manufacture of a glass-
ceramic involves three general steps (El-Meliegy and van Noort, 2012, Holand and Beall,
2012):
1. Raw materials, oxides, and nucleating agents are prepared for a glass-forming batch.
2. The batch is melted and then cooled to a temperature within the transition range to
yield a glass.
3. The glass is then heated to a temperature above the transition range to perform glass
crystallization.
The crystallisation process occurs when an ordered crystalline array is generated from the less
ordered glass structure through the processes of nucleation and crystal growth
(crystallization). In the nucleation process, longer range atomic order than the amorphous
glass matrix regions are formed and developed spontaneously into a stable crystalline phase.
Nucleation is presumably influenced by two general factors (Holand and Beall, 2012):
1. Appropriate selection of the chemical composition of the base glass with the usual
addition of a nucleating agent
2. Controlled heat treatment of the base glass.
34

Chapter 2: Literature Review
Frequently, the glass body is exposed to a two-stage heat treatment. In this treatment, the
glass needs to be heated initially to a temperature within or somewhat above the transition
range for a period of time sufficient to induce the development of sufficient nuclei in the
glass. Thereafter, the temperature needs to be increased to levels approaching or above the
softening point of the glass to induce the growth of crystals upon the nuclei. The general
profile for the production of glass ceramics manufacturing schedule is shown in figure 2.16,
where it starts with melting of the base glass. It is crucial that nucleation be optimised during
the manufacturing schedule as it is a key factor in the controlled crystallization of a glass-
ceramic (El-Meliegy and van Noort, 2012, Holand and Beall, 2012). Current bioactive glass
ceramics include apatite glass ceramics, apatite–mullite glass ceramics, apatite–wollastonite
glass ceramics, fluorcanasite glass ceramics, and potassium fluorrichterite glass ceramics.
Figure 2.16 Manufacturing schedule for the production of glass ceramics.
35
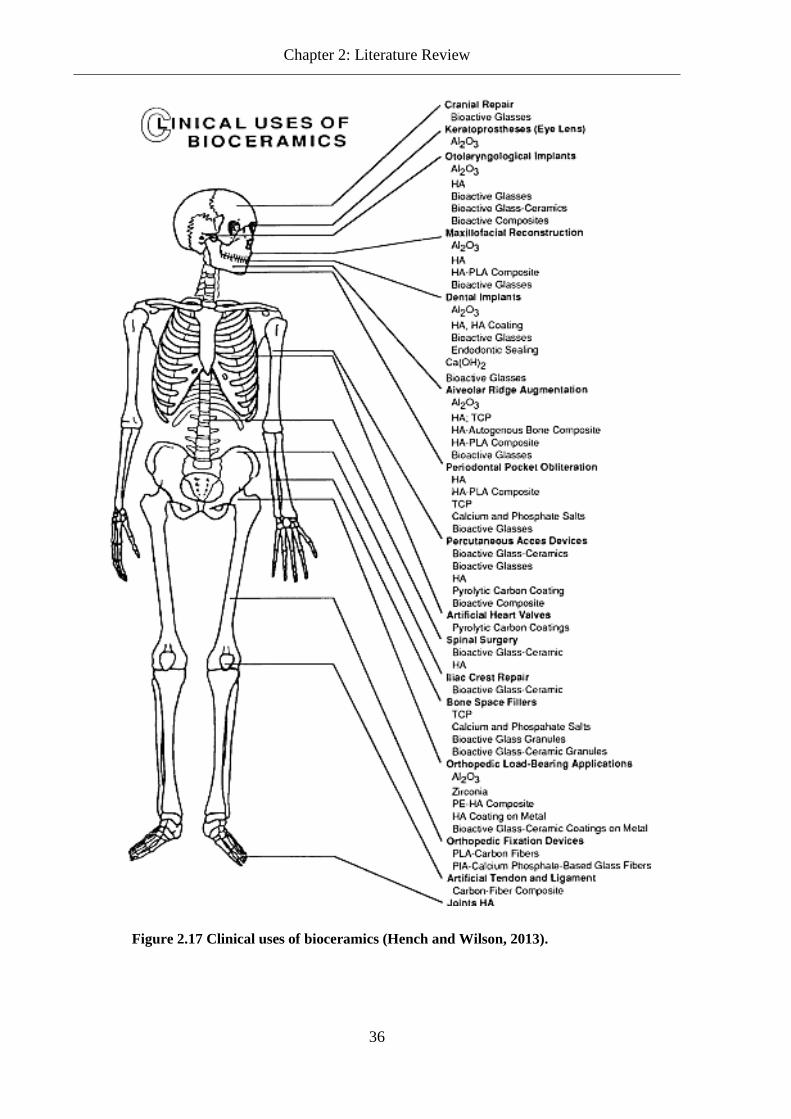
Chapter 2: Literature Review
Figure 2.17 Clinical uses of bioceramics (Hench and Wilson, 2013).
36

Chapter 2: Literature Review
Table 2.3 Mechanical properties of Bioceramics and Bone (Hench and Kokubo, 1998, Zanotto, 2010, Ben-Nissan and Pezzotti, 2004).
Young’s Modulus E (GPa)
Compressive Strength (MPa)
Tensile Strength (MPa)
Density (g/cm3)
Fracture Toughness (MPa√m)
Bioceramics Alumina Al2O3 366 - 420 4400 282 -551 3.98 3 – 5.4 Zirconia ZrO2 201 - 220 1990 800 –
1500 5.74 – 6.08 6.4 -10.9
Silicon Nitride 304 3700 700 – 1000
3.3 3.7 – 5.5
Hydroxyapatite 7 - 13 350 - 450 38 - 48 3.05 – 3.15 Dense sintered β-3CaO.P2O5
4 7 21
Glass-ceramics
BioGlass 45S5 35 - 42 2.66 Cerabone 118 - 120 1080 215 *(3-
point flexural test)
3.07 2.0
Bioverit I 70 -90 500 140 - 180*(3-point flexural test)
2.8 0.5 - 2.1
Na-Ca-Si-P-O system based Highly bioactive glass ceramic
70 210*(3-point flexural test)
2.6 0.95
Natural Bone Cortical Bone 3.8 - 11.7 88 - 164 82 - 114 1.7 – 2.0 2 - 12 Cancellous 0.2 – 0.5 23 10 -20
Apatite Wollastonite glass-ceramics 2.9.2
AW glass ceramics (AW-GC) discovered in 1982 by Kokubo et al. (Kokubo et al., 1982) has
generated much responses and interests among the bioceramic community in the biomedical
field due the biological ability to bond spontaneously to living bone in a short period, and
maintenance of high mechanical properties such as toughness and strength for a long period in
a body environment (Yamamuro, 2013, Kokubo et al., 2003, Kokubo et al., 1986). The
microstructure of AW-GC contains apatite, wollastonite and whitlockite crystalline phases.
The crystallinity in AW-GC influences the mechanical properties as with most glass-ceramics
(Hench and Wilson, 2013, El-Meliegy and van Noort, 2012, Holand and Beall, 2012). AW-
37

Chapter 2: Literature Review
GC is a matrix of small apatite particles effectively reinforced by wollastonite phase. The
apatite induces the biological ability of AW-GC to bond instinctively to living bone, while the
wollastonite prevents straight propagation of cracks and promotes a reinforcing effect
(Kokubo, 2008, Kokubo et al., 1986) AW-GC has higher value of the bending strength,
fracture toughness and Young’s modulus among bioactive glass and glass ceramics which
makes it useful in major compression load bearing applications (Best et al., 2008). As AW-
GC exhibit good mechanical and biological ability, clinical use of AW-GC in either powder
form or bulk materials are found in specific applications such as bone filler, iliac crest
prostheses, artificial vertebrae, intramedullary plug, spinal spacers, and intervertebral spacers
(Fujita et al., 2000, Kobayashi et al., 1998, Kitsugi et al., 1989, Ono et al., 1988). Table 2.4
shows some of the physical and mechanical properties of AW-GC. As shown in Table 2.4, the
high degree of mechanical properties as compared to human cortical bone is due to the
existence of β-wollastonite phase which increases the fracture energy, a result from
precipitation of wollastonite crystals (Kokubo et al., 1986).
The bioactivity of AW-GC through the apatite phase encourages growth and proliferation of
bone tissue on the surface. Kokubo demonstrated the dissolution of calcium (Ca) and silicate
(SiO2) ions from glass ceramics as a critical part of forming bone-like apatite layer on the
surface in an in vivo test (Kokubo, 1991a). The mechanism of apatite layer formation has
been thoroughly described by Jones and Hench (Jones and Hench, 2001). AWGC contains a
glassy phase which releases more Ca ions in the early post-implantation stage than
hydroxyapatite (HA), and it releases silicate ions which initiate crystallization of apatite as
their nuclei on the surface of the implant.
Table 2.4 Physical and mechanical properties of A-W glass-ceramic (Kokubo, 2008, Kokubo et al., 1986)
Property Value Density (g/cm3) 3.07 Bending strength (MPa) 215 Compressive strength (MPa) 1080 Young’s modulus (GPa) 118 Vickers hardness (HV) 680 Fracture toughness (MPa.m0.5) 2.0
Table 2.5 shows the bonding ability of selected bioceramic materials in in vitro studies. It
show that AWGC bonding ability to bone is better and that AWGC binds to bone more tightly
than hydroxyapatite, which is currently available for the repair of bone and joints defects
38

Chapter 2: Literature Review
(Yamamuro, 2013, Kokubo, 1991a). The chemical composition of AWGC is in the MgO-
CaO-SiO2-P2O5 system and made from reagent grade chemicals of MgO, CaCO3, SiO2,
CaHPO4.2H2O, and CaF2 (Kokubo et al., 1986).
Table 2.5 Failure loads obtained by detaching test between rabbit tibia bones and bioceramics after 8 weeks implantation (Yamamuro, 2013, Hench and Kokubo, 1998).
Bioceramic. Failure Load ± Standard deviation(kg) Alumina 0.18 ± 0.018 BioGlass® 2.75 ± 1.80 Ceravital® KGS-type glass-ceramic 3.52 ± 1.48 Natural polycrystalline calcite 4.11 ± 0.98 Dense hydroxyapatite 6.57 ± 1.36 Dense sintered β-3CaO.P2O5
4 7.58 ± 1.97 Cerabone® A-W glass-ceramic 7.44 ± 1.91
Biodegradable polymer 2.10
Polymers are macromolecules of repeated subunits forming molar masses ranging from
thousands to millions. Polymeric materials occurred naturally or as synthetic, are created via
polymerisation of monomers. A polymer is synthesized by chemically joining together many
small molecules into one giant molecule. Cellulose, collagen, keratin, starch, lignin, chitin,
and various polysaccharides are natural polymers and as such provide specific biological
activities in tissue engineering (TE). But natural polymers lack controllability over molecular
weight that influence the degradation rate, and mechanical properties (Matthew, 2002)
hindered its full usage in TE. In contrast, synthetic polymers can be designed with specific
molecular and physical properties by a wide range of different monomers combined to form
copolymers and to control the polymerisation. Therefore, synthetic polymers can achieve
batch-to-batch uniformity, predictability and reproducibility in mechanical and physical
properties. However, synthetic polymers lack the biological activities associated with natural
polymer and thus pose the risks of toxicity and immunogenicity as opposed to natural
polymers which degrade enzymatically to nontoxic subunits which can be utilised by adjacent
cells (Matthew, 2002). Synthetic polymers are generally preferred as implants due to the
minimal site-to-site and patient-to-patient variations as compared to enzymatically degradable
polymers (Katti et al., 2002).
Both types of polymers have gained much attention in industrial and medical applications in
the past decades in which they are used extensively as biomedical materials in prosthetic,
39

Chapter 2: Literature Review
dental, implants, dressings, pacemakers, polymeric drug delivery systems, and tissue
engineered. Typical polymeric biomaterials (biopolymers) used as TE materials are
bioresorbable and biodegradable polymers. These polymers do not require surgical removal
and hence are preferred for biomedical applications. However, since they degrade to smaller
absorbable molecules, it is vital to ensure that the monomers are non-toxic in nature and must
meet the followings (Lloyd, 2002):
1) The implantation of the material should not induce inflammatory or toxic response in the
body.
2) The shelf life of the material should have acceptable duration.
3) The degradation time of the material should match the healing or regeneration process.
4) The material should have appropriate mechanical properties for the designated application
and the variation in mechanical properties with degradation should be compatible with the
healing process.
5) The degradation products should be nontoxic, and be able to metabolize and cleared from
the body.
6) The material should have appropriate permeability and processibility for the intended
application.
Biodegradable polymers with differ molecular weight (MW), polydispersity, crystallinity,
structure and thermal transition allowing mechanical properties and degradation kinetic are
well tailored for bone defects generation. Synthetic biodegradable polymers are poly
(α−hydroxy acids), polycaprolactone (PCL) and poly (ester-urethane) urea (PEUU). The most
commonly used biodegradable polymers in bone regeneration are from the poly (α-hydroxy
acids) which includes poly (lactic acid) (PLA) and poly (glycolic acid) (PGA) homopolymers
as well their co-polymers poly (Lactide-co-glycolide) (PLGA) as they promote
biocompatibility and biodegradability which allow cell growth (Nair and Laurencin, 2007).
The structural formulas of the four basic polymers are given in table 2.6.
40

Chapter 2: Literature Review
Table 2.6 Chemical Structure of biodegradable polymers.
Biopolymer Chemical Structure
PLA
PGA
PCL
PLGA
The earliest biodegradable poly (α−hydroxy acid) that has been used for three decades as
suture and reinforcement material in surgical operation is PGA (Lewandrowski, 2002). PGA
is a biodegradable, thermoplastic polymer of highly crystalline polymer (45-50 %
crystallinity) with simple linear, aliphatic polyester. However, with its rapid degradation,
acidic degradation products and low solubility, PGA application is limited even though it has
excellent mechanical properties due to high crystallinity. Due to its good initial mechanical
properties, polyglycolides have been investigated as a self-reinforced composite materials for
bone internal fixation devices (Tormala, 1992). Thus to widen the application of
biodegradable polymers, longer biodegradation period polymers have been developed, one of
which is PLA. PLA an agro-based polymer type is derived from plants such as corn, tapioca
and sugarcane. It is a renewable resource and environmentally responsible. PLA is a chiral
molecule and therefore it exists in two stereo-isomeric forms, l-lactide and d-lactide, D, L-
PLA, is also available. The polymers derived from the optically active D and L monomers are
semi-crystalline materials, while the optically inactive D, L-PLA is always amorphous.
Poly(l-lactide) has good tensile strength, low extension and a high modulus (approximately
4.8GPa) with slow-degradation as compared to polyglycolides, and hence, has been
considered for load-bearing applications, such as orthopaedic fixation devices (Middleton and
Tipton, 2000, Bergsma et al., 1995). However as PLA warps and degrades more quickly when
exposed to excessive heat or humidity and lose its strength in approximately 6 months when 41

Chapter 2: Literature Review
hydrolysed with no significant changes in mass for total resorption in vivo between 2 and 5.6
years (Middleton and Tipton, 2000) , there is a significant obstacle in using PLA in specific
applications. Therefore, current development of biopolymers with better property variation is
under investigation for several co-polymers of l-lactide or dl-lactide with glycolide. Table 2.7
displays the mechanical properties of biodegradable polymers. The glass transition
temperatures (Tg) of the PLGA copolymers are slightly above the physiological temperature
of 37oC and hence they are glassy in nature. Thus, they have a fairly rigid chain structure
which gives them significant mechanical strength to be formulated as drug delivery devices.
The lactide-rich PLGA copolymers are less hydrophilic, absorb less water, and subsequently
degrade more slowly (Jain, 2000a) as lactic acid is more hydrophobic than glycolic acid.
Table 2.7 Compilation of biodegradable polymers properties (Gentile et al., 2014, Van
de Velde and Kiekens, 2002).
Properties PLA L-PLA PGA DL-PLGA
50:50
DL -
PLGA
75:25
PCL
Young's
modulus E
(GPa)
0.35 – 3.5 2.7 – 4.14 6 - 7 1 – 4.34 1.38 –
4.13
0.21 –
0.44
Tensile
strength
σ (MPa)
21 - 60 15.5 - 150 55 – 99.7 41.4 –
55.2
41.4 -55.2 20.7 - 42
Elongation
ε (%)
2.5 - 6 3 - 10 1.5 - 20 2 - 10 2.5 - 10 300 - 1000
Bending
strength (MPa)
0.89 - 1.03 - - - - -
Impact strength
(J/cm)
0.16 - 1.35 - 0.16 –
1.35
- - -
Melting
temperature
(°C)
150 - 162 170 -200 220 -233 amorphous amorphous 58 - 65
Glass
Transition
temperature
(°C)
45 - 65 55 - 65 35 -45 40 - 50 50 - 55 -65 - -60
42

Chapter 2: Literature Review
Density (g/cm3) 1.21 –
1.43
1.24 –
1.30
1.50 –
1.71
1.30 –
1.40
1.30 1.11 –
1.146
Water
absorption (%)
0.5 - 50 - - - - -
Degradation
Time (Weeks)
11 - 15 12 - 18 6 - 12 1 - 2 4 - 5
Polylactide-co-Glycolide Acid (PLGA) 2.10.1
Poly (DL-lactide-co-glycolide) (PLGA); a bioresorbable biodegradable aliphatic polyester, is
formed from the combination of lactic and glycolic. Controlled co-polymerisation of lactic
and glycolide can produce tailored mechanical properties and degradation rate by varying the
molecular weight. PLGA with composition of 25%- 75% lactide-to-glycolide ratio forms
amorphous polymers while a 50-50% PLGA is very hydrolytically unstable. PLGA is a
widely investigated polyester and used in a number of clinical applications such as for bone
repair and substitute applications. PLGA has been well documented for its excellent
biodegradability, biocompatibility, nontoxicity properties and favourable regulator status
(Makadia and Siegel 2011, Miao et al., 2007, Landes et al., 2006, You et al., 2005, Domb et
al., 2001, Lu et al., 1999).
The main advantage of PLGA is it extensive variety of disintegration times and has tuneable
mechanical properties. Researchers had used various ratios PLGA in different applications to
understand the behaviour of PLGA(Landes et al., 2006). Most of the likely usages of PLGA
under study are for minimal load bearing applications. One such area is craniofacial surgery to
provide secure fixation while eliminating much of the concern over intracranial migration of
metallic plates and screws that are normally used(Peltoniemi et al., 2002). In addition, PLGA
is also widely studied as a scaffold material for osteogenesis (Gentile et al., 2014, Leung et
al., 2008, Callaghan et al., 2004, Vozzi et al., 2003, Thomson et al., 1996) besides being used
in research work relating to drug delivery (Makadia and Siegel 2011, McDonald et al., 2009,
Chung et al., 2006, Alexis, 2005).
Most of the biopolymers; PGA, PLA and co-polymers PLGA, have lower strength than
natural bone and not propagator of cell bone for bone regeneration. As apatite is part of
natural bone composition, most of the biopolymers are reinforcing with apatite containing
bioceramic such as hydroxyapatite (HA) and apatite-wollastonite to form biocomposite. In
addition as reinforcement, apatite containing bioceramic also induce bone in-growth. 43

Chapter 2: Literature Review
Biocomposite 2.11
As research into singular biomaterials for scaffolds are maturing with new findings regarding
their usages in the medical field, more research are looking toward new types of biomaterials
that can mimics natural bone. This development has been the hottest topic in both advanced
composites and biomaterials communities (Cheung et al., 2007). High-strength and durable
biocomposite can be fabricated from either biodegradable polymer or bioactive ceramic as
parent material. Depending on the applications requirements, the biocomposite can be
enhanced either by reinforcing the parent materials with fibre of the same or different
materials or by combining with other biomaterials. With the knowledge of regenerative
medicine in term of porous size, degradation rate and surface morphology, researcher and
engineers can develop new biocomposites and fabrication techniques. In the fabrication
process of the biocomposite, researchers had investigated various manufacturing process
ranging from conventional to advanced manufacturing methods. In the fabrication of
Bioglass®45S5-HDPE composite, a conventional approach was used where the composite
mixture were blended, compounded and compression moulded. While in advanced
techniques, one of the AM methods was used. Biocomposite of PEEK-HA scaffolds were
successfully fabricated using SLS with promising results in microscopic analysis, porosity
analysis, bioactivity and cell viability analysis (Tan et al., 2005).
Biocomposites that are based on polymers can be categorised into three groups: bioinert
composites, such as carbon/high density polyethylene (HDPE) and β-TCP/HDPE; bioactive
composites, such as HA/HPDE, poly-(DL-lactic acid)-wollastonite and AW-PMMA;
bioresorable composites such as TCP/PLA and PLGA/TCP. Much research work were
performed to improve the mechanical properties and the bone bonding properties (Keshaw et
al., 2009, Roeder et al., 2008, Miao et al., 2007, Georgiou et al., 2007a, Ignjatovic et al.,
2004).
Forming Processes of Biomaterials in the Manufacturing of Medical Devices and 2.12
Implants
As been mentioned earlier, various manufacturing processes have been proposed and
investigated in processing biomaterials. The next two sub-sections described the conventional
processes that have been used.
44

Chapter 2: Literature Review
Fabrication methods in ceramic material 2.12.1
There are many methods that can be used in shape forming ceramic powder. The simplest
form is by pressing fine ceramic powder mixed with additives. Powder pressing can be carried
out in a number of ways which includes uniaxial pressing, wet pressing, hot pressing and
isostatic pressing. Table 2.8 describes the process and the area of applications this process
was used. In addition, other methods too are used such as Robocasting and AM.
Table 2.8 Processing of Ceramics Materials.
Process Description Applications
Uniaxial (Die)
Pressing
Die pressing is the powder compaction
method involving uniaxial pressure applied
to the powder placed in a die between two
rigid punches. Various binders (organic as
well as inorganic) may be added in the
mixture depending on the requirement.
Used for mass production of
simple shapes such as abrasive
products and white-wares.
Isostatic
Pressing
In isostatic pressing, powder mixture
compaction is achieved by applying pressure
from multiple directions through a liquid or
gaseous medium surrounding the compacted
part placed around a central mandrel pin in a
flexible mould.
Used to obtain uniform
density in the product.
Injection
Moulding
In this method, a rotating screw inside
cylinder compacted and fed the mixture of
ceramics with binder (usually thermoplastic
polymer or wax).The mixture is heated until
the correct temperature to attain sufficiently
low viscosity before injection by pressure
into the mould cavity.
Used for precision forming of
complex shape.
Extrusion
Extrusion ram forces the ceramic paste
through a die, resulting in a long product
(rods, bars, long plates, pipes) of regular
cross-section,
Used in the production of
constant cross-section and
hollow shapes with limited
thickness parts such furnace
tubes, thermocouple
components, and heat
exchanger tubes.
Slip Casting Slip casting technique is used for shape Used to produce replication of
45
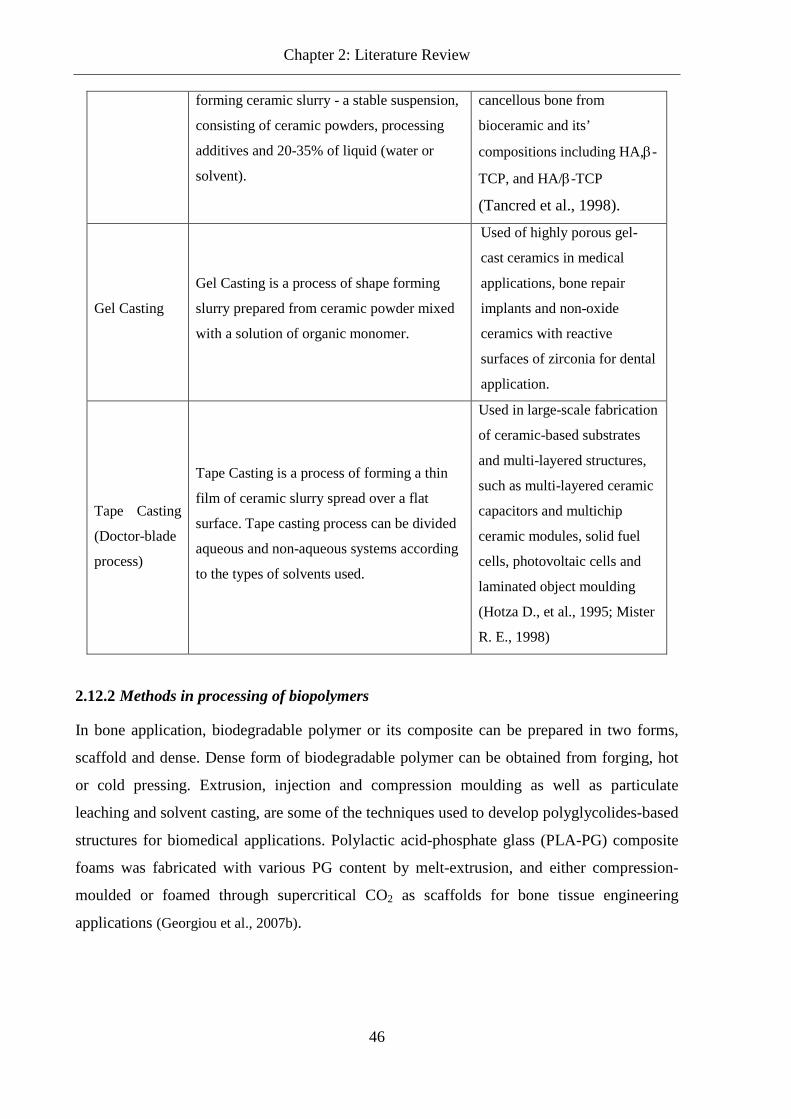
Chapter 2: Literature Review
forming ceramic slurry - a stable suspension,
consisting of ceramic powders, processing
additives and 20-35% of liquid (water or
solvent).
cancellous bone from
bioceramic and its’
compositions including HA,β-
TCP, and HA/β-TCP
(Tancred et al., 1998).
Gel Casting
Gel Casting is a process of shape forming
slurry prepared from ceramic powder mixed
with a solution of organic monomer.
Used of highly porous gel-
cast ceramics in medical
applications, bone repair
implants and non-oxide
ceramics with reactive
surfaces of zirconia for dental
application.
Tape Casting
(Doctor-blade
process)
Tape Casting is a process of forming a thin
film of ceramic slurry spread over a flat
surface. Tape casting process can be divided
aqueous and non-aqueous systems according
to the types of solvents used.
Used in large-scale fabrication
of ceramic-based substrates
and multi-layered structures,
such as multi-layered ceramic
capacitors and multichip
ceramic modules, solid fuel
cells, photovoltaic cells and
laminated object moulding
(Hotza D., et al., 1995; Mister
R. E., 1998)
Methods in processing of biopolymers 2.12.2
In bone application, biodegradable polymer or its composite can be prepared in two forms,
scaffold and dense. Dense form of biodegradable polymer can be obtained from forging, hot
or cold pressing. Extrusion, injection and compression moulding as well as particulate
leaching and solvent casting, are some of the techniques used to develop polyglycolides-based
structures for biomedical applications. Polylactic acid-phosphate glass (PLA-PG) composite
foams was fabricated with various PG content by melt-extrusion, and either compression-
moulded or foamed through supercritical CO2 as scaffolds for bone tissue engineering
applications (Georgiou et al., 2007b).
46

Chapter 2: Literature Review
Table 2.9 Fabrication of biodegradable polymer materials (Gentile et al., 2014).
Polymer Solvent Applications
Polyglycolide /
Polyglactine Hexafluoroispropanol
Suture anchors, meniscus repair, medical
devices, drug delivery, orbital floor
Poly(l-lactide)
*Benzene, *dioxane
tetrahydrofuran (THF).
Fracture fixation, interference screws,
suture anchors, meniscus repair
Poly(d,l-lactide) Methanol, dimethyl-formamide
(DMF) Orthopaedic implants, drug delivery
Poly(d,l-lactide-co-
glycolide) 85:15
Ethyl acetate, *chloroform,
acetone, THF
Interference screws, suture anchors,
anterior cruciate ligament (ACL)
reconstruction
Poly(d,l-lactide-co-
glycolide) 75:25
Ethyl acetate, chloroform,
acetone, DMF, THF Plates, mesh, screws, tack, drug delivery
Poly(d,l-lactide-co-
glycolide) 50:50
Ethyl acetate, chloroform,
acetone, DMF, THF Orthopaedic implants, drug delivery
Note: *(use with high precaution as these are nasty carcinogen/cancer causing agent)
Sintering 2.13
As sintering is part of the approach use to densify the powder in this research, it is necessary
to have an understanding of the sintering process. Sintering is the technique in which the non-
compacted material is heated to a specific temperature below its melting point to form
concentrated agglomerate (Rahaman, 2008, German, 1996). For most sintering process, loose
fine particles of less than 1mm in diameter are compacted in a mould before heated to a
temperature below the melting point of the powder. The compacted particles are terms green
part while once sintered it is called brown part. In sintering, the main mechanisms which
cause bonding is by diffusion, although other mechanisms such as plastic flow,
recrystallization, grain growth, liquid and vapour phase material transport may happen.
Sintering can be broadly categorised into solid-state sintering and liquid-state sintering.
Figure 2.18 illustrate the different sintering category on a phase diagram (Kang, 2005).
47

Chapter 2: Literature Review
Solid-state and liquid state sintering 2.13.1
In solid-state sintering when two adjacent rigid particles that were initially in contact are
induced with thermal energy, the material at the atomic level gains enough energy to diffuse
away from the material and join together. During this stage of sintering, necking occurs
within the loose powder particles. If thermal energy is continuously supplied, the next stage of
sintering occurs where the initial necking will grow until the particles become smooth and
develops, nearing cylindrical shape. The particle will eventually coalesce into a single, larger
particle as shown in figure 2.19 (German, 1996).
Figure 2.18Categories of sintering in a phase diagram (Kang, 2005).
48

Chapter 2: Literature Review
Figure 2.19 Classical sintering model of two adjacent particles (German, 1996)
In solid-state sintering, the mass transportation can occur as surface diffusion or volume
diffusion. The differentiation between surface diffusion and volume diffusion lies in the
transport mechanism. For surface diffusion, the mechanism of mass surface transport involved
motion of atoms between defects of crystalline solid. Surface diffusion initiates at lower
temperature than other mass transport processes, thus contributing to the initial sintering of
many materials. This is important for producing high open pores with good mechanical
strength without densification and loosening the open pore structure (German, 1996). As for
volume diffusion, the main mechanism involves motion of vacancies (the sites where an atom
is missing from a crystallographic structure) through a crystalline structure. As described by
German (German, 1996) there are three main diffusion pathways that contribute to volume
diffusion sintering. The pathways started with diffusion adhesion and followed by diffusion
densification then dislocation climb. Diffusion adhesion allows vacancies to flow from the
neck surface to particle the surface through the particle interior. This results in mass
deposition at the neck surface. In densification, the vacancies move from neck surface to the 49

Chapter 2: Literature Review
inter-particle grain boundary resulting in densification and shrinkage. The final pathway
allows vacancies dislocation by secretion or annihilation, which also results in densification.
This process is common for compacted powder. Volume diffusion is dominantly common for
many ceramics and crystalline materials. Figure 2.20 illustrates the volume diffusion
pathways.
Figure 2.20 Diffusion pathways (German, 1996).
In liquid state sintering, the sintering process occurs in the presence of liquid phase. The
formation of liquid during sintering improves the mass transport rates which results in better
sintering rate in comparison to solid state sintering (German, 1996).
In sintering process, parameters that influence the quality of the sintered parts are:
• temperature
• time
• pressure
Unlike other processing technologies, various processing steps and variables need to be
considered for the production of sintered parts. For example, in the shaping step, simple die
compaction, isostatic pressing, slip casting, injection moulding, may be selected according to
the shape and properties of required end product (Kang, 2005).
Materials Characterisations and Analysis 2.14
In this section, the experimental analysis techniques that were used in this research will be
introduced. These analysis techniques include methods for materials characterisation; such as
pycnometer, differential scanning calorimetry (DSC), X-Ray diffraction (XRD), and scanning
electron microscopy (SEM), and mechanical properties analysis.
50

Chapter 2: Literature Review
Density Measurement using Pycnometer 2.14.1
Pycnometers are flasks with accurate volumes which can be used to determine the density of
the material by measuring the liquid volume displaced by a solid material (in powder,
granular or bulk form). The method of determining the density is based on Archimedes
Principle of buoyant force. The buoyant force on a submerged object is equal to the weight of
the fluid that is displaced by the object.
The most common pycnometer being the specific gravity (SG) bottle is often used for
measuring SG of finely milled powders. It is also used for measuring the relative density of
liquids whereby a liquid weight is divided by the weight of an equal volume (using the same
vessel) of water. Liquids other than water can be used in these pycnometers when water is a
problem, the most common being xylene. The pycnometer (Figure 2. 21a) is a flask with a
close-fitting ground glass stopper with a fine capillary hole through it. This fine hole releases
a spare liquid after closing a top-filled pycnometer, thus enabling the density to be measured
accurately, by referencing to an appropriate working fluid such as water or mercury, using an
analytical balance. Figure 2.19a shows SG bottles on the right and a large Bulk Pycnometer in
Figure 2. 21b. The Bulk Pycnometer can be used for measuring bulk density (BD), apparent
specific gravity (ASG) or SG of larger pieces or chips using a similar procedure to that of the
SG bottle (Berger, 2010). The testing method is as given in BS EN 1389:2003 (BSI, 2003).
(a) (b)
Figure 2. 21 Density bottle (Impact-test, 2013, Jaytecglass, 2012).
51

Chapter 2: Literature Review
DSC 2.14.2
Differential scanning calorimetry (DSC) is used to monitor heat effects associated with phase
transitions and chemical reactions as a function of temperature. According to the
classification, calorimetry is a technique for determining the quantity of heat that is either
absorbed or released by a substance undergoing a physical or a chemical change which alter
the internal energy of the substance (Kubyshkina, 2014). The internal energy at constant
pressure is known as enthalpy, H. Since the DSC is at constant pressure, heat flow is
equivalent to enthalpy changes and can be either positive or negative. The equation of heat
flow is as shown in equation 2.1.
∆𝑑𝑑𝑑𝑑𝑑𝑑𝑑𝑑
= �𝑑𝑑𝑑𝑑𝑑𝑑𝑑𝑑 𝑠𝑠𝑠𝑠𝑠𝑠𝑠𝑠𝑠𝑠𝑠𝑠
� − �𝑑𝑑𝑑𝑑𝑑𝑑𝑑𝑑 𝑟𝑟𝑠𝑠𝑟𝑟𝑠𝑠𝑟𝑟𝑠𝑠𝑟𝑟𝑟𝑟𝑠𝑠
� (2.1)
Where H = enthalpy
t = time
In an endothermic process, heat is absorbed and, therefore, heat flow to the sample is higher
than that to the reference. Hence, ∆dH/dt is positive. In an exothermic process, such as
crystallization, some cross-linking processes, oxidation reactions, and some decomposition
reactions, the opposite is true, and ∆dH/dt is negative.
In a DSC, the difference in heat flow to the sample and a reference at the same temperature is
recorded as a function of temperature. The reference is an inert material such as alumina or an
empty aluminium pan. The temperature of both the sample and reference are increased at a
constant rate (Figure 2.22).
52

Chapter 2: Literature Review
Figure 2.22 Schematic of a DSC (Colby, 2007).
In DSC analyses of polymer samples, the occurring thermal transitions are when they are
cooled down or heated up under inert atmosphere. DSC is use to determine the melting and
glass transition temperatures, as well as various transitions in liquid crystalline mesophases as
shown in figure 2.23 (Braun et al., 2012).
Figure 2.23 Schematic DSC thermogram of semi-crystalline polymer which denote the point of glass transition temperature Tg, crystallisation temperature Tc, melting temperature Tm and decomposition temperature Td (Braun et al., 2012).
53

Chapter 2: Literature Review
SEM 2.14.3
The scanning electron microscope (SEM) uses a stream of focused electrons over a small
specimen surface to create an image at extremely small scale. The electrons in the beam
interact with the sample, producing various signals by electron-sample interactions when the
incident electrons are decelerated in the solid sample. These signals include secondary
electrons (that produce SEM images), backscattered electrons (BSE images), diffracted
backscattered electrons (EBSD that are used to determine crystal structures and orientations
of minerals), photons (characteristic X-rays that are used for elemental analysis and
continuum X-rays), visible light (cathodoluminescence–CL), and heat (Figure 2.24 ). SEM is
used to reveal information about the sample that include information about external
morphology (texture), chemical composition, and crystalline structure and orientation of
materials making up the sample (Swapp, 2007).When the specimen is irradiated with a fine
electron beam, secondary electrons are emitted from the specimen surface which are received
by a detector that interprets the stream of electrons by observing the two-dimensional
scanning of the electron probes over the surface into an image from the detected secondary
electrons. This process requires the examined samples observed under SEM to be grounded
by attaching the samples SEM stubs before being painted with conductive material and coated
with gold. Most modern light microscope has a maximum magnification of about 1000x.
Figure 2. 24 Various signal from electron-sample interactions when the incident electrons are decelerated in the solid sample (Nanoscience, 2014).
54
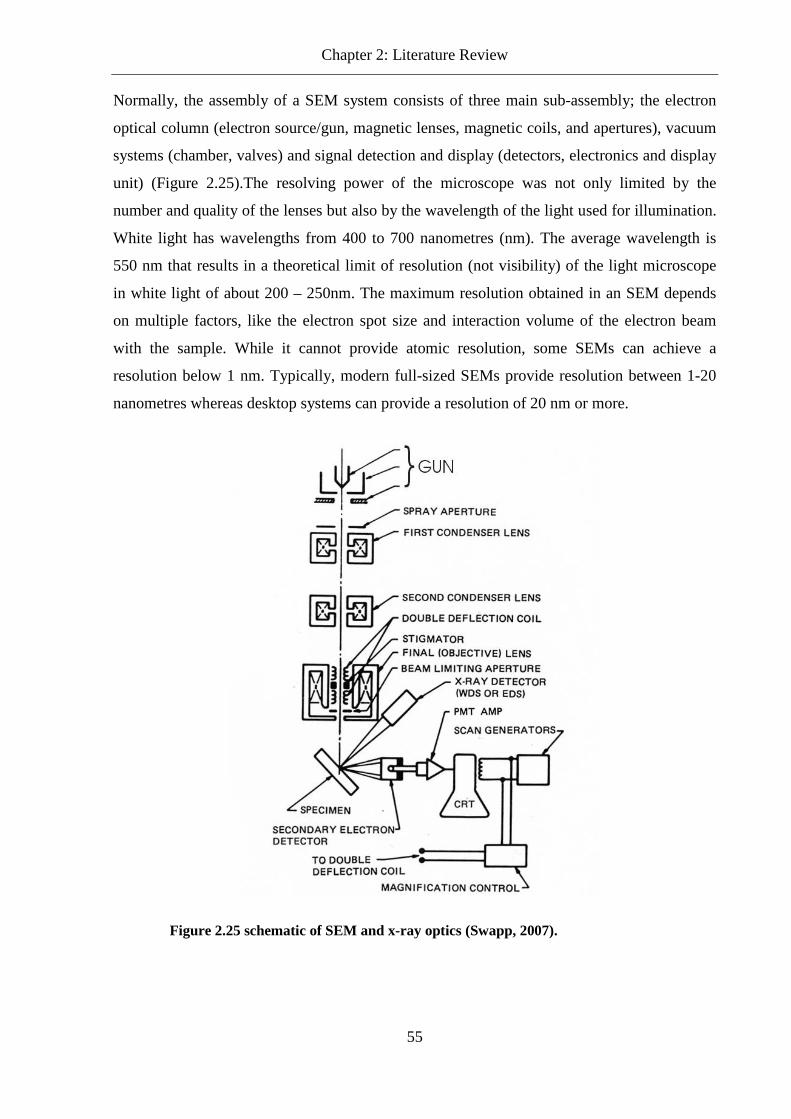
Chapter 2: Literature Review
Normally, the assembly of a SEM system consists of three main sub-assembly; the electron
optical column (electron source/gun, magnetic lenses, magnetic coils, and apertures), vacuum
systems (chamber, valves) and signal detection and display (detectors, electronics and display
unit) (Figure 2.25).The resolving power of the microscope was not only limited by the
number and quality of the lenses but also by the wavelength of the light used for illumination.
White light has wavelengths from 400 to 700 nanometres (nm). The average wavelength is
550 nm that results in a theoretical limit of resolution (not visibility) of the light microscope
in white light of about 200 – 250nm. The maximum resolution obtained in an SEM depends
on multiple factors, like the electron spot size and interaction volume of the electron beam
with the sample. While it cannot provide atomic resolution, some SEMs can achieve a
resolution below 1 nm. Typically, modern full-sized SEMs provide resolution between 1-20
nanometres whereas desktop systems can provide a resolution of 20 nm or more.
Figure 2.25 schematic of SEM and x-ray optics (Swapp, 2007).
55

Chapter 2: Literature Review
SEM is widely used in a number of industries and laboratories to investigate the
microstructure and chemistry of a range of organic and inorganic materials such in
characterisation the surface topology of bioceramic (Cannillo et al., 2009, Szucs and
Brabazon, 2009).
XRD 2.14.4
X-Ray Diffraction (XRD) technique is used to identify different crystal phases present in
crystalline materials. When crystalline materials are exposed to X-rays, the lattice of the
crystal diffracts the ray. As X-rays have wavelengths on the order of a few angstroms (1
Angstrom = 0.1 nm), this make X-rays suitable for diffraction of atoms in crystalline
materials as the typical inter atomic distance in crystalline solids are at this range. When
incident X-Ray interacts with the crystal, X-Ray diffraction spectra will be observed that is
unique to that particular crystal type. Crystal phases are determined from the comparison of
known samples. The relationship describing the angle at which a beam of X-rays of a
particular wavelength diffracts as Bragg’s Law (Figure 2.26) is given in equation 2.2
2dsinθ= nλ (2.2)
where λ= wavelength of the X-Ray
θ = scattering angle
n = integer representing the order of the diffraction peak.
d = inter-plane distance (of either atom, ions or molecules)
56

Chapter 2: Literature Review
Figure 2. 26 Bragg's Law reflection. The diffracted X-rays exhibit constructive interference when the distance between paths ABC and A'B'C' differs by an integer number of wavelengths (λ) (Henry et al., 2007).
Mechanical Testing 2.14.5
Simple mechanical tests such as tensile, compressive, impact and bending test are used to
evaluate the mechanical strength of materials. Most often tensile tests, for example, are
conducted on ductile materials to measure the stiffness, ductility and strength of the materials.
Figure 2.27 shows the stress-strain curve in which related nomenclatures are used to describe
the general deformation behaviour of the ductile materials. The stiffness of materials is
defined by the elastic modulus or Young’s modulus (E), a fundamental property of the
material. The value of E can be obtained from the slope of the linear range in the stress-strain
curve. The region indicating a linear relationship between stress and strain is known as elastic
region. The upper value A as shown in figure 2.26 of this linear relationship is called the
proportional limit σpl. The tensile strength σu is the maximum strength before fracture while
the yield strength σy is the strength which the behaviour of the material changes from elastic
to plastic deformation (BSI, 2009a). A graphical 0.2% strain offset is normally used for
aluminium as it does not have a well-defined yield point.
57

Chapter 2: Literature Review
Figure 2.27 Typical stress-strain diagram for ductile materials.
Materials that do not have distinguishable yield point are referred to as brittle materials. The
stress-strain curve of brittle materials is near linear before fracture failure. Testing of brittle
materials is usually conducted using flexural test. This test can be conducted by either 3-point
bending (Figure 2.28) or 4-point bending. For medical grade ceramics materials, the testing
method is as outlined in BS EN ISO 6872:2008 (BSI, 2008) while for brittle biopolymer it is
as stipulated in BS EN ISO 20795:2010 (BSI, 2010). Both these standards defined the aspects
of material purity, sample preparation, test method and analysis of the results.
58

Chapter 2: Literature Review
Figure 2.28 Specimen’s initial position at start of test (BSI, 2011).
Methodology 2.15
The following flow-chart (Figure 2.29) depicts the general methodology used in this research.
The initial step in this methodology is to identify and establish suitable AM systems which
can be used to fabricated biomaterials in particular AWGC and PLGA. It then further
identifies conventional processes that can be integrated with suitable AM system to produce
low cost complex artefacts. Materials are then prepare to suit the processing route and tested
for conformity to the process. When this is completed, the outputs are analysed for
mechanical properties and material characteristics. This is to verify that the processing route
does not change the characteristics of the materials and mechanical properties are identified.
The successful process is then tested on case studies to produce complex artefacts.
59

Chapter 2: Literature Review
Figure 2.29 Methodology flow chart used in the proposed study.
60

3D Printed Moulds for Lost Wax Casting of Apatite Chapter 3:
Wollastonite Powder
Introduction 3.1
The study described in this chapter was conducted in two core parts together with a specific
case study. In the first part, materials characteristics were determined to establish appropriate
process parameters. It is then followed by the fabrication of test specimens for the analysis of
mechanical properties as well as material characterisation after sintering. Finally, in the last
stage, a medical device in the form of mandible implant was designed and fabricated. In this
stage, the mandibular geometry created using the proposed route was assessed for ability to
create physiologically shaped parts and ability to maintain shape definition throughout the
process. Integrated design (using CAD software) and manufacturing of mould (using AM
technologies) was explored in order to establish a new route for producing patient specific
bioceramic medical devices.
Material Characterisations and Methods 3.2
The materials used in this research are AW and PMMA, both in powder form. The particles
size for AW powder ranges from 53 to 90µm and were obtained from Glass Technology
Services, Sheffield, UK which is assumed to be matching with the AW nominal chemical
composition of MgO 4.6, CaO 44.7, SiO2 34.0, P2O5 16.2, CaF2 0.5 by wt.% (Kokubo,
1991b). The PMMA (Ganzpearl GM-0600, GM0800) powder were manufactured by Ganz
Chemical Co. Ltd. Japan with particles size ranges from 4-8µm. PMMA belongs to the acrylic
resins family and in general is an ester of methacrylic acid (CH2=C[CH3]CO2H). It is a hard
plastics, rigid, but brittle material, with a glass transition temperature ranging from 85oC to
145oC; dependant on the molecular weight (Mw) or grade of the PMMA. Normally it is
classified at 105°C with density of 1.17 to 1.20g/cm3. PMMA has good mechanical strength,
acceptable chemical resistance, and extremely good weather resistance. PMMA was selected
as binder since it is biocompatible with low melting temperature and can be completely
eliminated during the heat treatment process thus avoiding toxicity posed by acrylic binder
(Goodridge et al., 2006a).
The experimental setup in preparing the test samples for the research work involved the use of
equipment as listed in Table 3.1.
61

Chapter 3: 3D Printed Moulds for Lost Wax Casting of Apatite Wollastonite Powder
Table 3.1 List of equipment used in the study.
Item Equipment Purpose
1. Aluminium V-Mixer Powder mixing chamber
2. Lathe machine Rotate mixing chamber
3. Oven, Binder Oven Drying PMMA powder
4. DSC, Mettler Toledo Thermal analysis of PMMA, in
particular to Tg
5. XRD, PANalytical X'Pert Pro MPD
with Philips PW3040/60 X-ray
generator and fitted with an
X'Celerator
Chemical composition analysis of
sintered AW
6. SEM, Hitachi S2400 SEM with an
Oxford Instruments Isis 200 ultra-thin
window X-ray detector.
Morphological analysis
7. Furnace, Carbolite Sintering of AW
8. Hot Plate, Fisher Scientific Use as part of density determination
9. Digital Balance, Mettler AE100 and
Fisher Scientific
Use as part of density determination
10. Motic microscopes with Motic Images
Plus 2.0 software
Measurement and surface observation
of sintered specimens
11. Tensile machine Instron 4505 with
controller interface model 4500.
Mechanical properties testing of
sintered AW
Materials 3.2.1
Figure 3.1 shows the constitution of AW particles used in this study as obtained from the
same supplier in two different batches. The first batch (b1) was obtained in particle size of
75microns while the second batch (b2) was obtained in particle size of 120microns. Both
batches were sieved using stack arrangement of sieve in 120µm, 90µm, 53µm, and 25µm.
After sieving most of the particle obtained are in the range of 53-90µm. As can be seen from
figure 3.1a (200µm and 100 µm images) the amount of area filled with 53-90µm is less than
in figure 3.1b with a high amount of particles in the 25µm range. While in figure 3.1b (200µm
and 100 µm images) the amount area filled with particles in the range of 53micron makes up
the main distribution of the image area. This can be attributed to the first batch which was
62

Chapter 3: 3D Printed Moulds for Lost Wax Casting of Apatite Wollastonite Powder
produced in 75µm. The form of AW particles as shown is in the shape of highly irregular frits
with varying aspect ratios and sizes. The distribution of any given particles size was random
with a high percentage of the particles were in the range of 53-90µm though there are a few
particles which are slightly bigger than 90µm. This can be attributed to the fact that some of
the particles have high aspect ratios that allowed them to pass through the sieve. This can also
be presumably due to particle agglomeration. In addition, some smaller particles were
observed which had not been removed by sieving, because of agglomeration.
(a)
63

Chapter 3: 3D Printed Moulds for Lost Wax Casting of Apatite Wollastonite Powder
Two different types of PMMA were initially used in the study. Both PMMA Ganzpearl GM-
0600 and GM0800 of same particle sizes were investigated for the powder distribution
characteristic. As shown in figure 3.2, most of the PMMA particles size ranges from 4-8µm is
in the shape of spheres. Ganzpearl GM-0600 was distributed more evenly as compare to GM-
0800, which tended to be held together.
(b) Figure 3.1 AW frits as obtained (a)batch1 and (b)batch2, mostly in the range of 53-90µm with few larger than 90µm; scale bar at top left, top right, bottom left and bottom right are 500µm, 200µm, 100µm and 20µm respectively.
64

Chapter 3: 3D Printed Moulds for Lost Wax Casting of Apatite Wollastonite Powder
(a)
(b)
Figure 3.2 PMMA particles of mostly below the size 4um as obtained (a) GM0600 fairly dispersed and (b) GM0800 closely lumped; scale bar at top left, top right, bottom left and bottom right are 500µm, 200µm, 50µm and 20µm respectively.
65

Chapter 3: 3D Printed Moulds for Lost Wax Casting of Apatite Wollastonite Powder
Powder Mixing 3.2.2
The powder mixture was prepared by firstly placing the PMMA powder in an electric drier
oven (Binder, GmbH) prior to blending with AW powder for half an hour. This is to eliminate
any moisture absorbed by PMMA as it is known to absorb moisture due to a long time in
storage. An aluminium ‘V’ mixer was used for mixing the PMMA and AW powder. The ‘V’
mixer used was cleaned thoroughly off any residue using alcohol-based solvent before any
mixing was performed. The powders were mixed in the aluminium ‘V’ mixer placed on a
lathe machine. The mixing speed on the lathe was set at 65 rpm for 105 minutes. The mixture
composition of AW and PMMA powder were measured by weight ratio. The ratios of AW to
PMMA used were 95:5, 85:15, and 75:25. The weights of these powders were measured using
a digital balance (Fisher Scientific, UK) with accuracy of ±0.01g.
Differential scanning calorimeter (DSC) and scanning electron microscopy (SEM) were used
to examine the materials and parts. The examination provided an understanding on the
working principle during the fabrication process. Material characterisation for PMMA was
conducted using a Mettler Toledo DSC for thermal analysis; Tg in particular. An SEM
analyser was used to examine the unmixed and mixed AW to PMMA particles as well as the
morphology of the sintered specimens, which shows how particles were being connected
together. Density measurements of sintered specimens were performed using the Archimedes
principle from the BS EN ISO standard for porous ceramic (BSI, 1995) while the geometry
measurement were taken using Motic Microscopy with accompanying software. Based on BS
EN ISO standard of mechanical testing for dental ceramic (BSI, 2009b), three point bending
tests were carried out using an Instron 4505 with controller interface model 4500, UK.
The distribution of AW to PMMA particles powder mixtures were determined by observation
of SEM images. In figure 3.3a, after the blending period as described in section 3.2.1, PMMA
GM0600 particles adhered to the frits of AW. The particles were uniformly distributed and
blended. Minimal agglomerations were observed of GM0600 as compared to GM0800
(Figure 3.3b) in both the mixture components.
66

Chapter 3: 3D Printed Moulds for Lost Wax Casting of Apatite Wollastonite Powder
AW frits were clearly clustered with GM0600 particles as compared to GM0800 particles that
were more detached from AW. Hence, PMMA GM0600 was used as the binding powder with
A-W in preparing the green parts.
(a)
(b)
Figure 3.3 AW-PMMA powder mixtures (a) PMMA GM0600 adheres well to A-W and (b) PMMA GM0800 did not blend well with A-W. The scale bar at top left, top right, bottom right and bottom right are 500µm, 200µm, 50µm and 20µm respectively.
67

Chapter 3: 3D Printed Moulds for Lost Wax Casting of Apatite Wollastonite Powder
DSC Analysis 3.2.3
PMMA test samples inside 49mg aluminium crucibles were preheated for 5minutes at 30oC
and then continued to be heated up until 200oC. Nitrogen flow rate of 5ml/min and heating
rate of 10oC/min was set during the DSC analysis. Four test samples of PMMA as shown in
figure 3.4 indicated that the range of Tg (glass transition temperature) is from 124oC to 128oC.
Additional two more test samples were as shown in appendix B6.
Figure 3.4 DSC tests of four out of six PMMA powder samples.
The Tg of PMMA is 125.19oC ± 1.43oC. The interval estimate on Tg for all the test samples of
PMMA used in this study lies between 123.83oC and 127.38oC (Table 3.2) with a 95%
confident level. The nominal value for Tg of PMMA as described in most literature varies
between 85oC to 145oC; dependant on the grade of PMMA, with most at slightly over 100oC
(Chow et al., 2008, Frazer et al., 2005). The Tg of PMMA used in this study fall within this
range. Hence, this temperature was used as the reference temperature for temperature setting
in the process of producing green part test specimens.
68

Chapter 3: 3D Printed Moulds for Lost Wax Casting of Apatite Wollastonite Powder
Table 3.2 Average Tg of PMMA at midpoint.
Fabrication of AW glass ceramic specimens 3.2.4
Figure 3.5 show the process of producing A-W glass ceramic specimens. This procedure of
fabricating the A-W glass ceramic rods is as described in the following steps: -
1. Aluminium foil of thickness between 0.1 mm to 0.2 mm was wrapped tightly between
four to eight times around a 3.2 mm diameter mandrel. Copper wire was then wound
around the foil to create a mould. This is to strengthen the mould and distribute heat. The
mould was then slid off the mandrel, and the foil at one end folded over to close one end
of the cylinder.
2. Powder mixture; by percentage weight ratio, of 53-90µm AW (from Glass Technology
Services, Sheffield) and 4-8 µm PMMA (Ganzpearl GM-0600) was made by mixing the
composition in a ‘V’ mixer on a lathe machine. The powder was mixed at a speed of 65
rpm for 105 min.
3. The powder mixture was then heated in an oven at 120oC for 60min to dry the PMMA
powder as it cans easily absorbed moisture. Then the heated powder mixture was poured
into the foil mould through a small funnel with a tapered end and diameter of 2.0mm.
During filling care was taken to ensure that the temperature of the powder remained above
110oC for easy flow of powder mixture, and that no air pockets were formed in the mould
by poking and compression the filled mixture with pin and rod.
4. Once the mould had been filled, it was placed in an oven and heated to 145oC to
consolidate the PMMA powder. The filled mould was maintained at 145oC for 2 hours,
before the heater was switched off, and the oven allowed cooling at its normal rate.
n Min.
Tg
Max.
Tg
Average
Tg
SD CL CI
High Low
PMMA 6 123.83 127.38 125.19 1.43 1.50 126.69 123.69
69

Chapter 3: 3D Printed Moulds for Lost Wax Casting of Apatite Wollastonite Powder
5. Once the filled mould was at room temperature, carefully removing the copper wire and
then unwinding the aluminium foil will expose the “green part”, (a cylindrical rod of
ceramic powder held together by PMMA binder).
6. The green part was then placed into a sintering boat before been placed into a furnace. The
heating profile in the furnace was predefine where the temperature in the furnace was
raised from room temperature to 779oC at a rate of 10oC per minute, and then held at that
temperature for one hour, before increased to 1150oC, again at a rate of 10oC per minute,
and again held at that temperature for one hour(Xiao et al., 2007) (see Figure 3.6).
7. The furnace was allowed to cool a rate of 10oC per minute before heating was then
switched off and, the sintered rods could be removed from the furnace.
Characterisation of sintered specimens 3.2.5
In order to obtain sintered testing specimens, the produced green parts were sintered
according the heating profile in Figure 3.6. This heating profile creates an optimum nucleation
and propagation of glass-ceramic crystal growth, which benefits the increase of strength (Xiao
et al., 2007). During the heating process, burned out of PMMA binder occurred, leaving pure
sintered AW glass ceramic as PMMA does not leave any residue (Goodridge et al., 2006a).
XRD and EDX analysis were performed on the sintered specimens such as to ensure the
presence of wollastonite and hydroxyl/apatite and the chemical composition is similar to
Kokubo’s formulation. In addition, besides 3-point bending test; physical properties
measurements were conducted to evaluate the outcome of the process flow (Figure 3.5).
70
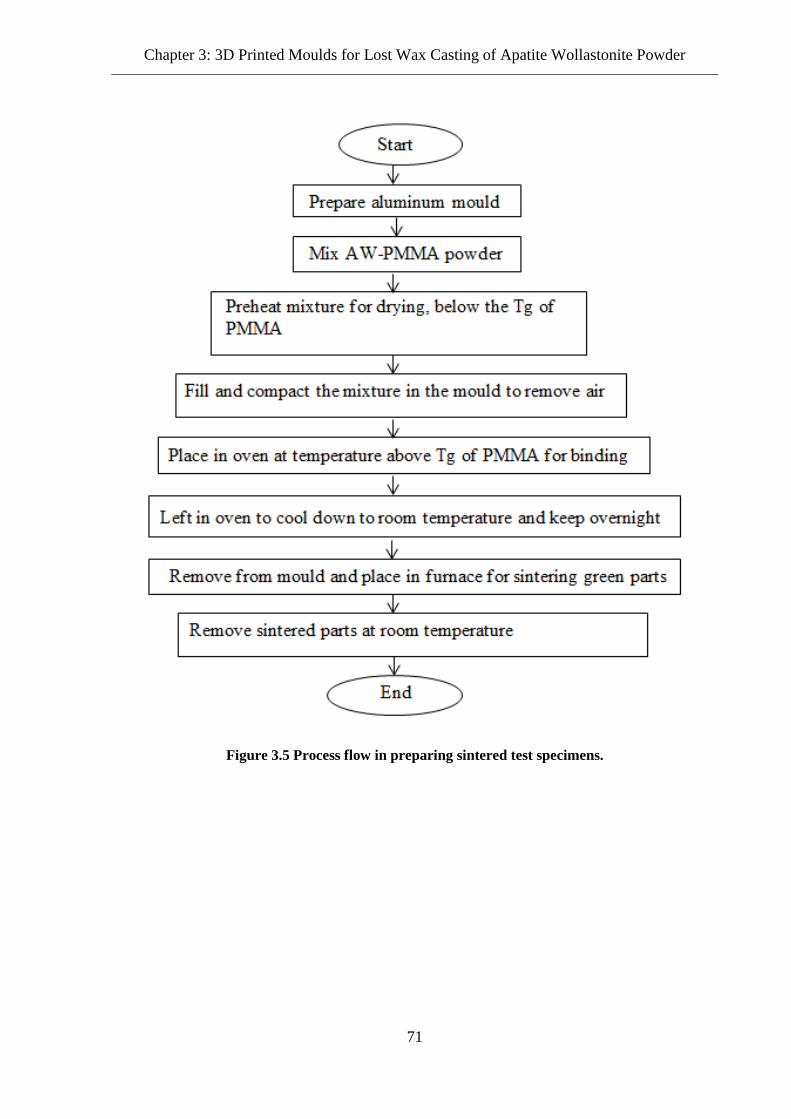
Chapter 3: 3D Printed Moulds for Lost Wax Casting of Apatite Wollastonite Powder
Figure 3.5 Process flow in preparing sintered test specimens.
71
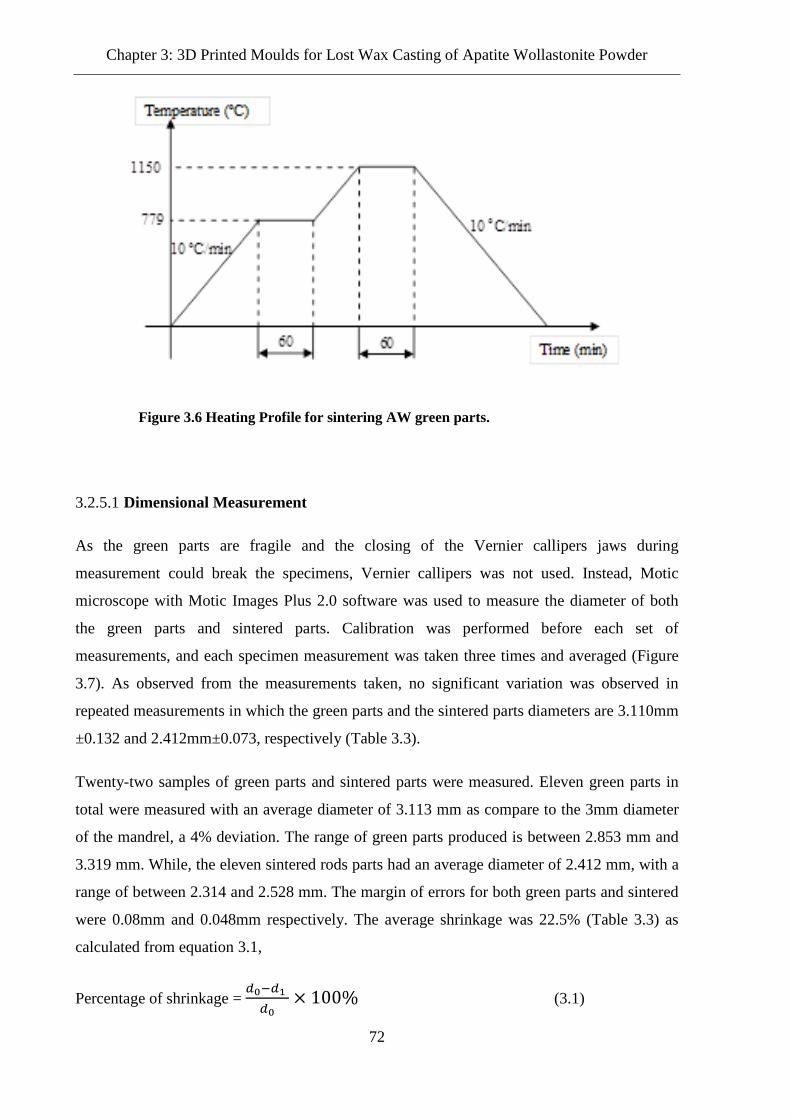
Chapter 3: 3D Printed Moulds for Lost Wax Casting of Apatite Wollastonite Powder
Dimensional Measurement 3.2.5.1
As the green parts are fragile and the closing of the Vernier callipers jaws during
measurement could break the specimens, Vernier callipers was not used. Instead, Motic
microscope with Motic Images Plus 2.0 software was used to measure the diameter of both
the green parts and sintered parts. Calibration was performed before each set of
measurements, and each specimen measurement was taken three times and averaged (Figure
3.7). As observed from the measurements taken, no significant variation was observed in
repeated measurements in which the green parts and the sintered parts diameters are 3.110mm
±0.132 and 2.412mm±0.073, respectively (Table 3.3).
Twenty-two samples of green parts and sintered parts were measured. Eleven green parts in
total were measured with an average diameter of 3.113 mm as compare to the 3mm diameter
of the mandrel, a 4% deviation. The range of green parts produced is between 2.853 mm and
3.319 mm. While, the eleven sintered rods parts had an average diameter of 2.412 mm, with a
range of between 2.314 and 2.528 mm. The margin of errors for both green parts and sintered
were 0.08mm and 0.048mm respectively. The average shrinkage was 22.5% (Table 3.3) as
calculated from equation 3.1,
Percentage of shrinkage = 𝑑𝑑0−𝑑𝑑1 𝑑𝑑0
× 100% (3.1)
Figure 3.6 Heating Profile for sintering AW green parts.
72

Chapter 3: 3D Printed Moulds for Lost Wax Casting of Apatite Wollastonite Powder
where d0= diameter of green part
d1= diameter of sintered part
(a)
(b)
73

Chapter 3: 3D Printed Moulds for Lost Wax Casting of Apatite Wollastonite Powder
(c)
Figure 3.7 Three Measurements were taken on sintered specimens (a), (b), (c) and (d) where variation is not significant; scale bar on images is 1000µm.
74

Chapter 3: 3D Printed Moulds for Lost Wax Casting of Apatite Wollastonite Powder
Table 3.3 Samples average geometrical measurements.
Dia
met
er
n
Ave.
variation
on three-
repeated
measureme
nts. (mm)
Min.
(mm)
Max
(mm)
Ave.
(mm) SD
CL
%
CI
(mm)
Percent of
Average
Shrinkage
%
Green
parts 11
3.110
±0.132 2.853 3.319 3.113 0.131 95
3.113
±0.088 22.5
Sintered
parts 11
2.412
±0.073 2.314 2.528 2.412 0.071 95
2.412
±0.048
The amount of shrinkage corresponds to the amount of binder used and some residue of air or
moisture during filling of the mould at room environment. The shrinkage occurred as the
particles attempt to achieve a denser packing under the influence of surface tension from the
polymer melt during thermal debinding(Rahaman, 2008). Furthermore, decomposition of the
binder, residue of air or moisture trapped in the green parts can result in bubble formation and
caused flaw formation as well as geometry deformation (Dong and Bowen, 1989).
Density and porosity 3.2.5.2
Pycnometer was used to determine the density and open porosity of the AW samples, with
thirteen samples being measured. A 25ml density bottle was used with distilled water as the
liquid medium. Dry sintered sample and empty density bottle were weighted separately before
been weighted together. Density bottle was then filled with distilled water and weighted
before dry sample was placed inside it to determine the suspended weight of the sample. The
density of the samples were determined from the known density of the distilled water, the
weight of the sample, the weight of density bottle filled with water and the weight of density
bottle with both the sample and water (BSI, 2003).
In order to determine the porosity of the sample, the sample then was boiled in a volume of 50
to 75 ml of water using a Fisher Scientific hotplate for 15minutes in order to fill out open
pores. The sample was immediately dried upon taken out with paper towel of excess water.
Sample was then put in an empty density bottle and weighted. Again, the suspended weight of
the boiled sample was weighted.
75

Chapter 3: 3D Printed Moulds for Lost Wax Casting of Apatite Wollastonite Powder
The calculation performed in order to obtain the apparent and relative densities are as outline
in equation 3.3 and equation 3.5. Calculations of samples were based on a true density for the
AW at 3.07 g/cm³, PMMA at 1.19g/cm3 and distilled water temperature taken at 22oC,
0.9978g/cm3. The samples were on average 26.9% porous (porosity ranges from 19.6% to
36.7%), with on average 51.0% of the pores being open (Table 3.4 and Figure 3.8 ).
The related equations used for determining the physical properties of the fabricated AW specimens; such as apparent density, relative density and true porosity, are as given:
Volume of solid Vs= (m3−m0)−(m2−m1)𝜌𝜌𝑤𝑤
(3.2)
Apparent Density of solid ρs =
𝑠𝑠𝑠𝑠𝑉𝑉𝑠𝑠
= 𝑠𝑠𝑠𝑠
(𝑠𝑠3−𝑠𝑠0)−(𝑠𝑠2−𝑠𝑠1) × 𝜌𝜌𝑤𝑤𝑠𝑠𝑑𝑑𝑠𝑠𝑟𝑟 (3.3)
Bulk Density ρb = (𝑠𝑠1−𝑠𝑠0)(𝑠𝑠1𝑤𝑤−𝑠𝑠0)−(𝑠𝑠2−𝑠𝑠3) × 𝜌𝜌𝑤𝑤𝑠𝑠𝑑𝑑𝑠𝑠𝑟𝑟 (3.4)
Relative Density ρr = 𝜌𝜌𝑠𝑠
𝜌𝜌𝐴𝐴𝐴𝐴 = 𝑠𝑠𝑠𝑠
(𝑠𝑠3−𝑠𝑠0)−(𝑠𝑠2−𝑠𝑠1) × 𝜌𝜌𝑤𝑤𝑤𝑤𝑤𝑤𝑤𝑤𝑤𝑤𝜌𝜌𝐴𝐴𝐴𝐴
(3.5)
Apparent Porosity = 𝑠𝑠𝑠𝑠𝑠𝑠𝑠𝑠𝑠𝑠𝑑𝑑 𝑏𝑏𝑠𝑠𝑑𝑑𝑏𝑏−𝑑𝑑𝑟𝑟𝑏𝑏 𝑏𝑏𝑠𝑠𝑑𝑑𝑏𝑏𝑠𝑠𝑠𝑠𝑠𝑠𝑠𝑠𝑠𝑠𝑑𝑑 𝑏𝑏𝑠𝑠𝑑𝑑𝑏𝑏−𝑠𝑠𝑠𝑠𝑠𝑠𝑠𝑠𝑠𝑠𝑟𝑟𝑑𝑑𝑠𝑠𝑑𝑑 𝑏𝑏𝑠𝑠𝑑𝑑𝑏𝑏
= (𝑠𝑠1𝑤𝑤−𝑠𝑠0)−(𝑠𝑠1−𝑠𝑠0) (𝑠𝑠1𝑤𝑤−𝑠𝑠0)−(𝑠𝑠2−𝑠𝑠3) (3.6)
Total Porosity φ = 1 − ρr (3.7)
True Porosity = 𝜌𝜌𝐴𝐴𝐴𝐴−𝜌𝜌𝑏𝑏𝜌𝜌𝐴𝐴𝐴𝐴
× 100% (3.8) Weight of dry body sample W1 = (𝑚𝑚1 −𝑚𝑚0) (3.9) Weight of suspended body in water W2 = (𝑚𝑚2 −𝑚𝑚3) (3.10) Soaked body weight W3 = (𝑚𝑚1𝑤𝑤 −𝑚𝑚0) (3.11)
The values of all measured variables for 𝑚𝑚0,𝑚𝑚1,𝑚𝑚1𝑤𝑤,𝑚𝑚2,𝑎𝑎𝑎𝑎𝑎𝑎 𝑚𝑚3 are given in appendix B1.
76

Chapter 3: 3D Printed Moulds for Lost Wax Casting of Apatite Wollastonite Powder
Table 3.4 Density and porosity measurements of AW as determine using pycnometer.
Item
wei
ght
of
dry
sam
ple
W1 (g
)
susp
ende
d in
w
ater
w
eigh
t W
2 (g
)
so
aked
bo
dy
w
eigh
t W
3 (g
)
bulk
den
sity
g/c
m3
appa
rent
so
lid
dens
ity
g/cm
3
rela
tive
dens
ity
appa
rent
por
osity
%
true
poro
sity
Perc
enta
ge
of
op
en
poro
sity
%
n 13 13 13 13 13 13 13 13 13
Min 0.2675 0.1640 0.2834 1.94 2.32 0.63 9.63 19.60 41.02
Max 0.3175 0.1992 0.3353 2.47 2.77 0.80 16.44 36.66 64.30
Ave 0.2867 0.1764 0.3042 2.25 2.60 0.73 13.60 26.86 50.97
SD 0.0169 0.0123 0.0171 0.14 0.12 0.04 2.20 4.49 6.06
Std
Error 0.0047 0.0034 0.0047 0.04 0.01 0.03 0.61 1.24 1.68
CI 0.0101 0.0074 0.0103 0.08 0.03 0.07 1.33 2.71 3.66
As seen from table 3.4 and equation 3.3 and equation 3.4, the apparent solid density and bulk
density are differentiated by the amount of water that occupied the open porosity. Figure 3.8
shows the internal surface for the sintered region of the AW particles and the pores created
from the sintering process. The squared region indicates the pores in the sintered sample while
the circled region indicated the sintering of the particle, where the region of necking between
particles created pores of varying sizes below 100µm. As shown from the squared region
which indicates the breaking surface of the sintered particle, open and close pores were
Figure 3. 8 Image (a) and (b) of the cross section of sintered AW samples.
77

Chapter 3: 3D Printed Moulds for Lost Wax Casting of Apatite Wollastonite Powder
clearly visible for particles of AW joined in accordance with sintering phenomena.
Figure 3.9 shows the open and close micropores and sub-micropores (indicated by circled
region) on the native surface. SEM images of the outer surface and cross sectional surface,
indicating that the model was porous, with pore sizes of the order of 20 μm and a few
micropores. Porosity in structure is influencing feature that affect osteoconductivity in
addition to the chemical composition, and surface topography (Kokubo, 2008).
The porosity level achieved in this study is adaptable for mimicking cortical bone structure,
but increased macroporosity would need to be designed into the structure in order to optimise
the quality of porosity for bone ingrowth. The amounts of porosity from the SEM images
indicate that an estimate of 20% to 30% pores in the samples that include some micro
porosity.
Figure 3.9 SEM images (a) and (b) of sintered porous A-W glass ceramic 80%wt on the external surface of two samples at 500X and 5000X magnification indicating micro-porosity; scale for left image and right image are 50µm and 5µm respectively.
78

Chapter 3: 3D Printed Moulds for Lost Wax Casting of Apatite Wollastonite Powder
Comparing to the SEM images (Figure 3.10) of A-W specimens produced using SLS; no
distinguishable differences were prevalent in the external surface of the sample that was
fabricated using aluminium sheet mould. However, for internal surface, there appeared more
pores in the sample produced by the method proposed in this study. As porosity and
interconnected channel encourage cell propagation, the feature that is generated by this
fabrication method is considered to serve the purpose of TE applications (Figure 3.10).
Figure 3.10 Scaffolds as produced by the proposed method (top) and scaffolds produced by SLS.
Flexural Strength from Three Point Bend test 3.2.5.3
The samples were tested on a universal testing machine (Instron 4505 with controller interface
model 4500) at a crosshead speed of 0.5 mm/min. The setup for the bending test as shown (
Figure 3.11) was based on BS EN ISO 6872:2008 (BSI, 2008). The spans between supports
for both sets of tests were 20mm. The tests were carried out at room temperature of 24oC with
humidity of 38% R.H.
The modulus of rupture (flexural strength) and flexural modulus was calculated using the
equations 3.12 and 3.13 as follows:
𝜎𝜎 = 8𝐹𝐹𝐹𝐹𝜋𝜋𝐷𝐷3
(3.12)
𝐸𝐸 = 4𝐹𝐹𝐹𝐹3
3𝜋𝜋𝐷𝐷4𝛿𝛿 (3.13)
79

Chapter 3: 3D Printed Moulds for Lost Wax Casting of Apatite Wollastonite Powder
Where E = flexural modulus GPa
σ = strength in MPa
F = break force, N
δ = deflection, mm
L = support (outer) span, mm
D = specimen diameter, mm
Two batches of samples were used in the test. Batch 1 samples used in the tests were ranging
from 2.35mm to 2.65mm in diameter while, for Batch 2 diameter, the range is from 2.56mm
to 3.06mm and 25.2mm to 28.4mm in length; respectively. Figure 3.12(a) shows the samples
load versus deflection diagrams exhibit a linear relation for load and deflection between the
deflection range from 0.015mm to 0.05mm for batch 1 and 0.035mm to 0.065mm for batch 2.
Figure 3.12 (b) diagrams were obtained using fewer data point by setting the sampling rate to
one data point/second. The average flexural strength for batch 1 was 63.83 MPa, with the
range observed over 11 tests to be from 53.14 to 82.80 MPa. While for batch 2, the average
flexural strength was 76.45 MPa, with the range observed over 11 tests to be from 60.71 to
92.62 MPa. The average flexural modulus for batch 1 is 26.65GPa and 23.51GPa for batch
2(Table 3.5). Using a 2tails t-test with confidence level of 95% (p<0.05), the p-value and t-
statistic value obtained for the diameter, flexural modulus and flexural strength are
p=0.00007, t-stat=6.532; p=0.1425, t-stat=1.592; and p=0.0048, t-stat=3.609; respectively.
Figure 3.11 Bending test diagram as based on BS (BSI, 2008).
80

Chapter 3: 3D Printed Moulds for Lost Wax Casting of Apatite Wollastonite Powder
(a)
(b)
Figure 3.12 Load versus Deflection for 2 batches of AW cylindrical specimens from 3 Point bending test.
81

Chapter 3: 3D Printed Moulds for Lost Wax Casting of Apatite Wollastonite Powder
Table 3.5 Flexural Modulus and Modulus of Rupture (Flexural Strength).
Diameter
(mm)
Break
Force
(N)
Displace
ment at
break
force
δbreak
(mm)
Flexural
Modulus
E (GPa)
Modulus
of
Rupture
(Flexural
Strength)
σ (MPa)
Bat
ch 1
n 11 11 11 11 11
Minimum 2.35 17.3 0.048 21.74 53.14
Maximum 2.65 24.29 0.102 32.53 82.80
Median 2.55 20.7 0.058 25.24 62.75
Mean 2.55 20.82 0.06 26.65 63.83
SD 0.082 1.854 0.015 4.055 7.400
Standard Error 0.025 0.559 0.005 1.22 2.231
CL 95% 0.055 1.245 0.010 2.72 4.971
High 2.605 22.065 0.07 29.37 68.801
Low 2.495 19.575 0.05 23.93 58.859
Bat
ch 2
n 11 11 11 11 11
Minimum 2.56 20 0.08 17.18 60.71
Maximum 3.06 42.1 0.10 28.67 92.62
Median 2.85 36.7 0.09 23.56 74.81
Mean 2.85 35.0 0.09 23.51 76.45
SD 0.121 6.13 0.01 3.77 9.03
Standard Error 0.036 1.85 0.003 1.14 2.72
CL 95% 0.081 4.12 0.007 2.53 6.07
High 2.931 39.12 0.097 26.04 82.52
Low 2.769 30.88 0.083 20.98 70.38
t Stat 6.532 1.592 3.609
P(T<=t) two-
tail
0.00007 0.1425 0.0048
t Critical two-
tail
2.228 2.228 2.228
82
Chapter 3: 3D Printed Moulds for Lost Wax Casting of Apatite Wollastonite Powder
XRD and EDX evaluation of material after fabrication process 3.2.6
The chemical composition of the sintered specimens was analysed using a PANalytical X'Pert
Pro MPD, powered by a Philips PW3040/60 X-ray generator and fitted with an X'Celerator.
Diffraction data was acquired by exposing powder samples to Cu-Kα X-ray radiation, which
has a characteristic wavelength (λ) of 1.541874 Å. X-rays were generated from a Cu anode
supplied with 40 kV and a current of 40 mA.
The data was collected over a range of 5-100 2θ with a step size of 0.0334 2θ and nominal
time per step of 150 seconds. Fixed anti-scatter and divergence slits of ¼ were used together
with a beam mask of 10mm. All scans were carried out in ‘continuous’ mode using the
X’Celerator RTMS detector.
Phase identification was carried out by means of the X'Pert accompanying software program
PANalytical High Score Plus in conjunction with the International Centre for Diffraction Data
(ICDD) Powder Diffraction File 2(PDF-2) database (2003 and 2009).
As shown in table 3.6 and figure 3.13 for AW glass-ceramics the crystalline phases are
generally apatite/fluorapatite, wollastonite, diopside and whitlockite. From the PDF2 (2009),
the compounds are diopside (01-073-6374), hydroxylapatite (01-080-6260), wollastonite (04-
010-0710) and whitlockite (04-015-8362). For the older PDF (2003), the compounds are
wollastonite 1A (01-072-2284), hydroxylapatite (01-073-1731), fluorapatite (01-071-0880)
and calcium magnesium phosphate (01-070-0682). Hence from both XRD analyses, there are
evidence of apatite and wollastonite in the glass ceramics used in this research. Although
different PDF2 database that were used yielded different results, the peaks patterns are
consistent. The XRD results show comparable pattern to other researchers (Cannillo et al.,
2009, Podporska et al., 2008). The similarity in the diffraction peak list patterns for AW phase
in the samples indicates that the processing route has not affected the composition in any way.
83
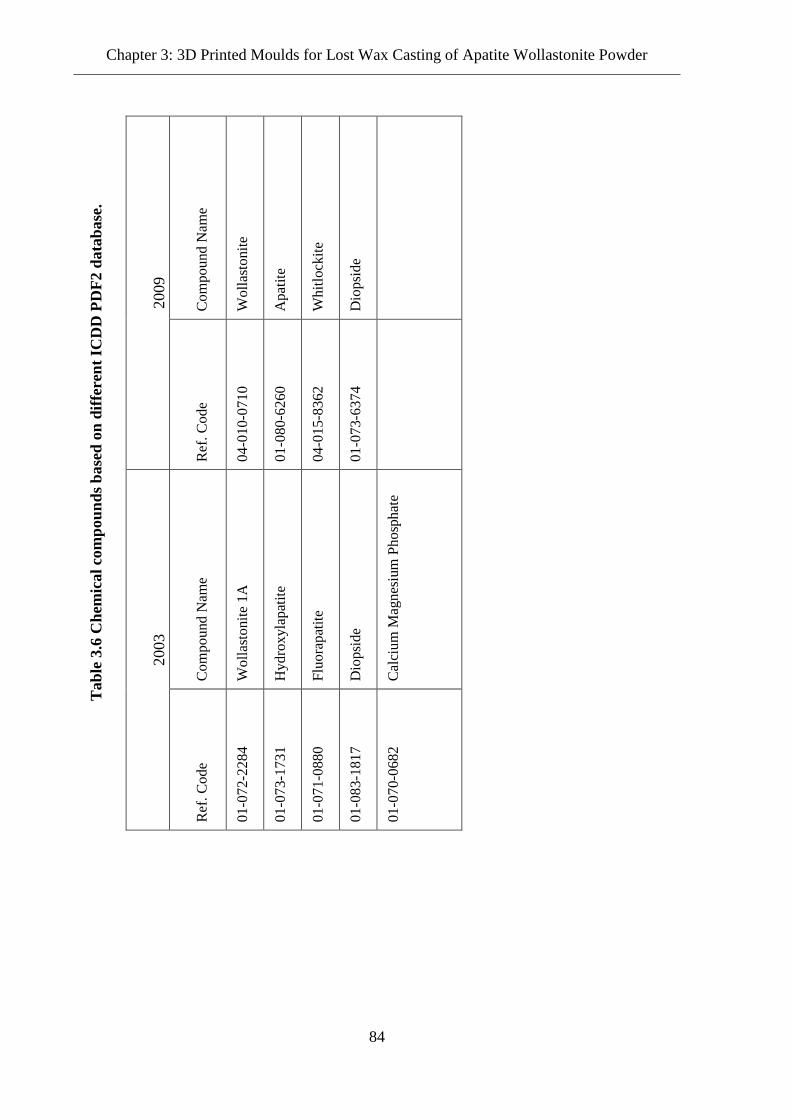
Chapter 3: 3D Printed Moulds for Lost Wax Casting of Apatite Wollastonite Powder
2009
Com
poun
d N
ame
Wol
last
onite
Apa
tite
Whi
tlock
ite
Dio
psid
e
Ref
. Cod
e
04-0
10-0
710
01-0
80-6
260
04-0
15-8
362
01-0
73-6
374
2003
Com
poun
d N
ame
Wol
last
onite
1A
Hyd
roxy
lapa
tite
Fluo
rapa
tite
Dio
psid
e
Cal
cium
Mag
nesi
um P
hosp
hate
Ref
. Cod
e
01-0
72-2
284
01-0
73-1
731
01-0
71-0
880
01-0
83-1
817
01-0
70-0
682
Tab
le 3
.6 C
hem
ical
com
poun
ds b
ased
on
diffe
rent
ICD
D P
DF2
dat
abas
e.
84

Chapter 3: 3D Printed Moulds for Lost Wax Casting of Apatite Wollastonite Powder
(a) AW1
(b) AW2
85

Chapter 3: 3D Printed Moulds for Lost Wax Casting of Apatite Wollastonite Powder
(c) AW1
(d) AW2
Figure 3.13 XRD analysis of the sintered AW cylindrical specimens indicating the
consistent peaks pattern using newer ICDD database (a-b) 2003 and (c-d) 2009.
EDX analyses were conducted on the sintered samples in order to ensure that the chemical
composition is comparable to Kokubo’s formulation (Table 3.7). As shown in table 3.7 ,
Position [°2Theta] (Copper (Cu))10 20 30 40 50 60 70
Counts
0
20000
40000
Elena_A-W1
Peak List
Wollastonite; Calcium Silicon Oxide; Ca Si O3; Anorthic; 04-010-0710; Q: P;ALT
whitlockite, syn; Hydrogen Calcium Magnesium Aluminum Iron Phosphate; H0.825 Ca9.22 Mg0.685 Fe0.115 Al0.045 ( P O4 )7; Rhom
Diopside; Calcium Magnesium Silicate; Ca Mg ( Si O3 )2; Monoclinic; 01-073-6374; Q: I;ALT
Apatite-(CaOH) (Si-substituted), syn; Calcium Oxide Phosphate Silicate Hydroxide; Ca10 ( P O4 )4.92 ( Si O4 )1.08 ( ( O H ) O0.664 );
Position [°2Theta] (Copper (Cu))10 20 30 40 50 60 70
Counts
0
20000
40000
Elena_A-W2
Peak List
Wollastonite; Calcium Silicon Oxide; Ca Si O3; Anorthic; 04-010-0710; Q: P;ALT
whitlockite, syn; Hydrogen Calcium Magnesium Aluminum Iron Phosphate; H0.825 Ca9.22 Mg0.685 Fe0.115 Al0.045 ( P O4 )7; Rhom
Apatite-(CaOH) (Si-substituted), syn; Calcium Oxide Phosphate Silicate Hydroxide; Ca10 ( P O4 )4.92 ( Si O4 )1.08 ( ( O H ) O0.664 );
Diopside; Calcium Magnesium Silicate; Ca Mg ( Si O3 )2; Monoclinic; 01-073-6374; Q: I;ALT
aw1
aw2
86

Chapter 3: 3D Printed Moulds for Lost Wax Casting of Apatite Wollastonite Powder
besides the main chemical composition of silicon, phosphorus, calcium and magnesium; there
are traces of carbon residue which might be resulted from the burnout of the PMMA binder
used.
Table 3.7 The EDX results of the sintered AW cylindrical specimens’ chemical composition as compared to Kokubo’s formulation.
norm wt %
Element
AW1 AW2
Kokubo's
formulation
Silicon 14.13 12.67
15.88
Phosphorus 5.08 4.03
7.06
Calcium 29.92 25.12
31.96
Magnesium 2.75 2.32
2.76
Carbon 2.44 7.06
Oxygen 45.68 48.80
42.10
Aluminium
Fluorine
0.25
100 100
100.01
Table 3.7 and figure 3.15, show the different between Kokubo’s formulation and the AW used
for this research. From the EDX results there is a small percentage of carbon elements
presence in the sintered parts. No further analysis was performed to identify the source of
carbon element, as it is assumed to be caused by the burned out of the PMMA binder used
during the green part fabrication. Furthermore, a small amount of carbon residue can normally
be found in particle surfaces binders (Masia et al., 1989) during normal pure state burn out in
thermal debinding and is difficult to be removed.
By assuming the relative proportions of each element to be based on 100%, the different
between the chemical compositions of AW used in this research for all elements with
Kokubo’s formulation is 1.5% for silicon, 22% for phosphorus, 3.4% for calcium and 10% for
magnesium while from XRD analysis, compound peak list of the sintered specimens showed
clear evidence of apatite/fluorapatite, wollastonite, diopside and whitlockite.
87

Chapter 3: 3D Printed Moulds for Lost Wax Casting of Apatite Wollastonite Powder
(a) AW1
(b) AW2
Figure 3.14 EDX results for sintered two samples specimen fabricated using aluminium sheet mould using the same batch of AW-PMMA powder mixture.
Assessment of moulding process 3.3
The proposed fabrication of AW glass ceramic round specimens was via moulding. At a later
stage of this study, the intention was for fabricating patient specific medical devices using
personalised moulds. Therefore, the requirement was that the moulding system be producible
using AM technologies. Initial moulding systems were created to assess the viability of
88

Chapter 3: 3D Printed Moulds for Lost Wax Casting of Apatite Wollastonite Powder
different moulds for use with different mixing ratio of AW-to-PMMA. Figure 3.16 shows
some of the different mould designs for used in this study.
(c)
(d)
Figure 3.15 Different moulds designed to assess the viability for used in AW scaffold round specimens fabrication; (a) two different designs for aluminium block mould without ejector, (b) CAD design (left) and SLA mould (right)for moulding system with ejector, (c) alternative CAD designs and (d) simple Al sheet mould.
89

Chapter 3: 3D Printed Moulds for Lost Wax Casting of Apatite Wollastonite Powder
In total eight different moulding systems were proposed to produce samples rod for 1mm and
3mm diameter of 20mm in length. 5%, 10%, 15%, 20%, 25% and 30% by weight of PMMA
were blended with AW respectively. Green parts were prepared from the blended powder by
different moulding methods.
SLA mould 3.3.1
A moulding system was design to produce 3mm diameter cylindrical specimen with length of
25mm. It was created using Inventor 2009 (Autodesk, USA) software (Figure 3.16a, b and c).
Once the design was verified, stl files were generated for each of the subcomponents in the
moulding system. A service bureau (Paragon Rapid Technologies Ltd., UK) was used to print
the stl files. The files were printed with Watershed XC material using 3D Systems SLA 250
machine (Figure 3.17a). The mould was filled with AW-PMMA mixture and placed in the
oven at a maintained temperature of 145oC for 2 hours, before the heater was switched off,
and the oven allowed cooling at its normal rate. Specimens produced from SLA mould were
powdery up to the ratio of 15% PMMA. The ratio was further increased to 20% PMMA
where bonding started, and specimen began to form but were not strong enough to be ejected
using the ejector (Figure 3.17b). The specimens are not handleable even the ratio was
increased to 25% as the strength of the specimens are too fragile. Furthermore, some of the
green parts split into two and stuck to the wall of the mould as the bond in the green parts are
not strong enough. No further investigation was carried out as this is looking into producing
load-bearing parts for bone replacement.
(a) (b)
Figure 3.16 Greenpart inside (a) SLA mould, and (b) greenpart as removed from mould.
90

Chapter 3: 3D Printed Moulds for Lost Wax Casting of Apatite Wollastonite Powder
Aluminium (Al) block mould 3.3.2
Since the material used in fabricating the SLA mould has a low thermal conductivity
(DSMSOMOS®), a better thermal conductive material was selected instead for a new design
of the moulding system. In order to test the feasibility of the idea in using better thermal
conductive material, aluminium block and sheet moulds were designed and tested.
The design of the block mould was made simpler (Figure 3.16a) to be fabricated. Aluminium
block was used to fabricate the design as shown. The cylindrical cavities were drilled and
bored to create a smooth surface. Pushpins of 3mm diameter were cut to the required length.
The mould was filled with AW-PMMA mixture and underwent the same heating process for
creating the green parts as before. The powder mixture was not able to consolidate for a ratio
of up to 15%. The ratio of PMMA was increased up to 25% where the powder mixture
consolidated and the green part was able to form in a cylindrical shape. A pushpin was used to
release the green part from the mould. However, when the green part is pushed out from the
mould individually, it broke into two or more pieces. The green part was not strong enough
where it broke under its own weight (gravitational force) and from the friction between the
green part surface and the mould surface that cause the bonding to break. This happened for
both the design. In order to avoid this, a supporting structure needs to be placed underneath
the green part, and friction be reduced.
Aluminium shell mould 3.3.3
Based on the concept of shell moulding, the design of moulding system was to use a thin
sheet of material that conforms to the shape of the part. A steel rod of 3.2mm diameter was
uses as the pattern to form multiple shell moulds. Instead of sand-resin mixture, aluminium
foil was wrapped around the metal mandrel steel rod since the objective was to create
cylindrical shape parts. Figure 3.18 shows the completed mould of diameter 3.0mm and
length 40mm. The thickness of the aluminium foil was about 0.8mm to maintain shape and
just flexible enough when unrolled to expose the green parts. Copper wire was then wound
helically around the aluminium sheet mould before the mandrel was pulled out to create a
shell mould. The cooper wire acted to support and heating-cooling mechanism to the
aluminium sheet shell mould. The same procedure was used to generate the green parts as
described in section 3.2.4. Green parts were successfully produced using this method for
PMMA ratio of 20% upward. The green parts were later sintered under the heating profile as
shown in Figure 3.6. in sub-section 3.2.5. 91

Chapter 3: 3D Printed Moulds for Lost Wax Casting of Apatite Wollastonite Powder
Figure 3.17 Simple rolled-up Aluminium sheet mould of diameter 3.0mm.
FDM with aluminium sheet shell mould 3.3.4
Based on the initial finding in section 3.2 and sub-section 3.3.3, development of a moulding
system was started by designing the mould using CAD software. A simple design was created
that used the concept of utilising aluminium foil that conforms to the shape of the cavity of
the mould. Figure 3.19 show the CAD models of the moulds were designed using Autodesk
Inventor2009.
The first design was a simple cavity mould, which produced cylindrical specimen. The mould
was fabricated in ABS material using an FDM machine (BST Statrasys, USA). The designs of
the mould were enlarged to compensate for the thickness of the aluminium foil used. The
CAD model was later exported as an STL file for fused deposition fabrication. Design on the
left (Figure 3.19(a)) was held together by end clamp while on the right (Figure 3.19(b)) was
held by 4 M8 screws.
92

Chapter 3: 3D Printed Moulds for Lost Wax Casting of Apatite Wollastonite Powder
Fabrication Process 3.3.4.1
The mould was prepared by placing aluminium foil across the mould cavity of 4.0mm in
diameter with length of 30mm and rods of 3.2mm were used to indent the aluminium foil
such that the foil will conformed to the mould cavity. Mould release agent was sprayed onto
the foil. Once in place, the assembly was held together by clamping force. Preheated AW-
PMMA mixture was gravity fed into the mould using a funnel of 2mm diameter opening.
Light tapping was applied on the funnel to loosen up the powder mixture such that it flows
into the mould. Then, a small rod of diameter 3mm was used to compact the mixture in the
cavity. The completed assembly was later placed in the oven according to the setup as
described in sub-section 3.2.4 to solidify the PMMA particles and bound the AW powder.
The outcome from this setup was not as promising as using the setup where the aluminium
foil was completely exposed to heating (refer sub-section 3.2.4 and 3.3.3). Therefore, the
duration of heating time was increase substantially such that the heat can penetrate the mould
assembly and reached the powder mixture. This produced favourable improvement to the
green parts but at the expense of a longer time. Since ABS has low thermal conductivity, the
ABS mould by FDM takes a longer heating time to penetrate the mould assembly. Therefore,
(a) (b)
(c)
Figure 3.18 Two designs of mould that use aluminium foil to ease removal of moulded part (a) 2-piece Al mould with end-cover (b) 2-piece mould incorporating end cover, and (c) Al sheet on the fabricated mould with top view and assembled front view.
93

Chapter 3: 3D Printed Moulds for Lost Wax Casting of Apatite Wollastonite Powder
in order to reduce the time, different alternative of heating process are needed such as
microwave heating. This is discussed as future work in section 7.2.
Different moulding system outcome 3.3.5
The outcome from the different moulding systems for the AW-PMMA powder mixture ratios
was as shown in Table 3.10. In all three moulding system used, the mould made with
aluminium sheet look the most promising, as it can produce green parts with the lowest
percentage of PMMA.
A weight ratio of 80% AW to 20% PMMA was selected as this ratio provides handleable
green parts without breaking when remove from aluminium sheet mould. However, cares are
taken when handling the green parts as they broke easily.
Table 3.8 Samples of different AW-PMMA ratio tested on different mould.
Sample
Percentage
by weight
Ratio of
AW-PMMA
Mould used
Result
AW
(%)
PMM
A (%
)
SLA
Watershed
XC Clear
(X)
Aluminium
Block
(Y)
Aluminium
Sheet
(Z)
APM1 95 5 Powdery Not tested Not tested APM1 was not
used as parts
were not
formed.
APM2 90 10 Powdery Not tested Not tested APM2 was not
used as parts
were not
formed.
APM3 85 15 Partially
bond. Broke
when
removed
from the
mould
Partially bond.
Broke when
removed from
the mould
Partially bond.
Broke when
removed from
the mould
APM3 was not
used as parts
cannot be
handled.
94

Chapter 3: 3D Printed Moulds for Lost Wax Casting of Apatite Wollastonite Powder
APM4 80 20 Broke when
removed
from the
mould
Broke when
removed from
the mould
Handleable,
with care, a
few samples
broke when
transferring to
sintering oven.
APM4-Z was
able to produce
handleable parts.
APM5 75 25 Broke when
removed
from the
mould
Broke into two
pieces when
removed from
the mould
Handleable,
gently
APM5-Z was
able to produce
handleable parts.
APM6 70 30 Not tested Not tested Handleable,
gently
APM6-Z was
able to produce
handleable parts.
Based on the outcome as shown in Table 3.9 and Figure 3.17, the route to create AW
specimens was to use aluminium sheet mould with a powder mixture ratio of 80%wt. AW to
20% wt. PMMA even though it is not ideal. In this research, the need is to determine the
lowest possible mixing ratio of AW-to-PMMA to be used in the fabrication where the
required length to be cut from the possible length of 25mm of the sintered specimens is 3mm
for used in TE study. However, for this research a powder mixture ratio of 70%wt. AW to
30% wt. PMMA was selected as this is more ideal and stable for fabrication of implants and
implants by 3DP.
Case Study 3.4
A specific case study was developed to gauge the feasibility of using the FDM pattern with
aluminium sheet to produce shell mould for the fabrication of a customised complex part.
Specific Case Study Background 3.4.1
Bone defects cause by congenital deficiencies, cancer resections, and traumas are often
reconstructed using the autografts and allografts procedure. In the reconstruction in en bloc
resection of mandible, it has always been a challenge for surgeons and patients. Although the
procedures of bone grafting are used in bone repairs, there are concerns of invasive bone
collection from healthy sites, discomfort and morbidity to donor site, limited material from
donor site, the need of further surgery, the risk of transmitted disease, and social or religious 95

Chapter 3: 3D Printed Moulds for Lost Wax Casting of Apatite Wollastonite Powder
refusal in some regions in the world (Schlickewei and Schlickewei, 2007, Schmitz, 2005,
Silber et al., 2003, St John, 2003). Furthermore, the process of grafting aesthetical and precise
bone to fit the deformity is time-consuming and laborious. In addition, fixation fails are
caused by a number of mechanisms that include insufficient amount of fixation, fracture of
the plate, loosening of the screws, and devitalisation of bone around screws (Cienfuegos et al.,
2008). It has been reported that with the use of rigid reconstruction plate to reconstruct a large
mandibular defect in patients who do not have bone grafts following tumour excision, the
frequency of a plate fracture to be 2.9% to 10.7% (Martola et al., 2007, Shibahara et al., 2002,
Freitag et al., 1991). This couple with the fact of complications during surgical attachment of
the reconstruction plate (Kim and Park, 2007). In order to overcome these limitations,
artificial bone substitutes are seen as the logical choice since they are non-invasive and free
from contamination. In this particular case study, the approach to the reconstruction of the
whole resected mandible is by integrating DFMA methodology and AM technologies in the
design and fabrication of the implants. In this section, the design and AM customised
prosthesis for restoration of continuity and stability in the mandible were described.
Design and AM manufacturing of Implant Moulding System 3.4.2
In the design and fabrication of the implant, concerning factors that need to be overcome are
to engineer anatomically correct pieces of viable and functional implant for bone
reconstructions and to attach the implant with ease. Normally most of the fixation methods for
mandibular reconstruction and fracture system consist of drill bits, plate bending forceps,
plate holding forceps, plate cutters, cannulas, taps, countersinks, plate bending pliers, plate
cutters, drill guides and screwdrivers to facilitate the placement of screws and modification of
plates. The implant for reconstruction is secured in place by plate and screw (Figure 3.20a).
Hence, by benefiting from the geometrical freedom allowed in AM and the DFMA
methodology, the implant was design to integrates the fixation method into the implant such
that it is able to be attach to the mandible without the need of plate and screw (Figure 3.20b).
A lower jaw bone model in STL format was imported to the CAD software for design of the
implant. The lower jaw is non-defective and was obtained from a secondary source
(3DSystems). A simulated defective section was created on the jaw by cutting a section of it
using CAD software (Figure 3.18b).
96

Chapter 3: 3D Printed Moulds for Lost Wax Casting of Apatite Wollastonite Powder
Figure 3.19 (a) Conventional implant fixation method. (b) A section cut-out for implant with slotted joint.
DFMA methodology in design of mandible implant 3.4.3
As has been mentioned earlier, the fixation of the implant to the resected mandible required
considerable amount of parts, tools and assembly steps. By reducing the amount of parts,
tools and assembly steps, the operational cost can be kept to minimal. The typical cost for
ORIF mandibular fracture fixation management per person is £34,636 in UK (Schmidt et al.,
2000) and increasing from USD26,089 to USD35,804 in USA (Pena et al., Shetty et al.,
2008). Thus by incorporating AM technology in the design stage of fixation devices, the
assembly steps can be reduced which can lead to overall cost reduction for fracture fixation
management. The reduction of the part count and the possibility to even reduce the number of
parts in an assembly to one is doable using AM as AM geometric freedom allows the designer
to consolidate parts in ways that have previously been impossible (Mansour and Hague,
2003).By using the DFMA methodology, some of the parts and assembly steps can be
reduced. The recommendations by Boothroyd (Boothroyd, 1994) are as outlined: -
a) Is it necessary for parts to have a relative movement between them?
b) Is it necessary to have different materials specification for physical or chemical reasons or
both?
c) Must the component be dismountable to facilitate the maintenance?
Based on the consideration as set in the DFMA rules, the part count in attaching the implant
was reduced to one as relative motion is not required between parts where only a single
97

Chapter 3: 3D Printed Moulds for Lost Wax Casting of Apatite Wollastonite Powder
material is used and is bioactive. Thereby eliminating the need to remove the implant fixators
as the implant fixation can be achieved through biological and bioactive fixation methods.
Design of Implants for mandible reconstruction 3.4.4
A 3D computer model in stereolithography (stl) format of a mandible was obtained from 3D
Systems. This model was imported to CAD modeller Autodesk Inventor2009 (using StlImport
software add-on from Sycode). A section of the mandible was selected to be a representative
geometry for a small implant. Based on the outcome from DFMA guidelines, some simple
features were added to the model to illustrate how location and fixation could be achieved
(see Figure 3.21a.) for the implant (Khan, 2010). The model was then used to generate a
multipart mould model (see Figure 3.21b). The CAD model of the mould was translated into
STL format and imported into Statrasys Dimension SST768 fused deposition machine.
CatalystEX software was used to implement some corresponding preparations on the STL
model such as checking the model water-tightness, build orientation and supports before the
final file was sent to be processed into a CMB file that was sent to the Dimension printer for
printing the part. A layer thickness of 0.33mm was selected, and commercial ABS plastic was
used during the fabrication of the mould as shown in Figure 3.21c.
Fabrication and Attachment of Implants for mandible reconstruction 3.4.5
Using the same procedure as described in sub-section 3.2.4 and sub- section 3.3.4, the FDM
mould cavities were then layered with aluminium foil of 0.8mm thick. The foil was then
pressed to conform to the shape of the cavity (Figure 3.22). When both halves of the mould
Figure 3.20 (a) CAD implants model, (b) CAD multiple parts mould of implants and (c) FDM fabricated mould with one-half of the mould filled with modelling wax as used in LWC.
98

Chapter 3: 3D Printed Moulds for Lost Wax Casting of Apatite Wollastonite Powder
are prepared with aluminium foil, the mould is closed and clamped. Preheated AW-PMMA
powders were poured into the mould and were pressed manually with rod. The prepared
assembly was then placed in the oven to bind the mixture in producing the green part. The
green part was removed from the oven and placed in a sintering furnace.
The result is not favourable as shown in Figure 3.23. This can be because the green parts of
the AW-PMMA powder mixture were not fully compacted inside the mould, and air is still
trapped in the mixture. When sintering is performed, this created crack in the implant.
Furthermore, heat was not evenly distributed as the mould is of uneven thickness and
undercuts. No further investigation was carried out using this moulding technique.
Figure 3.21 Aluminium foil as pressed into the cavity of the AM mould.
Figure 3.22 Sintered AW implant from green part of implant produced from FDM mould with Al sheet shell mould.
99
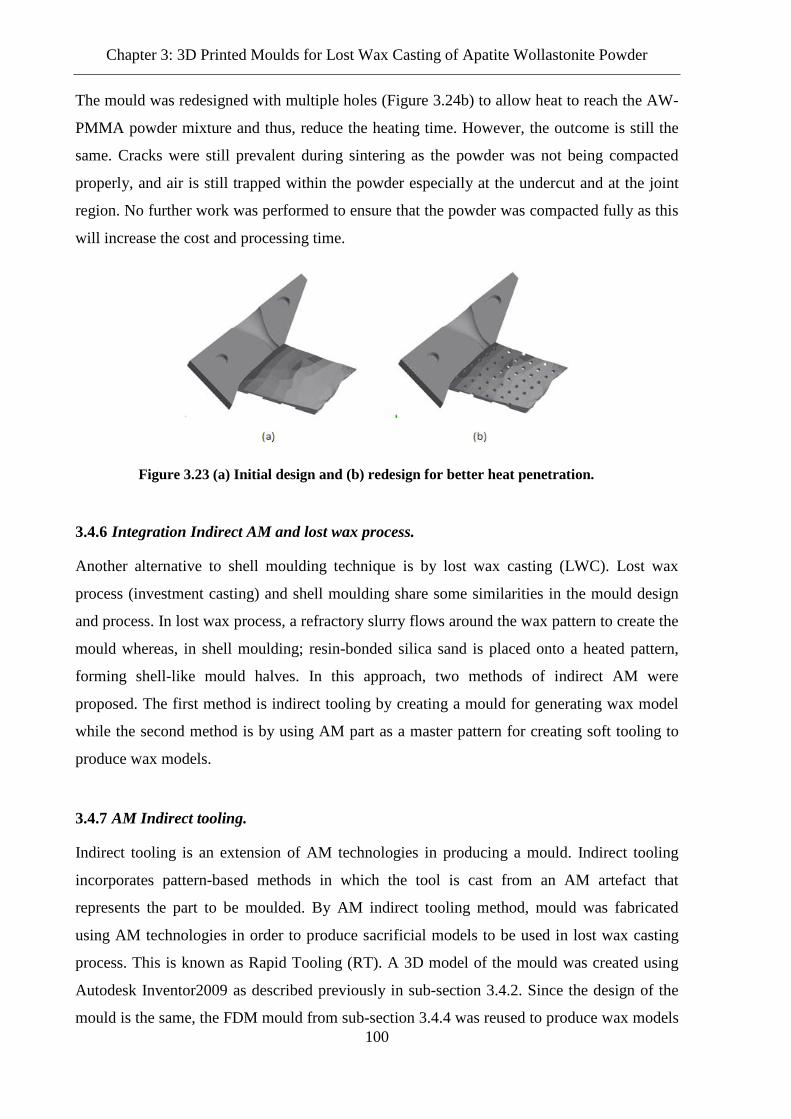
Chapter 3: 3D Printed Moulds for Lost Wax Casting of Apatite Wollastonite Powder
The mould was redesigned with multiple holes (Figure 3.24b) to allow heat to reach the AW-
PMMA powder mixture and thus, reduce the heating time. However, the outcome is still the
same. Cracks were still prevalent during sintering as the powder was not being compacted
properly, and air is still trapped within the powder especially at the undercut and at the joint
region. No further work was performed to ensure that the powder was compacted fully as this
will increase the cost and processing time.
Integration Indirect AM and lost wax process. 3.4.6
Another alternative to shell moulding technique is by lost wax casting (LWC). Lost wax
process (investment casting) and shell moulding share some similarities in the mould design
and process. In lost wax process, a refractory slurry flows around the wax pattern to create the
mould whereas, in shell moulding; resin-bonded silica sand is placed onto a heated pattern,
forming shell-like mould halves. In this approach, two methods of indirect AM were
proposed. The first method is indirect tooling by creating a mould for generating wax model
while the second method is by using AM part as a master pattern for creating soft tooling to
produce wax models.
AM Indirect tooling. 3.4.7
Indirect tooling is an extension of AM technologies in producing a mould. Indirect tooling
incorporates pattern-based methods in which the tool is cast from an AM artefact that
represents the part to be moulded. By AM indirect tooling method, mould was fabricated
using AM technologies in order to produce sacrificial models to be used in lost wax casting
process. This is known as Rapid Tooling (RT). A 3D model of the mould was created using
Autodesk Inventor2009 as described previously in sub-section 3.4.2. Since the design of the
mould is the same, the FDM mould from sub-section 3.4.4 was reused to produce wax models
Figure 3.23 (a) Initial design and (b) redesign for better heat penetration.
100

Chapter 3: 3D Printed Moulds for Lost Wax Casting of Apatite Wollastonite Powder
of the implant. The cavities of the mould were filled with modelling wax in which sacrificial
pattern is generated. Scopas Yellow Modelling Wax Type B (Alec Tiranti Ltd., Berkshire,
UK) was manually worked into the cavities of each half of the mould (see Figure 3.21c) as it
softens during the moulding process. Petroleum jelly was applied to the mould cavities prior
to filling the cavities with wax for ease of demoulding. A complete wax model of the implant
was achieved by joining the two halves. The wax model with gating was then suspended in a
container. Cerrostone plaster (Special Plasters Ltd., Birmingham) was prepared by mixing
with water and was poured over the wax model pattern. This was left overnight to set. The
wax pattern in the mould was then melted out by inverting the mould and heated to 90ºC in
the oven. Powder mixture of 80wt% of 53-90μm AW (Glass Technology Services, Sheffield)
and 20wt% of 4-8 μm PMMA (Ganzpearl GM-0600) was used to fill the cavity generated in
the hardened plaster mould. The powder was preheated to 120ºC for 60 minute to dry it. This
allowed it flow freely into the mould cavity. The powder was compacted using vibration and
pressure (applied using an aluminium rod). This assembly was heated using the same heating
profile used as for the cylindrical rods. At the end of the furnace cycle, the cast was soaked in
water to soften the plaster, and a small hammer was used to crack the plaster and expose the
fabricated implant. Figure 3.25 shows a comparison between the FDM, the wax model and
the fabricated AW part and several of the implants as produced from this method. There is a
slight variation on the AW part due to shrinkage as well as small cracks. With further
fabrications by adjusting the powder packing, some improvements were noted on the parts in
term of reducing crack, and the geometrical shape is near to the model geometry. This result
is better than the outcome as describe in section 3.4.5.
A flow chart of the entire process flow in obtaining the customised AW implants is
summarised Figure 3.26. With this method the cost is kept low as the total materials cost for
the fabrication components; the FDM mould (£260.15, cost for material and 14hours printing
time), modelling wax (£16/kg, 1 hours ) and Cerrostone plaster (£11/25kg, overnight ),
amounted to less than £270.00 as the wax and plaster had only minimal cost contribution. The
total hours spend in this process was 15hours and overnight for plaster to set. The cost of
using this approach (Rapid Tooling approach) is as shown in Table 3.11.
101
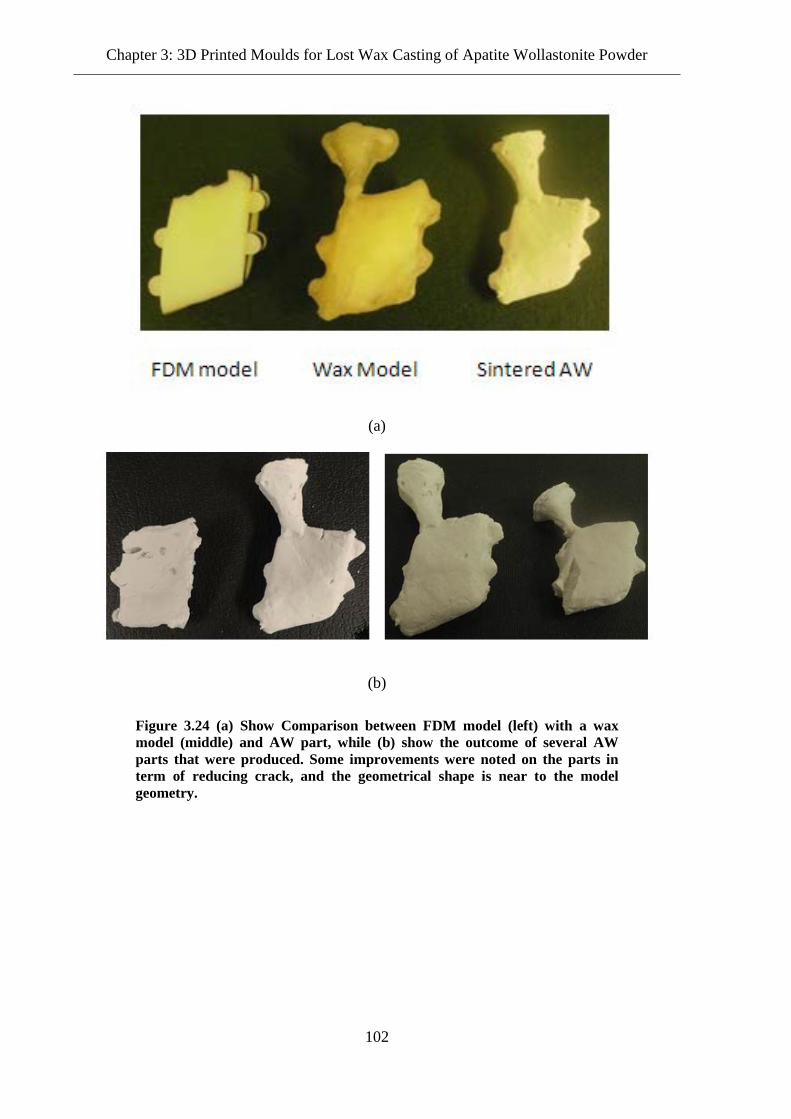
Chapter 3: 3D Printed Moulds for Lost Wax Casting of Apatite Wollastonite Powder
(a)
(b)
Figure 3.24 (a) Show Comparison between FDM model (left) with a wax model (middle) and AW part, while (b) show the outcome of several AW parts that were produced. Some improvements were noted on the parts in term of reducing crack, and the geometrical shape is near to the model geometry.
102

Chapter 3: 3D Printed Moulds for Lost Wax Casting of Apatite Wollastonite Powder
Table 3.9 Materials cost for fabricating a unit of AM indirect tooling.
Component Material
Price/ unit
Time Amount used
FDM Mould £260.15 *14hours (cost of
printing time is
inclusive in the
material price/unit)
£260.15
Modelling Wax £16/kg (kit) 1 hours (preparation,
and setting)
£4.00 (Less than a
quarter of kit)
Cerrostone Plaster £11/25kg overnight £0.50 (minimal)
Total 15 hours + overnight Less than £264.55
Figure 3.25 Processing flow in indirect fabrication of customised AW medical implants.
103

Chapter 3: 3D Printed Moulds for Lost Wax Casting of Apatite Wollastonite Powder
AM in soft tooling 3.4.8
In this second approach of indirect tooling, a master pattern of the implant was generated for
used in creating the soft tooling. A master pattern was modelled using CAD software as
describe in section 3.4.4. and the detailed steps as described in appendix C3. The implant’s
CAD model was 3D printed using FDM. Permanent dark coloured ink is used to create
parting lines. The parting lines were drawn onto the master pattern as a guide when splitting
the mould into two halves. The FDM master pattern was affixed with modelling wax gating.
The assembly was then placed in the centre of the moulding box by attaching the end of the
gating to the bottom of the box. A 1:1 by weight mixing ratio of a two parts translucent
silicone RTV moulding compound was prepared (Addition Cure 33 Silicone Rubber, Alec
Tiranti Ltd., Berkshire, UK). Mixing and degassing of the mixture need to be completed
within a 20 minutes time frame. Vacuum was applied to remove air bubbles from the
moulding compound prior to pouring and after pouring as air trapped will cause defects. The
mixture was then poured over the pattern and filled the moulding box (Figure 3.27(a)). This
was left to cure for 4 hours. The hardened soft RTV mould was split along the parting lines
using scalpel knife. Figure 3.27(b) show the RTV mould. Based on the parting line, non-
uniform corrugated splitting surface/plane was created to ease in the assembly of the mould.
This will only allow a single mating plane, thus saving time when assembling the mould.
Figure 3.26 (a) Preparation for soft tooling moulding with FDM master pattern and (b) wax pattern as duplicated from RTV silicone mould of the FDM master pattern.
The RTV mould was then used to obtain the wax model (Figure 3.28a). The model produced
was able to capture all the features of the master pattern with a slight deviation to the surface 104
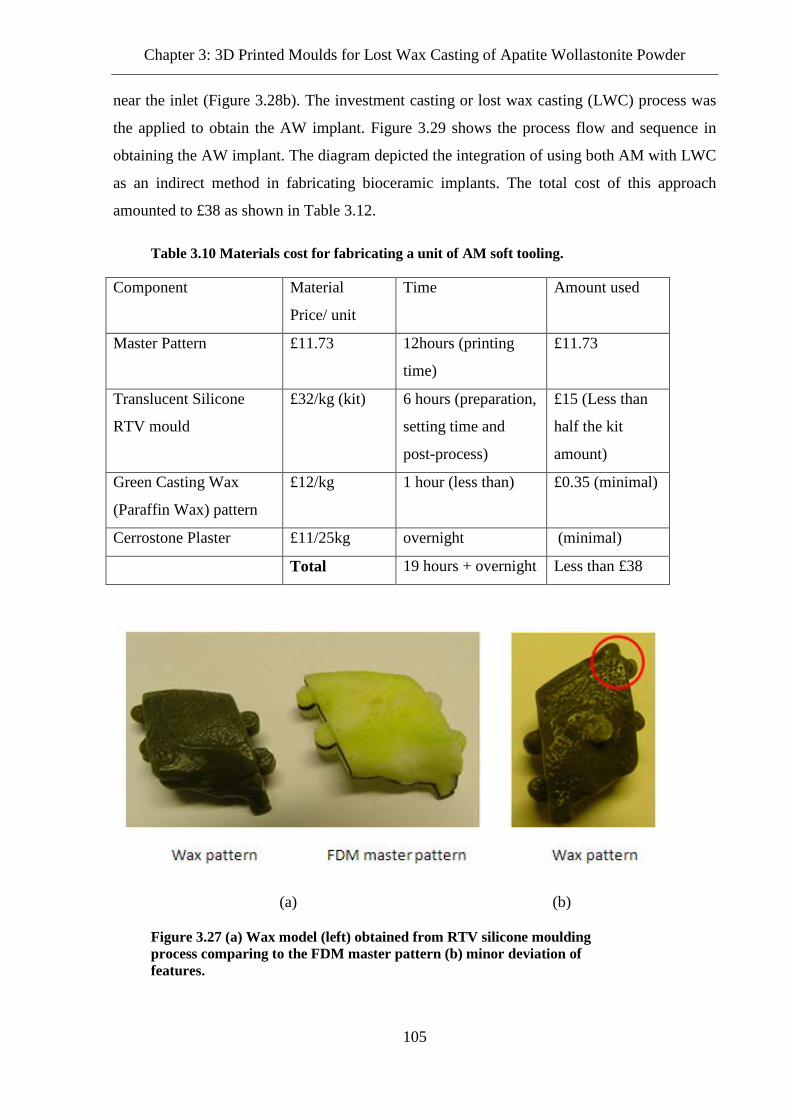
Chapter 3: 3D Printed Moulds for Lost Wax Casting of Apatite Wollastonite Powder
near the inlet (Figure 3.28b). The investment casting or lost wax casting (LWC) process was
the applied to obtain the AW implant. Figure 3.29 shows the process flow and sequence in
obtaining the AW implant. The diagram depicted the integration of using both AM with LWC
as an indirect method in fabricating bioceramic implants. The total cost of this approach
amounted to £38 as shown in Table 3.12.
Table 3.10 Materials cost for fabricating a unit of AM soft tooling.
Component Material
Price/ unit
Time Amount used
Master Pattern £11.73 12hours (printing
time)
£11.73
Translucent Silicone
RTV mould
£32/kg (kit) 6 hours (preparation,
setting time and
post-process)
£15 (Less than
half the kit
amount)
Green Casting Wax
(Paraffin Wax) pattern
£12/kg 1 hour (less than) £0.35 (minimal)
Cerrostone Plaster £11/25kg overnight (minimal)
Total 19 hours + overnight Less than £38
(a) (b)
Figure 3.27 (a) Wax model (left) obtained from RTV silicone moulding process comparing to the FDM master pattern (b) minor deviation of features.
105

Chapter 3: 3D Printed Moulds for Lost Wax Casting of Apatite Wollastonite Powder
Figure 3.28 Processing flow in fabricating customised AW medical implants by indirect AM with the integration of RTV silicone mould and LWC process.
106
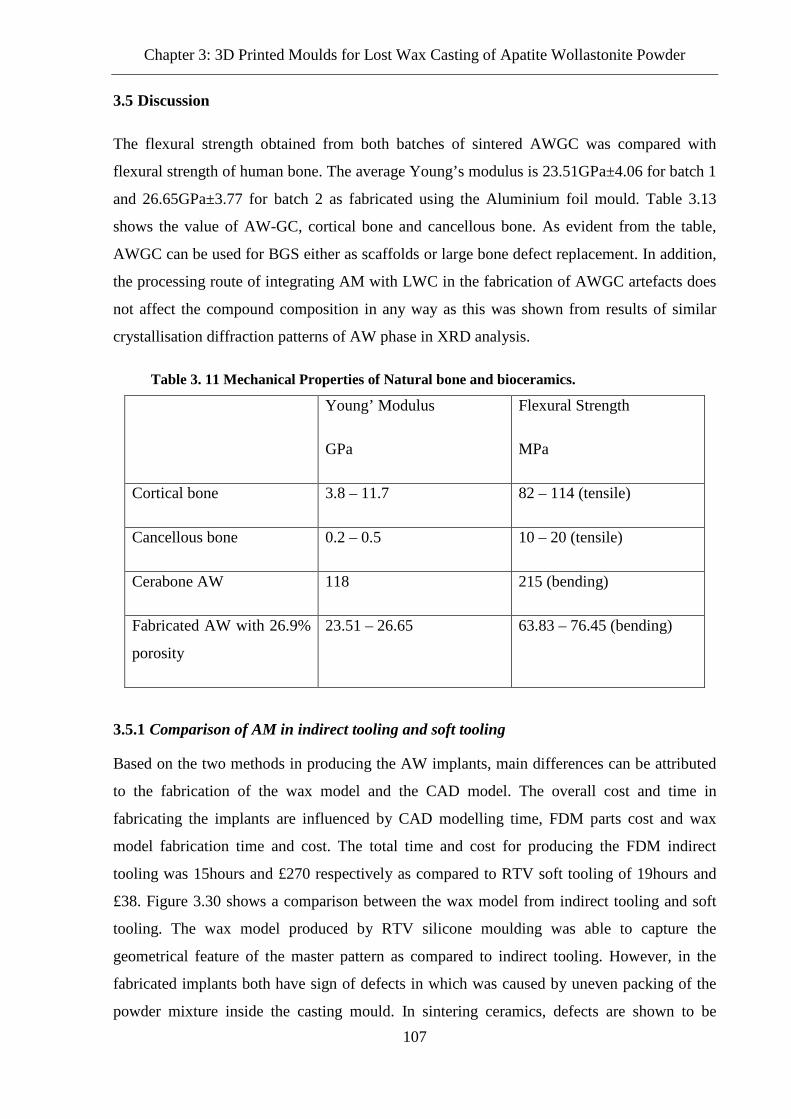
Chapter 3: 3D Printed Moulds for Lost Wax Casting of Apatite Wollastonite Powder
Discussion 3.5
The flexural strength obtained from both batches of sintered AWGC was compared with
flexural strength of human bone. The average Young’s modulus is 23.51GPa±4.06 for batch 1
and 26.65GPa±3.77 for batch 2 as fabricated using the Aluminium foil mould. Table 3.13
shows the value of AW-GC, cortical bone and cancellous bone. As evident from the table,
AWGC can be used for BGS either as scaffolds or large bone defect replacement. In addition,
the processing route of integrating AM with LWC in the fabrication of AWGC artefacts does
not affect the compound composition in any way as this was shown from results of similar
crystallisation diffraction patterns of AW phase in XRD analysis.
Table 3. 11 Mechanical Properties of Natural bone and bioceramics.
Young’ Modulus
GPa
Flexural Strength
MPa
Cortical bone 3.8 – 11.7 82 – 114 (tensile)
Cancellous bone 0.2 – 0.5 10 – 20 (tensile)
Cerabone AW 118 215 (bending)
Fabricated AW with 26.9%
porosity
23.51 – 26.65 63.83 – 76.45 (bending)
Comparison of AM in indirect tooling and soft tooling 3.5.1
Based on the two methods in producing the AW implants, main differences can be attributed
to the fabrication of the wax model and the CAD model. The overall cost and time in
fabricating the implants are influenced by CAD modelling time, FDM parts cost and wax
model fabrication time and cost. The total time and cost for producing the FDM indirect
tooling was 15hours and £270 respectively as compared to RTV soft tooling of 19hours and
£38. Figure 3.30 shows a comparison between the wax model from indirect tooling and soft
tooling. The wax model produced by RTV silicone moulding was able to capture the
geometrical feature of the master pattern as compared to indirect tooling. However, in the
fabricated implants both have sign of defects in which was caused by uneven packing of the
powder mixture inside the casting mould. In sintering ceramics, defects are shown to be 107

Chapter 3: 3D Printed Moulds for Lost Wax Casting of Apatite Wollastonite Powder
influenced by the powder compaction process (Shinohara et al., 1999) in which potential
fracture origins were formed in green bodies through the dimple in the powder granules,
inadequate cohesion of the granules and the large grains developed from large particles in the
green body.
The RTV silicone mould method was able to produce implant close to the master FDM
pattern as shown in figure 3.30.This approach can be adapted as a low cost method to
fabricate patient specific implant as the use of RTV moulding had also been demonstrated to
be favourable in other research for the fabrication of gas turbine blade (Vaezi et al., 2011) and
femoral prosthesis (Ramos and Simoes, 2009). Furthermore, the accuracy of the wax patterns
produced are high as reported by Rahmati et al. (Rahmati et al., 2007) and Yarlagadda et al.
(Yarlagadda and Hock, 2003).
Conclusions 3.6
The integration of low cost conventional manufacturing with AM and CAD technologies can
be approach as an alternative method to create bioceramic BGS Indirect AM tooling route,
utilising lost wax casting and sintering techniques allowed AWGC medical implants to be
fabricated. This approach can keep the fabrication cost low and yet still be able to capture the
intended design geometry closely. The processing route did not change the composition of
AWGC and porosity was evidence in the implants. The porosity level and bending strength of
the parts produced was similar to that of cortical bone, but increased macroporosity and inter-
Figure 3.29 Comparison of the wax model with FDM model. Model from modelling wax showing higher loss definition of the feature as compared to the wax model from RTV soft tooling.
108

Chapter 3: 3D Printed Moulds for Lost Wax Casting of Apatite Wollastonite Powder
connected channels would need to be designed into the structure in order to optimise cell
propagation and bone growth.
Table 3.12 Comparison between indirect tooling and soft tooling in indirect AM for processing bioceramic.
Rapid tooling Soft tooling
Number of CAD model 9 1
FDM parts fabrication 9 1
Additional process No RTV moulding
process
Wax model fabrication 1 1
Time 15 hours+
overnight
19 hours +
overnight
Cost £270.00 Less than £38
Closeness to actual designed
shape.
Medium High
Comparing both indirect AM methods (using AM mould and master pattern, Table 3.13), the
overall cost is significantly lower than using direct AM methods for fabricating large
customised bone implants or BGS. However, there is a compromise of using indirect AM
methods in term of time as the time will increase due to the additional steps taken and the use
of manual labour. In addition, if simple shape scaffolds of small size are required, then the
aluminium foil sheet moulding method will be more economical as the materials cost the
mould amounted to less than £2.
109

3D Printing of bioceramics powder Chapter 4:
Introduction 4.1
This chapter describes a process for fabricating implants using indirect three dimensional
printing (3DP). An AW powder mixture is developed in this study of the printing process.
Characterisation was performed on the powder mixture bondability prior to use in a
commercial 3D Printer machine. Morphology analysis and mechanical testing were performed
to study the characteristics of the printed artefacts. Artefacts were designed and manufactured
to evaluate the capabilities of the process.
Materials and Methods 4.2
A list of materials and equipment used in this study is as shown Table 4.1.
Table 4.1 List of equipment used in the study.
Item Description Purpose
Materials
AW, Sheffield Glass Ltd.,
UK
Powder in particle sizes
of 120µm and below
Built material for
Specimen and Implant
Maltodextrine, Sigma-
Aldrich, UK.
53µm particles Binding agent
Polyvinylpyrolidone
(PVP);(Kollidon90), BASF
53µm particles Binding agent
Fine sugar, Tate UK On the shelf grade Binding agent
Darvan C-N, Lake Chemicals
and Minerals Ltd., UK.
Liquid Surfactant
Alcohol (Ethanol), Fisher
Scientific, UK.
Absolute (200 proof) and
molecular biology grade
Reagent
Equipment
Sieve shaker Adjustable speed
vibrating shaker with
timer control.
Vibrate powder
Stainless steel sieve mesh,
Fisher Scientific, UK.
Mesh sizes of 90µm,
53µm and 20µm.
Particles separation
110

Chapter 4: 3D Printing of Bioceramics Powder
Planetary ball mill with
ceramic jar and balls, Pascall
L9FS
Constant rotational speed
ball mill.
Particles reduction of
AW.
Aluminium ‘V’ mixer In-house fabricated
mixer.
Mixing of AW and
binding agent powder
mixture.
Carbolite furnace Programmable furnace of
up to 1600oC.
Sintering of AW
Motic microscopes with
Motic Images Plus 2.0
software
Window XP compatible
software
Measurement and
surface images
Cambridge Stereoscan 240
SEM machine, UK
- Morphological analysis
of materials
Instron 5567 universal testing
machine with Bluehill
Software, Instron UK
Bench top Universal
testing machine with low
load cell.
Mechanical testing of
specimens
Process 4.2.1
The raw materials used in this study were prepared according to the procedure as shown in
figure 4.2. The AW powders obtained from the supplier were placed inside a ceramic jar to be
milled to finer particles sizes using a planetary ball mill ball. Planetary dry ball mill (Pascall
L9FS) was used to obtain different particles size of AW (Figure 4.1). Ceramic jar of 1000ml
volume with a mixture of 6mm and 9mm diameter ceramic balls charge were used. The AW
powders were ball milled for 4 hours at an operational jar speed of 85rpm. A sieve shaker
with sieves of mesh 90µm, 53µm and 20µm was used to sieved the milled AW into four
different sizes of above 90µm, 53µm to 90µm, 20µm to 53µm, and below 20µm. The milling
was conducted under the setting conditions of the critical speed and time of milling. The
calculation of critical milling speed and operational speed is calculated from equation 4.1 and
4.2 as shown below,
ν = 𝜋𝜋2∗ � 𝑔𝑔
𝑅𝑅−𝑟𝑟 rpm
111

Chapter 4: 3D Printing of Bioceramics Powder
ν = 29.9√𝑅𝑅
rpm (4.1)
where
ν=critical speed (rpm),
R= radius of ball mill (i.e. jar inner diameter) (m), and
r= radius of ball (m)
g=9.81m/s2.
Operational speed = 50% to 75% of critical speed (4.2)
For optimal efficiency in milling, the jar was filled with 50% volume of ball charge and 20%
volume of AW powder. The amount of material charge and numbers of ceramic ball charge
used were determined from the planetary ball mill manual using equation 4.3 and equation 4.4
in order to achieve maximum efficiency in the milling process.
Material charge = 12𝑎𝑎𝑛𝑛𝑛𝑛𝑚𝑚𝑛𝑛𝑎𝑎𝑎𝑎𝑛𝑛 𝑐𝑐𝑎𝑎𝑐𝑐𝑎𝑎𝑐𝑐𝑛𝑛𝑐𝑐𝑐𝑐 𝑛𝑛𝑜𝑜 𝑗𝑗𝑎𝑎𝑛𝑛 ∗ 𝑎𝑎𝑑𝑑𝑎𝑎𝑑𝑑𝑛𝑛𝑐𝑐𝑐𝑐 𝑛𝑛𝑜𝑜 𝑚𝑚𝑎𝑎𝑐𝑐𝑑𝑑𝑛𝑛𝑛𝑛𝑎𝑎𝑛𝑛 (4.3)
Figure 4.1 Ball mill machine that was used in the milling process of AW powders.
A ‘V’ mixer was used to prepare the powder mixture. The inside surface of the ‘V’ mixer was
cleaned with alcohol-based solvent and purged with compress air. A lathe machine was used
to rotate the ‘V’ mixer at a speed of 120rpm for 60minute for mixing of the powder mixture.
The mixtures were evaluated against a set of different binder solutions. Based on the outcome,
a Z-Corp 3DP was later used to 3D print artefacts using the selected combination of powder
112
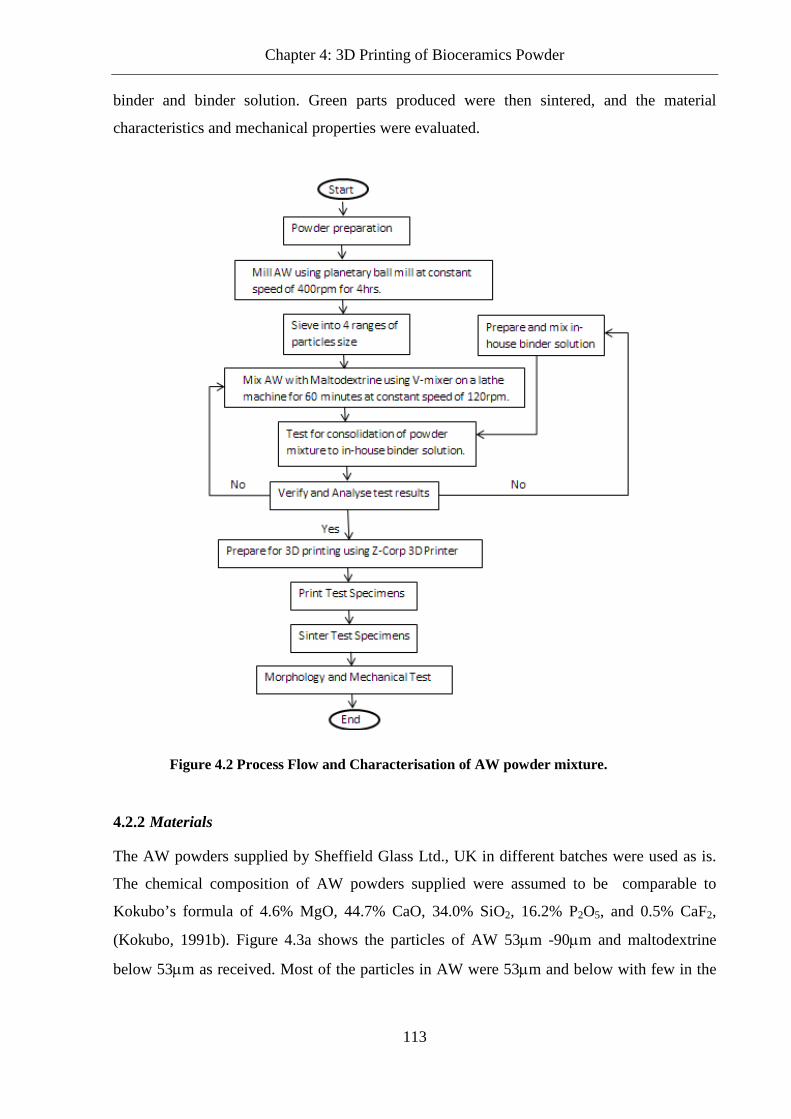
Chapter 4: 3D Printing of Bioceramics Powder
binder and binder solution. Green parts produced were then sintered, and the material
characteristics and mechanical properties were evaluated.
Materials 4.2.2
The AW powders supplied by Sheffield Glass Ltd., UK in different batches were used as is.
The chemical composition of AW powders supplied were assumed to be comparable to
Kokubo’s formula of 4.6% MgO, 44.7% CaO, 34.0% SiO2, 16.2% P2O5, and 0.5% CaF2,
(Kokubo, 1991b). Figure 4.3a shows the particles of AW 53µm -90µm and maltodextrine
below 53µm as received. Most of the particles in AW were 53µm and below with few in the
Figure 4.2 Process Flow and Characterisation of AW powder mixture.
113

Chapter 4: 3D Printing of Bioceramics Powder
90µm range. In Figure 4.3b, particles were round and made up of mostly 20µm to 30µm size
particles although some of the maltodextrine particles were melted during SEM analysis.
(a)
(b) Figure 4.3 Particles of AW 53µm -90µm and maltodextrine below 53mm as received..
114

Chapter 4: 3D Printing of Bioceramics Powder
Powder Blending 4.2.3
Three different ranges of particles size were sieved for use in preparing different mixtures of
AW powder ratio. Blending of the different mixtures was done using a ‘V’ mixer on a
conventional lathe machine as described in Figure 4.2. AW and three different binders were
mixed for testing of suitability of binder to binder solution compatibility. The four mixtures
with varying ratio of AW particles range size were prepared. Table 4.2 shows the AW
particles mix and the binding agent mixture ratio to AW.
Table 4.2 Ratio of AW mixture preparation.
Mixture preparation Percentage of AW particles
range ratio
70%
Percentage of Binding Agent
Mixture ratio
30%
M1 70% 53µm to 90µm 50% Maltodextrine
30% 20µm to 53µm 50% Fine sugar
M2 10% 53µm to 90µm 50% Maltodextrine
82% 20µm to 53µm 50% Fine sugar
8% below 20µm
M3 100% 53µm to 90µm 100% Maltodextrine
M4 100% 53µm to 90µm 100% Polyvinylpyrolidone
(PVP)
The mixtures of the preparations are as shown in figure 4.4. SEM images on the distribution
of AW powder frits were uniform where binding agents were clearly attached to the AW frits.
Maltodextrine powder shows a much better distribution as compared to PVP powder.
Preparation M4 was not test on the Z-Corp 3DP as it seems not to give a good spread during
powder spreading, and the binding outcome might not be even. Hence, only three mixture
preparations were used on the Z-Corp 3DP; M1, M2 and M3.
115

Chapter 4: 3D Printing of Bioceramics Powder
Figure 4.4 SEM images of different preparations.
116

Chapter 4: 3D Printing of Bioceramics Powder
Binder Preparation 4.2.4
Four binder solutions were prepared as shown in Table 4.4. The compounds used in creating
the binder solutions are distilled water, alcohol and surfactant. The ratio of water to alcohol is
80%BV: 20%BV (Seitz et al., 2009). Surfactant was added to reduce the surface tension. In
the Z-Corps 3DP, the binder solution composition is as given in Table 4.3. The generic
composition for binder solution consists of water, alcohol and surfactant.
Table 4.3 Components of ZP18 binder solution.
Components Approximate
% by weight
C.A.S. No. &
EINECS No.
UK/EU
Classification
Glycerol 1-10% 56-81-5200-289-5 Irritant XiS 23 24/25
Preservative (Sorbic
acid salt)
0-2% Trade Secret Irritant XiR 36/37/38, S 26, S 36
Surfactant <1% Trade Secret Irritant XiR 36, S 24, S 26
Pigment <20% Trade Secret R 42/43
Water 85-95% 7732-18-5 NA
Process Development 4.3
Binder Evaluation 4.3.1
Each of the solutions prepared were tested onto different AW powder mixtures in open space
at room temperature. An atomiser was used to deposit the binder solution on to the powder
mixture. After two hours, observation was made to a certain the solidification of the powder
mixture was completed. Observation and measurement were performed using Motic
microscope with Motic Images plus 2.0 software. Analysis of the consolidation powder
mixture to binding solution was performed (Table 4.4).
117

Table 4.4 Result of spraying different binder solution to AW maltodextrine powder mixture M3.
Binder
Solution
Number of sprays
average Thickness (μm)
Sample images after 2hours 3 sprays Sample images after 2hours 4 sprays
Distilled water
1 364.00
2 818.63
3 624.28
4 480.00
Distilled Water + 18%ABV Ethanol
1 758.53
2 1105.75
3 777.80
4 1542.58
Chapter 4: 3D
Printing of Bioceram
ics Powder
118

Distilled Water + 1% BV Darvan-C: 1mL of Darvan-C and 99mL of water
1 501.23
2 390.55
3 349.30
4 576.63
Distilled Water + 18%ABV Ethanol +1% BV Darvan-C : 1mL of Darvan-C and 99mL of diluted ethanol
1 460.15
2 981.23
3 842.53
4 640.23
Chapter 4: 3D
Printing of Bioceram
ics Powder
119

Chapter 4: 3D Printing of Bioceramics Powder
All the sample solution tested did indicate that there are consolidations of the power mixture. Maltodextrine reacted with all the solution but to a varying degree in thickness and the time taken to consolidate the powder mixture. Maltodextrine is known to bind with water to form a gel like substance (Visavarungroj and Remon, 1992, Nonaka, 1997). It is successfully used in 3D printing of ceramic research (Marchelli et al., 2011, Utela et al., Suwanprateeb et al., 2010). The role of Darvan C-N is to lower the interfacial tension between a liquid and a solid while ethanol is to accelerate the drying time of the print. This requirement is necessary to facilitate the working principle of inkjet printing. As observed, the thickness does not increase linearly with the amount of binder. The amounts of spraying tend to converge in the fourth spray (Figure 4.5). This indicated that a sufficient amount of binder solution used for the lowest layer thickness suitable for the 3D printer. The selected binder solution preparations were tested on a Z-Corp 310Plus 3D printer.
Figure 4.5 The influence of the amount of binder solution to the layer thickness.
Powder Blend Evaluation 4.3.2
During printing, preparation M1 and M2 were incompletely printed due to clogging of the
HP11 print head used on the Z-Corp 3DP machine. No further investigation was performed
on these two preparations as to the cause of clogging. It was suspected that the particles
smaller than 53µm when air bound and clog up the print-head. With preparation M3 printing
was completed for all the test specimens. Figure 4.6 shows the test specimens printed on a 3D
printer and the specimens produced were with discrepancy. Even though the setup was able to
print the 3D specimens completely, clogging of the printhead still occurred after a few runs.
120
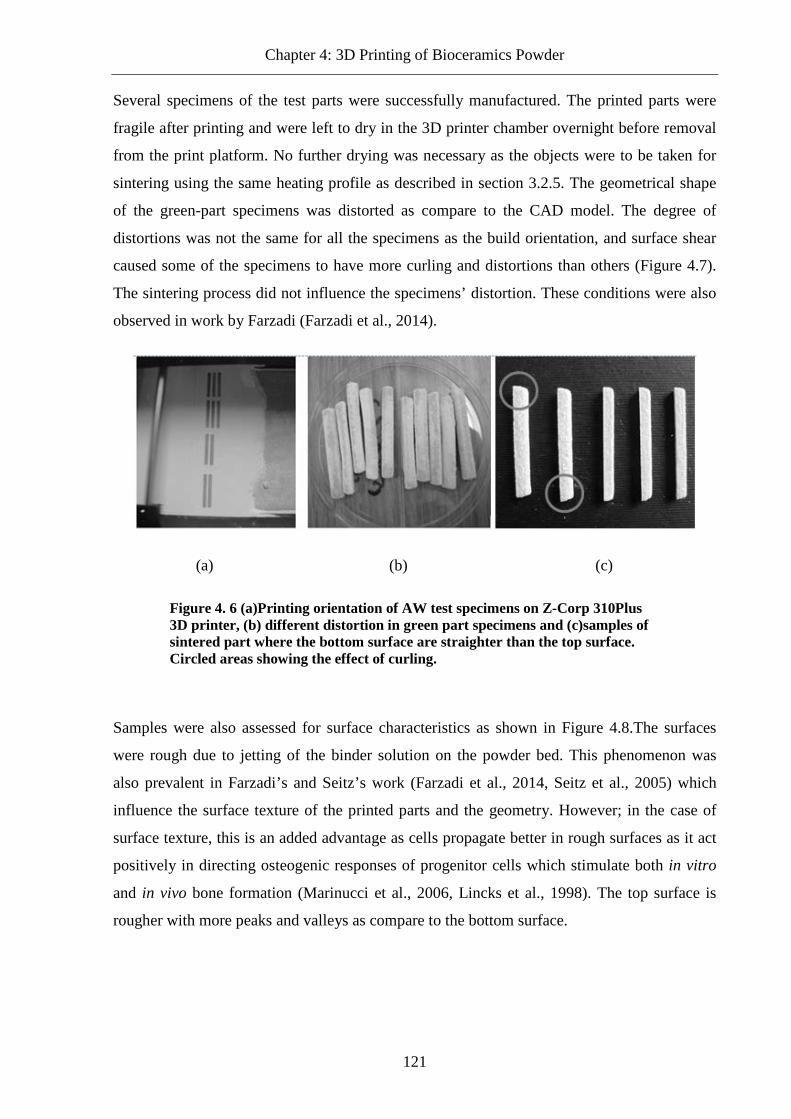
Chapter 4: 3D Printing of Bioceramics Powder
Several specimens of the test parts were successfully manufactured. The printed parts were
fragile after printing and were left to dry in the 3D printer chamber overnight before removal
from the print platform. No further drying was necessary as the objects were to be taken for
sintering using the same heating profile as described in section 3.2.5. The geometrical shape
of the green-part specimens was distorted as compare to the CAD model. The degree of
distortions was not the same for all the specimens as the build orientation, and surface shear
caused some of the specimens to have more curling and distortions than others (Figure 4.7).
The sintering process did not influence the specimens’ distortion. These conditions were also
observed in work by Farzadi (Farzadi et al., 2014).
(a) (b) (c)
Figure 4. 6 (a)Printing orientation of AW test specimens on Z-Corp 310Plus 3D printer, (b) different distortion in green part specimens and (c)samples of sintered part where the bottom surface are straighter than the top surface. Circled areas showing the effect of curling.
Samples were also assessed for surface characteristics as shown in Figure 4.8.The surfaces
were rough due to jetting of the binder solution on the powder bed. This phenomenon was
also prevalent in Farzadi’s and Seitz’s work (Farzadi et al., 2014, Seitz et al., 2005) which
influence the surface texture of the printed parts and the geometry. However; in the case of
surface texture, this is an added advantage as cells propagate better in rough surfaces as it act
positively in directing osteogenic responses of progenitor cells which stimulate both in vitro
and in vivo bone formation (Marinucci et al., 2006, Lincks et al., 1998). The top surface is
rougher with more peaks and valleys as compare to the bottom surface.
121
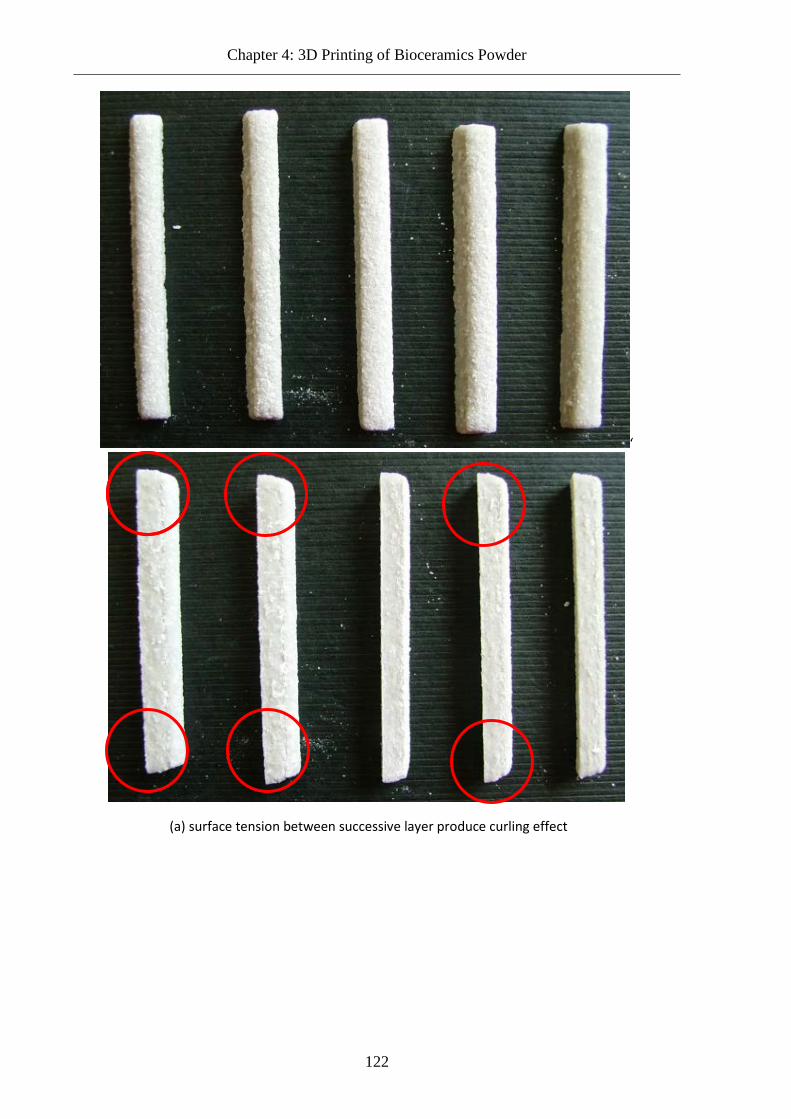
Chapter 4: 3D Printing of Bioceramics Powder
‘
(a) surface tension between successive layer produce curling effect
122

Chapter 4: 3D Printing of Bioceramics Powder
(b) different degree of distortion cause by uneven wettability
123

Chapter 4: 3D Printing of Bioceramics Powder
(c) Surface shearing as an effect of powder spreading.
Figure 4.7 Printing effects (a), (b) and (c) on the geometrical accuracy of 3D artefacts.
All the specimens’ side view indicated there is a slight curling. This is due to structural curl
and moisture curl; an effect cause by surface tension and wettability; as evidenced from figure
4.8a and figure 4.8b. While in figure 4.8c it is less obvious as it is printed along the Y-
orientation which has shorter distance of print. The specimens that were printed along the
width-based (shorter distance of print) rather than length-based (longer distance) displayed
different physical and mechanical characteristics (Farzadi et al., 2014).
124

Chapter 4: 3D Printing of Bioceramics Powder
Surface at Top, closest to last build layer.
Surface at the bottom, closest to print platform.
125

Chapter 4: 3D Printing of Bioceramics Powder
Side surface
(a) Specimen A
Surface at Top, closest to last build layer.
126

Chapter 4: 3D Printing of Bioceramics Powder
Surface at the bottom, closest to print platform.
Side surface
(b) Specimen B
127

Chapter 4: 3D Printing of Bioceramics Powder
Surface at Top, closest to last build layer.
Surface at the bottom, closest to print platform.
128

Chapter 4: 3D Printing of Bioceramics Powder
In addition, the geometrical shapes were also printed for geometry verification. Figure 4.9
shows the specimens and sample 3D objects that were printed using this setup. Specimen A is
the printed object of a 3D rectangular slab, while specimen B and specimens C are patches for
mandibular fracture repair. By observation, all the printed artefacts showed good geometry
profile which matched the CAD model with minimal discrepancy. However, if an accurate
comparison is needed, the printed artefacts can be 3D scanned and the scanned model can
then be matched to the original CAD model. The scanned data is then used to generate a
virtual model which will be superimposed onto the original CAD model. By establishing the
same origin point for both models beforehand, the interference tools in the CAD software can
be used to determine the percentage of discrepancy or similarity by knowing the amount of
interference of the superimposed models. The volume and some overall dimensions such as
maximum x-distance, y-distance and z-distance can be known for both models using the
measurement tools in the CAD software.
Side surface
Figure 4.8 Surface texture of top, bottom and side of printed samples (a), (b) and (c).
129

Chapter 4: 3D Printing of Bioceramics Powder
Sintering 4.3.3
In order to study the characteristic of the 3D printed parts, morphology analysis and
mechanical testing were performed. The test specimens were sintered using high-temperature
furnace. The heating profile for sintering AW is as described in section 3.2.5. The test
specimens were placed in ceramic boats for sintering inside the furnace (Figure 4.10). A total
of 20 samples were produced to be sintered under the mentioned profile. The sintering process
removed the binding agent maltodextrine and caused the AW particles to adhere and
consolidate. The observed and measured sintering shrinkage of the sintered specimens ranges
between 35% and 53%, in either the width or thickness, depending on the build orientation.
Orientation of 3D printed objects will affect the characteristics and mechanical properties
(Pilipovic et al., 2009, Kim and Oh, 2008, Pham and Dimov, 2003). In addition, in all powder
sintering process the porosity is temperature and time dependence.
Figure 4.9 Specimens printed using the prepared AW-maltodextrine mixture with ethanol-Darvan-C based binder solution.
130

Chapter 4: 3D Printing of Bioceramics Powder
Figure 4.10 Equipment used in sintering AW green parts.
The microstructures of the sintered samples indicate that there are macro and micro pores
(Figure 4.11). The porosity in the sample is observed to consist of open and close pores. The
pores size as observed from the SEM images ranges from 20µm to 200µm. The internal
structure of the specimens as shown in Figure 4.11b indicated that most of the pores size is in
the region of 20µm with few at 100µm or higher as compare the outer region having pore of
up to 500 µm. From the observation of the SEM images of the sintered samples morphology,
the samples are highly porous (refer to Figure 4.11). In the sintering process, open pores
began to form and elongated due to neck growth, grain growth, and pore shrinkage.
Eventually, the pores were encapsulated inside the coalesced particles or remain as closed
pores. The SEM images of the surface morphology in the sintered particles at the internal
surface show the necking of AW particles and grain growth; which is in agreement with work
performed by Marchelli et al. (Marchelli et al., 2011, Butscher et al., 2011a). In this sintering
process that was performed, the setting of temperature and time were maintained to obtain
optimum nucleation of AW-GC and not the strength nor the porosity. It is known that porosity
is time and temperature dependence and thus the rate of densification had an effect pores
elongation which influenced the degree of porosity (Rahaman, 2008).
131
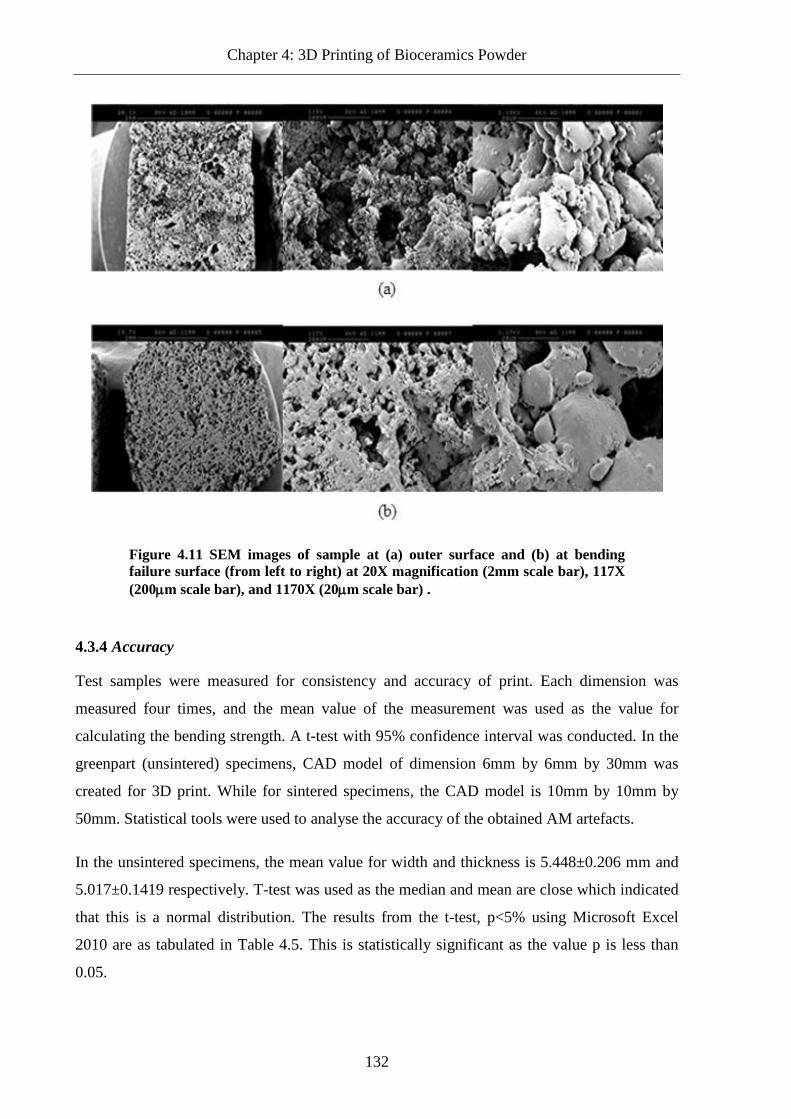
Chapter 4: 3D Printing of Bioceramics Powder
Accuracy 4.3.4
Test samples were measured for consistency and accuracy of print. Each dimension was
measured four times, and the mean value of the measurement was used as the value for
calculating the bending strength. A t-test with 95% confidence interval was conducted. In the
greenpart (unsintered) specimens, CAD model of dimension 6mm by 6mm by 30mm was
created for 3D print. While for sintered specimens, the CAD model is 10mm by 10mm by
50mm. Statistical tools were used to analyse the accuracy of the obtained AM artefacts.
In the unsintered specimens, the mean value for width and thickness is 5.448±0.206 mm and
5.017±0.1419 respectively. T-test was used as the median and mean are close which indicated
that this is a normal distribution. The results from the t-test, p<5% using Microsoft Excel
2010 are as tabulated in Table 4.5. This is statistically significant as the value p is less than
0.05.
Figure 4.11 SEM images of sample at (a) outer surface and (b) at bending failure surface (from left to right) at 20X magnification (2mm scale bar), 117X (200µm scale bar), and 1170X (20µm scale bar) .
132

Chapter 4: 3D Printing of Bioceramics Powder
The percentage of deviation in width and length is not the same. Normally the shrinkage of
printed artefacts is not the same in the X, Y, and Z-direction as it is influenced various factors
such as powder particles size, powder flowability, layer thickness and binder saturation
(Vaezi and Chua, 2011, Lozo et al., 2008, Farzadi et al., 2014).
Table 4.5 Accuracy of 3D printed green specimens.
Item Unsintered Samples
Average width Average thickness
n 5 5
min 5.1575 4.8275
max 5.695 5.1725
median 5.5025 5.065
Mean 5.448 5.017
Std. Deviation 0.205817 0.1419
Std. Error 0.092044 0.06346
hyp mean 6 6
alpha 0.05 0.05
tails 2 2
d.f. 4 4
t stat 5.997 15.490
p value 0.001945 0.000051
t critical 2.776 2.776
95% Confidence
Interval(CI) for
Mean
High 5.7036 5.1932
95% Confidence
Interval(CI) for
Mean
Low 5.1924 4.8408
significant Yes Yes
In the sintered specimens, the CAD model has a dimension of 10mm by 10mm by 50mm (in
order to produce sintered specimens that do will have a dimension of roughly 6mm by 6mm
cross section). After sintering, the thickness along the span of the samples those were not
post-processed using sandpaper ranges from 5.74mm to 6.5275mm while the width ranges
133

Chapter 4: 3D Printing of Bioceramics Powder
from 5.2525mm to 6.0675mm. As for post-processed using sandpaper of sintered samples, it
ranges from, 5.12mm to 6.11mm and 4.7875mm to 5.1975mm in width and thickness
respectively (Table 4.6). Overall observation and calculated average of width and thickness
dimensions in the sintered parts indicated that there was a 40% to 50% decrease in the
corresponding dimensions of the 3D CAD models.
Table 4.6 Accuracy of sintered 3D printed specimens.
Item Sintered Samples, Not sanded
Sintered Samples, Sanded
Average
width
Average
thickness
Average
width
Average
thickness
n 10 10 10 10
min. 5.74 5.2525 5.12 4.7875
max 6.5275 6.0675 6.11 5.1975
median 5.9253 5.54 5.255 5.01
Mean(Average) 6.0121 5.5105 5.4255 4.997
Standard Deviation 0.2289 0.2698 0.2760 0.1298
Standard Error 0.0724 0.0853 0.0873 0.0410
hyp mean 10 10 10 10
alpha 0.05 0.05 0.05 0.05
tails 2 2 2 2
d.f. 9 9 9 9
t stat 55.0943 52.6174 52.4091 121.905
p value 5.38E-13 8.13E-13 8.42E-13 4.27E-16
t critical 2.262157 2.262157 2.262157 2.262157
Confidence
interval (CI) High 6.1758 5.7035 5.6230 5.0898
Confidence
interval (CI) Low 5.8483 5.3175 5.2280 4.9042
Significant Yes Yes Yes Yes
As can be seen in figure 4.12a specimens was not completely rectangle as model from CAD
software. The shape of it is slightly trapezoidal (indicated by circles) which show that there is
some curling occurred when successive layers are deposited on to the recently built surface.
This phenomenon happened because of structural curl and moisture curl. Structural curl is
caused by the difference in the level of particles, fillers, fibre area density or fibre orientation
134

Chapter 4: 3D Printing of Bioceramics Powder
through the layer thickness while moisture curl developed when the layer picked up more
moisture on one side than the other. Curling in 3D printed parts has been reported, and
methods were suggested to overcome this (Farzadi et al., 2014, Suwanprateeb et al., 2010,
Khalyfa et al., 2007). However, in this study no attempt was made toward rectifying this
phenomenon.
For validity purposes, a mandible fracture fixation patch was printed and compare to the CAD
model. This thickness of the part was 4mm, and the maximum length was 15mm. In the figure
4.12b the specimen from the CAD models created for the mandible fracture fixation patch
was 3D printed. By observation, the geometry of the printed patches was similar to the CAD
models. However, in order to quantify the similarity of the 3DP printed part to the CAD
model in terms of the size and geometry, the printed part need to be 3D scanned. Scanned data
of the printed part is then used to create a virtual model and compared to the original CAD
Figure 4.12 3D printed artefacts showing minor geometrical deviation from the CAD model, (a) curling of printed parts, and (b) different in surface profile in top and bottom surface of AW fracture patch.
135

Chapter 4: 3D Printing of Bioceramics Powder
model. Both models will initially be position using the matching points in the CAD
environment. Then, by superimposing the scanned model to the CAD model and using the
interference tool in the CAD software, the volume of interference can be known.
Comparison was also performed on 3D printed mandible implant with the fabricated implant
from indirect soft tooling. The features were more defined in the 3D printed implant, and
fewer defects were seen on the implant (Figure 4.13 ). In addition, the texture of the 3DP
printed implant has a grainy finish as compare to the surface finish of the implant produced
from the indirect soft tooling. The reason for the grainy surface is during and after the
building, the part is surrounded by un-agglomerated powder. The powder encases the artefacts
in the printing process. Not only does the powder provide support for the artefacts but at the
same time some of surrounding powder particles also adhered to the printed surface.
Mechanical Properties 4.3.5
In order to determine the mechanical properties of the samples, the test samples were tested
by 3 point bending test (BSI, 2008), using Instron 5565. The loading rate was set with a load
cell of 1kN at rate of 0.5mm/min. Testing was conducted in room temperature environment.
Three set of testing was conducted. Using Excel2010, statistical analysis with p-value, t-
distribution was performed to determine the confidence interval of the Young’s Modulus
(Flexural modulus) and flexural strength (Modulus of Rupture).
Figure 4. 13 Comparison of outcomes from two different approaches; indirect tooling and 3D printing.
136

Chapter 4: 3D Printing of Bioceramics Powder
Figure 4.14 shows the stress strain graph of unsintered AW test specimens. The curves show
normal stress-strain behaviour of solid specimens, as the specimens still consist of all the
composition of AW and maltodextrine with some moisture as maltodextrine retained water.
In the sintered test specimens, two conditions were set for the testing specimen. One set of
specimen was post process by sanding to achieve smooth surface while the other set was left
as is from sintering with rough surface. Figure 4.15 shows the post process sintered AW parts
where the stress-strain curves displayed the behaviour of porous, brittle material under
bending load. The curves show a lot of spike indicating transition of a solid region to porous
region in the sintered specimens. This is also true for unsanded sintered parts. As shown in
figure 4.16, the spikes were more dominant as the surface is rougher.
Figure 4.14 AW green parts stress-strain curve.
137

Chapter 4: 3D Printing of Bioceramics Powder
Figure 4.15 AW sanded sintered parts stress-strain curve.
138

Chapter 4: 3D Printing of Bioceramics Powder
The basic statistical analyses of the mechanical properties are as shown in table 4. Based on
established value from previous works (Kokubo, 2008), dense AW-GC Young’s Modulus is
taken to be 118GPa.
The results obtained from the 3-point bending test are as shown in table 4-7. The flexural
strength of green parts is about 15% - 35% of the sintered parts. While for post-process
sintered parts, it is 2.4 times the flexural strength of the non-post processed parts. The
differences in strength may be attributed to the stress concentration of the applied load due to
the roughness of the surface texture. The post processed parts have larger flexural strength as
it has less peaks and valleys than non-post processed parts. These peaks and valleys create
stress concentration points that induced crack propagation which lead to lower load for
failure. If the peak-to-valley height of the surface roughness is in the range of the critical
defect size value, the roughness can affect the flexural strength (Fischer et al., 2003).
Therefore, besides the natural microscopic defect, another parameter which affects the
flexural strength of a ceramic component is surface roughness. Surface roughness and surface
microstructure are two known factors that significantly influenced the failure of porcelain or
Figure 4. 16 AW unsanded sintered parts stress-strain curve.
139

Chapter 4: 3D Printing of Bioceramics Powder
ceramics materials (Rashid, 2014, Whitehouse, 2002). As concluded from (de Jager et al.,
2000, Fischer et al., 2003), surface roughness influences the strength of porcelain and ceramic
material where the smoother the surface, the stronger the sample except when the inner
structure of the material causes greater stress concentration than that caused by the
combination of surface roughness and surface flaws. Therefore the results obtained
demonstrated that post process parts with smoother surface than the non-post process sample
will have higher value of flexural strength.
Table 4.7 Young’s modulus and Flexural strength of printed 3D specimens from M3 mixture preparation.
Unsintered
samples
(green parts)
Specimens not
sanded, left
overnight in
3DP chamber
Sanded,
removed from
3DP after 3hrs,
overnight in
room
environment
average Width b (mm) 5.45 6.01 5.43
average thickness (Height) t (mm) 5.02 5.51 5.00
n 5 10 9
Average Flexural Strength (Modulus of
rupture) ( MPA)
1.69 4.79 11.53
Confidence Level (95.0%)
High 2.261 5.87 12.58
Low 1.119 3.17 10.48
Average Young’s Modulus (Flexural
Modulus) ( GPA)
0.15 0.80 2.64
Confidence Level (95.0%)
High 0.211 1.46 3.70
Low 0.081 0.14 1.58
XRD analysis of sintered parts fabricated using 3DP 4.3.6
XRD analysis was performed on the sintered 3DP parts. Two different PDF2 database were
used as a measure to verify and compare with the result obtained in chapter 3 section 3.2. As
shown from Figure 4.18, there is evidence of wollastonite and hydroxyl/apatite in all the
140

Chapter 4: 3D Printing of Bioceramics Powder
sintered artefacts produced by 3DP of the glass ceramics used in this research. Even though
slightly different readings were obtained from the different PDF2 database, the peaks patterns
are consistent. The XRD results show comparable pattern to other researchers (Cannillo et al.,
2009, Podporska et al., 2008). The similarity in the diffraction peak list patterns for AW phase
in the samples indicates that the processing route has not affected the composition in any way.
Position [°2Theta] (Copper (Cu))10 20 30 40 50 60 70
Counts
0
10000
20000
30000
Elena_AW-3D-1
Peak List
Diopside; Calcium Magnesium Silicate; Ca Mg ( Si O3 )2; Monoclinic; 01-073-6374; Q: I;ALT
Apatite-(CaOH) (Si-substituted), syn; Calcium Oxide Phosphate Silicate Hydroxide; Ca10 ( P O4 )4.92 ( Si O4 )1.08 ( ( O H ) O0.664 );
Wollastonite; Calcium Silicon Oxide; Ca Si O3; Anorthic; 04-010-0710; Q: P;ALT
whitlockite, syn; Hydrogen Calcium Magnesium Aluminum Iron Phosphate; H0.825 Ca9.22 Mg0.685 Fe0.115 Al0.045 ( P O4 )7; Rhom
aw3d1
141

Chapter 4: 3D Printing of Bioceramics Powder
(a) XRD analysis using ICDD PDF2 (2009).
aw3d1
Aw3d2
Position [°2Theta] (Copper (Cu))10 20 30 40 50 60 70
Counts
0
20000
40000
Elena_AW-3D-2
Peak List
Diopside; Calcium Magnesium Silicate; Ca Mg ( Si O3 )2; Monoclinic; 01-073-6374; Q: I;ALT
Apatite-(CaOH) (Si-substituted), syn; Calcium Oxide Phosphate Silicate Hydroxide; Ca10 ( P O4 )4.92 ( Si O4 )1.08 ( ( O H ) O0.664 );
Wollastonite; Calcium Silicon Oxide; Ca Si O3; Anorthic; 04-010-0710; Q: P;ALT
whitlockite, syn; Hydrogen Calcium Magnesium Aluminum Iron Phosphate; H0.825 Ca9.22 Mg0.685 Fe0.115 Al0.045 ( P O4 )7; Rhom
aw3d2
142

Chapter 4: 3D Printing of Bioceramics Powder
(b) XRD analysis using ICDD PDF2 (2003)
Figure 4.17 XRD analysis using 2 different ICCD database for samples which used maltodextrine binder and PVA solution.
Discussion 4.4
To capture a more accurate reading of the printed specimens, four measurements of width and
thickness along the span of each specimen were taken. Along the points of data captured, the
dimensions for each point are different. The non-uniformity indicates that the range in AW
particles size of up 53µm and binder saturation have a direct impact on the accuracy and
surface morphology. Samples that were not sintered indicated that there were variations in the
dimension as opposed to the CAD model. Shrinkage in the printed part geometry due to
wetting in the powder materials, as well as the burnout of the maltodextrine compound, was
observed. Furthermore, material shrinkage during printing led to a slight curling of the first
few layers of the printed parts.
Conclusion 4.5
The indirect 3DP medium developed using AWGC-maltodextrine mixture with an in-house
binder solution was successfully printed. With this medium, cost of printing 3D artefact for
143

Chapter 4: 3D Printing of Bioceramics Powder
patient specific implants can be reduced as the material used as binding agents were sourced
from non-proprietary materials.
The accuracy of the obtained 3DP artefacts is statistically significant as the p-value is less
than 0.05 (Table 4.6). Hence, this is a repeatable process for producing AW glass ceramic of
10x10mm (width by height) cross-section specimens with a standard deviation of less than
±0.2760mm in both width and thickness. Different shrinkage in the X, Y, and Z-direction
normally are rectified by calibrating the AM machine with the prepared material and binder
solution. This can be performed by 3D printing a benchmark artefact and compared it to the
reference object.
The mechanical properties of AW glass ceramic produced by 3DP are lower than the result
found in chapter 3. This different is attribute to the methods in preparation of the green parts
for sintering in term of powder compaction as it can induce defect in the sintered parts
(Shinohara et al., 1999). In addition, the rough surface texture produced from the binder
jetting effect also decrease the strength of 3DP parts as rough surface induce micro cracks and
flaws in the 3DP parts (de Jager et al., 2000, Fischer et al., 2003) .
.
144

3D Printed Moulds for Biopolymers Chapter 5:
Introduction to Chapter 5.1
This chapter establishes a method for the creation of personalised polymer structures by
sintering PLGA granules in a mould manufactured using the stereolithography process. The
study of the fabrication route for a patient specific PLGA fixation plate has been performed in
two parts. The initial part has been used to evaluate the manufacturing parameters, which was
followed by rectangular specimen creation for assessing material and mechanical properties.
In the final part, a mandibular geometry has been created in order to assess the ability to
create physiologically shaped parts and the ability to maintain shape definition throughout the
process.
Bioresorbable devices had been used in maxillofacial surgery to achieve the application of a
biocompatible material. Studies have indicated that fractures of the mandible account for 36-
70% of all maxillofacial fractures (Deogratius B.K et al., 2006, Lee, 2012). The fabricated
fixation plate was customised to fit the geometry of the fractured mandible.
Material Characterisation 5.2
In order to establish operating conditions for the process, simple rectangular bars were made
and their mechanical properties were measured. The rectangular bars were moulded using the
mould manufactured by AM methods. Initial work focused on determining the temperature in
selecting the mould material that would have to withstand the processing temperature and the
AM methods for manufacturing it.
Material and DSC Analysis 5.2.1
This study used bioresorbable biopolymer PLGA materials obtained from Sigma-Aldrich in
pellet form. The virgin pellets were in a range of sizes. Three different ratios of
Lactide:Glycolide co-polymer were purchased and stored in the refrigerator before use as-is
during the experiments. The three different ratios of PLGA used in this research have almost
the same average molecular weight as shown in Table 5.1.
145

Chapter 5: 3D Printed Moulds for Biopolymers
Table 5.1 Properties of Lactide:Glycolide co-polymer.
PLGA materials
from Sigma-Aldrich
Co-polymer
ratio
Average Molecular
weight Mw
Inherent Viscosity
dL/g
P2191 50:50 30,000-60,000 0.55 – 0.75
P2066 65:35 40,000-75,000 0.55 – 0.75
430471 85:15 50,000-75,000 0.55 – 0.75
A Mettler Toledo 823e differential scanning calorimeter was used to characterise the thermal
properties; in particular Tg, of the biopolymers used in this study. The DSC test conducted
used a 100µl Aluminium crucible that was placed in a heat flux cell. Nitrogen flow rate of
50ml/min as cooling medium was controlled with a Mettler FP90 controller connected to
FP85 heat flux cell. A preheat run was performed to completely removed moisture before
DSC analysis. The starting temperature was 25oC and ended at 125oC with 10oC increments.
Data taken was synchronised to every 1 second. The DSC analysis was carried out with
weights of approximately 5mg of PLGA, the weight of a single pellet. Analyses of the
measured results indicate the biopolymer’s glass transition temperature (Charles-Harris et al.,
2007). The average glass transition temperatures obtained for the PLGA materials were from
the DSC analysis.
Through DSC analysis, the main polymers glass transition temperatures Tg are evaluated as
shown in figure 5.1. The Tg for PLGA 50:50, 65:35 and 85:15 range from 42oC to 65oC as
shown in Table 5.2. This range matches with most PLGA glass transition temperatures
(Armentano et al., 2010, Tai et al., 2010, Liu et al., 2002, Liu and Ma, 2004, Passerini and
Craig, 2001).
Table 5. 2 Glass transition temperature of biopolymer PLGA.
PLGA Range of Glass Transition
Temperature, Tg (oC)
Suggested Maximum
Sintering Temperature (oC)
50:50 42 to 50 60
65:35 44 to 60 70
85:15 48 to 65 75
146
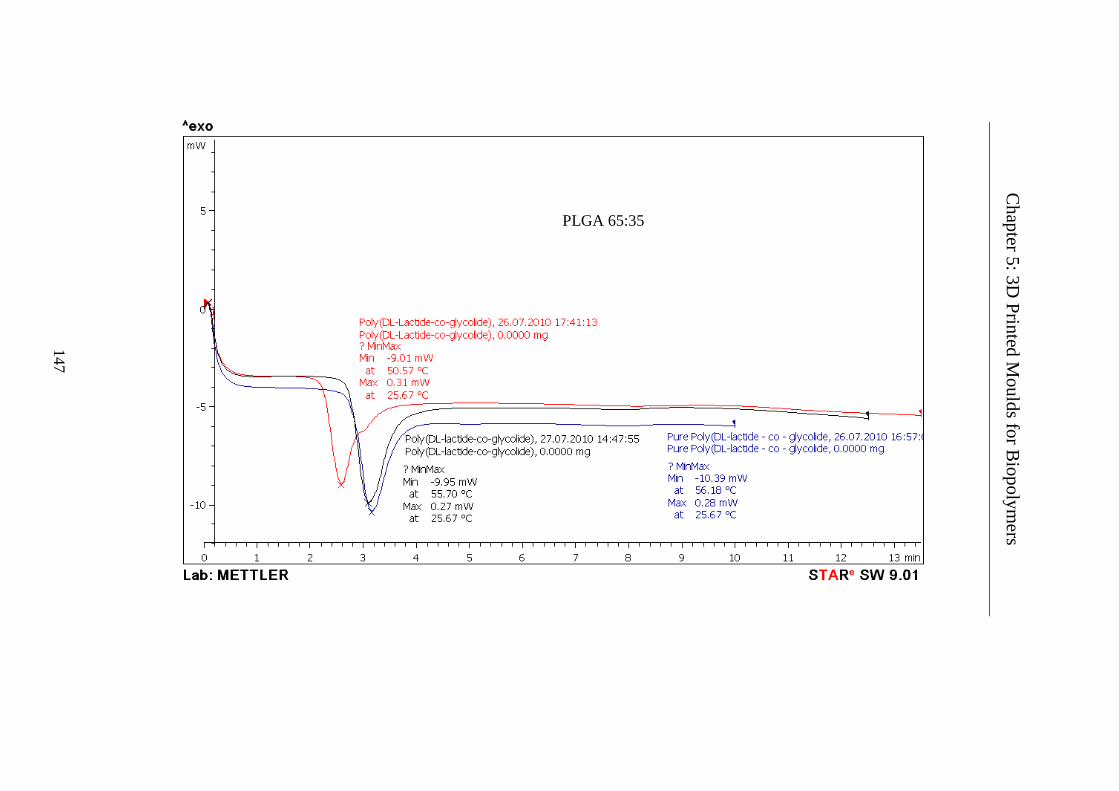
PLGA 65:35
Chapter 5: 3D
Printed Moulds for B
iopolymers
147

PLGA 50:50
148
Chapter 5: 3D
Printed Moulds for B
iopolymers

PLGA 80:20
Chapter 5: 3D
Printed Moulds for B
iopolymers
149

Figure 5.1 DSC analysis of various ratio of PLGA.
Chapter 5: 3D
Printed Moulds for B
iopolymers
Various ratio of PLGA
150

Chapter 5: 3D Printed Moulds for Biopolymers
Based on this analysis, the SLA material selected for the mould was 18920 ProtoGen with UV
and thermal post-cure as shown in Table 5.3. The selected material was used to produce a
moulding assembly that can withstand temperature of up 97.5oC. In the melt moulding
process, the temperature that is suitable to use is between 5oC to 10oC above the Tg of
biopolymer (Thomson et al., 1996). Hence, the fabrication temperature for PLGA 3D
structure investigated was varied between 65oC-80oC (Table 5.2).
Table 5.3 Glass transition temperature of SLA material.
WaterShed
XC 11122
Somos
9420 UV
ProtoGen
18920
UV Post-
cure
ProtoGen
18920
UV & Thermal
Post-cure
Polypropylene
Tg 39-46oC 57-60oC 69oC 97.5oC 41oC
Moulding Process Development 5.3
In order to determine the mechanical properties of the sintered PLGA, test specimens were
produced using the modified melt moulding procedure. Instead of melting the PLGA granules
inside the mould as carried out in melt moulding process, the granules are heated above the
glass transition temperature by about 5%-10% which is below the melting temperature of
PLGA. In this fabrication process, parameters for sintering temperature, holding time and load
on moulding system were varied in order to achieve an optimum setting in the process. This
setting would produce sintered structure with suitable mechanical strength and chemical
consistency. Figure 5.2 list the steps used in processing the test specimens. Test specimens
were moulded using SLA moulds produced by Paragon Rapid Technologies Limited UK.
Mould release agent Ambersil; obtained from RS Components UK, was applied to the mould
to ease the release of the moulded test specimens. The PLGA pellets were placed manually
inside the SLA mould cavities (Figure 5.3). Each of the cavities measured 5mm by 2mm by
40mm in width, height and length. There are five cavities in total. The design of the mould is
as shown in figure 5.3b.
151

Chapter 5: 3D Printed Moulds for Biopolymers
Figure 5.2 Processing of PLGA Specimens
Figure 5.3 (a) SLA mould in the heating setup and (b) PLGA pellets in SLA mould.
Load and Temperature Combination Optimum Process Setting 5.3.1
A fan-assisted oven from BINDER GmbH was used to preheat the heating chamber together
with the compression weight. Then the completely filled mould was placed inside the oven,
and compression weight was applied onto the mould assembly. Heat was applied to the
152

Chapter 5: 3D Printed Moulds for Biopolymers
moulding assembly to above the glass transition temperature of PLGA and the assembly heat
soaked before the heater was switched off to allow the oven chamber to cool down at its
natural rate to room temperature. The sintering process followed a predefined heating profile.
Once the filled mould was at room temperature, the test specimens were de-moulded. The
specimens were removed from the mould using tweezers.
Based on the result of Tg for PLGA used; as shown in Table 5.2, an initial value of 65oC was
predefined as the sintering temperature for this investigation. The load used for all three
different ratios PLGA was varied between 7lbs (3.2kg) to 15lbs (6.8kg) for the specimens.
The result in Table 5.4 shows that in the 1st to the 4th columns, the process was unsuccessful.
Picture in column (a) and (b) show the necking region of PLGA pellets while in columns (c)
and (d) the sintering of PLGA pellets was without visible necking region on the specimen but
with some incompleteness to the specimens. Subsequently the temperature was increased to
between 70oC to 80oC. With a temperature of 73oC, PLGA specimen was successfully
fabricated as shown in the last column in Table 5.4. Therefore, all following fabrication
processes of PLGA pellets was sintered using the heating profile as shown in Figure 5.4.
Sintering of PLGA pellets was performed by placing into a mould and heated at 73oC for 2
hours with an applied weight of 15lbsf to the moulding system, which is equivalent to 9.7psi
or 0.7bar. The mould is left in the sintering oven to cool to room temperature before de-
moulding.
Table 5.4 Results of different parameter settings in melt moulding of PLGA pellets.
PLG
A
Load =7lbs
Heat Soaked
=1.5hrs
Load=7lbs
Heat Soaked
=2.5hrs
Load=10lbs
Heat Soaked
=2hrs
Load=12lbs
Heat Soaked
=2hrs
Load=15lbs
Heat Soaked
=2hrs
spec
imen
s
( a )
( b )
( c )
( d )
( e )
153

Chapter 5: 3D Printed Moulds for Biopolymers
Evaluation and Analysis 5.3.2
Three point bending test of specimens were used to obtained the mechanical properties of
PLGA. The three point bending test was conducted on an Instron 5567 universal testing
machine with Bluehill® Software, Instron UK. The test was conducted using a load cell of
1kN with loading speed of 0.5mm/min. Testing was based on BS EN ISO 178:2010 (BSI,
2011). The layout of the test is as shown in figure 5.5.
Figure 5.5 Bending test diagram and the actual test on a universal testing machine rig.
Figure 5.4 Heating profile for the sintering process of PLGA.
73
Temperature ( o C)
Time ( min ) 120
2 o C /min 2 o C /min
154

Chapter 5: 3D Printed Moulds for Biopolymers
Motic microscopes with Motic Images Plus 2.0 software from Speed Fair Co. Ltd, Hong
Kong and Cambridge Stereoscan 240 SEM machine were used to investigate the morphology
of specimen surface and fracture surface at failure in bending test. Investigation on the type of
bending failure in the sintered test specimens were based on images from both analysis
methods; using microscopy and SEM analysis. In SEM analysis, specimens were gold coated
prior to analysis. Further DSC analyses were performed to ensure that the fabrication route
does not significantly alter the PLGA.
Statistical analysis was performed using t-test with values of p<0.05 to indicate statistical
significance. All calculations were made using Microsoft Excel 2010 Data Analysis Tools.
Results 5.3.3
In total, ten rectangular test specimens for each different PLGA ratio of co-polymer are
fabricated from the SLA mould that has five cavities measuring 5mm x 2mm x 40mm each.
All measurements for each different PLGA ratio of co-polymer specimens were taken (refer
appendix B5) and the range of thickness and width for the specimens are from 1.869mm to
2.924mm and 5.027mm to 5.267mm respectively.
The overall length is 40mm for all the specimens and the span length in the three points
bending test is 25mm. The mechanical test is based on 3-point bending testing procedure of
BS EN ISO178:2010 (BSI, 2011) and was conducted for all 30 specimens. The results are as
shown in figure 5.6 and table 5.5.
The equations used are as follows: -
Flexural Strength is-
𝜎𝜎𝑟𝑟 =3𝐹𝐹𝐹𝐹2𝑏𝑏ℎ2
where 𝜎𝜎𝑟𝑟 is flexural strength, in megapascals (MPa);
F is applied force, in newton (N);
L is the span, in millimetres (mm);
b is the width, in millimetres(mm); 155

Chapter 5: 3D Printed Moulds for Biopolymers
h is the width, in millimetres(mm).
and
Flexural Modulus is: -
𝐸𝐸𝑟𝑟 =𝜎𝜎𝑟𝑟2 − 𝜎𝜎𝑟𝑟1𝜀𝜀2 − 𝜀𝜀1
where 𝐸𝐸𝑟𝑟 is flexural modulus, in gigapascals(GPa);
𝜎𝜎𝑟𝑟𝑓𝑓 is flexural strength at point of deflection, in megapascals(MPa);
𝜀𝜀𝑓𝑓 is strain at point of deflection.
From figure 5.6(a), (b) and (c), all PLGA ratios exhibited a linear relationship of stress-strain
up to a strain value of 0.015. Specimens give a maximum yielding stress and then break
before the conventional deflection. Since the maximum flexural stress and the breaking stress
are far apart with a plateau stating at strain value of 0.03mm/mm in most specimens, the
specimens’ failure types of the three PLGA’s ratio are considered to be plastic failure mode.
The fracture images are as shown in figure 5.7.
(a)
156

Chapter 5: 3D Printed Moulds for Biopolymers
(b)
(c)
Figure 5.6 Stress-Strain curves of PLGA co-polymers.
157

Chapter 5: 3D Printed Moulds for Biopolymers
Table 5.5 Statistical Analysis for Mechanical Properties of PLGA fabricated under heating profile and load of 15lbs (6.8kg) as described in 5.3.1.
PLG
A
Thickness
h (mm)
Width
b
(mm)
Max.
Flexural
Load Fmax
(N)
Deflection
at Max.
Flexural
Load δmax
(mm)
Flexural
Modulus
E (GPa)
Flexural
Strength
σ (MPa)
50:5
0
Mean x 1.9941 5.059 36.4799 2.74166 3.05642 73.8465
Standard
Error(SE) 0.032 0.010 1.9607 0.24193 0.08345 1.02495
Median 1.96 5.046 33.3365 2.61964 3.12785 73.8709
Standard
deviation
(SD)
0.1002 0.032 6.2003 0.7651 0.2639 3.2412
Minimum 1.869 5.027 31.012 1.79839 2.54449 67.742
Maximum 2.209 5.129 47.814 4.53176 3.40505 77.3431
n 10 10 10 10 10 10
DOF 9 9 9 9 9 9
Critical
value 2.26 2.26 2.26 2.26 2.26 2.26
CL 95% 0.0717 0.023 4.435476 0.54728 0.18878 2.3186
65:3
5
Mean x 2.1121 5.064 45.2063 2.40741 2.85153 74.97068
Standard
Error(SE) 0.0197 0.008 1.1351 0.11943 0.08139 1.250328
Median 2.116 5.073 46.7375 2.25753 2.92338 77.0258
Standard
deviation
(SD)
0.0622 0.027 3.5896 0.37767 0.25737 3.953883
Minimum 2.026 5.027 38.004 2.15496 2.51046 68.9448
Maximum 2.213 5.097 48.431 3.41576 3.19789 78.7849
n 10 10 10 10 10 10
DOF 9 9 9 9 9 9
Critical
value 2.26 2.26 2.26 2.26 2.26 2.26
CL 95% 0.0445 0.019 2.5678 0.27017 0.18411 2.828437
158

Chapter 5: 3D Printed Moulds for Biopolymers
85:1
5
Mean x 2.5442 5.118 50.8887 1.5632 2.6498 59.8873
Standard
Error (SE) 0.0691 0.021 5.3214 0.1901 0.0638 5.1744
Median 2.576 5.110 51.3885 1.4543 2.6747 65.8316
Standard
deviation
(SD)
0.2185 0.067 15.4650 0.6018 0.2017 16.3628
Minimum 2.159 5.036 31.097 0.7257 2.2604 31.9156
Maximum 2.894 5.267 70.643 2.3758 2.9183 75.5009
n 10 10 10 10 10 10
DOF 9 9 9 9 9 9
Critical
value 2.26 2.26 2.26 2.26 2.26 2.26
CL 95% 0.1563 0.048 12.0379 0.4304 0.1443 11.7053
The results of the basic statistical analysis with the confidence intervals are presented in Table
5.5 and the p-value<0.5, t-test results in Table 5.6.
The confidence interval in repeating the manufacturing of the specimen is as calculated using
p-test with t-distribution. As shown in Table 5-5, there is no significant variation in terms of
dimensions and mechanical properties of PLGA test specimens using the fabrication process.
However, for PLGA 85:15 the interval estimate for dimension and flexural strength are higher
than PLGA 50:50 and PLGA 65:35.
The average thickness and width are in a range of between 1.994 mm to 2.544 mm and
5.059mm to 5.125mm, respectively. The flexural modulus and flexural strength ranges from
2.650GPa to 3.056GPa and 59.887MPa to 73.847 MPa, respectively (Table 5.6). The result
for fracture modulus is as comparable to PLGA parts produced using solvents (Armentano et
al., 2010).
159

Chapter 5: 3D Printed Moulds for Biopolymers
Table 5.6 Mean value for 95% confidence interval for sintered test samples of PLGA.
Ratio of
PLGA
co-
polymer
Glass
transition
temperature
Tg (oC)
Dimension Flexural
Modulus
(GPa)
Flexural
Strength (MPa)
Thickness
(mm)
Width (mm)
50:50 42-55 1.994±0.072 5.059±0.023 3.056±0.189 73.847±2.319
65:35 44-60 2.112±0.045 5.064±0.019 2.852±0.184 74.971±2.828
85:15 48-65 2.544±0.156 5.118±0.048 2.650±0.144 59.887±11.705
In order to understand further the behaviour of PLGA co-polymers during three points
bending test, images are captured at bending fracture failure surface. The distance of tension
from surface before failure is about 35mm (Figure 5.7). Images also showed the pellets region
A (smooth surface) and material consolidation region B experiencing ductile failure (crystal-
like surface) as indicated in figure 5.7.
SEM analysis of the test specimens at outer surface show that the specimens’ are fully
consolidated (Figure 5.8). The surface texture of the specimens consists of the negative
impression of the mould surface as well as the overlapping cause by movement of the PLGA
co-polymers relative to the mould walls. In figure 5.9, the fracture surface displays the cause
of fracture failures that begin with craze having level brittle failures bands and splintering
chips. Both PLGA 50:50 and 85:15 showed signs of micro-crack lines as indicated from
images using 10000X magnification (Figure 5.9.)
160
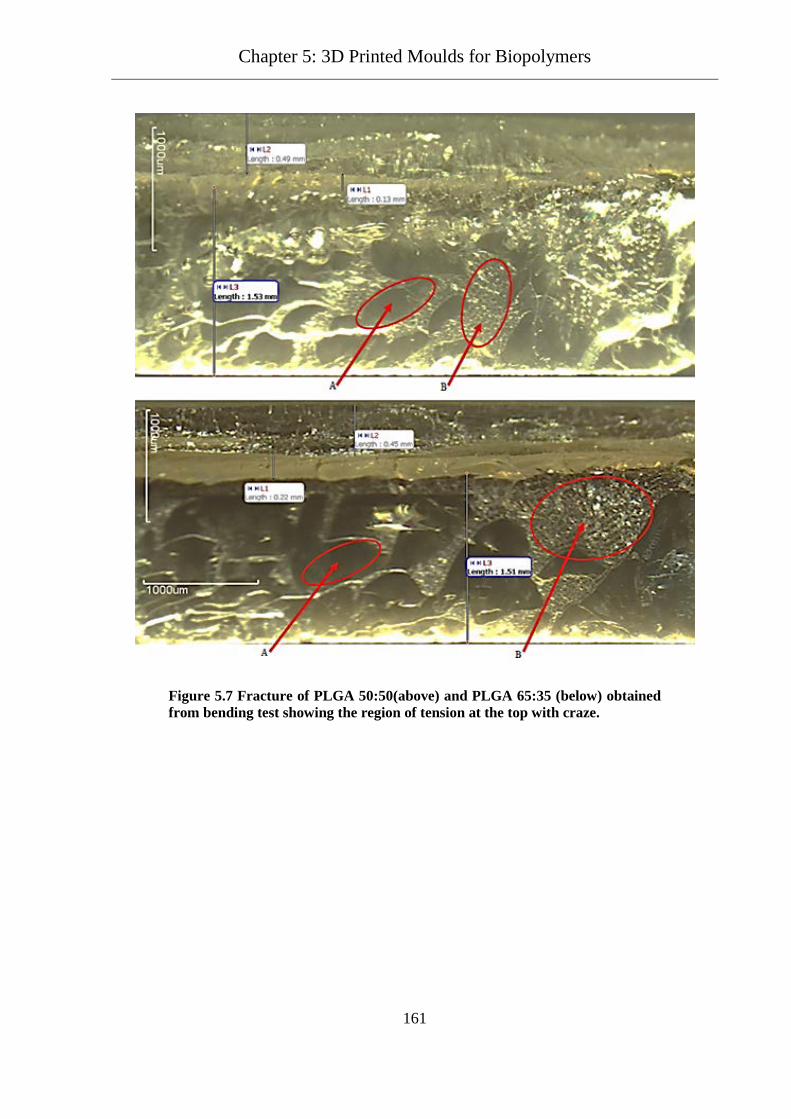
Chapter 5: 3D Printed Moulds for Biopolymers
Figure 5.7 Fracture of PLGA 50:50(above) and PLGA 65:35 (below) obtained from bending test showing the region of tension at the top with craze.
161

Chapter 5: 3D Printed Moulds for Biopolymers
Figure 5.8 SEM images at outer surface of specimens.
Figure 5.9 SEM images at fracture surface from 3 point bending test.
162

Chapter 5: 3D Printed Moulds for Biopolymers
DSC Evaluation of material after fabrication process 5.3.4
Comparison of both virgin PLGA as received and sintered PLGA for all three different ratios
were performed using DSC. Three cycle analysis were carried out in which the surface area
under the curve of DSC thermograms for both the 1st and 2nd cycle does not show any
significant variation in total energy between virgin and sintered PLGA. The integral of all the
thermograms in sintered PLGA show a different of less than 10% (Figure 5.10). This
indicated that the processing route does not alter the properties of PLGA. It can be concluded
that the sintering temperature profile with applied pressure had not altered the biopolymer,
similar with the findings of Rothen-Weinhold et al using melt-manufacturing by extrusion or
injection (Rothen-Weinhold et al., 1999).
Figure 5.10 Comparison of virgin to sintered PLGA 65:35.
163

Chapter 5: 3D Printed Moulds for Biopolymers
Case Study 5.4
In order to establish the feasibility of this proposed route of manufacturing 3D biopolymer
structure using mould printed with stereolithography, a case study on the mandible fracture
fixation method was proposed. The patch was designed as an alternative solution to the
normal practice of fracture fixation using standard off the shelf plate.
Specific Case Study Background 5.4.1
Mandibular fracture is one of the most common injuries to patients who suffer facial trauma.
50% of patients admitted to hospital with facial trauma require surgery to repair fractured
mandible (Kar and Mahavoi, 2012, Sakr et al., 2006, Iida et al., 2003, Iida et al., 2001, Ellis
Iii et al., 1985). The most common site of most mandible fractures due to trauma is at the
mandibular angle and mandibular body (Kostakis et al., 2012, Natu et al., 2012, Sakr et al.,
2006, Navarro et al., 2004, Iida et al., 2001) although fractures can occur anywhere in the
mandible as shown in figure 5.11. Rectification of defective bone structures due to trauma has
benefited from the introduction of mostly rigid metal prostheses. However, the high stiffness
of metal implants can cause stress shielding in bone restoration due to mismatch of material
properties.
Figure 5.11 Fracture Occurrence for Regions of the Mandible (Natu et al., 2012).
In the management of mandibular fractures, general treatment strategies depend on the age
and anatomical site. Adults and children require a different approach in the treatment of
164

Chapter 5: 3D Printed Moulds for Biopolymers
mandibular fractures. Similarly, fractures at different anatomical sites in the mandible need
different treatment since they differ in their biomechanics and complications.
Surgical repair of mandibular fractures is the most effective method of restoring normal
anatomy. The goals of a mandibular fracture repair include the recovery of pre-injury jaw
structure and restoration of normal function through a solid bony union at the fracture site.
This bony union can be achieved by preventing infection and by a suitable period of
immobilization (Fedok et al., 1998). Open Reduction with Internal Fixation (ORIF) is
currently the preferred method for mandibular fractures treatment (Bouloux et al., 2014,
Bhagol et al., 2013, Chrcanovic, 2012, Lovald et al., 2010, Alkan et al., 2007, Ellis Iii, 1999).
ORIF refers to the fracture site been surgically exposed for access and metal plates are affixed
directly to the bones by way of metal bone screws. These metal plates align the fracture site
and provide fixation during the healing process. Figure 5.12 shows a bone plate after
placement in an ORIF procedure.
Figure 5.12 Bone Plate Used in an Open Reduction Internal Fixation Procedure(ORIF) (Bhagol et al., 2013).
Complications associated with mandibular fracture treatment include perioperative
complications and postoperative complications. These include plate breakage during bending,
drill breakage during drilling, screw head stripping and breaking during insertion, screw
failure and the need to use emergency screws, dropping of micro-material in the operative
field, inappropriate insertion of screws in anatomic structures such as tooth roots or nerves, 165

Chapter 5: 3D Printed Moulds for Biopolymers
infection at the fracture site, exposed hardware, improper location of screws and plates,
dislocation of bone parts fixed using micro-plates and palpability of the implanted material
(Duygu et al., 2007, McDermott et al., 2004, Zhang, 2004, Goodacre et al., 2003, Goodacre et
al., 1999) . In addition; once the bone has healed, difficulties can occur during the second
operation to remove the metal implants, screws, plates, and rods where screw head stripping
and screw or plate breakage can happen. All these drawbacks have driven the development of
bioresorbable materials as a possible replacement for metallic devices. Bioresorbable bone
plate must be mechanically functional in order for the fracture to heal before the plate resorbs.
The degradation time of biopolymers ranges between 1 month to greater than 24 months
depending upon the formulation and composition of the biopolymers (Sabir et al., 2009).
Polylactide and polyglycolide, as well as copolymers polyglycolide-co-polylactide and
poly(L-lactide-co-D,L-lactide) (P[L/DL]LA) are most often used in the manufacturing of
bioresorbable plates and screws which follow the conventional method of fracture fixation,
which still retain some of the integral complications of ORIF. This case study tried to address
the complication in attaching fracture plate to the fracture site and propose fracture plate
fixation by adhesive bonding.
Design and AM manufacturing of Patch Moulding System 5.4.2
The steps in the modelling start with the acquisition of a 3D computer model in
stereolithography (STL) format of a mandible. This file was obtained from 3DSystems, USA;
a supplier of AM system. A fixation patch was design for a simulated fracture on the body
region of the mandible as this is indicated to be the most likely region of fracture in the
mandible (Kostakis et al., 2012, Natu et al., 2012, Fridrich et al., 1992). Figure 5.13 shows the
process flow in designing the moulding system.
166

Chapter 5: 3D Printed Moulds for Biopolymers
Figure 5.13 Process flow in design and manufacture of moulding for customised fracture patch.
CAD modeller Rhino 4 with RhinoReverse was used in designing the fixation patch. The
surface geometry of the site was reverse engineered using RhinoReverse (Figure 5.14) from
the STL model of the mandible. The STL file was imported into Rhino 4 as a mesh model. In
order to reduce the design time for the surface patch, RhinoReverse was used to generate
NURBS curves. Using the RhinoReverse RRLoadMesh and RRCommit, Rhino mesh object
was imported, and the closed curve polylines were converted to a surface patch. The surface
geometry of the fracture site was then used to generate solid CAD model of the patch using
Rhino SolidExtrude (Figure 5.14).
167

Chapter 5: 3D Printed Moulds for Biopolymers
The geometry of the patches (Figure 5.15); which was customised to the shape of high
occurrence fractured site, was then fabricated using FDM method. The CAD model of the
patch was translated into STL format. In order to produce a watertight STL file for AM,
several sequence of Rhino command was performed. The sequence involved mesh reduction
as well as mesh repairs involving holes and gaps repair, mesh welding, and mesh unify which
can be accomplished by manually selecting the mesh or by using features of mesh repair in
the software. The validity of a watertight mesh was performed using Rhino
SelNakedMeshEdgePt. When the mesh was verified to be watertight, the patch was translated
in an STL format file using the option of binary translation to produce smaller file size as
compare to using ASCII option for STL translation.
The file is later imported into Stratasys Dimension SST768 fused deposition machine.
CatalystEX software verified and processed the STL file into a CMB file. The Dimension
SST768 printer used the file for 3D printing. A layer thickness of 0.33mm was selected, and
commercial ABS plastic was used during the fabrication. The printed patches were used for
form fitting purpose (Figure 5.16).
Figure 5.14 Step in reverse engineered the fracture patch.
168

Chapter 5: 3D Printed Moulds for Biopolymers
Figure 5.15 Various fixation plates were created for high occurrence sites of fracture.
Figure 5.16 FDM model of the fixation plate for form fitting test.
169

Chapter 5: 3D Printed Moulds for Biopolymers
Mould Design and Manufacture 5.4.3
Once the designed plate was satisfied to fit on the fracture site, CAD model of the patch that
was converted to STL format was then imported into Autodesk Inventor2009 for use in the
mould design stage. The steps taken to design the mould are as shown from the Inventor
Browser Panel (Figure 5.17). The mould was designed to take advantages provided by AM
technologies. A multi-piece mould was created to ease removal of fabricated products (Figure
5.18). Material usages were reduced by creating pockets on the back of the mould pieces.
These pockets also act in assisting the heating process. The 3D model of the moulding
assembly was later translated into STL format and upload to an SL system for fabrication.
Paragon Rapid Technologies Limited UK used the stereolithography process and materials
from DSM Somos® ProtoGen™ 18920 liquid photopolymer to perform the fabrication.
Figure 5.17 Individual part of the mould assembly as design from Autodesk Inventor. Design steps are as displayed in Browser Panel.
170

Chapter 5: 3D Printed Moulds for Biopolymers
Attachment of a personalised fixation patch 5.4.4
Bioresorbable material PLGA was used to fabricate the fixation plate. The proposed manner
in which the plate is to be attached the fracture site is by the use of adhesive bonding. Morita
et al. and Heiss et al. indicated one of the potential usages of medical bone adhesive in
traumatology and operative orthopaedics is in the area of joining fractures with a joint
bridging fixation (Heiss et al., 2010, Morita et al., 1998).
Results 5.5
Figure 5.19(a) shows the PLGA pellets that were placed inside the mould cavity. Since there
are voids between the pellets when placed inside the cavity, the amount of PLGA pellets
needed is calculated based on the volume of the cavity. A slightly higher amount of PLGA
pellets is used because of the shape of the pellets. This extra amount translated in flash mark
when moulded (Figure 5.20) and can be removed by breaking it using long-nose plier. Figure
5.19(b) show the moulded plate as fabricated using the proposed fabrication route. The 2mm
Figure 5.18 CAD model of the moulding assembly and exploded view.
171

Chapter 5: 3D Printed Moulds for Biopolymers
fracture fixation plates have no loss of definition but were slightly thick (Figure 5.20), as
compare to normal fixation plate of between 1.5mm to 2mm. This is to account for the
strength required for load bearing at the fracture site. However, the patches were easily fitted
to fracture jaw.
Figure 5.19 PLGA before and after sintering in SLA mould
Figure 5.20 (a) PLGA 50:50, (b) PLGA 65:35 and (c) CAD model of the fracture plate.
As shown in figure 5.20, the geometry of the printed parts did not have significant variation
from the model CAD object. Details of the mandible surface texture were imprinted clearly
onto the patches. This surface texture and the step-effect of layers in AM can possibly provide
added benefits to adhesion and cell attachment as adhesion strength of rough surfaces is better
than smooth surfaces (da Silva et al., 2011) and the cell propagation are better with uneven
172

Chapter 5: 3D Printed Moulds for Biopolymers
and rough surfaces (Kim et al., 2013, Wong et al., 1995) as rougher surfaces stimulates
differentiation, growth and attachment of bone cells, and increases mineralization
Discussion 5.6
The integration of an AM tooling to assist in the fabrication of customised PLGA 3D
structure for orthopaedic surgery proved to be feasible. A method to fabricate bioresorble
devices using a combined AM tooling, sintering and applying pressure to pellets of PLGA for
three different ratios of PLGA was developed. As with most of the research using melt
moulding of PLGA microspheres to produce 3D porous PLGA scaffolds, the processing time
taken was too long (Borden et al., 2002). Pellets of biopolymers are usually needed to be
ground into fine powder (Leung et al., 2008, Thomson et al., 1996). However, in this study
the pellets were not grounded as part of the objective is to reduce the time taken for the
fabrication process. In this study, the sintering time for PLGA pellets investigated using
different heating profiles, and compression loads had reduced the fabrication processing time.
All the PLGA co-polymer ratios were sintered into fracture fixation plates with no loss of
definition in geometry. The properties were not altered as indicated by the DSC analysis on
the fabricated test samples. The mechanical properties were comparable to standard
bioresorble device. However, this is the same as if getting from off-the-shelf in biometal
fixation plate except that the PLGA fixation patch fabricated using AM produced exact
anatomically shaped fracture plate that fit the patient fracture site. Before that patch can be
used it needs post-processing to clear off the flash material as well as sterilisation. The
method of sterilisation that should not change the PLGA characteristics was not conducted as
the investigation it only confined into the manufacturability of personalised PLGA patch for
fracture fixation.
The hardware involved in the fabrication of the fixation plate is fairly fundamental and readily
available in most dental hospital except for the fixation plate mould which can be outsourced.
This route can be feasibly implemented in a clinical setting of a dental hospital for fabrication
of customised fixation plate.
Fracture fixation using adhesion indicated that the suggested method is viable although
clinically no research has been conducted as of this investigation end (Heiss et al., 2010,
Gosain, 2002, Gosain and Lyon, 2001, Gosain et al., 1998, Ahn et al., 1997). Ahn et al.
concluded that using biodegradable plates and butyl-2-cyanoacrylate for rigid internal fixation 173

Chapter 5: 3D Printed Moulds for Biopolymers
of osteotomiesed cranial bone fragments is as effective as using metal plate and screw fixation
in the animal model. Furthermore, the strength of fixation by biopolymers is as comparable to
metal. This has been shown to be achievable from investigation of bio-absorbable P(L/DL)LA
bone plate (Kandalam et al., 2013). Gaball had demonstrated that plates that were designed to
be less than half the volume of a titanium strut-style plate is as strong when fixating fractures
of the mandible body despite the polymer material having only 6% of the stiffness of the
titanium (Gaball et al., 2011). Therefore, in this study it is suggested that in order to hold the
fractured mandible, the patch would be fixed to the fractured site using bio-adhesive and were
presumed to be able fit tightly. In order to produce an equivalent force needed to hold the
fracture together; as in conventional biometal plate and screw fixation, either a stronger bio-
adhesive is used or a larger area of surface contact between the PLGA plate and the patience
mandible bone be created. This can be verified by simulation using finite element analysis
(FEA), which can be a future work in this study. Thus, by using the method of adhesive
fixation of custom-fit fracture plate, the complications encountered from using standard metal
plates and screw in fracture fixation can be eliminated.
Furthermore, as this investigation is to reduce the overall cost in fabricating personalized
medical devices, mid-range CAD software were used in tandem with mid-range AM system
to model. The design and fabrication of patient specific medical devices has been documented
using high-end CAD software such as Pro/E, CATIA and Unigraphics NX (Wei, 2009, Sun et
al., 2009, Richard et al., 2009, Williams et al., 2008, Liulan et al., 2007, Klein and Glatzer,
2006, Séquin, 2005). As described in this chapter, custom-fit fracture fixation plates were
successfully design and fabricated using mid-range equipment.
Further cost reduction can be accomplished by using open source software and open source
AM system based on material extrusion and Fused Filament Fabrication (FFF) such as
Fab@home or RepRap machines. However, in using open source software and open source
AM systems most of the support will only be available in the forum on the internet as
compare to commercially available products with full supports, if required. With the
movement of open source AM system, cost of printing 3D artefacts can be reduced with more
choices of materials. This selection includes polymer filaments, wood-based and ceramic.
174

General Discussion Chapter 6:
Introduction 6.1
Defects in the oral and maxillofacial system can interrupt the normal functionality of patients
especially functional problems associated with their occlusion and aesthetic concerns. Repair
and regeneration of defectives bone tissues in the cases of tumour, trauma, osteoarthritis and
decrease in bone density are normally addressed through tissue engineering. In this approach;
biomimetic scaffolds are used, with a well-defined architecture that imitate and replicate
living bone in terms of strength, morphology, porosity, bioactivity and load-bearing ability.
These scaffolds guide and promote cells proliferation and differentiation into regenerated
bone tissue.
Manufacturing approaches to the fabrication of ideal synthetics bone scaffolds can be divided
into Additive Manufacturing (AM) approach and conventional approach. With the
advancement of digital technology and material developments in AM, more industrial players
are adopting the AM approach for bone tissue engineering (Bose et al., 2013). This can
further be seen from the increase in usage of AM for medical application (Wohlers, 2013).
The flexibility of AM to fabricate the complex 3D geometry of scaffolds with a controlled
external and internal structure holds great promise for future scaffolds tissue engineering
strategies. However, the high cost of acquiring an AM system that is capable of creating end-
user scaffolds make this approach prohibitive for low income group. Hence, the aim of this
work was to develop and evaluate novel biomaterial processing by indirect additive
manufacturing methods using low cost AM system. In order to establish the processing
approach, the research works were separated into a different section as described in chapter 3,
chapter 4 and chapter 5.
Discussion 6.2
The results obtained in processing AW-GC in both the indirect methods yield different
Young’s modulus values. The average Young’s modulus is between 23.51GPa to 26.65GPa
and 0.8GPa to 2.64GPa for Aluminium foil mould and 3D printing, respectively. Even though
the AW-GC-binding agent powder mixture used was 70:30 by weight, the sacrificial materials
used as binding agents is different; which is PMMA and maltodextrine. This will influence
the porosity as more maltodextrine will occupy the same volume as compare to PMMA
because of the difference in density. Less AW-GC is used in building the same artefact when
175

Chapter 6: General Discussion
using the AW-GC-maltodextrine as compared to using AW-GC-PMMA mixture. Hence, this
produced a more porous artefact when maltodextrine is used as a binding agent. Furthermore
during 3D printing maltodextrine absorbed the binder solution. The average porosity obtained
is 26.86%±4.49% for Aluminium foil mould while, in indirect 3DP the porosity ranged from
45% to 55%. In addition to the different binding agent used, the different processes also
contribute to the differences in Young’s modulus. In the indirect method using Aluminium
foil mould, compression was directly applied on to the AW-GC PMMA mixture. While for
the indirect 3D printing method, pressure was indirectly applied to the AW-GC maltodextrine
mixture from the roller during spreading of the powder mixture in 3DP process. Both these
conditions had impact on the Young’s modulus and was in agreement with others research
work (Marchelli et al., 2011, Suwanprateeb et al., 2010, Chang et al., 2000). The calculated
values and the Young’s modulus values reported is thought to be the result of different
processes as uniaxial pressing process produces a preferential pore alignment and result in a
smaller Young’s modulus in the pressing direction (Chang et al., 2000).
Moulding of AW scaffolds by aluminium sheet mould 6.2.1
In the initial stage of this research work, the objective is to produce scaffolds of 1mm and
3mm in diameter scaffolds for use in tissue engineering research. The AW-GC scaffolds were
to vary from dense (5% porosity) to 50% porosity. Based on this various ratios of AW-GC
and PMMA requirement, different strategies of removing the moulded scaffolds from the
mould were incorporated in the design of the mould. As AM technologies have the
advantages of geometrical design freedom (Parthasarathy et al., 2011, Kamrani and Nasr,
2006, Hague et al., 2004, Hague et al., 2003), various multiple parts mould were designed and
fabricated. However, because of the force and the friction of the AW-GC scaffolds are
relatively high as compare to the fragile scaffolds, most of the scaffolds were not able to be
removed or ejected from the mould. Rather than having to eject the moulded parts, a new
concept of fabrication was adapted from conventional manufacturing in the form of shell
moulding. However, since the fabricated parts are fragile, flexible shell mould was concept
was developed in which the can be unfolded/unrolled, and the fabricated part are removed by
gravity feed. This method proved to be a success with mixing AW-GC to 20% or more by
weight of PMMA. The ratio that was used to fabricate cylindrical scaffolds samples of 3mm
diameter is 70%AW-GC to 30% PMMA. It was compared with scaffolds produced from SLS
machine and found to be comparable by another group of researchers. The material cost
176

Chapter 6: General Discussion
involved in making this flexible shell mould is £2, which is extremely low compare to using
SLS.
Therefore, for low-cost manufacturing of simple bioceramics scaffolds this method can be an
alternative approach. The making of the flexible aluminium shell mould does not require
sophisticated tools.
Shell moulding Process of AW 3D artefacts by mean of Rapid Tooling (RT) 6.2.2
In extending the concept of flexible shell moulding using aluminium foil, RT was used to
develop shell moulding process for the fabrication of complex organic shape artefacts. In the
case study that followed, a resection of the mandible was fabricated to emulate the BGS for a
large section of the mandible. The artefact fabricated was not good enough to be used as it
had a lot of imperfection such as crack and non-completed features. These defects were
attributed the difficulty in compacting the powder mixture as properly and uniformly
compacted powder will encounter less deformation during sintering (Cocks, 2001).
Lost wax casting (LWC) process of bioceramic 3D artefacts by mean of Rapid Tooling 6.2.3(RT)
The total time and cost for producing the FDM indirect tooling was 15hours and £270
respectively as compared to RTV soft tooling of 19hours and £38. Figure 3-25 shows a
comparison between the wax model from indirect tooling and soft tooling. The wax model
produced by RTV silicone moulding was able to capture the geometrical feature of the master
pattern as compared to indirect tooling. The RTV moulding is a labour driven process as
preparation time is done manually. There is a difference of 4 hours between FDM indirect
moulding techniques. Hence, the soft tooling method is more suited in low labour cost region.
Therefore, this is a feasible method to be used in order to keep the cost of treatment low in
developing countries.
3D printing process of bioceramic 3D artefacts by indirect AM 6.2.4
The printed artefacts were of non-uniformity when different measurements were taken along
the length of the artefacts. This indicates that the range in AW particles size of up 53µm and
binder saturation have a direct impact on the accuracy and surface morphology. Furthermore,
material shrinkage during printing led to a slight curling of the first few layers of the printed
177

Chapter 6: General Discussion
parts All Samples that were printed have an average dimension of less than the dimension
from the CAD model even though the repeatability of the printing process is statistically
significant. Shrinkage in the printed part geometry due to wetting in the powder materials, as
well as the burnout of the maltodextrine compound, was observed. This created 50% porosity
in the artefacts/samples even though the initial powder mixer was 70%:30%, the same in both
RT process and 3DP process. The only different is the binding agent which in the later
process maltodextrine is used.
Crystallography Phase Comparison of Sintered AW parts from Moulding and 3D 6.2.5Printing.
As three different methods were used in the fabrication of AW glass ceramic, a comparison
was performed to verify that all these methods were able to produce AW glass ceramic that
are comparable to Kokubo’s AW glass ceramics. To complement the XRD analysis presented
in chapter 3 and 4, EDX analysis (shown in Table 6.1) was performed on 5 samples, all of
which were powders ground from the specimens that had been sintered (in chapter 3 and
chapter 4) and not from original powder. These are labelled as aw1, aw2, aw3d1, aw3d2, and
awfdm, where aw1, aw2, and awfdm are materials processed as described in chapter 3 (the
original powder was mixed with PMMA powder, and then the composite powder was
moulded in aluminium foil moulds and fused deposition moulds to produce green parts which
were then sintered). Aw3d1 and aw3d2 came from a different batch of powder, but from the
same supplier, and both were processed as described in chapter 4 (by 3D printing on the Z
Corp machine, with maltodextrine used as part of the binder solution). The sintering of all
specimens used the same heating profile as described in section 3.2.5. Table 6.1 shows the
summary of the EDX results.
Table 6.1 EDX result of 5 sintered samples as compared to Kokubo’s formulation.
norm wt %
Shell
Moulding
3D Printing FDM
moulding
Range
Element aw1 aw2 aw3d1 aw3d2 awfdm Kokubo's
formulation
Silicon 14.13 12.67 13.84 16.37 13.28 12.67-16.37 15.88
Phosphorus 5.08 4.03 4.86 5.82 4.46 4.03-5.82 7.06
178

Chapter 6: General Discussion
Calcium 29.92 25.12 32.57 39.13 29.76 25.12-39.13 31.96
Magnesium 2.75 2.32 2.04 2.17 2.48 2.04-2.75 2.76
Carbon 2.44 7.06 10.78
Oxygen 45.68 48.80 45.76 34.70 39.25 34.70-48.80 42.1
Aluminium 0.93 1.81
Fluorine 0.25
100 100 100 100 100 100.01
As indicated from Table 6.1, all of the sintered materials are similar to Kokubo’s formulation.
The aw3d1 and aw3d2 materials are very similar, as are the aw1 and aw2 materials. Overall
the elemental content is consistent with them being two batches of material: one for
aw1/aw2/awfdm and one for aw3d1/aw3d2. However, different type of binders were used for
each batch, and it seems that for aw1, aw2 and awfdm that used the PMMA binder there were
was some indication of residual carbon, while for aw3d1 and aw3d2, there were traces of
aluminium. Based on the results of the EDX and XRD analysis (refer appendix B4), it can be
recognized that the final composition of the structures is close to AW, but has been affected
by contamination:
• The PMMA or other mechanism of contamination has led to there being a small but
significant carbon content in aw1/aw2/awfdm, which has affected the phases produced in
sintering.
• Contamination has also resulted in the low aluminium content in aw3d1/aw3d2.
Therefore, further tests would be necessary to establish the biocompatibility of the processed
materials.
Melt moulding processing of biopolymer 3D artefacts by mean of Rapid Tooling (RT) 6.2.6
Various techniques for the fabrication of PLGA such as the solvent-casting separation and
particulate leaching method or the phase separation method, face some forms of disadvantage
179

Chapter 6: General Discussion
in particular where solvents are used in the process as large amounts of organic solvent are
needed to dissolve PLGA. This requires a very long time to completely remove solvents from
the resulting material (Makadia and Siegel 2011) and any residual solvents in the scaffolds
may be harmful to transplanted cells or host tissues (Mooney et al., 1996). Various methods
were used to fabricate PLGA such as emulsion techniques which require precise control of
processing parameters for higher encapsulation efficiency, and phase separation techniques
which tend to produce agglomerated particles and also require removal of large quantities of
the organic phase from the microspheres. The main disadvantage in both processes is the
adhesion of the microparticles to the inner walls of the spray-dryer (Makadia and Siegel 2011,
Jain, 2000b). The proposed method does not employ the use of solvent. This method was able
to produce 3D artefacts of PLGA without changing the physical and chemical characteristics
of the PLGA.
With reference to earlier works by Thomson using melt-moulding method (Thomson et al.,
1996, Thomson et al., 1998), the new methods proposed clearly indicated that this is a viable
solution for producing patients’ specific implantable devices at an affordable cost.
Furthermore, the mould required can be fabricated from external service bureau or within the
organisation itself as to produce the implants only required simple set up as outlined in
Chapter 5.
180

Conclusion and Future Work. Chapter 7:
Conclusion 7.1
The XRD analysis that was performed on all samples from the different approaches used in
fabricating glass ceramics yield similar peak list of wollastonite, diopside, whitlockite,
fluorapatite, hydroxylapatite, and calcium magnesium phosphate. This suggested that some
form of hydroxyl/apatite or calcium-magnesium-phosphate and wollastonite content in all the
samples, even though the readings of each element in the microscopy spectrum were different
for aw1, aw2 and awfdm with aw3d1 and aw3d2.
The experimental values of Young’s Modulus obtained for AW-GC in both the different
processing route of shell moulding (Chapter 3) and indirect 3D printing(chapter 4) yield
different results. The difference between them is attributed to pressing process, and the
porosity obtained. Calculated values and the Young’s modulus values reported is thought to
be the result of different processes as uniaxial pressing process produces a preferential pore
alignment and result in a smaller Young’s modulus in the pressing direction (Chang et al.,
2000).
Depending on the application required, all three methods of processing AW glass ceramics
into 3D artefacts are relatively low cost if compared to RM methods. The best approach to
produce cheapest simple scaffolds is by using the flexible aluminium sheet mould method
while both indirect AM methods give an acceptable account at producing complex artefacts.
In both rapid tooling and soft tooling approach the surface finish and the mechanical strength
are better than the 3DP approach. However, geometrical features of artefacts are clearly
defined when 3DP approach is used. In order for these approaches to be acceptable, additional
research to improve the output need to be performed and is listed as future work in section
7.2.
The wax patterns produced from the novel indirect AM method for processing biomaterials in
both the medical case study illustrate that this approach can be deployed in the health sectors,
in particular health sectors in low income country as the production cost is relatively low as
compared to direct AM methods or the conventional methods. In the conventional wax
patterns of investment casting, usually cost of mould is very high and the fabrication is time-
consuming; the more complex the mould is, the higher the cost will be (Cheah et al., 2005,
Pattnaik et al., 2014). By using mould created from FDM or FFF, the cost of mould can be
181

Chapter 7: Conclusion and Future Work.
reduced as AM fabrication cost is not exponentially related to part complexity (I. Gibson et
al., 2010, Atzeni et al., 2010, Hopkinson et al., 2006, Hague et al., 2004). The complex three-
dimensional pattern mould can be easily manufactured directly from CAD data by employing
the FDM process.
The use of AM processes to produce moulds for PLGA sintering, and the 3D printing of
bioceramic powders formed the best overall results in terms of geometry definition and
properties of the manufactured parts. Parts produced were observed to be accurate to within
acceptable value of the as designed dimensions for both the PLGA sintering and the
bioceramic powders 3D printing. The indirect AM methods are considered to be promising
processing routes for customised medical devices.
Future Work 7.2
Whilst this research has achieved the research aim and objectives, there are several
recommendations that could be implemented to take the research further. The possible future
work includes the followings:-
• Based on the flexible aluminium sheet shell moulding concept, research can be
conducted to develop a new procedure to improve powder compaction for complex
geometrical in flexible aluminium sheet shell moulding.
• Use finite element methods on new implant design and approach to implant fixation
through biological and bioactive mechanism.
• Explore indirect AM in producing mimicry bone structure from biocomposite of
PLGA and AW as a new approach for implant fixation.
• An in-depth study on processing variables as stipulated in sintering mechanism that
can improve the quality of the artefacts.
• Additional study in powder mixture particles size, saturation and compaction effect on
3DP artefacts.
• As FDM mould is made of ABS which has low heat transfer coefficient, the heating
method by conduction can be replace with microwave heating in sintering of AWGC
powder mixture as microwave energy can penetrated polymer mould.
• The volume fraction of porosity was not determined as the part of the objectives in
chapter 4. The concern in this chapter is to estimate the proximity of the empirical
Young’s Modulus E value to the value of cortical bone. In order to compare the
182
Chapter 7: Conclusion and Future Work.
empirical Young’s Modulus with the predicted theoretical E, the volume fraction of
porosity of the specimens need to be determined beforehand according to Nielsen’s
equation. Volume fraction of porosity can be determined by intrusion methods such as
mercury intrusion and microscopic image analysis or by Archimedes method. Hence,
it is suggested that an additional work in determining the porosity of sintered AWGC
using micro-CT is needed as this will provide better analysis regarding the percentage
of closed and opened pores. Therefore the volume fraction of porosity will be included
in the future work for 3DP artefacts.Thus the value of volume fraction of porosity and
the shape factor can be determined.
Additional work will include the calculation for the estimate of the theoretical value for
Young’s Modulus in a porous body and comparison with the experimental results.
The theoretical value can be calculated from Nielsen equation that is given as: -
E = (E0 * (1 - P) ^ 2) / (1 + P / (f - 1)) (7.1)
Where E = Young’s modulus
E0 = Young’s modulus for dense sample,
P = volume fraction of porosity, and
f = shape factor
As suggested by Nielsen, materials with porosity characteristic of joined particles be assigned
a shape factor value of 0.4 or less, a shape factor between 0.3-0.7 is appropriate for porosity
that resembles ribbons or dendrites and a shape factor of 0.6-1.0 is characteristic of pores
enveloped by a solid phase (Nielsen, 1982, Nielsen, 1984).
183

References
3DPARTS (2011) How it work (http://www.3dparts.co.uk/how-it-works/ access date: May-2012).
3DSYSTEM (2014) Projet Series Printer (http://www.3dsystems.com/projet5500x, access date: July 2014).
AHN, D. K., SIMS, C. D., RANDOLPH, M. A., O'CONNOR, D., BUTLER, P. E. M., AMARANTE, M. T. J. & YAREMCHUK, M. J. (1997) Craniofacial skeletal fixation using biodegradable plates and cyanoacrylate glue. Plastic and Reconstructive Surgery, 99, 1508-1517.
ALEXIS, F. (2005) Factors affecting the degradation and drug-release mechanism of poly(lactic acid) and poly[(lactic acid)-co-(glycolic acid)]. Polymer International, 54, 36-46.
ALKAN, A., CELEBI, N., OZDEN, B., BAS, B. & INAL, S. (2007) Biomechanical comparison of different plating techniques in repair of mandibular angle fractures. Oral Surgery, Oral Medicine, Oral Pathology, Oral Radiology, and Endodontology, 104, 752-756.
ANIWAA (2014) Compare 3D Printers (http://www.aniwaa.com/3d-printers/compare-3d-printers/ access date: July-2014).
ARCAM (2013) Electron beam melting- Hardware (http://www.arcam.com/technolog y /electron-beam-melting/hardware/ access date: October 2013).
ARCOS, D., IZQUIERDO-BARBA, I. & VALLET-REGÍ, M. (2009) Promising trends of bioceramics in the biomaterials field. Journal of Materials Science: Materials in Medicine, 20, 447-455.
ARMENTANO, I., DOTTORI, M., FORTUNATI, E., MATTIOLI, S. & KENNY, J. M. (2010) Biodegradable polymer matrix nanocomposites for tissue engineering: A review. Polymer Degradation and Stability, 95, 2126-2146.
ASTM (2012) F2792 − 12a: Standard Terminology for Additive Manufacturing Technologies1,2. IN INTERNATIONAL, A. (Ed.) March 2012 ed., ASTM International, 100 Barr Harbor Drive, PO Box C700, West Conshohocken, PA 19428-2959. United States.
ATHANASIOU, K. A., ZHU, C. & LANCTOT, D. R. (2000) Fundamentals of biomechanics in tissue engineering of bone. Tissue Engineering, 6, 361-381.
ATZENI, E., IULIANO, L., MINETOLA, P. & SALMI, A. (2010) Redesign and cost estimation of rapid manufactured plastic parts. Rapid Prototyping Journal, Vol. 16 pp. 308 - 317.
BARTOLO, P. & BIDANDA, B. (2008) Bio-materials and prototyping applications in medicine.
BEN-NISSAN, B. & PEZZOTTI, G. (2004) Bioceramics: An Introduction. IN TEOH, S. H. (Ed.) Engineering Materials for Biomedical Applications. Singapore, WorldScientific.
BERCE, P., CHEZAN, H. & BALC, N. (2005) The application of Rapid Prototyping Technologies for manufacturing the custom implants. ESAFORM 2005 Conference. Cluj-Napoca, Romania.
BERGER, M. B. (2010) The importance and testing of density/ porosity/ permeability/ pore size for refractories The Southern African Institute of Mining and Metallurgy Refractories 2010 Conference. Southern Africa.
BERGSMA, J. E., ROZEMA, F. R., BOS, R. R., BOERING, G., DE BRUIJN, W. C. & PENNINGS, A. J. (1995) In vivo degradation and biocompatibility study of in vitro pre-degraded as-polymerized polyactide particles. Biomaterials, 16 pp. 267-274.
BERNARD, A. & FISCHER, A. (2002) New Trends in Rapid Product Development. CIRP Annals - Manufacturing Technology, 51, 635-652.
184
BERTRAND, P., BAYLE, F., COMBE, C., GOEURIOT, P. & SMUROV, I. (2007) Ceramic components manufacturing by selective laser sintering. Applied Surface Science, 254, 989-992.
BEST, S. M., PORTER, A. E., THIAN, E. S. & HUANG, J. (2008) Bioceramics: Past, present and for the future. Journal of the European Ceramic Society, 28, 1319-1327.
BHAGOL, A., SINGH, V. & SINGHAL, R. (2013) Management of Mandibular Fractures. IN (ED.), P. M. H. K. M. (Ed.) A Textbook of Advanced Oral and Maxillofacial Surgery. InTech.
BIBB, R., FREEMAN, P., BROWN, R., SUGAR, A., EVANS, P. & BOCCA, A. (2000) An investigation of three-dimensional scanning of human body surfaces and its use in the design and manufacture of prostheses. Proceedings of the Institution of Mechanical Engineers, Part H: Journal of Engineering in Medicine, 214, 589-594.
BOOTHROYD, G. (1994) Product design for manufacture and assembly. Computer-Aided Design, 26, 505-520.
BORDEN, M., ATTAWIA, M., KHAN, Y. & LAURENCIN, C. T. (2002) Tissue engineered microsphere-based matrices for bone repair: : design and evaluation. Biomaterials, 23, 551-559.
BORRILLE, A. V. & GOMES, J. D. O. (2011) Selection of additive manufacturing technologies using desicion methods. IN HOQUE, M. (Ed.) Rapid prototyping technology - Principles and Functional requirements. Shanghai, InTech.
BOSE, S., VAHABZADEH, S. & BANDYOPADHYAY, A. (2013) Bone tissue engineering using 3D printing. Materials Today, 16, 496-504.
BOULOUX, G. F., DEMO, M., MOE, J. & EASLEY, K. A. (2014) Mandibular fractures treated with small plates and screws reduce treatment cost. Journal of Oral and Maxillofacial Surgery, 72, 362-369.
BRACKETT, D., ASHCROFT, I. & HAGUE, R. (2011) TOPOLOGY OPTIMIZATION FOR ADDITIVE MANUFACTURING. UTwired LFF symposium proceeding. Texas.
BRASILEIRO, B. F. & PASSERI, L. A. (2006) Epidemiological analysis of maxillofacial fractures in Brazil: A 5-year prospective study. Oral Surgery, Oral Medicine, Oral Pathology, Oral Radiology, and Endodontology, 102, 28-34.
BRAUN, D., CHERDRON, H., REHAHN, M., RITTER, H. & VOIT, B. (2012) Methods and Techniques for Synthesis, Characterization, Processing, and Modification of Polymers. Polymer Synthesis: Theory and Practice. Springer Berlin Heidelberg.
BSI (1995) BS EN 993-1:1995 BS 1902-3.8:1995-Methods of test for dense shaped refractory products. Determination of bulk density, apparent porosity and true porosity. IN INSTITUTE, B. S. (Ed.), BSI.
BSI (2003) BS EN 1389:2003 Advanced technical ceramics. Ceramic composites. Physical properties. Determination of density and apparent porosity. IN INSTITUTE, B. S. (Ed.), Bristish Standard Institute, London.
BSI (2008) BS EN ISO 6872:2008-Dentistry. Ceramic materials. IN INSTITUTE, B. S. (Ed.), British Standards Institute, London.
BSI (2009a) BS EN ISO 6892 - 1:2009 Metallic Materials Tensile Testing. Part 1 Method of Test at Room Temperatures. IN BSI (Ed.), British Standards Institute, London.
BSI (2009b) BS ISO 22794:2009 Dentistry — Implantable materials for bone filling and augmentation in oral and maxillofacial surgery — Contents of a technical file (ISO 22794:2007, corrected version 2009-01-15). IN INSTITUTE, B. S. (Ed.), British Standards Institute, London.
BSI (2010) BS EN ISO 20795:2010 Dentistry — Base polymers Part 2: Orthodontic base polymers (ISO 20795-2:2010). IN INSTITUTE, B. S. (Ed.), British Standards Institute, London.
BSI (2011) BS EN ISO 178:2010 Plastics — Determination of flexural properties (ISO 178:2010). IN INSTITUTE, B. S. (Ed.), British Standard Institute, London.
185

BUTSCHER, A., BOHNER, M., HOFFMANN, S., GAUCKLER, L. & MÜLLER, R. (2011a) Structural and material approaches for bone tissue engineering in powder based 3D printing. Acta Biomaterialia, In Press, Accepted Manuscript.
BUTSCHER, A., BOHNER, M., HOFMANN, S., GAUCKLER, L. & MÜLLER, R. (2011b) Structural and material approaches to bone tissue engineering in powder-based three-dimensional printing. Acta Biomaterialia, 7, 907-920.
CALLAGHAN, J. T., TANG, Z. G. & HUNT, J. A. (2004) The in-vitro evaluation of PCL / PLGA copolymers as bone replacement materials. Transactions - 7th World Biomaterials Congress.
CANNILLO, V., PIERLI, F., SAMPATH, S. & SILIGARDI, C. (2009) Thermal and physical characterisation of apatite/wollastonite bioactive glass-ceramics. Journal of the European Ceramic Society, 29, 611-619.
CHANG, L. S., CHUANG, T. H. & WEI, W. J. (2000) Characterization of alumina ceramics by ultrasonic testing. Materials Characterization 45 pp. 221-226.
CHARLES-HARRIS, M., DEL VALLE, S., HENTGES, E., BLEUET, P., LACROIX, D. & PLANELL, J. A. (2007) Mechanical and structural characterisation of completely degradable polylactic acid/calcium phosphate glass scaffolds. Biomaterials, 28, 4429-4438.
CHARTIER, T., BADEV, A., ABOULIATIM, Y., LEBUADY, P. AND LECAMP, L. (2012) Stereolithography process: influence of the rheology of silica suspensions and the medium on polymerization kinetics-cured depth and width. Journal of the European Ceramic Society, Vol.32, pp. 1625-1634.
CHEAH, C. M., CHUA, C. K., LEE, C. W., FENG, C. & TOTONG, K. (2005) Rapid prototyping and tooling techniques: a review of applications for rapid investment casting. The International Journal of Advanced Manufacturing Technology, 25, 308-320.
CHEN, P.-Y. & MCKITTRICK, J. (2011) Compressive mechanical properties of demineralized and deproteinized cancellous bone. J Mech Behav Biomed Mater 4(7), 961-973.
CHEUNG, H.-Y., LAU, K.-T., LU, T.-P. & HUI, D. (2007) A critical review on polymer-based bio-engineered materials for scaffold development. Composites Part B: Engineering, 38, 291-300.
CHEVALIER, J. & GREMILLARD, L. (2009) Ceramics for medical applications: A picture for the next 20 years. Journal of the European Ceramic Society, 29, 1245-1255.
CHIANG, W. M., C.S. LIM, C.K. CHUA, P.L. LO & ENG, C. T. (2005) Application of rapid prototyping and tooling in customised airway management. Rapid Prototyping Journal 11/2, pp 106-112.
CHOI, S. H. & SAMAVEDAM, S. (2002) Modelling and optimisation of Rapid Prototyping. Computers in Industry, 47, 39-53.
CHOW, W. S., TAY, H. K., AZLAN, A. & MOHD ISHAK, Z. A. (2008) MECHANICAL AND THERMAL PROPERTIES OF HYDROXYAPATITE FILLED POLY(METHYL METHACRYLATE) COMPOSITES Proceedings of the Polymer Processing Society 24th Annual Meeting ~ PPS-24 ~ June 15-19, 2008 Salerno (Italy).
CHRCANOVIC, B. (2012) Fixation of mandibular angle fractures: clinical studies. Oral and Maxillofacial Surgery, 18, 123-152.
CHRISCHILLES, E., SHIREMAN, T. & WALLACE, R. (1994) Costs and health effects of osteoporotic fractures. Bone 15.
CHUA, C. K., LEONG, K. F. & LIM, C. S. (2010) Rapid Prototyping: Principles and Applications, Singapore, World Scientific Publishing.
CHUNG, T. W., TSAI, Y. L., HSIEH, J. H. & TSAI, W. J. (2006) Different ratios of lactide and glycolide in PLGA affect the surface property and protein delivery characteristics
186

of the PLGA microspheres with hydrophobic additives. Journal of Microencapsulation, 23, 15-27.
CIENFUEGOS, R., CORNELIUS, C.-P., ELLIS III, E. & KUSHNER, G. (2008) Mandible - Special considerations. IN FIGARI, M., ANICETO, G. S. & BUCHBINDER, D. (Eds.) AO Surgery Reference -Online reference in clinical life. v1.0 2008-12-01 ed., AO Foundation.
COCKS, A. C. F. (2001) Constitutive modelling of powder compaction and sintering. Progress in Materials Science, 46, 201-229.
COHEN, A., LAVIV, A., BERMAN, P., NASHEF, R. & ABU-TAIR, J. (2009) Mandibular reconstruction using stereolithographic 3-dimensional printing modeling technology. Oral Surgery Oral Medicine Oral Pathology Oral Radiology and Endodontology, 108, 661-666.
COLBY, C. (2007) Differential Scanning Calorimetry (http://www.colby.edu /chemistry/PChem/lab/DiffScanningCal.pdf access date: Jan 2014).
CRONSKAR, M., BACKSTROM, M. & RANNAR, L.-E. (2013) Production of customized hip stem prostheses - a comparison between conventional machining and electron beam melting (EBM). Rapid Prototyping Journal, 19, 365-372.
CUSTOMPARTNET (2012) Laminated object manufacturing (http://www.custompartnet.com/wu/laminated-object-manufacturing access date: November 2012).
CUT-CRPM (2014) CRPM’s Additive Manufacturing Technologies (http://www.cut.ac.za/crpm-am-technologies/ access date: Febuary 2014).
DA SILVA, L. F. M., OCHSNER, A. & ADAMS, R. D. (Eds.) (2011) Handbook of adhesion technology, Berlin Heidelberg, Verlag-Springer.
DE BEER, N., DIMITROV, D. & VAN DER MERWE, A. (2008) Manufacturing of custom-made medical implants for cranio / maxillofacial and orthopaedic surgery - an overview of the current state of the industry. Journal for New Generation Sciences, 6, 1-15.
DE JAGER, N., FEILZER, A. J. & DAVIDSON, C. L. (2000) The influence of surface roughness on porcelain strength. Dental Materials, 16, 381-388.
DECKERS, J., SHAHZAD, K., VLEUGELS, J. & KRUTH, J. P. (2012) Isostatic pressing assisted indirect selective laser sintering of alumina components. Rapid Prototyping Journal, 18, 409-419.
DEOGRATIUS B.K, ISAAC M.M & S., F. (2006) Epidemiology and management of maxillofacial fractures treated at Muhimbili National Hospital in Dar es Salaam, Tanzania, 1998-2003. J Int Dent, 56, 4.
DERBY, B. (2005) 3D ink jet printing of ceramics and biomaterials. 21st International Conference on Digital Printing Technologies (NIP21)/International Conference on Digital Fabrication Technologies. Baltimore, MD.
DICKENS, P., HAGUE, R. & WOHLERS, T. (2000) Methods of rapid tooling worldwide (http://wohlersassociates.com/Oct00MMT.htm access date: January 2008).
DIEGEL, O., SINGAMNENI, S., REAY, S. & WITHELL, A. (2011) Sustainable product design through additive manufacturing. Asian International Journal of Science and Technology in Production and Manufacturing Engineering (AIJSTPME), Vol.4 No.1, pp. 39 -45.
DOMB, A. J., KUMAR, N., SHESKIN, T., BENTOLILA, A., SLAGER, J. & EOMIM, D. T. (2001) Polymeric drug carriers IN DUMITRIU, S. (Ed.) Polymeric biomaterials Revised and Expanded. New York, Marcel Dekker Inc. .
DONG, C. & BOWEN, H. K. (1989) Hot-Stage Study of Bubble Formation During Binder Burnout. Journal of the American Ceramic Society, 72, 1082-1087.
DOTCHEV, K. & SOE, S. (2006) Rapid manufacturing of patterns for investment casting: Improvement of quality and success rate. Rapid Prototyping Journal, 12, 156-164.
187
DOUGLAS, T. S. (2014) Additive manufacturing : from implants to organs : forum - advances in medicine. South African Medical Journal, 104, 408-409.
DOWSON, D. (2006) Tribological principles in metal-on-metal hip joint design. Proceedings of the Institution of Mechanical Engineers, Part H: Journal of Engineering in Medicine, 220, 161-171.
DREAMS.ME.VT.EDU (2009) 3D Printing (http://www.me.vt.edu/dreams/binder-jetting/ access date: September 2013).
DUYGU, G., GULER, N., TORE, G. & SENCIFT, K. (2007) Dental implant complications. International Journal of Oral and Maxillofacial Surgery, 36, 1092-1093.
EBERT, J., OZKOL, E., ZEICHNER, A., UIBEL, K., WEISS, O., KOOPS, U., TELLE, R. & FISCHER, H. (2009) Direct Inkjet Printing of dental Prostheses Made of Zirconia. Journal of Dental Research, 88, 673-676.
EGGBEER, D., BIBB, R., EVANS, P. & JI, L. (2012) Evaluation of direct and indirect additive manufacture of maxillofacial prostheses. Proceedings of the Institution of Mechanical Engineers, Part H: Journal of Engineering in Medicine, 226, 718-728.
EL-MELIEGY, E. & VAN NOORT, R. (2012) Design of Medical Glass-Ceramics. Glasses and Glass Ceramics for Medical Applications. New York, Springer New York.
ELLIS III, E. (1999) Treatment methods for fractures of the mandibular angle. International Journal of Oral and Maxillofacial Surgery, 28, 243-252.
ELLIS III, E., MOOS, K. F. & EL-ATTAR, A. (1985) Ten years of mandibular fractures: An analysis of 2,137 cases. Oral Surgery, Oral Medicine, Oral Pathology, 59, 120-129.
EOS, G. (2011) Medical: Customer Case Study ( http://www.eos.info/press/customer_case_studies/bego access date : November 2012).
ESSES, S. J., BERMAN, P., BLOOM, A. I. & SOSNA, J. (2011) Clinical Applications of Physical 3D Models Derived From MDCT Data and Created by Rapid Prototyping. American Journal of Roentgenology, 196, W683-W688.
FABRISONIC (2012) How it works (http://www.fabrisonic.com/how_it_works.html access date: November 2012).
FARZADI, A., SOLATI-HASHJIN, M., ASADI-EYDIVAND, M. & ABU OSMAN, N. A. (2014) Effect of Layer Thickness and Printing Orientation on Mechanical Properties and Dimensional Accuracy of 3D Printed Porous Samples for Bone Tissue Engineering. PLoS ONE, 9, 18.
FEDOK, F. G., VAN KOOTEN, D. W., DEJOSEPH, L. M., MCGINN, J. D., SOBOTA, B., LEVIN, R. J. & JACOBS, C. R. (1998) Plating techniques and plate orientation in repair of mandibular angle fractures: An in vitro study. Laryngoscope, 108, 1218-1224.
FISCHER, H., SCHAFER, M. & MARX, R. (2003) Effect of Surface Roughness on Flexural Strength of Veneer Ceramics. Journal of Dental Research, 82, 972-975.
FRAZER, R. Q., BYRON, R. T., OSBORNE, P. B. & WEST, K. P. (2005) PMMA: An essential material in medicine and dentistry. Journal of Long-Term Effects of Medical Implants, 15, 629-639.
FREITAG, V., HELL, B. & FISCHER, H. (1991) Experience with AO reconstruction plates after mandibular resection involving its continuity. Journal of Cranio-Maxillo-Facial Surgery, 19, 191-198.
FRIDRICH, K. L., PENA-VELASCO, G. & OLSON, R. A. J. (1992) Changing trends with mandibular fractures: A review of 1,067 cases. Journal of Oral and Maxillofacial Surgery, 50, 586-589.
FUJITA, H., IIDA, H., IDO, K., MATSUDA, Y., OKA, M. & NAKAMURA, T. (2000) Porous apatite-wollastonite glass-ceramic as an intramedullary plug. J Bone Joint Surg [Br], 82-B, 614-618.
188

GABALL, C., LOVALD, S., BAACK, B. & OLSON, G. (2011) Minimally Invasive Bioabsorbable Bone Plates for Rigid Internal Fixation of Mandible Fractures. Archives of Facial Plastic Surgery, 13, 31-35.
GARDAN, N. (2014) Knowledge Management for Topological Optimization Integration in Additive Manufacturing. International Journal of Manufacturing Engineering, 2014, 9.
GENTILE, P., CHIONO , V., CARMAGNOLA , I. & HATTON , P. V. (2014) An Overview of Poly(lactic-co-glycolic) Acid (PLGA)-Based Biomaterials for Bone Tissue Engineering Int. J. Mol. Sci. , 15, pp 3640-3659.
GEORGIOU, G., MATHIEU, L., PIOLETTI, D. P., BOURBAN, P. E., MÃ¥NSON, J. A. E., KNOWLES, J. C. & NAZHAT, S. N. (2007a) Polylactic acid-phosphate glass composite foams as scaffolds for bone tissue engineering. Journal of Biomedical Materials Research - Part B Applied Biomaterials, 80, 322-331.
GEORGIOU, G., MATHIEU, L., PIOLETTI, D. P., BOURBAN, P. E., MANSON, J. A. E., KNOWLES, J. C. & NAZHAT, S. N. (2007b) Polylactic acid-phosphate glass composite foams as scaffolds for bone tissue engineering. Journal of Biomedical Materials Research - Part B Applied Biomaterials, 80, 322-331.
GERMAN, R. M. (1996) Sintering Theory and Practice. Sintering Theory and Practice, by Randall M. German, pp. 568. ISBN 0-471-05786-X. Wiley-VCH, January 1996., 1.
GETTY, P. J. & PEABODY, T. D. (1999) Complications and Functional Outcomes of Reconstruction with an Osteoarticular Allograft After Intra-Articular Resection of the Proximal Aspect of the Humerus*.
GHAZY, M. M. S. A. (2012) Development of an additive manufacturing decision support system (AMDSS). School of Mechanical and System Engineering. Newcastle upon Tyne, Newcastle University.
GIBSON, I., ROSEN, D. W. & STUCKER, B. (2010) Additive Manufacturing Technologies. Rapid Prototyping to Direct Digital Manufacturing. Springer Science+Business Media LLC 2010.
GOLDBERG, V. M., AKHAVAN, S., (2005) Biology of bone grafts. IN LIEBERMAN, J. R., FRIEDLAENDER G.E. (Ed.) Bone regeneration and repair biology and clinical applications. Totowa, N.J., Humana Press.
GOODACRE, C. J., BERNAL, G., RUNGCHARASSAENG, K. & KAN, J. Y. K. (2003) Clinical complications with implants and implant prostheses. The Journal of Prosthetic Dentistry, 90, 121-132.
GOODACRE, C. J., KAN, J. Y. K. & RUNGCHARASSAENG, K. (1999) Clinical complications of osseointegrated implants. The Journal of Prosthetic Dentistry, 81, 537-552.
GOODRIDGE, R., DALGARNO, K. & WOOD, D. (2006a) Indirect selective laser sintering of an apatite-mullite glass-ceramic for potential use in bone replacement applications. Proceedings of the Institution of Mechanical Engineers, Part H: Journal of Engineering in Medicine, 220, 57-68.
GOODRIDGE, R. D., DALGARNO, K. W. & WOOD, D. J. (2006b) Indirect selective laser sintering of an apatite-mullite glass-ceramic for potential use in bone replacement applications. Proceedings of the Institution of Mechanical Engineers Part H-Journal of Engineering in Medicine, 220, 57-68.
GOSAIN, A. K. (2002) The current status of tissue glues: I. For bone fixation. Plastic and Reconstructive Surgery, 109, 2581-2583.
GOSAIN, A. K. & LYON, V. B. (2001) Use of tissue glue: Current status. Perspect. Plast. Surg., 15, 129-145.
GOSAIN, A. K., SONG, L., CORRAO, M. A. & PINTAR, F. A. (1998) Biomechanical evaluation of titanium, biodegradable plate and screw, and cyanoacrylate glue fixation systems in craniofacial surgery. Plastic and Reconstructive Surgery, 101, 582-591.
189

HAGUE, R., CAMPBELL, I. & DICKENS, P. (2003) Implications on design of rapid manufacturing. Proceedings of the Institution of Mechanical Engineers, Part C: Journal of Mechanical Engineering Science, 217, 25-30.
HAGUE, R., MANSOUR, S. & SALEH, N. (2004) Material and design considerations for rapid manufacturing. International Journal of Production Research, 42, 4691-4708.
HEISS, C., SCHETTLER, N., WENISCH, S., CORDS, S., SCHILKE, F., LIPS, K. S., ALT, V. & SCHNETTLER, R. (2010) Bond strength of an alkylene bis(dilactoyl)-methacrylate bone adhesive: A biomechanical evaluation in sheep. Journal of Biomaterials Science, Polymer Edition, 21, 1345-1358.
HENCH, L. L. (1991) Bioceramics: From Concept to Clinic. Journal of the American Ceramic Society Bulletin, Vol. 74, pp: 1487-1510.
HENCH, L. L. (1998) Bioceramics. Journal of the American Ceramic Society, 81, 1705-1728. HENCH, L. L. & ANDERSSON, O. (1993) "Bioactive Glasses” IN HENCH, L. L. &
WILSON, J. (Eds.) An Introduction to Bioceramics. Singapore, World Scientific. HENCH, L. L. & KOKUBO, T. (1998) Properties of bioactive glasses and glass-ceramics. IN
BLACK, J. & HASTINGS, G. (Eds.) Handbook of Biomaterial Properties. London, Chapman & Hill.
HENCH, L. L. & POLAK, J. M. (2002) Third-Generation Biomedical Materials. Science, 295, 1014-1017.
HENCH, L. L. & WILSON, J. (1995) Bioactive Glasses and Glass-Ceramics: A 25-Year Restrospective. IN FISCHMAN, G., CLARE, A. & HENCH, L. L. (Eds.) Bioceramics: Materials and Applications. Ohio, The American Ceramic Society.
HENCH, L. L. & WILSON, J. (2013) Introduction. IN HENCH, L. L. (Ed.) An Introduction to Bioceramics, Second Edition. London, Imperial College Press.
HENRY, D., GOODGE, L. J. & MOGK, D. (2007) X-ray reflection in accordance with Bragg's Law (http://serc.carleton.edu /research_education/ geochemsheets/BraggsLaw.html access date Jan 2014).
HILL, P. A. (1998) Bone Remodelling. British Journal of Orthodontics, 25, pp. 101 - 107. HOLAND, W. & BEALL, G. H. (2012) Glass-ceramic technology, Hoboken, New Jersey,
John Wiley & Sons,. HOLLISTER, S. J., LEVY, R. A., CHU, T. M., HALLORAN, J. W. & FEINBERG, S. E.
(2002) An image-based approach for designing and manufacturing craniofacial scaffolds. Int. J. Oral Maxillofac. Surg., 29, 67-71.
HON, K. K. B. (2007) Digital Additive Manufacturing: From Rapid Prototyping to Rapid Manufacturing IN HINDUJA, S. & FAN, K.-C. (Eds.) Proceedings of the 35th International MATADOR Conference. London, Springer
HON, K. K. B. & GILL, T. J. (2003) Selective Laser Sintering of SiC/Polyamide Composites. CIRP Annals - Manufacturing Technology, 52, 173-176.
HOPKINSON, N. (2006) Rapid Manufacturing: Benefits to Your Business and the Technologies to Consider. ( http://www.timecompress.com/ magazine/archives.cfm retrieved on 23 Feb 2008). TCT2006 RM Conference.
HOPKINSON, N. & DICKNES, P. (2003) Analysis of rapid manufacturing—using layer manufacturing processes for production. Proceedings of the Institution of Mechanical Engineers, Part C: Journal of Mechanical Engineering Science, 217, 31-39.
HOPKINSON, N., GAO, Y. & MCAFEE, D. (2006) Design for environment analyses applied to rapid manufacturing. Proceedings of the Institution of Mechanical Engineers, Part D: Journal of Automobile Engineering, 220, 1363-1372.
HOPKINSON, N., HAGUE, R. & DICKENS, P. (2005) Rapid manufacturing: An industrial revolution for the digital age, West Sussex, England, John Wiley and Sons.
HOQUE, A. S. M., HALDER, P. K., PARVEZ, M. S. & SZECSI, T. (2012) Integrated manufacturing features and Design-for-manufacture guidelines for reducing product
190

cost under CAD/CAM environment. Computers & Industrial Engineering, 66, 988-1003.
HULBERT, S. F., HENCH, L. L., FORBERS, D. & BOWMAN, L. S. (1982) History of bioceramics. Ceramics International, Vol. 8, pp: 131-140.
I. GIBSON, D.W. ROSEN & STUCKER, B. (2010) Additive Manufacturing Technologies. Springer ScienceþBusiness Media, LLC.
IGNJATOVIC, N., SULJOVRUJIC, E., BUDINSKI-SIMENDIC, J., KRAKOVSKY, I. & USKOKOVIC, D. (2004) Evaluation of hot-pressed hydroxyapatite/poly-L-lactide composite biomaterial characteristics. Journal of Biomedical Materials Research - Part B Applied Biomaterials, 71, 284-294.
IIDA, S., HASSFELD, S., REUTHER, T., SCHWEIGERT, H.-G., HAAG, C., KLEIN, J. & MÜHLING, J. (2003) Maxillofacial fractures resulting from falls. Journal of Cranio-Maxillofacial Surgery, 31, 278-283.
IIDA, S., KOGO, M., SUGIURA, T., MIMA, T. & MATSUYA, T. (2001) Retrospective analysis of 1502 patients with facial fractures. International Journal of Oral and Maxillofacial Surgery, 30, 286-290.
IMPACT-TEST, U. K. (2013) 1000ml Pycnometer (http://impact-test.co.uk/ access date: July 2014).
JAIN, R. (2000a) The manufacturing techniques of various drug loaded biodegradable poly(lactide-co-glycolide) (PLGA) devices. Biomaterials 21(23), pp 2475-2490.
JAIN, R. A. (2000b) The manufacturing techniques of various drug loaded biodegradable poly(lactide-co-glycolide) (PLGA) devices. Biomaterials, 21, 2475-2490.
JAMSHIDINIA, M., WANG, L., TONG, W. & KOVACEVIC, R. (2014) The bio-compatible dental implant designed by using non-stochastic porosity produced by Electron Beam Melting® (EBM). Journal of Materials Processing Technology, 214, 1728-1739.
JAYTECGLASS (2012) Density bottle.(http://www.jaytecglass.co.uk/laboratory-glassware/oil-test-glassware/density-bottlespyknometers/ access date: September 2013).
JONES, A. C., ARNS, C. H., SHEPPARD, A. P., HUTMACHER, D. W., MILTHORPE, B. K. & KNACKSTEDT, M. A. (2007) Assessment of bone ingrowth into porous biomaterials using MICRO-CT. Biomaterials, 28, 2491-2504.
JONES, J. R. & HENCH, L. L. (2001) Biomedical materials for new millennium: Perspective on the future. Materials Science and Technology, 17, 891-900.
KAMRANI, A. K. & NASR, E. A. (2006) Rapid Prototyping: Theory and Practice., London, Springer.
KANDALAM, U., BOUVIER, A. J., CASAS, S. B., SMITH, R. L., GALLEGO, A. M., ROTHROCK, J. K., THOMPSON, J. Y., HUANG, C. Y. C. & STELNICKI, E. J. (2013) Novel bone adhesives: a comparison of bond strengths in vitro. International Journal of Oral and Maxillofacial Surgery, 42, 1054-1059.
KANG, S. L. (2005) Sintering : Densification, Grain Growth and Microstructure Jordan Hill, GBR, Butterworth-Heinemann (Available from: ProQuest ebrary access date October 2013).
KAR, I. & MAHAVOI, B. (2012) Retrospective Analysis of 503 Maxillo-Facial Trauma Cases in Odisha During the Period of Dec’04–Nov’09. Journal of Maxillofacial and Oral Surgery, 11, 177-181.
KARAGEORGIOU, V. & KAPLAN, D. (2005) Porosity of 3D biomaterial scaffolds and osteogenesis. Biomaterials, 26, 5474-5491.
KATTI, D. S., LAKSHMI, S., LANGER R. & LAURENCIN, C. T. (2002) Toxicity,biodegradation and elimination of polyanhydrides. Adv. Drug Deliv Rev, 54, pp 933-961.
191

KESHAW, H., GEORGIOU, G., BLAKER, J. J., FORBES, A., KNOWLES, J. C. & DAY, R. M. (2009) Assessment of polymer/bioactive glass-composite microporous spheres for tissue regeneration applications. Tissue Engineering - Part A, 15, 1451-1461.
KHALYFA, A., VOGT, S., WEISSER, J., GRIMM, G., RECHTENBACH, A., MEYER, W. & SCHNABELRAUCH, M. (2007) Development of a new calcium phosphate powder-binder system for the 3D printing of patient specific implants. Journal of Materials Science-Materials in Medicine, 18, 909-916.
KHAN, S. F., DALGARNO, KENNETH W. (2010) Design of customised bioceramic medical implants by layered manufacturing. IN BARTOLO, P. J. E. A. (Ed.) Innovative Developments in Design and Manufacturing. London, Taylor & Francis Group.
KIM, G. D. & OH, Y. T. (2008) A benchmark study on rapid prototyping processes and machines: quantitative comparisons of mechanical properties, accuracy, roughness, speed, and material cost. Proceedings of the Institution of Mechanical Engineers, Part B: Journal of Engineering Manufacture, 222, 201-215.
KIM, S.-G. & PARK, S.-S. (2007) Incidence of Complications and Problems Related to Orthognathic Surgery. Journal of Oral and Maxillofacial Surgery, 65, 2438-2444.
KIM, Y.-R., SEO, S.-H., LEE, E., PYO, M., KIM, H., PARK, S., LEE, D.-W., PIE, J.-E., RYU, J.-J. & KIM, M.-K. (2013) Effect of dental implant materials on the extracellular matrix formation and cellular adhesion in MG-63 cells. Molecular & Cellular Toxicology, 9, 327-334.
KITSUGI, T., YAMAMURO, T. & KOKUBO, T. (1989) Bonding behavior of a glassceramic containing apatite and wollastonite in segmental replacement of the rabbit tibia under load-bearing conditions. The Journal of Bone and Joint Surgery, Vol. 71, pp: 264-272.
KLAMMERT, U., VORNDRAN, E., REUTHER, T., MULLER, F. A., ZORN, K. & GBURECK, U. (2010) Low temperature fabrication of magnesium phosphate cement scaffolds by 3D powder printing. Journal of Materials Science-Materials in Medicine, 21, 2947-2953.
KLEIN, M. & GLATZER, C. (2006) Individual CAD/CAM fabricated glass-bioceramic implants in reconstructive surgery of the bony orbital floor. Plastic and Reconstructive Surgery, 117, 565-570.
KOBAYASHI, M., NAKAMURA, T., OKADA, Y., FUKUMOTO, A., FURUKAWA, T., KATO, H., KOKUBO, T. & KIKUTANI, T. (1998) Bioactive bone cement: Comparison of apatite and wollastonite containing glass-ceramic, hydroxyapatite, and β-tricalcium phosphate fillers on bone-bonding strength. Journal of Biomedical Materials Research, 42, 223-237.
KOKUBO, T. (1991a) Bioactive Glass-Ceramics: Properties and Applications. Biomaterials, Vol. 12, pp: 155-163.
KOKUBO, T. (1991b) Bioactive glass ceramics: properties and applications. Biomaterials, 12, 155-163.
KOKUBO, T. (2008) Bioactive glass-ceramics. IN KOKUBO, T. (Ed.) Bioceramics and their clinical applications. Cambridge, Woodhead Publishing.
KOKUBO, T., ITO, S., SAKKA, S. & YAMAMURO, T. (1986) Formation of a High-Strength Bioactive Glass-Ceramic in the System MgO-CaO-SiO2-P2O5. Journal of Material Science, Vol. 21, pp: 536-540.
KOKUBO, T., KIM, H.-M. & KAWASHITA, M. (2003) Novel bioactive materials with different mechanical properties. Biomaterials, 24, 2161-2175.
KOKUBO, T., SHIGEMATSU, M., NAGASHIMA, Y., TASHIRO, M., NAKAMURA, T. & HIGASHI, S. (1982) Apatite and wollastonite containing glass-ceramics for prosthetic application. Bulletin of Institute for Chemical Research, Kyoto University, Vol. 60, pp: 260-268.
192

KOSTAKIS, G., STATHOPOULOS, P., DAIS, P., GKINIS, G., IGOUMENAKIS, D., MEZITIS, M. & RALLIS, G. (2012) An epidemiologic analysis of 1,142 maxillofacial fractures and concomitant injuries. Oral Surgery, Oral Medicine, Oral Pathology, Oral Radiology, 114, S69-S73.
KRUTH, J. P., LEU, M. C. & NAKAGAWA, T. (1998) Progress in Additive Manufacturing and Rapid Prototyping. CIRP Annals - Manufacturing Technology, 47, 525-540.
KUBYSHKINA, G. (2014) Differential Scanning Calorimetry theoretical background (http://www.fs.uni-lj.si/mma_bin.php?id=2010111100484104 access date Feb 2014).
LAM, C. X. F., MO, X. M., TEOH, S. H. & HUTMACHER, D. W. (2002) Scaffold development using 3D printing with a starch-based polymer. Materials Science and Engineering: C, 20, 49-56.
LANDES, C. A., BALLON, A. & ROTH, C. (2006) In-patient versus in vitro degradation of P(L/DL)LA and PLGA. Journal of Biomedical Materials Research - Part B Applied Biomaterials, 76, 403-411.
LAURENCIN, C., KHAN, Y. & EL-AMIN, S. F. (2006) Bone graft substitutes. Expert Rev Med Devices, 3, 49-57.
LEE, K. (2012) Global trends in maxillofacial fractures. Craniomaxillofac Trauma Reconstr., 5, 22.
LEUNG, L., CHAN, C., BAEK, S. & NAGUIB, H. (2008) Comparison of morphology and mechanical properties of PLGA bioscaffolds. Biomedical Materials, 3.
LEVY, G. N., SCHINDEL, R. & KRUTH, J. P. (2003) RAPID MANUFACTURING AND RAPID TOOLING WITH LAYER MANUFACTURING (LM) TECHNOLOGIES, STATE OF THE ART AND FUTURE PERSPECTIVES. CIRP Annals - Manufacturing Technology, 52, 589-609.
LEWANDROWSKI, K.-U. (2002) Tissue Engineering and Biodegradable Equivalents : Scientific and Clinical Applications. IN LEWANDROWSKI, K.-U., WISE, D. L., YASZEMSKI, M. J., GRESSER, J. D., TRANTOLO, D. J. & E., A. (Eds.) New York, NY, USA, Marcel Dekker Incorporated.
LIN, A. C. & LIANG, S.-R. (2002) Rapid prototyping through scanned point data. International Journal of Production Research, 40, 293-310.
LINCKS, J., BOYAN, B. D. & BLANCHARD, C. R., ET AL. (1998) Response of MG63 osteoblastlike cells to titanium and titanium alloy is dependent on surface roughness and composition. Biomaterials, 19, pp 2219-2232.
LIU, F., JIA, D., WU, X., HOU, T., WU, C., YOU, C. & WANG, Y. (2002) [Effect of moulding and extruding conditions on mechanical properties of poly(D,L-lactide) and MDI chain-extending poly(D,L-lactide)/hydroxyapatite composite]. Sheng Wu Yi Xue Gong Cheng Xue Za Zhi, 19, 624-7.
LIU, X. & MA, P. X. (2004) Polymeric Scaffolds for Bone Tissue Engineering. Annals of Biomedical Engineering, 32, 477-486.
LIU, Y., LIAO, W., JIN, G., YANG, Q. & PENG, W. (2014) Additive manufacturing and digital design assisted precise apicoectomy: a case study. Rapid Prototyping Journal, 20, 33-40.
LIULAN, L., QINGXI, H., XIANXU, H. & GAOCHUN, X. (2007) Design and Fabrication of Bone Tissue Engineering Scaffolds via Rapid Prototyping and CAD. Journal of Rare Earths, 25, Supplement 2, 379-383.
LLOYD, A. W. (2002) Interfacial bioengineering to enhance surface biocompatibility. Med .Device Technol., 13, 18-21.
LORENSEN, W. E. & CLINE, H. E. (1987) Marching cubes: A high resolution 3D surface construction algorithm. SIGGRAPH Comput. Graph., 21, 163-169.
LOVALD, S., BAACK, B., GABALL, C., OLSON, G. & HOARD, A. (2010) Biomechanical Optimization of Bone Plates Used in Rigid Fixation of Mandibular Symphysis
193
Fractures. Journal of oral and maxillofacial surgery : official journal of the American Association of Oral and Maxillofacial Surgeons, 68, 1833-1841.
LOZO, B., STANIC, M., JAMNICKI, S., POLJACEK, S. M. & MUCK, T. (2008) Three-Dimensional Ink Jet Prints-Impact of Infiltrants. Journal of Imaging Science and Technology, 52.
LU, L., GARCIA, C. A. & MIKOS, A. G. (1999) In vitro degradation of thin poly(DL-lactic-co-glycolic acid) films. Journal of Biomedical Materials Research, 46, 236-244.
MAJI, P., BANERJEE, P. & SINHA, A. (2008) Application of rapid prototyping and rapid tooling for development of patient-specific craniofacial implant: an investigative study. The International Journal of Advanced Manufacturing Technology, 36, 510-515.
MAKADIA, H. K. & SIEGEL , S. J. (2011) Poly Lactic-co-Glycolic Acid (PLGA) as Biodegradable Controlled Drug Delivery Carrier. Polymers, 3, pp 1377-1397.
MALEKSAEEDI, S., ENG, H., WIRIA, F. E., HA, T. M. H. & HE, Z. (2014) Property enhancement of 3D-printed alumina ceramics using vacuum infiltration. Journal of Materials Processing Technology, 214, 1301-1306.
MANSOUR, S. & HAGUE, R. (2003) Impact of rapid manufacturing on design for manufacture for injection moulding. Proceedings of the Institution of Mechanical Engineers, Part B: Journal of Engineering Manufacture, 217, 453-461.
MARCHELLI, G., PRABHAKAR, R., STORTI, D. & GANTER, M. (2011) The guide to glass 3D printing: developments, methods, diagnostics and results. Rapid Prototyping Journal, 17, 187-194.
MARINUCCI, L., BALLONI, S. & BECCHETTI, E., ET AL. (2006) Effect of titanium surface roughness on human osteoblast proliferation and gene expression in vitro. Int J Oral Maxillofac Implants., 21, pp 719-725.
MARTOLA, M., LINDQVIST, C., HÄNNINEN, H. & AL-SUKHUN, J. (2007) Fracture of titanium plates used for mandibular reconstruction following ablative tumor surgery. Journal of Biomedical Materials Research Part B: Applied Biomaterials, 80B, 345-352.
MASIA, S., CALVERT, P., RHINE, W. & BOWEN, H. K. (1989) Effect of oxides on binder burnout during ceramics processing. Journal of Materials Science, 24, 1907-1912.
MATTHEW, H. W. T. (2002) Polymers for tissue engineering scaffold. IN DUMITRIU, S. (Ed.) Polymeric Biomaterials. New York, Marcel Dekker.
MAVILI, M. E., CANTER, H. I., SAGLAM-AYDINATAY, B., KAMACI, S. & KOCADERELI, I. (2007) Use of three-dimensional medical modeling methods for precise planning of orthognathic surgery. Journal of Craniofacial Surgery, 18, 740-747.
MCDERMOTT, N. E., CHUANG, S. K., WOO, V. V. & DODSON, T. B. (2004) Complications of dental implants: identification, frequency, and associated risk factors. The Journal of Prosthetic Dentistry, 92, 78.
MCDONALD, P. F., LYONS, J. G., GEEVER, L. M. & HIGGINBOTHAM, C. L. (2009) In vitro degradation and drug release from polymer blends based on poly(dl-lactide), poly(l-lactide-glycolide) and poly(ε-caprolactone). Journal of Materials Science, 45, 1284-1292.
MECHANICALENGINEERINGBLOG (2012) What is rapid prototyping. MELCHELS, F. P. W., FEIJEN, J. & GRIJPMA, D. W. (2010) A review on stereolithography
and its applications in biomedical engineering. Biomaterials, 31, 6121-6130. MELGOZA, E. L., VALLICROSA, G., SERENA, L., CIURANA, J. & RODRÃGUEZ, C. A.
(2014) Rapid tooling using 3D printing system for manufacturing of customized tracheal stent. Rapid Prototyping Journal, 20 Iss 1, pp 2-12.
MELLOR, S., HAO, L. & ZHANG, D. (2014) Additive manufacturing: A framework for implementation. International Journal of Production Economics, 149, 194-201.
194

MIAO, X., TAN, L. P., TAN, L. S. & HUANG, X. (2007) Porous calcium phosphate ceramics modified with PLGA-bioactive glass. Materials Science and Engineering: C, 27, 274-279.
MIDDLETON, J. C. & TIPTON, A. J. (2000) Synthetic biodegradable polymers as orthopedic devices. Biomaterials, 21 pp. 2335-2346.
MOONEY, D. J., BALDWIN, D. F., SUH, N. P., VACANTI, J. P. & LANGER, R. (1996) Novel approach to fabricate porous sponges of poly(d,l-lactic-co-glycolic acid) without the use of organic solvents. Biomaterials, 17, 1417-1422.
MORITA, S., FURUYA, K., ISHIHARA, K. & NAKABAYASHI, N. (1998) Performance of adhesive bone cement containing hydroxyapatite particles. Biomaterials, 19, 1601-1606.
NAGAHANUMAIAH, SUBBURAJ, K. & RAVI, B. (2008) Computer aided rapid tooling process selection and manufacturability evaluation for injection mold development. Computers in Industry, 59, 262-276.
NAIR, L. S. & LAURENCIN, C. T. (2007) Biodegradable polymers as biomaterials. Progress in Polymer Science, 32, 762-798.
NAMII, O. (2013) Additive Fabrication for MetalFormers (http://namii.org/wp-content/uploads/2013/07/Additive-Fabrication-for-MetalFormers-Webinar-2013-06-25-rev-c.pdf access on 09/2013).
NANOSCIENCE (2014) SEM technology overview(http://www.nanoscience.com/ products/sem/technology-overview/ access date: Jan 2014).
NATU, S. S., PRADHAN, H., GUPTA, H., ALAM, S., GUPTA, S., PRADHAN, R., MOHAMMAD, S., KOHLI, M., SINHA, V. P., SHANKAR, R. & AGARWAL, A. (2012) An Epidemiological Study on Pattern and Incidence of Mandibular Fractures. Plastic Surgery International, 2012, 7.
NAVARRO, M., MICHIARDI, A., CASTAñO, O. & PLANELL, J. A. (2008) Biomaterials in orthopaedics. Journal of The Royal Society Interface, 5, 1137-1158.
NAVARRO, M., VALLE, S. D., MARTÍNEZ, S., ZEPPETELLI, S., AMBROSIO, L., PLANELL, J. A. & GINEBRA, M. P. (2004) New macroporous calcium phosphate glass ceramic for guided bone regeneration. Biomaterials, 25, 4233-4241.
NIELSEN, L. F. (1982) Elastic Properties of Two-Phase Materials. Mat. Sci. Eng., 52, 39-62. NIELSEN, L. F. (1984) Elasticity and damping of porous and impregnated materials. Journ.
Am. Ceramic Soc., 93-98. NONAKA, H. H. (1997) Plant carbohydrate-derived products as fat replacers and calorie
reducers. Cereal Food World, Vol. 42, 376-8. NOORANI, R. (2006) Rapid Prototyping: Principles and Applications, New York, John
Wiley and Sons. NORDIN, R., RAHMAN, N. A., RASHDI, M. F., YUSOFF, A., RAHMAN, R. A.,
SULONG, S., NUR, A. M., RAZAK, N. A., JABAR, M. N. A., IBRAHIM, M. I., MOHAMED, N., AHMAD, S. H. R. & RAMLI, R. (2014) Oral and maxillofacial trauma caused by road traffic accident in two university hospitals in Malaysia: A cross-sectional study. Journal of Oral and Maxillofacial Surgery, Medicine, and Pathology.
NOVAKOVA-MARCINCINOVA, L. & KURIC, I. ( 2012) Basic and Advanced Materials for Fused Deposition Modeling Rapid Prototyping Technology Manuf. and Ind. Eng 11(1), pp 22-27.
NOVITSKAYA, E. E., CHEN, P.-Y., HAMED, E., LI, J., LUBARDA, V. A., JASIUK, I. & MCKITTRICK, J. (2011) Recent advances on the measurement and calculation of the elastic moduli of cortical and trabecular bone: a review. Journal Of Theoretical And Applied Mechanics, 38, 209-297.
195

NYEMBWE, K. D., DE BEER, D., VAN DER WALT, J. G. & BHERO, S. (2013) A case study of tool manufacturing by metal casting in rapid prototyping sand moulds. Interim : Interdisciplinary Journal, 12, 210-218.
OBIELODAN, J. O., CEYLAN, A., MURR, L. E. & STUCKER, B. E. (2010) Multi-material bonding in ultrasonic consolidation. Rapid Prototyping Journal, Vol. 16 Iss: 3, pp.180 - 188.
OBJECT (2014) http://www.stratasys.com/ 3d-printers/design-series/ precision/objet500-connex3.
OBJET (2008) Polyjet Technology. OGILVIE, C., CRAWFORD, E., HOSALKAR, H., KING, J. & LACKMAN, R. (2009)
Long-term Results for Limb Salvage with Osteoarticular Allograft Reconstruction. Clinical Orthopaedics and Related Research®, 467, 2685-2690.
ONO, K., YAMAMURO, T., NAKAMURA, T., KAKUTANI, Y., KITSUGI, T., HYAKUNA, K., KOKUBO, T., OKA, M. & KOTOURA, Y. (1988) Apatite-wollastonite containing glass ceramic-fibrin mixture as a bone defect filler. Journal of Biomedical Materials Research, Vol. 22, pp: 869-885.
OPTOMEC (2013) LENS Technology (http://www.optomec.com/3d-printed-metals/lens-technology/ access date : July 2014).
PARK, J. H., JUNG, J. W., KANG, H.-W. & DONG-WOO, C. (2014) Indirect three-dimensional printing of synthetic polymer scaffold based on thermal molding process. Biofabrication, 6, 025003.
PARTHASARATHY, J., STARLY, B. & RAMAN, S. (2009) Computer Aided Biomodeling and Analysis of Patient Specific Porous Titanium Mandibular Implants. Journal of Medical Devices-Transactions of the Asme, 3.
PARTHASARATHY, J., STARLY, B. & RAMAN, S. (2011) A design for the additive manufacture of functionally graded porous structures with tailored mechanical properties for biomedical applications. Journal of Manufacturing Processes, 13, 160-170.
PASSERINI, N. & CRAIG, D. Q. M. (2001) An investigation into the effects of residual water on the glass transition temperature of polylactide microspheres using modulated temperature DSC. Journal of Controlled Release, 73, 111-115.
PATTNAIK, S., JHA, P. K. & KARUNAKAR, D. B. (2014) A review of rapid prototyping integrated investment casting processes. Proceedings of the Institution of Mechanical Engineers, Part L: Journal of Materials Design and Applications, 228, 249-277.
PELTONIEMI, H., ASHAMMAKHI, N., KONTIO, R., WARIS, T., SALO, A., LINDQVIST, C., GRÄTZ, K. & SUURONEN, R. (2002) The use of bioabsorbable osteofixation devices in craniomaxillofacial surgery. Oral Surgery, Oral Medicine, Oral Pathology, Oral Radiology, and Endodontology, 94, 5-14.
PENA, I., ROBERTS, L. E., GUY, W. M. & ZEVALLOS, J. P. (2014) The Cost and Inpatient Burden of Treating Mandible Fractures: A Nationwide Inpatient Sample Database Analysis. Otolaryngology -- Head and Neck Surgery, 151, 591-598.
PHAM, D. & DIMOV, S. (2003) Rapid prototyping and rapid tooling—the key enablers for rapid manufacturing. Proceedings of the Institution of Mechanical Engineers, Part C: Journal of Mechanical Engineering Science, 217, 1-23.
PHAM, D. T. & DIMOV, S. S. (2001) Rapid manufacturing: The technologies and applications of rapid prototyping and rapid tooling.
PHAM, D. T. & GAULT, R. S. (1998) A comparison of rapid prototyping technologies. International Journal of Machine Tools and Manufacture, 38, 1257-1287.
PILIPOVIC, A., RAOS, P. & SERCER, M. (2009) Experimental analysis of properties of materials for rapid prototyping. International Journal of Advanced Manufacturing Technology, 40, 105-115.
196

PODPORSKA, J., BŁAŻEWICZ, M., TRYBALSKA, B. & ZYCH, Ł. (2008) A novel ceramic material with medical application. Processing and Application of Ceramics, 2 [1], pp 19-22.
PONCHE, R., HASCOET, J. Y., KERBRAT, O. & MOGNOL, P. (2012) A new global approach to design for additive manufacturing. Virtual and Physical Prototyping, 7, 93-105.
PORTER, J. R., HENSON, A. & POPAT, K. C. (2009) Biodegradable poly([var epsilon]-caprolactone) nanowires for bone tissue engineering applications. Biomaterials, 30, 780-788.
POUKENS, J., LAEVEN, P., BEERENS, M., KOPER, D., LETHAUS, B., KESSLER, P., VANDER SLOTEN, J. & LAMBRICHTS, I. (2010) Custom surgical implants using additive manufacturing. Digital Dental News, 4(1). p. 72-75. Comcord -Duesseldorf.
QUAIL, F. J., SCANLON, T. & STRICKLAND, M. (2010) Development of a regenerative pump impeller using rapid manufacturing techniques. Rapid Prototyping Journal, 16, 337-344.
QUICKPARTS (2013) SLS Materials properties. Low-VolumePrototypes. RAHAMAN, M. N. (2008) Sintering of Ceramics, Boca Raton, CRC Press. RAHMAN, R., HUSSAINI, H., RAHMAN, N., RAHMAN, S. A., NOR, G., AI IDRUS, S. &
RAMLI, R. (2007) Facial Fractures in Kajang Hospital, Malaysia: A 5-Year Review. European Journal of Trauma and Emergency Surgery, 33, 90-95.
RAHMATI, S., AKBARI, J. & BARATI, E. (2007) Dimensional accuracy analysis of wax patterns created by RTV silicone rubber molding using the Taguchi approach. Rapid Prototyping Journal, 13, 115-122.
RAINER, A., GIANNITELLI, S., ACCOTO, D., DE PORCELLINIS, S., GUGLIELMELLI, E. & TROMBETTA, M. (2012) Load-Adaptive Scaffold Architecturing: A Bioinspired Approach to the Design of Porous Additively Manufactured Scaffolds with Optimized Mechanical Properties. Annals of Biomedical Engineering, 40, 966-975.
RAMIN, E. & HARRIS, R. A. (2009) Advanced computer-aided design for bone tissue-engineering scaffolds. Proceedings of the Institution of Mechanical Engineers, Part H: Journal of Engineering in Medicine, 223, 289-301.
RAMOS, A. M. D. A. M. & SIMOES, J. A. (2009) CAD-CAM-RTV- lost-wax casting technology for medical implants. Rapid Prototyping Journal, 15, pp. 211-215.
RASHID, H. (2014) The effect of surface roughness on ceramics used in dentistry: A review of literature. European Journal of Dentistry, 8, 571-579.
RAWLINGS, R. D., WU, J. P. & BOCCACCINI, A. R. (2006) Glass-ceramics: Their production from waste-A Review. Journal of Materials Science, 41, 733-761.
RICHARD, B., DOMINIC, E., PETER, E., ALAN, B. & ADRIAN, S. (2009) Rapid manufacture of custom-fitting surgical guides. Rapid Prototyping Journal, 15, 346-354.
RIENER, R. & HARDERS, M. (Eds.) (2012) Virtual Reality in Medicine: Medical Model Generation, London, Springer-Verlag.
ROEDER, R. K., CONVERSE, G. L., KANE, R. J. & YUE, W. (2008) Hydroxyapatite-reinforced polymer biocomposites for synthetic bone substitutes. JOM, 60, 38-45.
ROTHEN-WEINHOLD, A., BESSEGHIR, K., VUARIDEL, E., SUBLET, E., OUDRY, N., KUBEL, F. & GURNY, R. (1999) Injection-molding versus extrusion as manufacturing technique for the preparation of biodegradable implants. European Journal of Pharmaceutics and Biopharmaceutics, 48, 113-121.
RUFFO, M., TUCK, C. & HAGUE, R. (2006) Cost estimation for rapid manufacturing - laser sintering production for low to medium volumes. Proceedings of the Institution of Mechanical Engineers, Part B: Journal of Engineering Manufacture, 220, 1417-1427.
197

SABIR, M., XU, X. & LI, L. (2009) A review on biodegradable polymeric materials for bone tissue engineering applications. Journal of Materials Science, 44, 5713-5724.
SAITO, E., KANG, H., TABOAS, J., DIGGS, A., FLANAGAN, C. & HOLLISTER, S. (2010) Experimental and computational characterization of designed and fabricated 50:50 PLGA porous scaffolds for human trabecular bone applications. Journal of Materials Science: Materials in Medicine, 21, 2371-2383.
SAKR, K., FARAG, I. A. & ZEITOUN, I. M. (2006) Review of 509 mandibular fractures treated at the University Hospital, Alexandria, Egypt. British Journal of Oral and Maxillofacial Surgery, 44, 107-111.
SALMI, M., TUOMI, J., PALOHEIMO, K.-S., BJORKSTRAND, R., PALOHEIMO, M., SALO, J., KONTIO, R., MESIMAKI, K. & MAKITIE, A. A. (2012) Patient-specific reconstruction with 3D modeling and DMLS additive manufacturing. Rapid Prototyping Journal, 18, 209-214.
SANGHERA, B., NAIQUE, S., PAPAHARILAOU, Y.,AMIS, A. (2001) Preliminary study of rapid prototype medical models. Rapid Prototyping Journal, Vol. 7, pp.275 - 284.
SCHLICKEWEI, W. & SCHLICKEWEI, C. (2007) The Use of Bone Substitutes in the Treatment of Bone Defects – the Clinical View and History. Macromolecular Symposia, 253, 10-23.
SCHMIDT, B. L., KEARNS, G., GORDON, N. & KABAN, L. B. (2000) A financial analysis of maxillomandibular fixation versus rigid internal fixation for treatment of mandibular fractures. Journal of Oral and Maxillofacial Surgery, 58, 1206-1210.
SCHMITZ, J. P. (2005) Bone Substitutes in Reconstructive Implant Surgery. Journal of Oral and Maxillofacial Surgery, 63, 117-118.
SD3DPRINTING (2013) FFF vs. SLA vs. SLS: 3D Printing. Rapid Prototyping 3D Printing. SEITZ, H., DEISINGER, U., LEUKERS, B., DETSCH, R. & ZIEGLER, G. (2009) Different
Calcium Phosphate Granules for 3-D Printing of Bone Tissue Engineering Scaffolds. Advanced Engineering Materials, 11, B41-B46.
SEITZ, H., RIEDER, W., IRSEN, S., LEUKERS, B. & TILLE, C. (2005) Three-dimensional printing of porous ceramic scaffolds for bone tissue engineering. Journal of Biomedical Materials Research Part B: Applied Biomaterials, 74B, 782-788.
SÉQUIN, C. H. (2005) CAD tools for aesthetic engineering. Computer-Aided Design, 37, 737-750.
SHAHZAD, K., DECKERS, J., KRUTH, J.-P. & VLEUGELS, J. (2013) Additive manufacturing of alumina parts by indirect selective laser sintering and post processing. Journal of Materials Processing Technology, 213, 1484-1494.
SHAHZAD, K., DECKERS, J., ZHANG, Z., KRUTH, J.-P. & VLEUGELS, J. (2014) Additive manufacturing of zirconia parts by indirect selective laser sintering. Journal of the European Ceramic Society, 34, 81-89.
SHETTY, V., ATCHISON, K., LEATHERS, R., BLACK, E., ZIGLER, C. & BELIN, T. R. (2008) Do the Benefits of Rigid Internal Fixation of Mandible Fractures Justify the Added Costs? Results From a Randomized Controlled Trial. Journal of Oral and Maxillofacial Surgery, 66, 2203-2212.
SHIBAHARA, T., NOMA, H., FURUYA, Y. & TAKAKI, R. (2002) Fracture of mandibular reconstruction plates used after tumor resection. Journal of Oral and Maxillofacial Surgery, 60, 182-185.
SHINOHARA, N., OKUMIYA, M., HOTTA, T., NAKAHIRA, K., NAITO, M. & UEMATSU, K. (1999) Formation mechanisms of processing defects and their relevance to the strength in alumina ceramics made by powder compaction process. Journal of Materials Science, 34, 4271-4277.
SILBER, J. S., ANDERSON, D. G., DAFFNER, S. D., BRISLIN, B. T., LELAND, J. M., HILIBRAND, A. S., VACCARO, A. R. & ALBERT, T. J. (2003) Donor Site
198

Morbidity After Anterior Iliac Crest Bone Harvest for Single-Level Anterior Cervical Discectomy and Fusion. Spine, 28, 134-139.
SIMON, E. N. M., MERKX, M. A. W., KALYANYAMA, B. M., SHUBI, F. M. & STOELINGA, P. J. W. (2013) Immediate reconstruction of the mandible after resection for aggressive odontogenic tumours: a cohort study. International Journal of Oral and Maxillofacial Surgery, 42, 106-112.
SIMSKE, S. J., AYERS, R. A. & BATEMANT, A. (1997) Porous materials for bone engineering. Materials Science Forum, 250, pp. 151-182.
SMITH, L. (1963) CERAMIC-PLASTIC MATERIAL AS A BONE SUBSTITUTE. Archives of surgery (Chicago, Ill. : 1960), 87, 653-661.
ST JOHN, T. A., VACCARO, A. R., SAH, A. P., SCHAEFER, M., BERTA, S. C., ALBERT, T., AND HILIBRAND, A. (2003) Physical and Monetary Costs Associated With Autogenous Bone Graft Harvesting. Am. J. Orthop., 32, 18–23.
STRATASYS (2014) compare-fdm-materials. materials fdm. STRONG, D. M., FRIEDLAENDER, G.E., TOMFORD, W.W., SPRINGFIELD, D.S.,
SHIVES, T.C., BURCHARDT, H., ENNEKING, W.F., MANKIN, H.J. (1996) Immunologic responses in human recipients of osseous and osteochondral allografts: Fundamental and clinical immunology of the skeletal system. Clin Orthop Relat Res., 326, 107-114.
SUN, Y., LÜ, P. & WANG, Y. (2009) Study on CAD&RP for removable complete denture. Computer Methods and Programs in Biomedicine, 93, 266-272.
SUWANPRATEEB, J., SANNGAM, R. & PANYATHANMAPORN, T. (2010) Influence of raw powder preparation routes on properties of hydroxyapatite fabricated by 3D printing technique. Materials Science and Engineering: C, 30, 610-617.
SWAPP, S. (2007) Scanning Electron Microscopy(SEM) (http://serc.carleton.edu/research education/geochemsheets/techniques/SEM.html access date: June 2013). University of Wyoming.
SZUCS, T. D. & BRABAZON, D. (2009) Effect of saturation and post processing on 3D printed calcium phosphate scaffolds. IN PRADO, M. & ZAVAGLIA, C. (Eds.) Bioceramics 21.
TAI, H. Y., UPTON, C. E., WHITE, L. J., PINI, R., STORTI, G., MAZZOTTI, M., SHAKESHEFF, K. M. & HOWDLE, S. M. (2010) Studies on the interactions of CO2 with biodegradable poly(DL-lactic acid) and poly(lactic acid-co-glycolic acid) copolymers using high pressure ATR-IR and high pressure rheology. Polymer, 51, 1425-1431.
TAN, K. H., CHUA, C. K., LEONG, K. F., NAING, M. W. & CHEAH, C. M. (2005) Fabrication and characterization of three-dimensional polyether–ether–ketone)/–hydroxyapatite biocomposite scaffolds using laser sintering. Proc. IMechE. Vol. 219 Part H: J. Engineering in Medicine, pp. 183-194.
TAN, L., YU, X., WAN, P. & YANG, K. (2013) Biodegradable Materials for Bone Repairs: A Review. Journal of Materials Science & Technology, 29, 503-513.
TANCRED, D. C., MCCORMACK, B. A. O. & CARR, A. J. (1998) A synthetic bone implant macroscopically identical to cancellous bone. Biomaterials, 19, 2303-2311.
TESAVIBUL, P., FELZMANN, R., GRUBER, S., LISKA, R., THOMPSON, I., BOCCACCINI, A. R. & STAMPFL, J. (2012) Processing of 45S5 Bioglass® by lithography-based additive manufacturing. Materials Letters, 74, 81-84.
THOMSON, R. C., YASZEMSKI, M. J., POWERS, J. M. & MIKOS, A. G. (1996) Fabrication of biodegradable polymer scaffolds to engineer trabecular bone. Journal of Biomaterials Science, Polymer Edition, 7, 23-38.
THOMSON, R. C., YASZEMSKI, M. J., POWERS, J. M. & MIKOS, A. G. (1998) Hydroxyapatite fiber reinforced poly([alpha]-hydroxy ester) foams for bone regeneration. Biomaterials, 19, 1935-1943.
199

TOMECKOVA, V. & HALLORAN, J. (2012) Cure depth for photopolymerization of ceramic suspensions. Journal of the European Ceramic Society, Vol.30, , pp. 3023-3033.
TORMALA, P. (1992) Biodegradable self-reinforced composite materials: Manufacturing structure and mechanical properties. Clin Mater, 10, pp. 29-34.
TRUSCOTT, M., JANSE VAN VUUREN, M., BOOYSEN, G. & DE BEER, D. (2008) Customised patient implants : future lifeline of the medical industry. Interim : Interdisciplinary Journal, 7, 100-108.
TURNER, D. (2007) Product Development, The Lifeline of Your Company. TCT Magazine. UMICH.EDU (2005) Bone Remodelling (http://www.ns.umich.edu/Releases/2005
/Feb05/img/bone.jpg access date: 10-10-13). UTELA, B. R., STORTI, D., ANDERSON, R. L. & GANTER, M. Development Process for
Custom Three-Dimensional Printing (3DP) Material Systems. Journal of Manufacturing Science and Engineering, 132, 011008-011008.
VAEZI, M., CHIANRABUTRA, S., MELLOR, B. & YANG, S. (2013) Multiple material additive manufacturing Part 1: a review. Virtual and Physical Prototyping, 8, 19-50.
VAEZI, M. & CHUA, C. K. (2011) Effects of layer thickness and binder saturation level parameters on 3D printing process. International Journal of Advanced Manufacturing Technology, 53, 275-284.
VAEZI, M., SAFAEIAN, D. & CHUA, C. K. (2011) Gas turbine blade manufacturing by use of epoxy resin tooling and silicone rubber molding techniques. Rapid Prototyping Journal, 17, 107-115.
VAN DE VELDE, K. & KIEKENS, P. (2002) Biopolymers: overview of several properties and consequences on their applications Polymer Testing, 21, 433-442.
VG (2012) Laser sintering LS. Rapid Prototyping - RP. VISAVARUNGROJ, N. & REMON, J. P. (1992) Evaluation of maltodextrin as binding
agent. Drug Development and Industrial Pharmacy, 18, 1691-1700. VITALE-BROVARONE, C., VERNÉ, E., ROBIGLIO, L., APPENDINO, P., BASSI, F.,
MARTINASSO, G., MUZIO, G. & CANUTO, R. (2007) Development of glass-ceramic scaffolds for bone tissue engineering: Characterisation, proliferation of human osteoblasts and nodule formation. Acta Biomaterialia, 3, 199-208.
VOZZI, G., FLAIM, C., AHLUWALIA, A. & BHATIA, S. (2003) Fabrication of PLGA scaffolds using soft lithography and microsyringe deposition. Biomaterials, 24, 2533-2540.
WANG, P., HU, J. & MA, P. X. (2009) The engineering of patient-specific, anatomically shaped, digits. Biomaterials, 30, 2735-2740.
WARNKE, P. H., SEITZ, H., WARNKE, F., BECKER, S. T., SIVANANTHAN, S., SHERRY, E., LIU, Q., WILTFANG, J. & DOUGLAS, T. (2010) Ceramic scaffolds produced by computer-assisted 3D printing and sintering: characterization and biocompatibility investigations. Journal of Biomedical Materials Research Part B-Applied Biomaterials, 93B, 212-217.
WEBB, P. A. (2000) A review of rapid prototyping (RP) techniques in the medical and biomedical sector. Journal of Medical Engineering & Technology, 24, 149-153.
WEI, S. (2009) BioCAD in tissue science and engineering. Computer-Aided Design and Computer Graphics, 2009. CAD/Graphics '09. 11th IEEE International Conference on.
WHITE, G. & LYNSKEY, D. (2013) Economic Analysis of Additive Manufacturing for Final Products: An Industrial Approach. Pittsburgh, University of Pittsburgh, Swanson School of Engineering.
WHITEHOUSE, D. J. (2002) Handbook of Surface and Nanometrology, Boca raton, Florida, CRC Press.
200

WILLIAMS, R. J., BIBB, R. & EGGBEER, D. (2008) CAD/CAM-fabricated removable partial-denture alloy frameworks. Pract Proced Aesthet Dent, 20, 349-51.
WINDER, J., COOKE, R.S., GRAY, J., FANNIN, T., FEGAN, T. (1999) Medical rapid prototyping and 3D CT in the manufacture of custom made cranial titanium plates. J Med Eng Technol. 1999 Jan-Feb;23(1):26-8.
WOHLERS, T. (2010) Wohlers Report 2010-3D Printing and Additive Manufacturing State of the Industry Annual Worldwide Progress Report Wohlers Associates.
WOHLERS, T. T. (2013) Wohlers Report 2013: Additive Manufacturing and 3D Printing State of the Industry : Annual Worldwide Progress Report, Wohlers Associates.
WONG, M., EULENBERGER, J., SCHENK, R. & HUNZIKER, E. (1995) Effect of surface topology on the osseointegration of implant materials in trabecular bone. Journal of Biomedical Materials Research, 29, 1567-1575.
WU, Y., DU, J., CHOY, K.-L. & HENCH, L. L. (2007) Laser densification of alumina powder beds generated using aerosol assisted spray deposition. Journal of the European Ceramic Society, 27, 4727-4735.
XIAO, K., DALGARNO, K. W., WOOD, D. J., GOODRIDGE, R. D. & OHTSUKI, C. (2008) Indirect selective laser sintering of apatite–wollostonite glass–ceramic. Proceedings of the Institution of Mechanical Engineers, Part H: Journal of Engineering in Medicine, 222, 1107-1114.
XIAO, K., DYSON, J. A., DALGARNO, K. W., GENEVER, P., WOOD, D. J., GOODRIDGE, R. D. & OHTSUKI, C. (2007) Manufacture and characterisation of bioceramic tissue engineering scaffolds produced by selective laser sintering. ASME International Conference on Manufacturing Science and Engineering. Atlanta, GA, Amer Soc Mechanical Engineers.
YAMAMOTO, N. & SAKAI, K. (2005) Electron beam melting method for metallic material. Google Patents.
YAMAMURO, T. (2013) A/W Glass-Ceramic: Clinical Applications. IN HENCH, L. L. (Ed.) An Introduction to Bioceramics, Second Edition. London, Imperial College Press.
YAN, Y., LI, S., ZHANG, R., LIN, F., WU, R., LU, Q., XIONG, Z. & WANG, X. (2009) Rapid Prototyping and Manufacturing Technology: Principle, Representative Technics, Applications, and Development Trends. Tsinghua Science & Technology, 14, 1-12.
YARLAGADDA, P. K. D. V. & HOCK, T. S. (2003) Statistical analysis on accuracy of wax patterns used in investment casting process. Journal of Materials Processing Technology, 138, 75-81.
YASA, E., KRUTH, J. P. & DECKERS, J. (2011) Manufacturing by combining Selective Laser Melting and Selective Laser Erosion/laser re-melting. CIRP Annals - Manufacturing Technology, 60, 263-266.
YASZEMSKI, M. J., PAYNE, R. G., HAYES, W. C., LANGER, R. & MIKOS, A. C. (1996) Evolution of bone transplantation: molecular, cellular, and tissue
strategies to engineer human bone. Biomaterials, 17, 175-185. YOU, Y., MIN, B. M., LEE, S. J., LEE, T. S. & PARK, W. H. (2005) In vitro degradation
behavior of electrospun polyglycolide, polylactide, and poly(lactide-co-glycolide). Journal of Applied Polymer Science, 95, 193-200.
YOUNG, P. G., BERESFORD-WEST, T.B.H., COWARD, S.R.L., NOTARBERARDINO, B., WALKER,B., ABDUL-AZIZ, A. (2008) An efficient approach to converting three-dimensional image data into highly accurate computational models. Phil. Trans. R. Soc. A, 366 3155-3173.
ZANOTTO, E. D. (2010) A bright future for glass-ceramics. Ceramics Org. Bulletin. ZHANG, H. (2004) Risk of complication associated with dental implants and implant
prostheses is variable. Journal of Evidence Based Dental Practice, 4, 233-234.
201

ZHAO, J., CAO, W., GE, C., TAN, Y., ZHANG, Y. & FEI, Q. (2009) Research On Laser Engineering Net Shaping of thick-wall nickel based alloy parts. Rapid Prototyping Journal, Vol. 15 (1), pp. 24-28.
ZWINGENBERGER, S., NICH,C., VALLADARES,R.D., YAO,Z., STIEHLER,M., GOODMAN,S.B. (2012) Recommendations and Considerations for the Use of Biologics in Orthopedic Surgery. BioDrugs, 26, 245-256.
202
Appendix A
Appendix A – Academic contribution.
List of publications:
KHAN, S.F., GERMAN, M., DALGARNO, K.W. Indirect Additive Manufacturing Process
of Poly-Lactide-co-Glycolide. Applied Mechanics and Materials, Trans Tech Publications
Inc, USA (accepted)
ALHARBI, N., KHAN S.F., BRETCANU, O., AND DALGARNO, K.W. Processing of
Apatite-Wollastonite (AW) Glass-Ceramic for Three Dimensional Printing (3DP). Applied
Mechanics and Materials, USA, Trans Tech Publications Inc., (accepted)
KHAN, S.F., GERMAN, M., AND DALGARNO, K.W. (2012). Using additive manufactured
tooling in the fabrication of poly (L-Lactide-co-Glycolide) implants. IN BARTOLO, P. J. E.
A. (Ed.) Virtual and Rapid Prototyping London, Taylor & Francis Group.
KHAN, S. F., DALGARNO, K. W. (2010) Design of customised bioceramic medical
implants by layered manufacturing. IN BARTOLO, P. J. E. A. (Ed.) Innovative Developments
in Design and Manufacturing. London, Taylor & Francis Group.
KHAN, S. F., DALGARNO, K. W. (2009) Customised bioceramic medical implants by
layered manufacturing. Proceedings of the Tenth National Conference on Rapid Design,
Prototyping and Manufacturing. IN RENNIE, A., BOCKING, C. & JACOBSON, D. (Eds.).
High Wycombe: MJA Print.
List of Conference and Poster presentation.
ALHARBI, N., KHAN S.F., BRETCANU, O., AND DALGARNO, K.W. (2014) Processing
of Apatite-Wollastonite (AW) Glass-Ceramic for Three Dimensional Printing (3DP). 3rd
International Conference on Advanced Material Engineering & Technology, Ho Chi Minh
City, Vietnam, 2014 (accepted)
KHAN, S.F., GERMAN, M., AND DALGARNO, K.W. Indirect Additive Manufacturing
Process of Poly-Lactide-co-Glycolide. 3rd International Conference on Advanced Material
Engineering & Technology, Ho Chi Minh City, Vietnam, 2014 (accepted)
203

Appendix A
ALHARBI, N., KHAN, S.F., DALGARNO, K.W, Indirect Biofabrication of Apatite-
wollastonite (A-W) implantable devices by three dimensional printing (3DP). International
Conference on Biofabrication, Manchester, 2012.
KHAN, S. F., DALGARNO, KENNETH W. Additive Manufacturing (AM) Assisted
Fabrication of Apatite-Wollastonite (A-W) Glass Ceramic for Medical Implants Computer
Aided Process Engineering (CAPE 2011), Edinburgh, Scotland, 2011.
KHAN, S.F., GERMAN, M.,DALGARNO, K.W. Using additive manufactured tooling in the
fabrication of poly (L-Lactide-co-Glycolide) implants Proceeding of 5th International
Conference on Advanced Research in Virtual and Rapid Prototyping (VRAP2011), Leiria,
Portugal, 2011.
KHAN, S. F., DALGARNO, K. W. Design of customised bioceramic medical implants by
layered manufacturing. 4th International Conference on Advanced Research in Virtual and
Rapid Prototyping (VRAP2009), Leiria, Portugal, 2009.
KHAN, S. F., DALGARNO, K. W. Customised bioceramic medical implants by layered
manufacturing. 10th National Conference on Rapid Design, Prototyping and Manufacturing,
High Wycombe, UK, 2009.
204

Appendix A
205

Appendix B Data
Appendix B1 - Density and porosity measurements of AW as determine using pycnometer with data of bending tests.
dry body suspended soaked body suspended bod soaked body dry body soaked bodsuspended open porosity
SAMPLE
weight of dry sample W1(g)
weight of density bottle m1(g)
weight of density bottle + dry sample m2d (g)
weight of density bottle + wet sample m2w (g)
weight of density bottle + dry sample + water m3d (g)
weight of density bottle + wet sample + water m3w (g)
weight of density bottle + water m4 (g) m2d-m1 m2w-m1 m3d-m4
% apparent porosity
bulk density (g/cu cm)
density of A-W(g/cu cm)
true porosity
open porosity
F1 0.2887 17.3095 17.5982 17.6222 42.7254 42.7434 42.5609 0.2887 0.3127 0.1645 16.1943 1.9445 3.07 36.66068 44.17358F2 0.3169 18.6419 18.9594 18.9772 43.5756 43.5898 43.3764 0.3175 0.3353 0.1992 13.0786 2.3286 3.07 24.14915 54.15767F3 0.2719 17.3142 17.5859 17.6034 42.724 42.7319 42.56 0.2717 0.2892 0.164 13.9776 2.1662 3.07 29.43974 47.4788F4 0.268 18.6325 18.9 18.9159 43.546 43.5553 43.381 0.2675 0.2834 0.165 13.4291 2.2552 3.07 26.54068 50.59801F5 0.2712 17.3094 17.5808 17.6014 42.7221 42.7158 42.5554 0.2714 0.292 0.1667 16.4405 2.1621 3.07 29.5739 55.59138F6 0.3032 18.6472 18.9501 18.9619 43.5684 43.5756 43.3762 0.3029 0.3147 0.1922 9.6327 2.4682 3.07 19.60334 49.13782F7 0.2918 17.3102 17.6022 17.62 42.7187 42.7248 42.5436 0.292 0.3098 0.1751 13.2146 2.1639 3.07 29.51607 44.77069F8 0.2675 18.6259 18.8934 18.9116 43.5336 43.538 43.368 0.2675 0.2857 0.1656 15.1540 2.2233 3.07 27.58048 54.94479F9 0.3068 17.3118 17.6187 17.6387 42.7242 42.7308 42.5376 0.3069 0.3269 0.1866 14.2552 2.1835 3.07 28.87635 49.36624F10 0.2963 18.6286 18.9246 18.9373 43.5485 43.5549 43.367 0.296 0.3087 0.1815 9.9843 2.3228 3.07 24.33772 41.02388M3F1 0.2758 17.3106 17.5865 17.6062 42.6997 42.7009 42.5303 0.2759 0.2956 0.1694 15.6101 2.1823 3.07 28.91676 53.98302M4F1 0.2983 18.626 18.9242 18.9427 43.5465 43.5335 43.35553 0.2982 0.3167 0.19097 14.7141 2.3675 3.07 22.88417 64.29804M5F1 0.2716 17.3104 17.5819 17.5944 42.695 42.6982 42.52285 0.2715 0.284 0.17215 11.1757 2.4230 3.07 21.07607 53.02545
n 13 13 13 13 13 13 13 13 13 13 13 13 13 13 13min 0.2675 17.3094 17.5808 17.5944 42.6950 42.6982 42.5229 0.2675 0.2834 0.1640 9.6327 1.9445 3.0700 19.6033 41.0239max 0.3169 18.6472 18.9594 18.9772 43.5756 43.5898 43.3810 0.3175 0.3353 0.1992 16.4405 2.4682 3.0700 36.6607 64.2980average 0.2868 17.9214 18.2081 18.2256 43.1021 43.1071 42.9258 0.2867 0.3042 0.1764 13.6047 2.2455 3.0700 26.8581 50.9653sd 0.0168 0.6864 0.6913 0.6897 0.4348 0.4347 0.4289 0.0169 0.0171 0.0123 2.2024 0.1378 0.0000 4.4877 6.0557
Appendix B
206
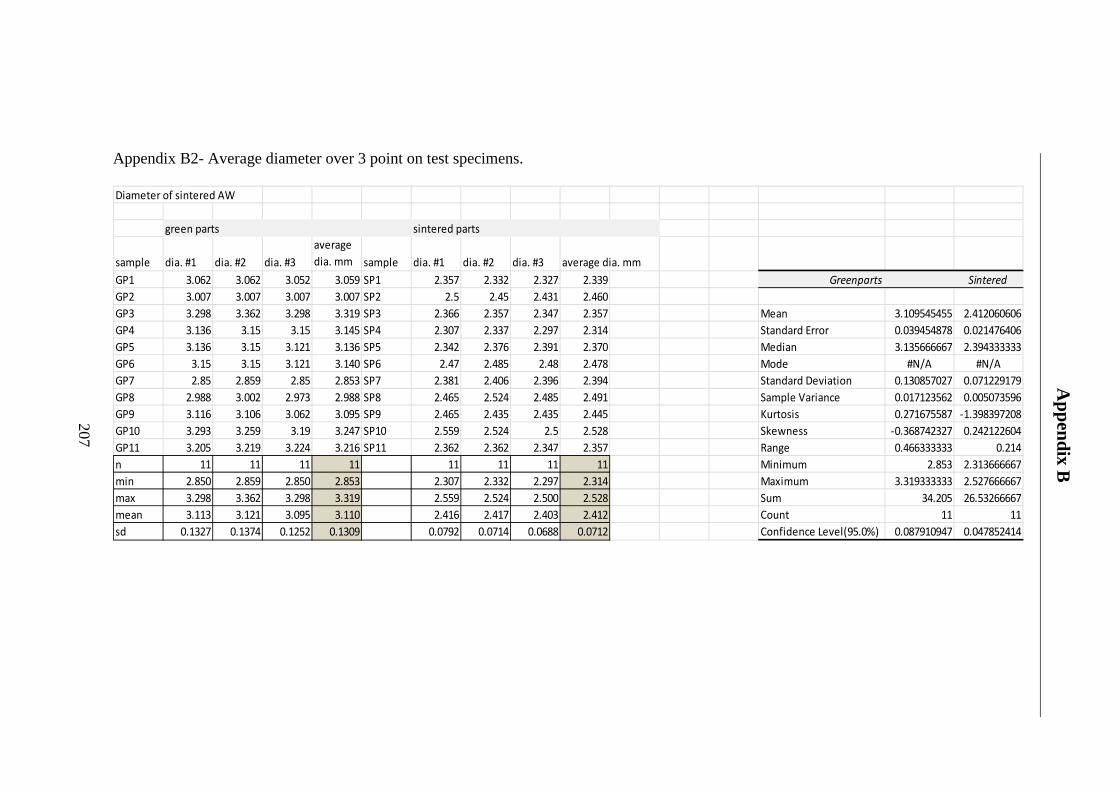
Appendix B2- Average diameter over 3 point on test specimens.
Diameter of sintered AW
sample dia. #1 dia. #2 dia. #3average dia. mm sample dia. #1 dia. #2 dia. #3 average dia. mm
GP1 3.062 3.062 3.052 3.059 SP1 2.357 2.332 2.327 2.339 Greenparts SinteredGP2 3.007 3.007 3.007 3.007 SP2 2.5 2.45 2.431 2.460GP3 3.298 3.362 3.298 3.319 SP3 2.366 2.357 2.347 2.357 Mean 3.109545455 2.412060606GP4 3.136 3.15 3.15 3.145 SP4 2.307 2.337 2.297 2.314 Standard Error 0.039454878 0.021476406GP5 3.136 3.15 3.121 3.136 SP5 2.342 2.376 2.391 2.370 Median 3.135666667 2.394333333GP6 3.15 3.15 3.121 3.140 SP6 2.47 2.485 2.48 2.478 Mode #N/A #N/AGP7 2.85 2.859 2.85 2.853 SP7 2.381 2.406 2.396 2.394 Standard Deviation 0.130857027 0.071229179GP8 2.988 3.002 2.973 2.988 SP8 2.465 2.524 2.485 2.491 Sample Variance 0.017123562 0.005073596GP9 3.116 3.106 3.062 3.095 SP9 2.465 2.435 2.435 2.445 Kurtosis 0.271675587 -1.398397208GP10 3.293 3.259 3.19 3.247 SP10 2.559 2.524 2.5 2.528 Skewness -0.368742327 0.242122604GP11 3.205 3.219 3.224 3.216 SP11 2.362 2.362 2.347 2.357 Range 0.466333333 0.214n 11 11 11 11 11 11 11 11 Minimum 2.853 2.313666667min 2.850 2.859 2.850 2.853 2.307 2.332 2.297 2.314 Maximum 3.319333333 2.527666667max 3.298 3.362 3.298 3.319 2.559 2.524 2.500 2.528 Sum 34.205 26.53266667mean 3.113 3.121 3.095 3.110 2.416 2.417 2.403 2.412 Count 11 11sd 0.1327 0.1374 0.1252 0.1309 0.0792 0.0714 0.0688 0.0712 Confidence Level(95.0%) 0.087910947 0.047852414
green parts sintered parts
Appendix B
207

Appendix B3- Properties of Cylindrical specimens.
Batch #1 Data of cylindrical specimens of AWGC
8span L0 (mm 20 pi 3.14159temp 24C humidity 0.38
diameter D (mm) δ2 (mm) δ1 (mm)
delta δ (mm) F2 (kN) F1(kN)
delta F(kN)
Young's Modulus E (GPa)
Max. Flexural Load Fmax(N)
Deflection at Max.Flexural Load δ
Modulus of Rapture (Flexural strength)σ (MPa)
F1 2.55 0.04 0.02008 0.01992 0.01117 0.00568 0.00548 22.1028 20.43 0.102 62.751F2 2.65 0.04 0.02008 0.01992 0.01665 0.00935 0.0073 25.2411 24.29 0.055 66.475F3 2.55 0.04 0.02 0.02 0.01241 0.007 0.00542 21.7414 20.7 0.072 63.580F4 2.55 0.04 0.02 0.02 0.01642 0.00853 0.00789 31.6665 21.4 0.051 65.730F5 2.65 0.04 0.02008 0.01992 0.0145 0.0073 0.00719 24.8643 22.7 0.058 62.124F6 2.6 0.03904 0.02004 0.019 0.01256 0.00659 0.00598 23.3731 20.4 0.061 59.113F7 2.6 0.04 0.02 0.02 0.01403 0.00693 0.0071 26.3577 20.5 0.056 59.402F8 2.5 0.04 0.02008 0.01992 0.01468 0.00729 0.00739 32.2415 18.6 0.048 60.627F9 2.55 0.04 0.02 0.02 0.01241 0.00643 0.00598 24.0018 21.6 0.063 66.344F10 2.55 0.04 0.02008 0.01992 0.01322 0.00602 0.0072 29.0203 17.3 0.054 53.137F11 2.35 0.04 0.02 0.02 0.00989 0.00404 0.00584 32.5303 21.1 0.073 82.804
Appendix B
208
Rupture

Batch #2 Data of cylindrical specimens of AWGC
8span L0
(mm) 20 pi 3.14159temp 24C humidity 0.38
diameter D (mm) δ2 (mm) δ1 (mm)
delta δ (mm) F2 (kN) F1(kN)
delta F(kN)
Young's Modulus E (GPa)
Max. Flexural Load Fmax (N)
Deflection at Max.Flexural Load δ
Modulus of Rapture (Flexural Strength) σ (MPa)
S1 2.85 0.06776 0.04268 0.02508 0.02005 0.00663 0.01342 27.5416 42.1 0.101 92.62S2 2.82 0.06672 0.04 0.02672 0.01774 0.00635 0.01139 22.882 37.1 0.1 84.26S3 2.84 0.06696 0.0412 0.02576 0.02721 0.01494 0.01227 24.8663 31.3 0.076 69.59S4 3.06 0.06816 0.0424 0.02576 0.02578 0.01384 0.01193 17.9405 40.1 0.094 71.28S5 2.85 0.06988 0.04324 0.02664 0.01557 0.00668 0.00889 17.1816 32.8 0.102 72.16S6 2.95 0.067 0.04464 0.02236 0.0256 0.01399 0.0116 23.2663 35.2 0.085 69.83S7 2.79 0.06692 0.04028 0.02664 0.02788 0.01519 0.01269 26.6862 31.9 0.076 74.81S8 2.9 0.06624 0.04136 0.02488 0.02658 0.01324 0.01334 25.7352 40.9 0.092 85.41S9 2.56 0.065 0.04192 0.02308 0.01667 0.0083 0.00837 28.6722 20 0.075 60.71S10 2.86 0.0658 0.04392 0.02188 0.02087 0.01072 0.01016 23.5554 36.7 0.102 79.90S11 2.86 0.06436 0.04564 0.01872 0.02404 0.01657 0.00746 20.2285 36.9 0.087 80.33
209
Rupture
Appendix B
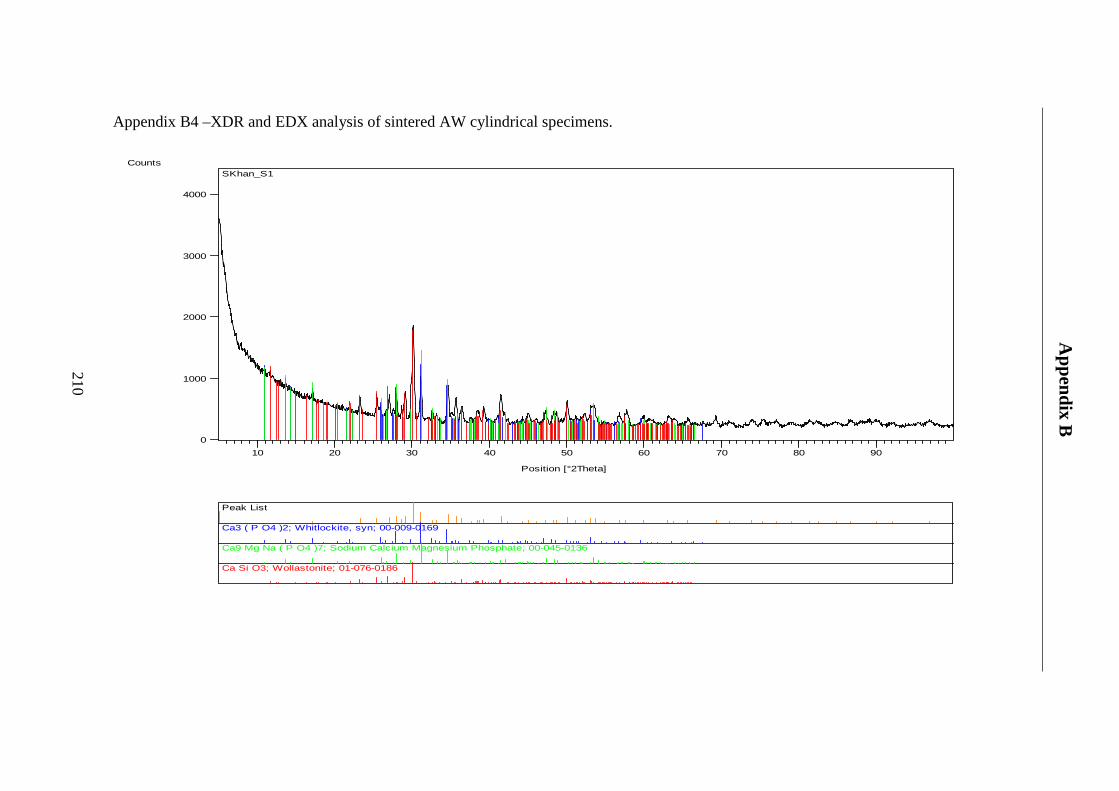
Appendix B4 –XDR and EDX analysis of sintered AW cylindrical specimens.
Position [°2Theta]
10 20 30 40 50 60 70 80 90
Counts
0
1000
2000
3000
4000
SKhan_S1
Peak List
Ca3 ( P O4 )2; Whitlockite, syn; 00-009-0169
Ca9 Mg Na ( P O4 )7; Sodium Calcium Magnesium Phosphate; 00-045-0136
Ca Si O3; Wollastonite; 01-076-0186
Appendix B
210

Position [°2Theta]10 20 30 40 50 60 70 80 90
Counts
0
1000
2000
3000
SKhan_S2
Peak List
00-009-0169; Whitlockite, syn; Ca3 ( P O4 )2
00-045-0136; Ca9 Mg Na ( P O4 )7
01-076-0186; Wollastonite; Ca Si O3
Appendix B
211

Position [°2Theta]
10 20 30 40 50 60 70 80 90
Counts
0
1000
2000
3000
0
1000
2000
3000
0
1000
2000
3000
SKhan_S1
SKhan_S2
SKhan_S3b_Mar10
Peak List
Ca Si O3; Wollastonite; 01-076-0186
Ca3 ( P O4 )2; Whitlockite, syn; 00-009-0169
Ca9 Mg Na ( P O4 )7; Sodium Calcium Magnesium Phosphate; 00-045-0136
212
Appendix B

Position [°2Theta]
10 20 30 40 50 60 70 80 90
Counts
0
1000
2000
3000
4000
SKhan_S3b_Mar10
Peak List
Ca Si O3; Wollastonite; 01-076-0186
Ca3 ( P O4 )2; Whitlockite, syn; 00-009-0169
Ca9 Mg Na ( P O4 )7; Sodium Calcium Magnesium Phosphate; 00-045-0136
Appendix B
213
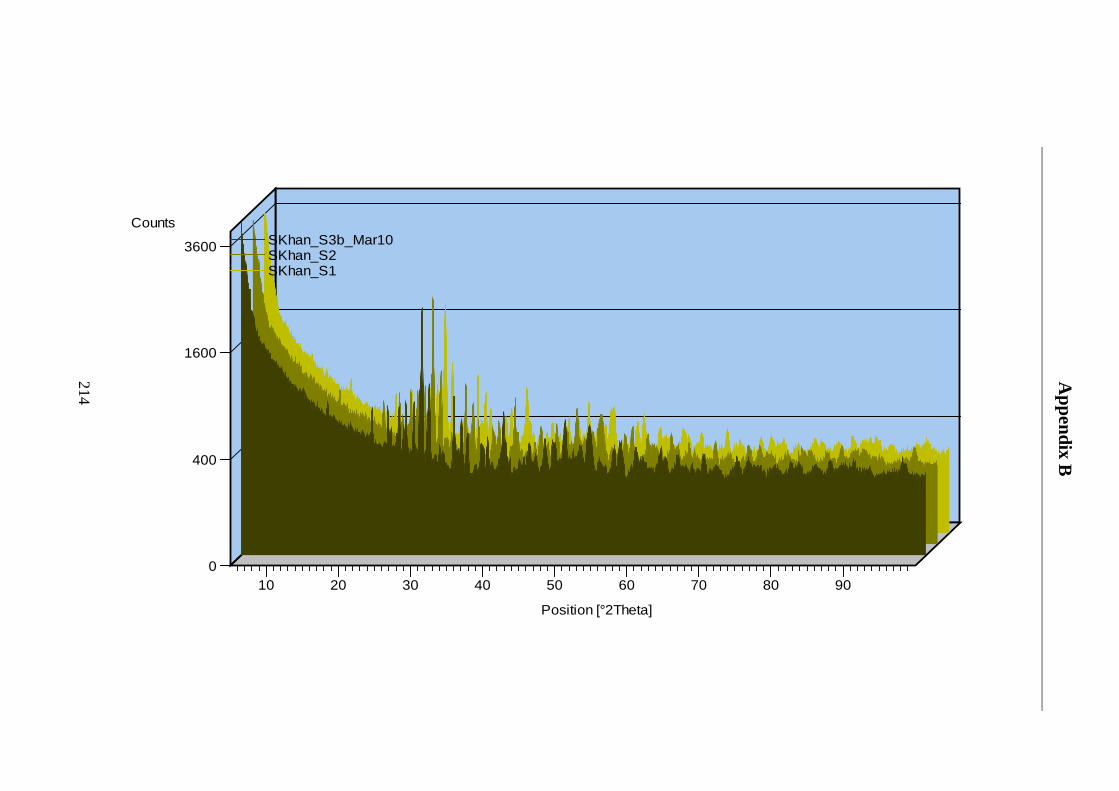
0
400
1600
3600
Counts
Position [°2Theta]
10 20 30 40 50 60 70 80 90
SKhan_S1 SKhan_S2 SKhan_S3b_Mar10
Appendix B
214

Appendix B4 - XRD analysis from PDF2 (2009)
Position [°2Theta] (Copper (Cu))10 20 30 40 50 60 70
Counts
0
20000
40000
Elena_A-W1
Peak List
Wollastonite; Calcium Silicon Oxide; Ca Si O3; Anorthic; 04-010-0710; Q: P;ALT
whitlockite, syn; Hydrogen Calcium Magnesium Aluminum Iron Phosphate; H0.825 Ca9.22 Mg0.685 Fe0.115 Al0.045 ( P O4 )7; Rhom
Diopside; Calcium Magnesium Silicate; Ca Mg ( Si O3 )2; Monoclinic; 01-073-6374; Q: I;ALT
Apatite-(CaOH) (Si-substituted), syn; Calcium Oxide Phosphate Silicate Hydroxide; Ca10 ( P O4 )4.92 ( Si O4 )1.08 ( ( O H ) O0.664 );
215
aw1
Appendix B

Position [°2Theta] (Copper (Cu))10 20 30 40 50 60 70
Counts
0
20000
40000
Elena_A-W2
Peak List
Wollastonite; Calcium Silicon Oxide; Ca Si O3; Anorthic; 04-010-0710; Q: P;ALT
whitlockite, syn; Hydrogen Calcium Magnesium Aluminum Iron Phosphate; H0.825 Ca9.22 Mg0.685 Fe0.115 Al0.045 ( P O4 )7; Rhom
Apatite-(CaOH) (Si-substituted), syn; Calcium Oxide Phosphate Silicate Hydroxide; Ca10 ( P O4 )4.92 ( Si O4 )1.08 ( ( O H ) O0.664 );
Diopside; Calcium Magnesium Silicate; Ca Mg ( Si O3 )2; Monoclinic; 01-073-6374; Q: I;ALT
Appendix B
216
aw2

Position [°2Theta] (Copper (Cu))10 20 30 40 50 60 70
Counts
0
20000
40000
Elena_AW-FDM
Peak List
Diopside; Calcium Magnesium Silicate; Ca Mg ( Si O3 )2; Monoclinic; 01-073-6374; Q: I;ALT
Apatite-(CaOH) (Si-substituted), syn; Calcium Oxide Phosphate Silicate Hydroxide; Ca10 ( P O4 )4.92 ( Si O4 )1.08 ( ( O H ) O0.664
Wollastonite; Calcium Silicon Oxide; Ca Si O3; Anorthic; 04-010-0710; Q: P;ALT
whitlockite, syn; Hydrogen Calcium Magnesium Aluminum Iron Phosphate; H0.825 Ca9.22 Mg0.685 Fe0.115 Al0.045 ( P O4 )7; Rho
Appendix B
217
awfdm

Position [°2Theta] (Copper (Cu))10 20 30 40 50 60 70
Counts
0
10000
20000
30000
Elena_AW-3D-1
Peak List
Diopside; Calcium Magnesium Silicate; Ca Mg ( Si O3 )2; Monoclinic; 01-073-6374; Q: I;ALT
Apatite-(CaOH) (Si-substituted), syn; Calcium Oxide Phosphate Silicate Hydroxide; Ca10 ( P O4 )4.92 ( Si O4 )1.08 ( ( O H ) O0.664 );
Wollastonite; Calcium Silicon Oxide; Ca Si O3; Anorthic; 04-010-0710; Q: P;ALT
whitlockite, syn; Hydrogen Calcium Magnesium Aluminum Iron Phosphate; H0.825 Ca9.22 Mg0.685 Fe0.115 Al0.045 ( P O4 )7; Rhom
Appendix B
218
aw3d1

Position [°2Theta] (Copper (Cu))10 20 30 40 50 60 70
Counts
0
20000
40000
Elena_AW-3D-2
Peak List
Diopside; Calcium Magnesium Silicate; Ca Mg ( Si O3 )2; Monoclinic; 01-073-6374; Q: I;ALT
Apatite-(CaOH) (Si-substituted), syn; Calcium Oxide Phosphate Silicate Hydroxide; Ca10 ( P O4 )4.92 ( Si O4 )1.08 ( ( O H ) O0.664 );
Wollastonite; Calcium Silicon Oxide; Ca Si O3; Anorthic; 04-010-0710; Q: P;ALT
whitlockite, syn; Hydrogen Calcium Magnesium Aluminum Iron Phosphate; H0.825 Ca9.22 Mg0.685 Fe0.115 Al0.045 ( P O4 )7; Rhom
Appendix B
219
aw3d2

aw1
Appendix B
220
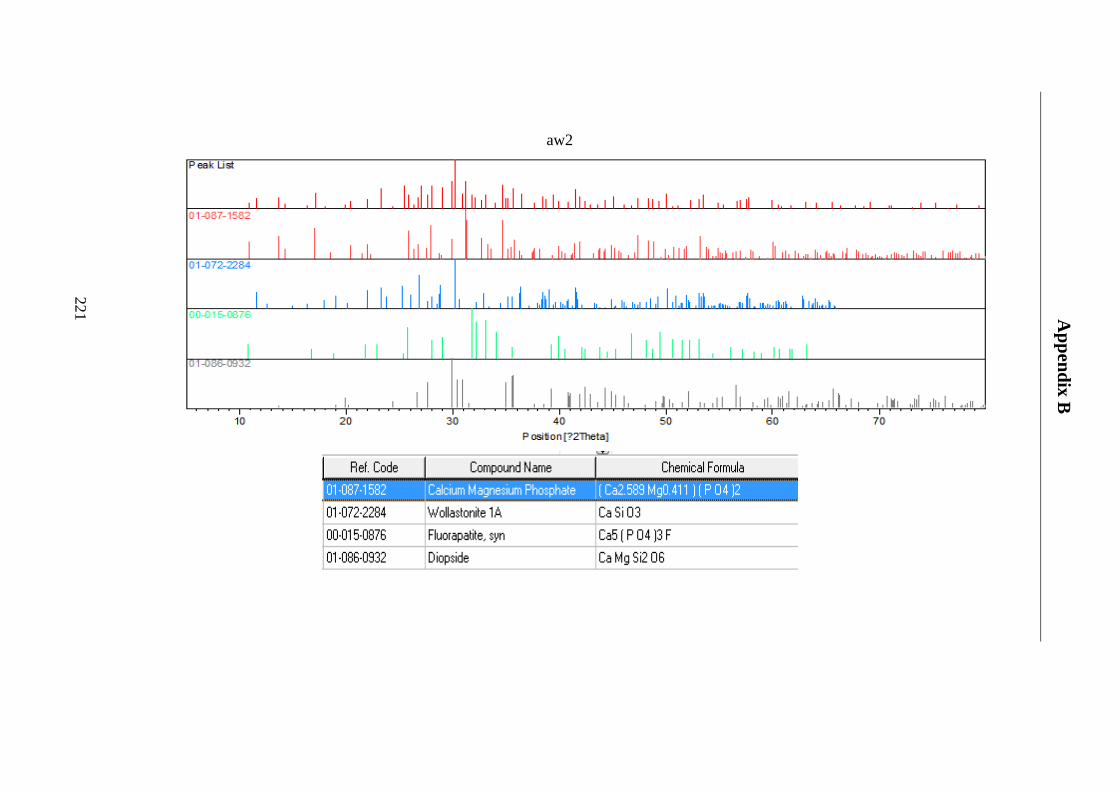
aw2
Appendix B
221

awfdm
Appendix B
222

Aw3d1
Appendix B
223
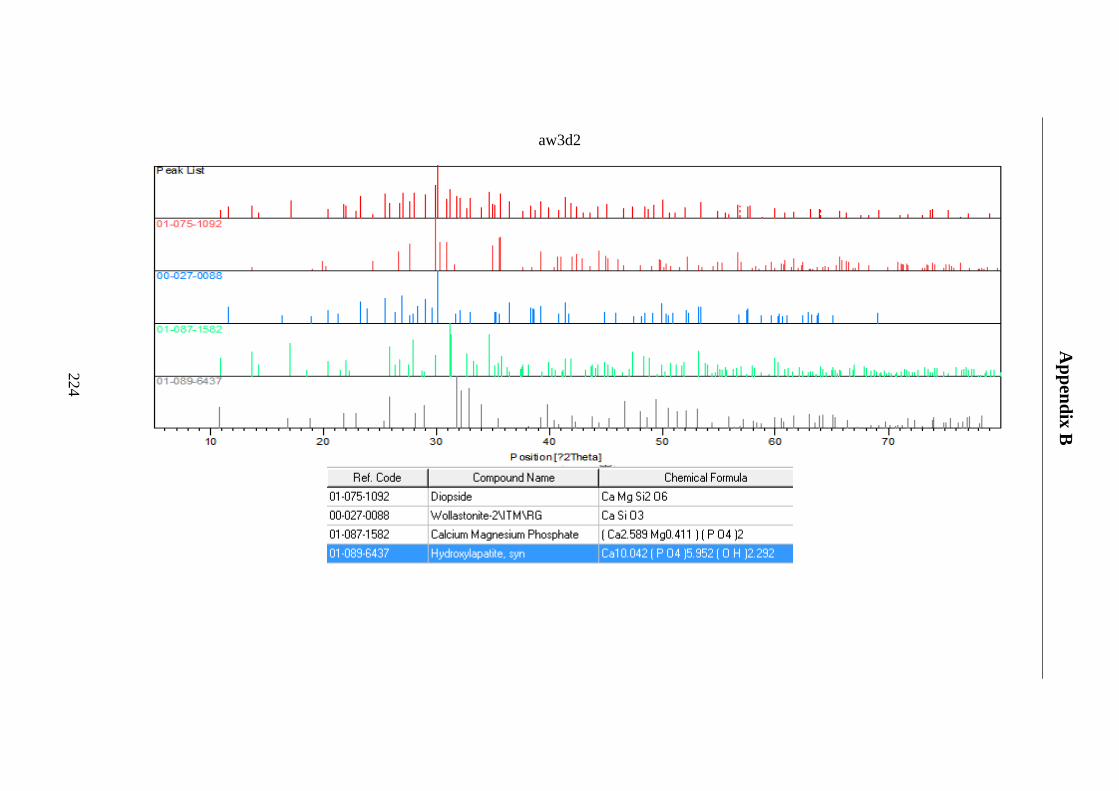
aw3d2
Appendix B
224

(a) Sample 1 of EDX for sintered specimen fabricated using aluminium sheet mould from the same batch of AW-PMMA powder
mixture ( aw1)
Appendix B
I
225

(b) Sample 2 of EDX for sintered specimen fabricated using aluminium sheet mould from the same batch of AW-PMMA powder
mixture ( aw2).
Appendix B
226

(c) Sample 3 of EDX for sintered specimen fabricated using FDM mould from the same batch of AW-PMMA powder mixture (awfdm1)
Appendix B
227

(d) Sample 4 of EDX for sintered specimen fabricated using Z-Corp 3D Printer from the same batch of AW-maltodextrine powder mixture ( aw3DP1)
Appendix B
228

(e) Sample 1 of EDX for sintered specimen fabricated Z-Corp 3D Printer from the same batch of AW-maltodextrine powder mixture ( aw3DP2)
Appendix B
229

Appendix B5 – 3DP specimens data.
Specimen
Green parts, width
thickness
Sintered parts, Not sanded,width
thickness
Sintered parts, Sanded,width
thickness
Green parts Unsintered Bending Strength MPA
Sintered parts, Not sanded, overnight in 3DP,Bending Strength MPA
Sintered parts,Sanded,overnight in room enviroment Bending Strength MPA
1 5.34 4.8275 6.15 5.55 5.3525 5.01 65.05 3224.27 26792 5.1575 4.915 5.9 5.54 5.2 5.1975 126.88 1158.93 1229.893 5.5025 5.1725 5.92525 5.32 6.11 5.045 194.39 576.88 1706.094 5.695 5.105 5.8775 5.505 5.21 4.7875 180.95 349.97 1961.65 5.545 5.065 6.2075 5.6375 5.255 4.945 164.13 513.53 1787.26 5.74 5.4975 5.3425 4.8325 331.48 3947.317 6.5275 5.6825 5.3275 5.0625 205.52 1380.498 6.1325 5.2525 5.12 5.1 1084.97 3934.89 6.26 6.0525 5.4025 5.1175 144.41 5138
10 6.1275 6.0675 5.435 5.1025 370.19n 5 5 10 10 10 10 5 10 9min. 5.1575 4.8275 5.74 5.2525 5.12 4.7875 65.05 144.41 1229.89max 5.695 5.1725 6.5275 6.0675 6.11 5.1975 194.39 3224.27 5138Average 5.448 5.017 6.01205 5.5105 5.4255 4.997 146.28 796.015 2640.486667s.d 0.205817 0.1419 0.228899 0.269817 0.276018 0.129781 51.98527772 919.467951 1381.192749
Appendix B
230

AppendixB6 – DSC analysis of PLGA and PLA.
Appendix B
231

Appendix B7 - Region of energy absorb during repeated cycle of heating and cooling indicating no aging.
Appendix B
232

Appendix C1 Transfer mould for PLGA
Appendix C
– Mould draw
ing and RTV
moulding steps.
233

Appendix C2- Moulding box for RTV silicone.
Appendix C
234
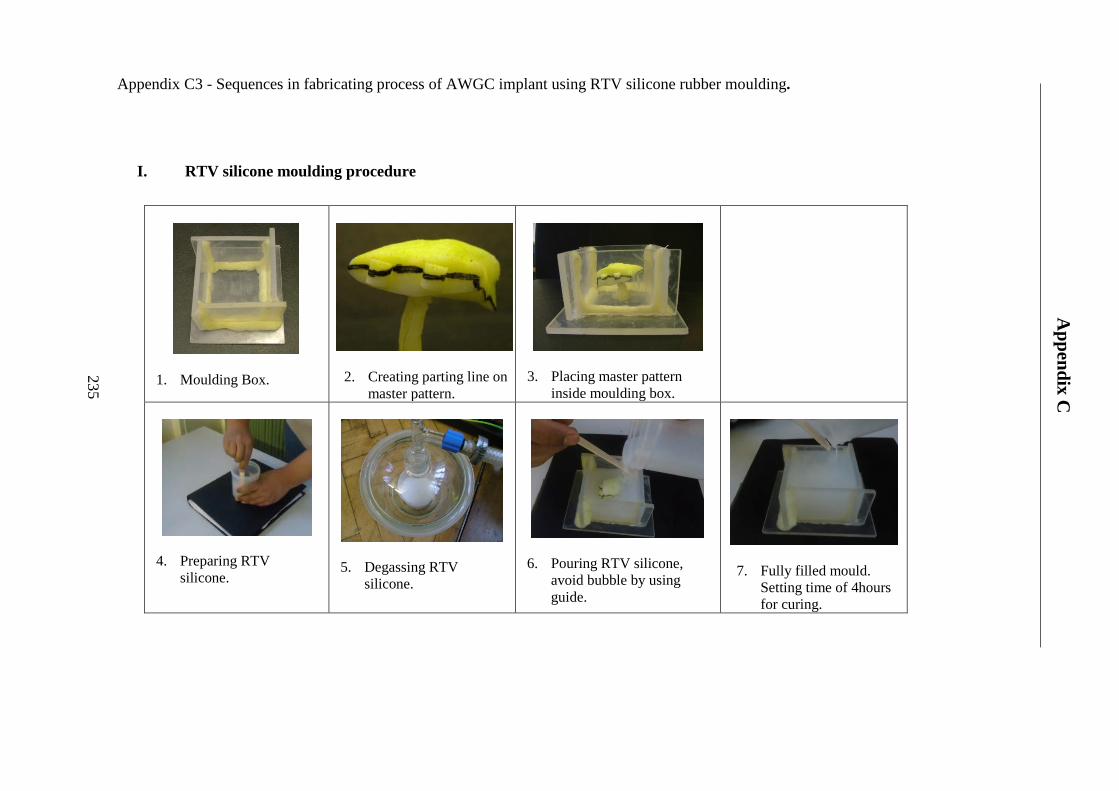
Appendix C3 - Sequences in fabricating process of AWGC implant using RTV silicone rubber moulding.
I. RTV silicone moulding procedure
1. Moulding Box.
2. Creating parting line on master pattern.
3. Placing master pattern
inside moulding box.
4. Preparing RTV
silicone.
5. Degassing RTV
silicone.
6. Pouring RTV silicone,
avoid bubble by using guide.
7. Fully filled mould. Setting time of 4hours for curing.
Appendix C
235

II. Demoulding of wax model from RTV silicone mould.
1. Removing the silicone mould after curing from mould box.
2. Creating two half of the mould by cutting along the parting line.
3. Exposed master pattern
along the parting line.
4. Removing the master pattern from the RTV silicone mould.
5. Soft tooling created from RTV silicone mould.
6. Preparing the paraffin
wax
7. Pouring the melted wax
into the syringe.
8. Injection the molten wax
into the RTV mould
9. Removing the wax
pattern from the mould.
10. The wax pattern.
Appendix C
236
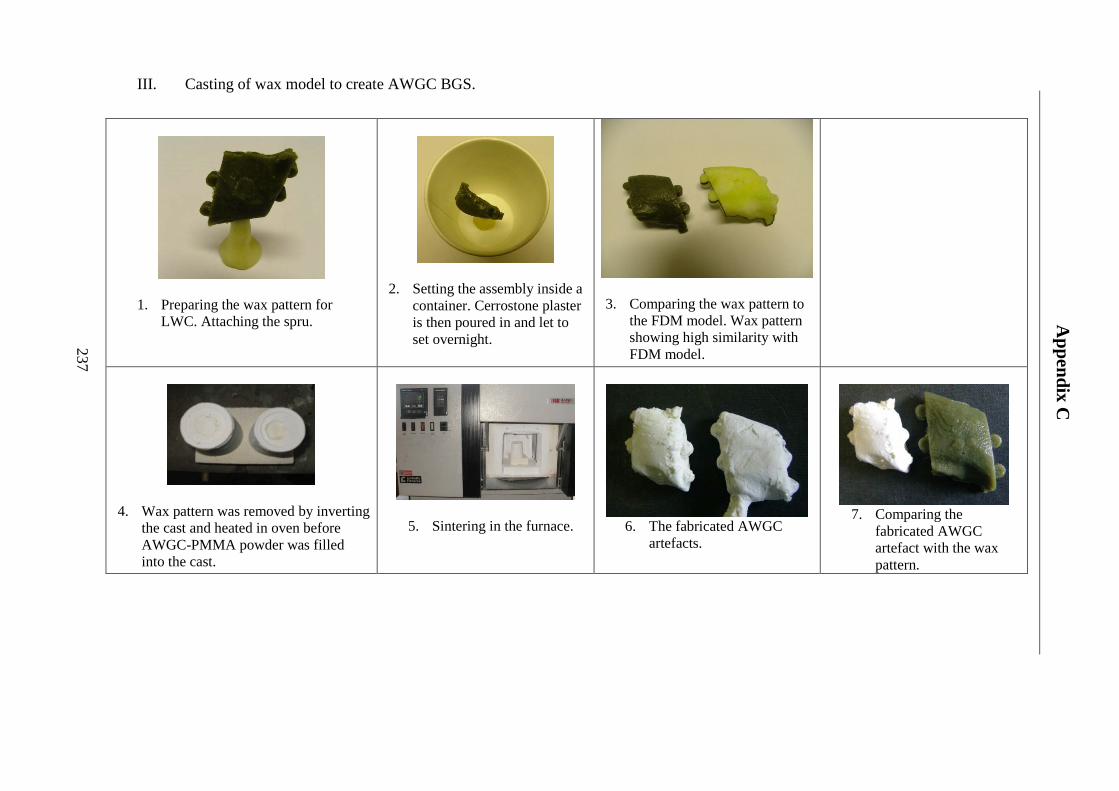
III. Casting of wax model to create AWGC BGS.
1. Preparing the wax pattern for LWC. Attaching the spru.
2. Setting the assembly inside a
container. Cerrostone plaster is then poured in and let to set overnight.
3. Comparing the wax pattern to
the FDM model. Wax pattern showing high similarity with FDM model.
4. Wax pattern was removed by inverting
the cast and heated in oven before AWGC-PMMA powder was filled into the cast.
5. Sintering in the furnace.
6. The fabricated AWGC
artefacts.
7. Comparing the
fabricated AWGC artefact with the wax pattern.
Appendix C
237

-ooOooo-