novel incorportation of biomedical engineering algorithms
TRANSCRIPT

Wayne State University
Wayne State University Dissertations
1-1-2015
Novel Incorportation Of Biomedical EngineeringAlgorithms (bispectral Index Guided OrAnesthetic Concentration Guided) In Real-TimeDecision Support To Prevent IntraoperativeAwareness Using An Electronic AnesthesiaInformation Mananagement SystemAmy Melanie ShanksWayne State University,
Follow this and additional works at: http://digitalcommons.wayne.edu/oa_dissertations
Part of the Biomedical Engineering and Bioengineering Commons, Databases and InformationSystems Commons, and the Medicine and Health Sciences Commons
This Open Access Dissertation is brought to you for free and open access by DigitalCommons@WayneState. It has been accepted for inclusion inWayne State University Dissertations by an authorized administrator of DigitalCommons@WayneState.
Recommended CitationShanks, Amy Melanie, "Novel Incorportation Of Biomedical Engineering Algorithms (bispectral Index Guided Or AnestheticConcentration Guided) In Real-Time Decision Support To Prevent Intraoperative Awareness Using An Electronic AnesthesiaInformation Mananagement System" (2015). Wayne State University Dissertations. Paper 1100.

NOVEL INCORPORATION OF BIOMEDICAL ENGINEERING ALGORITHMS (BISPECTRAL INDEX GUIDED OR ANESTHETIC
CONCENTRATION GUIDED) IN REAL-TIME DECISION SUPPORT TO PREVENT INTRAOPERATIVE AWARENESS USING AN ELECTRONIC
ANESTHESIA INFORMATION MANAGEMENT SYSTEM by
AMY MELANIE SHANKS
DISSERTATION
Submitted to the Graduate School
of Wayne State University,
Detroit, Michigan
in partial fulfillment of the requirements
for the degree of
DOCTOR OF PHILOSOPHY
2015
MAJOR: BIOMEDICAL ENGINEERING
Approved by:
Advisor Date Co-Advisor Date

© COPYRIGHT BY
AMY MELANIE SHANKS
2015
All Rights Reserved

DEDICATION
To my wonderful parents, John and Mavis Shanks, for whom I am blessed to have in my
daily life and who continuously and graciously, give me their love, support, and encouragement.
ii

ACKNOWLEDGEMENTS
Dr. George Mashour has served not only as my co-advisor on my dissertation committee
but also a colleague, co-investigator and friend during these last several years. He graciously
offered to welcome me onto his grant to investigate intraoperative awareness; which I learned
quickly was a challenging yet highly rewarding area of work. Together we successfully
executed the largest prospective trial our department has ever completed as well as the largest
trial on intraoperative awareness. He has taught me many lessons that will continue throughout
my academic career including how to critically evaluate the literature and the proper techniques
in writing a manuscript for acceptance in a peer reviewed journal. I am extremely grateful and
honored to have Dr. Mashour as my mentor.
I would also like to thank Dr. Kevin K. Tremper and the Department of Anesthesiology
at the University of Michigan Health System for allowing me to complete my dissertation
research in the department while pursuing the degree at Wayne State University. Dr. Tremper
has been an influential person in my career development as well. Over the past 15 years he has
mentored and trusted me to enhance and grow the clinical and outcomes research in adult
anesthesia. In has been an honor to have his trust and support as my career has developed.
In addition, Dr. Sachin Kheterpal was the first person who introduced me to outcomes
research using an Anesthesia Information System. We quickly developed a well-respected
outcomes research infrastructure that most recently has become a national and internationally
recognized program. He has taught me innumerable skills not only in research itself but also in
the infrastructure behind data acquisition systems and how we can enhance Anesthesia
Information Systems to drive behavior changes in patient care. It is a privilege to work with him
on a daily basis and serve as his research director.
iii

Drs. Cavanaugh, Grimm, and Kou, and the rest of the faculty members, at Wayne State
University in the Department of Biomedical Engineering have been fantastic to learn and work
with since I started in 2001. They have developed a program that can be completed while the
student is currently in a career. This has been a tremendous asset to be able to learn and
implement the new knowledge into my daily research career. I am also extremely grateful for
each of them to serve as my committee member and to take the time to critically analyze my
research and offer valuable suggestions for improvement.
There have been numerous people over the last 11 years that have continuously offered
their support and guidance in my dissertation. To mention just a few: Dr. Michael Avidan who
has been a mentor and friend to me while learning how to properly investigate intraoperative
awareness. He has graciously taught me from his experience in this field of research and has
also invited me to collaborate on several projects. Dr. Michael O’Reilly offered me my first
position at the University and always believed in my ability to achieve great success. John
Vandervest who has been my lifeline in assuring that our project ran smoothly and the alerting
algorithms were set and implemented as the study design dictated. Without his expertise in the
behind the code operations of the Anesthesia Information System, the research may not have
been a success. Dr. Christa Schueller who started out as a post-bachelor degree graduate with
the dream of going to medical school and today is a resident within our department. Without her
I may have lost my sanity at times managing recruitment of 50 subjects a day and calling over
22,000 patients for interviews. Michelle Morris, who served as my back-up to ensure that the
project stayed on its timeline, but most importantly offered her friendship and support in
completing my doctorate. Tory Lacca, Shelley Housey, and Tyler Tremper who have all
iv

encouraged and supported me along this journey. Dr. Geoffrey Thomas who has been
instrumental in keeping me moving forward since 2001.
Finally, I would like to thank my parents, John and Mavis Shanks. They have always
told me since I was a little girl that anything was possible and never put any constraints on my
learning, imagination, or dreaming. I am forever grateful for their constant encouragement and
support in all avenues of my life. Thanks also to my sister, for her love.
v
TABLE OF CONTENTS
Dedications ii
Acknowledgements iii
List of Tables viii
List of Figures ix
List of Equations xi
Chapter 1:Intraoperative Awareness: Incidence, Epidemiology, Risk Factors and Consequences 1
Causes of Intraoperative Awareness 8
Techniques for Monitoring Anesthetic Depth: MAC and EEG 10
EEG Transformation to Bispectral Analysis for Anesthesia Depth Monitoring 16
Calculation of the Burst Suppression to be Used in Anesthesia Depth Monitoring 23
Calculation of the Bispectral Index based on EEG Transformation ____23
BIS Placement 25
Anesthetic Effects on the BIS 26
BIS Prospective Clinical Trials 32
Decision Support Alerting Systems Driving Provider Actions 36
Research Hypothesis and Specific Aims 40
Chapter 2-Bioinstrumention and Data Acquisition/Extraction System 42
Chapter 3-Development of a Novel Electronic Algorithm for Detecting Potentially Insufficient Anesthesia: Implications for the Prevention of Intraoperative Awareness 51 Methods 51
Results 54
Discussion 56
vi
Chapter 4-Prevention of Intraoperative Awareness with Explicit Recall in an Unselected Surgical Population: A Randomized Comparative Effectiveness Trial 59 Materials and Methods 60
Results 68
Discussion 75
Chapter 5-Systematic Review for Alerting Thresholds for the Prevention of Intraoperative Awareness with Explicit Recall 79 Materials and Methods 80
Results 85
Discussion 89
Chapter 6-Intraoperative Awareness Monitoring and Past Research Overview 94
Development of the Anesthetic Concentration Alert Incorporating IV Anesthetics 97
Michigan Awareness Control Study 98
Systematic Analysis of Alerting Thresholds in the Prevention of AWR 98
Future Directions of a Patient-Based Monitoring Approach in the Prevention of AWR 99
Patient Monitoring Towards the Eradication of Awareness – The Next Steps 101
Appendix I – Actual SQL code for Alerting Algorithms 103
Appendix II – Actual SPPS outputs for Chapter 4 MACS 106
Appendix III – Actual SPSS outputs for Chapter 5 135
References 181
Abstract 198
Autobiographical Statement 200
vii

LIST OF TABLES
Chapter 3
Table 1: Age-adjustment ranges for minimum alveolar concentration (MAC) 53
Table 2: Demographic data for the study population 55
Table 3: Assessment of trigger frequency in a retrospective study of 15,091 patients without awareness and 12 patients with awareness 55
Chapter 4
Table 1: Patient characteristics, comorbidities, and risk factors for awareness 70
Table 2: Anesthetic use and recovery variables 74
Chapter 5
Table 1: Sensitivity, specificity, and Youden’s index for each case that had valid measurements for end-tidal anesthetic concentration and bispectral index values 87
viii
LIST OF FIGURES
Chapter 1
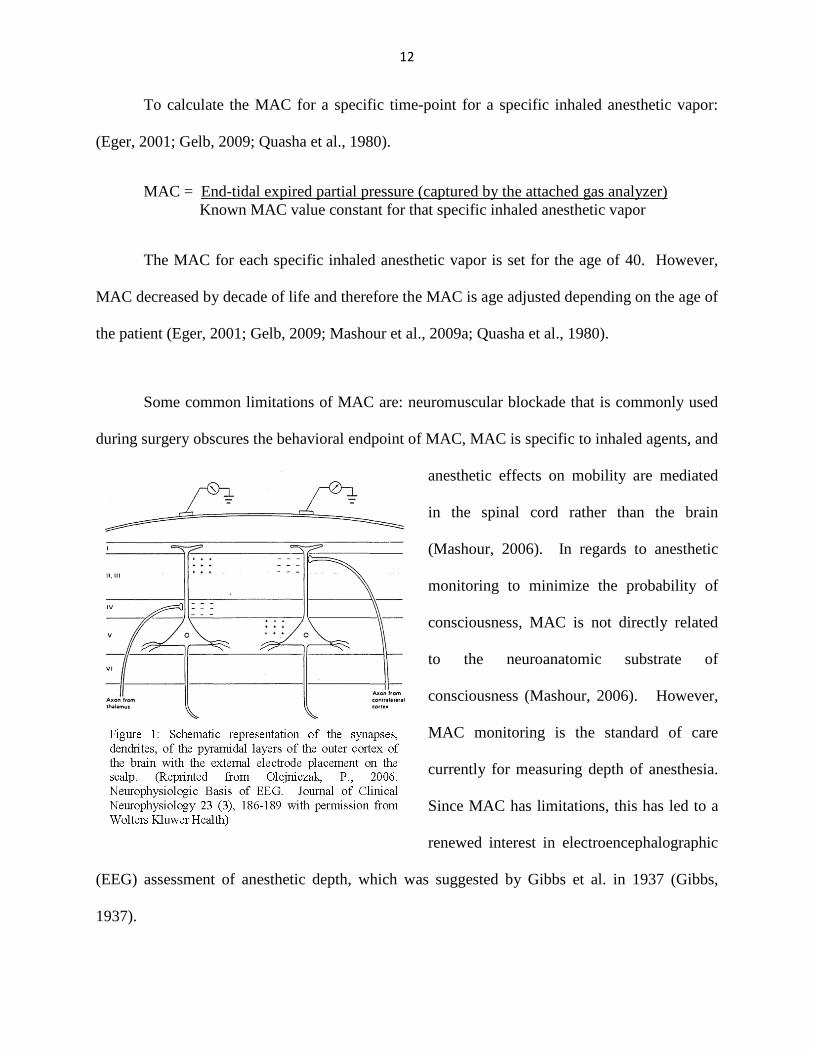
Figure 1: Schematic representation of the synapses, dendrites, of the pyramidal layers of the outer cortex of the brain with the external electrode placement on the scalp 12
Figure 2: Transformation from an analog to digital sample resulting in a loss of fidelity17
Figure 3: Power spectrum transformation from the Fourier transformation and shows the frequency distribution of the component sinusoid as a function of power 19
Figure 4: Example of a patient prior to induction of anesthesia and shows the time domain, frequency domain, amount of phase coupling, level of phase coupling, and real triple product 22
Figure 5: EEG changes induced by anesthetics from aware to near burst suppression 23
Figure 6: Dimensionless BIS value from 0 (cortical silence) to 100 (fully awake and memory intake) 24 Figure 7: Patient position supine with the BIS monitor adhered to the anterior-superior view of the forehead 25
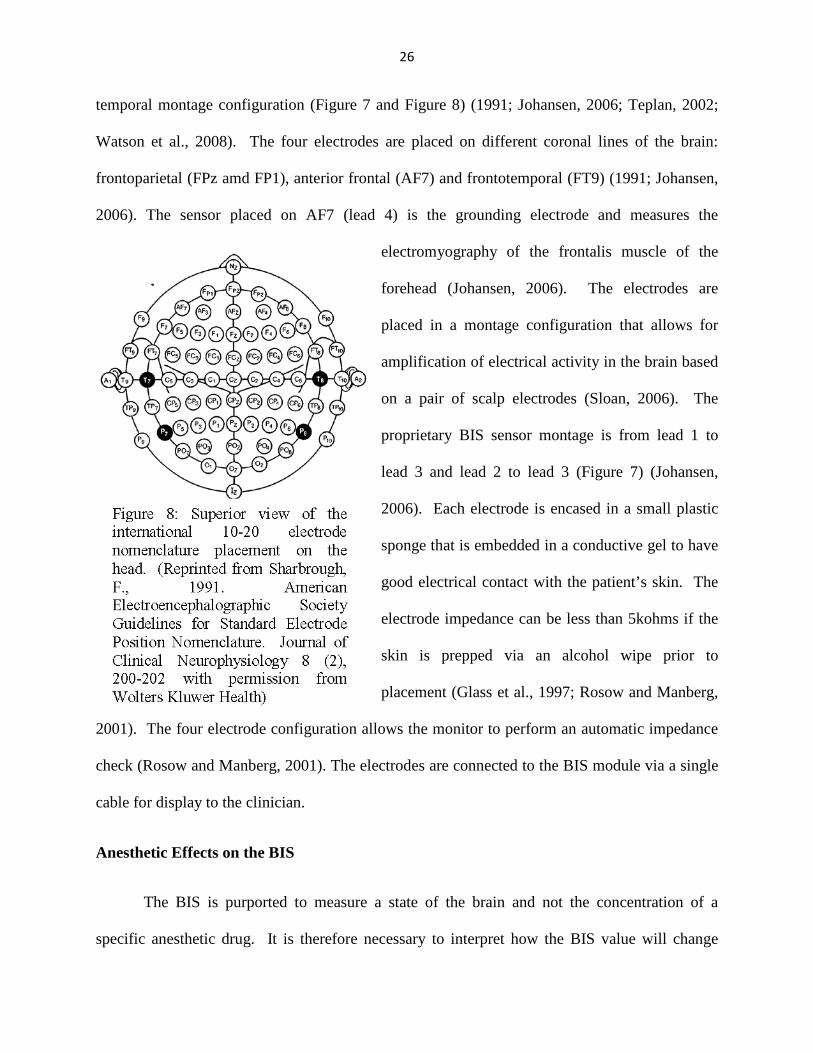
Figure 8: Superior view of the international 10-12 electrode nomenclature placement on the head 26
Figure 9: The BIS value correlates with propofol alone and propofol with an opioid (alfentanil) and the level of sedation 28
Figure 10: BIS values relatively unchanged after nitrous oxide administration in healthy volunteers 29
Figure 11: Decrease in BIS index with the use of sevoflurane when the subject was rendered unconscious 30
Chapter 2
Figure 1: Anesthesia monitoring configuration 42
Figure 2: DIDCA connection to the Unity ID 43
Figure 3: Connection examples from the back of the Solar 9500 monitors and the Unity ID 43 Figure 4: Tram rack 44
Figure 5: Example of anesthesia script elements 45
ix

Figure 6: Example of an inhalational anesthetic (bottom) with a one-time intravenous induction agent 46
Figure 7: Example of total intravenous anesthesia (TIVA) 46
Figure 8: Overview from monitor-capture to visualization on the AIMS CPA 50
Chapter 4
Figure 1: Flow diagram of recruitment and follow-up interviews 69
Figure 2: Primary outcome of definite awareness in modified intention to treat groups 71
Figure 3: Secondary outcomes of definite or possible awareness in post hoc groups 72
Chapter 5
Figure 1: Flow diagram from parent study to secondary analysis 86
Figure 2: Comparison of end-tidal anesthetic concentration alerting and no intervention88
Figure 3: End-tidal anesthetic concentration alerting trending analysis 88
Figure 4: Bispectral Index alerting trend analysis 89
x

TABLE OF EQUATIONS
Equation 1: Fourier transformation where the time domain component of the EEG is transformed into a frequency range component of the EEG 18 Equation 2: Power spectrum of the fourier transformation 18
Equation 3: Intermodulation products 19
Equation 4: The Bispectrum 20
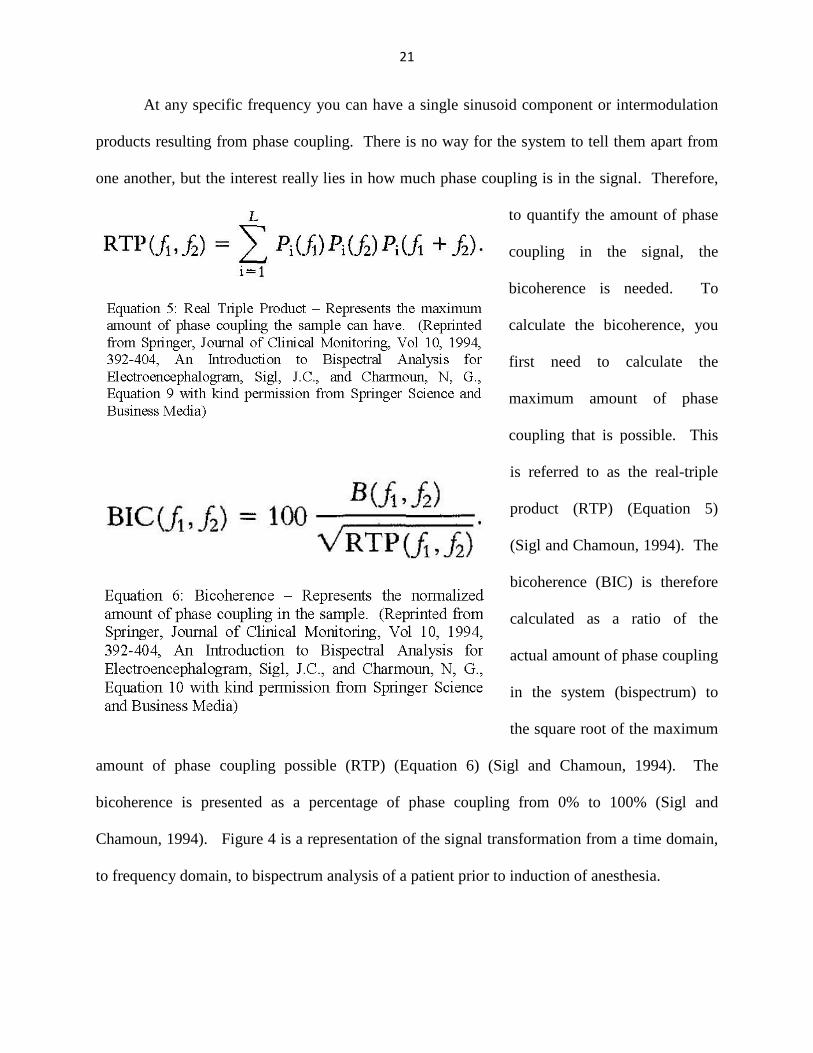
Equation 5: Real triple product 21
Equation 6: Biocoherence 21
xi

1
CHAPTER 1 – Intraoperative Awareness: Incidence, Epidemiology, Risk Factors, and Consequences
Experiencing and remembering the trauma of surgery is a feared complication and is
often referred to as intraoperative awareness or anesthesia awareness (AWR). “Awareness” in
this context is defined as the consciousness and explicit recall of events during an operation
(between time of anesthesia induction and emergence from anesthesia) that can include auditory,
sensory, and/or nociceptive stimuli. AWR occurs while a patient is intended to be under general
anesthesia (GA). GA is defined as a drug-induced loss of consciousness during which a patient
cannot be aroused even by a painful stimulus (ASA Task Force, 2006). A balanced anesthetic
technique can include the use of amnesic drugs, neuromuscular blocking agents (paralytics),
narcotics, and inhaled or intravenous anesthetics. These medications are titrated to maintain
stable physiologic parameters based on the patient’s co-morbidities.
The incidence of AWR is low and reported to be between 0.1 – 0.2%. Sebel et al.
demonstrated an incidence of 0.13% (Sebel et al., 2004) for definite AWR at seven medical
centers in the United States, which is consistent with an earlier study in Europe finding an
incidence of 0.16% (Sandin et al., 2000). Collectively, these studies suggest an incidence of
approximately 1-2cases/1000. However, if the potential or possible AWR reports in the Sebel et
al. study were included, the incidence rose to 0.36% (Sebel et al., 2004). In high-risk cases the
incidence may be as high as 1%.
The incidence of AWR changes in different healthcare environments around the world.
Ranta et al. investigated all patients undergoing GA for a one year period in Finland and found
an incidence of 0.4% of definite AWR and an incidence of 0.3% for possible AWR (Ranta et al.,
1998). They noted that the AWR patients received a statistically smaller dose of anesthetics
2
based on hand review of the medical records. Psychiatric evaluations were performed on five of
the AWR patients and it was determined that three of the five patients had a history of major
depression (Ranta et al., 1998). Myles et al. performed a patient satisfaction survey the first day
after an operation in Australia and noted a self-reported AWR incidence similar to the United
States of 0.11% (Myles et al., 2000). More recently, Errando et al. prospectively evaluated 4,001
patients in Spain and noted a very high incidence of 1.0% which is about 5 times that of the
reported rate in the United States (Errando et al., 2008). Xu et al. conducted a descriptive cohort
study from 25 medical centers in China which included data on 11,101 patients (Xu et al., 2009).
They showed an incidence of 0.41% of definite AWR and 0.41% of possible AWR cases which
is about double the reported rate in the United States. The United Kingdom and Irish pubic
hospitals have performed national audits on the event of “accidental awareness” (Pandit et al.,
2014). The most recent NAP5 (5th National Audit Project) used a patient reporting system of
accidental AWR over a one year time period and reported an incidence of certain or probable and
possible AWR cases of 1 out of every 19,600 anesthetics (Pandit et al., 2014). The NAP5
project is different from the other previously described studies since this was a self-reporting
system by the patient with no specific constraints on the time of the report in relation to the
operation and no formal interviews conducted.
Data derived from internal quality assurance or improvement programs have also been
retrospectively analyzed to determine the incidence of anesthesia AWR. Pollard et al. used data
from a quality improvement program over a three year period (2002-2004) at eight locations to
investigate the incidence of AWR (Pollard et al., 2007). Patients were interviewed within a 48
hour window after GA. They reported a far lower incidence of awareness across the 8
participating centers: 0.0068% or 1 of every 14,560 patients (Pollard et al., 2007). Mashour et
3
al. in turn also reviewed three years of quality assurance data at a large academic institution
(Mashour et al., 2009c). Patients were interviewed on post-operative day one following
anesthesia by a member of the anesthesia team or a nurse via a postoperative interview. Patients
were not specifically asked about AWR but rather a general open ended question regarding
problems with anesthesia. They found a higher incidence than Pollard et al. (2007) of 0.023% or
1 of every 4,401 patients (Mashour et al., 2009c). Mashour et al. highlighted that the
retrospective approach was likely insufficient for optimal capture of awareness events (Mashour
et al., 2009c). Mashour et al. resolved the controversies in the literature regarding AWR
incidence by comparing prospective, structured interviews and spontaneous patient reports in a
single cohort. They found a significantly higher capture for awareness events with structured
interviews (Mashour et al., 2013).
In the United States there are approximately 21 million patients that receive general
anesthesia per year, which equates to 20,000 to 40,000 associated cases of AWR (JACHO,
2004). Even though AWR is a low incidence event, due to the large number of general
anesthetics performed each year there is a significant number of patients adversely affected. The
literature states a complex list of experiences reported by patients during the awareness event
including: auditory perceptions, visual perceptions, tactile stimuli, pain, paralysis, helplessness,
anxiety, fear, extreme panic, terror and feeling of abandonment (Cook et al., 2014; Domino et
al., 1999; Ghoneim et al., 2009; Moerman et al., 1993; Osterman et al., 2001; Schwender et al.,
1998). After the event, patients report anxiety, nightmares, unpleasant dreams, flashbacks, and
post-traumatic stress disorder (PTSD) (Cook et al., 2014; Domino et al., 1999; Ghoneim et al.,
2009; Moerman et al., 1993; Osterman et al., 2001; Schwender et al., 1998). The Joint
Commission on Accreditation of Hospital Organizations reviewed the literature on AWR and

4
reported 48% related to auditory stimuli, 48% percent related to the sensation of not being able
to breathe and 28% related to pain (JACHO, 2004). Several small cohort samples have also been
reported in the literature. Moerman et al. noted that 70% of the patients studied experienced
sleep disturbances, nightmares, flashbacks and anxiety due to the awareness experience
(Moerman et al., 1993). Schwender et al. (interviewed 45 awareness patients from Germany and
noted that 22 of the 45 patients experienced negative unpleasant effects after the event
(Schwender et al., 1998). Mashour et al. have developed a classification instrument to aid the
analysis of qualitative experiences, as well as the experience of distress during an anesthesia
awareness event (Mashour et al., 2010).
Patients who do experience explicit awareness have reported significant psychological
sequelae including posttraumatic stress disorder (PTSD). PTSD is developed after a traumatic
experience and has three significant components; re-experiencing of the event, avoidance of cues
or triggers related to the event, and physiological hyperarousal (Osterman et al., 2001; Whitlock
et al., 2014). There is significant emotional, social, and economic impact of patients with
psychological sequelae following an intraoperative AWR event and therefore the need to
minimize such events (although rare) is important in the medical community. From a small
cohort report of awareness patients, PTSD was shown in 3 of 45 patients (Schwender et al.,
1998). The patients were interviewed on average 0.84 years (range 0.1-5.0) after the AWR event
(Schwender et al., 1998). Osterman et al. sought to determine the development of PTSD after
AWR by investigating 16 AWR patients and 10 control patients (Osterman et al., 2001). All
patients were administered the Clinician Administered PTSD Scale (CAPS) (Blake et al., 1995).
CAPS scores patients on a scale from 0 to 136 (Blake et al., 1995). A score 45 or greater meets
the diagnostic criteria for PTSD (Blake et al., 1995). Osterman et al. found that 56.3% of the

5
AWR patients and no control patients met the diagnostic criteria for PTSD (Osterman et al.,
2001). Of the PTSD patients, the patients met the criteria with an average 17.9 years after the
event (Osterman et al., 2001). Three factors were significantly associated with developing
PTSD; intraoperative experience “that you left your body at some point” and “that at some point
you could mentally escape” as well as postoperative feeling “that you left your body at some
point” (Osterman et al., 2001). Osterman et al. and Schwender et al. both determined that
patients experience PTSD years after the actual awareness event (Osterman et al., 2001;
Schwender et al., 1998). Leslie et al. further validated the high incidence of PTSD after
awareness and showed an incidence of 71% (Leslie et al., 2010). The Psychological Sequelae of
Surgery (Psych SOS) study used a cohort of AWR patients from three large clinical trials
investigating the prevention of AWR with control patients on age, sex, type of surgery, and risk
of AWR (Whitlock et al., 2014). A total of 68 AWR patients were matched with 418 control
patients and were administered the PTSD Checklist-Specific (PCL-S) and/ or the modified Mini
International Neuropsychiatric Interview with a median time of two years past the date of the
operation. These techniques were aimed at identifying patients that exhibited symptoms of
PTSD (Whitlock et al., 2014). Whitlock et al. demonstrated 43% of patients with AWR met the
criteria for PTSD using the PCL-S and 14% of the AWR patients scored consistently with the
DSM-IV diagnosis of PTSD (Whitlock et al., 2014). More recently, the NAP5 reported that 47%
of their self-reported AWR cases were associated with distress to the patient (Cook et al., 2014).
Since the NAP5 is the most recent study on negative experiences of patients that experience
AWR, the actual incidence of PTSD is unknown. However, the authors did state that via patient
self-report experiences of “re-experiencing the event through ‘flashbacks’ and nightmares,
hyperarousal (increased anxiety, sleep disturbances) and avoidance” (Cook et al., 2014).
6
Therefore, it is not unreasonable to conclude that some of these patients have or will develop
PTSD after the AWR event. Thus, there are serious consequences to AWR that highlight the
need for its prevention.
To date no prospective large scale clinical trials have been performed to determine
independent risk factors for an AWR event. However, quality assurance closed claims databases
have been examined to try to identify such risk factors retrospectively. Domino et al. reviewed
the national database from the American Society of Anesthesiologists Closed Claims Project
(Domino et al., 1999). This database is a compilation of closed medical claims from the United
States. Although this not an inclusive list of all AWR cases seen in the United States it is
representative of the type of patients who seek a malpractice claim. Of the 4,183 claims
reviewed, 1.5% were due to a complaint of awareness (Domino et al., 1999). Women (77%) and
patients under 60 years of age (89%) were more likely to file an AWR claim (Domino et al.,
1999). The majority of patients (68%) who filed an AWR claim were healthy (American Society
of Anesthesiologists class I or II on a I-V scale) and undergoing elective surgery (87%) (Domino
et al., 1999). After review of the medical records that were available, Domino et al. determined
that 33% of the AWR patients received standard of care while a surprising 43% received sub-
standard care (Domino et al., 1999). A logistic regression model was developed to look for
independent risk factors associated with malpractice claims of AWR. They found that using no
volatile anesthetic (adjusted odds ratio (AOR) 3.20 95% confidence interval (CI) 1.88-5.46),
female gender (AOR 3.08, 95% CI 1.58-6.06), intraoperative opioid use (AOR 2.12, 95% CI
1.20-3.74) and intraoperative muscle relaxant use (AOR 2.28, 95% CI 1.22-4.25) were
independent predictors of AWR claims (Domino et al., 1999). Although these data are
interesting, Domino’s work is limited to only those cases that actually filed a complaint and
7
therefore is not a complete picture of all types of patients who have had an experience of AWR
and therefore the independent predictors may not translate to a representative sample. More
recently, NAP5 also contributed to the literature potential risk factors based on the 300 self-
reported events of AWR. They noted that factors that may pre-dispose a patient to AWR were:
females (65% of reports), younger adults, obesity (3-fold effect), level of training of the
anesthesiologist, history of awareness during a previous anesthetic, operations not occurring
during normal business hours, emergent operations, obstetric surgery, cardiothoracic surgery,
and the use of neuromuscular blockade agents during the operation (Pandit et al., 2014). Due to
the small sample size of AWR patients within the NAP5, no predictive modeling could be
performed. However, when comparing Domino’s study using closed claimed data and the NAP5
both female sex and the use of neuromuscular blockade during the case are documented as
potential indicators that put patients at risk for AWR.
Since so little is known about the mechanisms, true incidence, and risk factors of
anesthesia awareness, the Joint Commission on Accreditation of Hospital Organizations issued a
sentinel event on anesthesia awareness in 2004 and noted that “Anesthesia awareness is under-
recognized and under-treated in health care organizations” (JACHO, 2004). The Joint
Commission recommends the development and implementation of AWR policies to educate
clinicians, develop a risk profile to determine high risk patients, and discuss the risk factors with
patients prior to undergoing anesthesia. They also recommend use of effective anesthesia
monitoring tools and appropriate post-operative follow-up by the anesthesiology team for all
patients that undergo a general anesthetic. For patients that do have a documented explicit AWR
event, the Joint Commission recommends the facilitation of proper counseling avenues. In 2006,
the American Society of Anesthesiologists (ASA) followed the Joint Commission and developed
8
a task force to “stimulate the pursuit and evaluation of strategies that may prevent or reduce the
frequency of intraoperative awareness and provide guidance for the intraoperative use of brain
function monitors as they relate to intraoperative awareness” (ASA Task Force, 2006).
Causes of Intraoperative Awareness
There are several main causes of AWR documented in the literature from previously
described cases; overly “light” anesthesia (87% of AWR cases), increased anesthetic
requirements (7% of AWR cases) and malfunction (5% of AWR cases) or misuse of anesthesia
delivery systems (4% of AWR cases) (Ghoneim et al., 2009). The NAP5 also introduced several
additional potential causes of AWR; the use of neuromuscular blocking drugs (93% of AWR
cases) without the use of a nerve stimulator to monitor the actual muscular blockade (9% of
AWR cases used the nerve stimulator), type of anesthetic agents used to induce GA, and total
intravenous anesthesia (Pandit et al., 2014).
Light anesthesia is necessary in some types of surgical cases (such as trauma) or when
the patient is not medically tolerant of the anesthetic dose but the operation is emergent
(Ghoneim, 2010). However, light anesthesia can also occur by error in the delivery system with
either mechanical malfunction or the clinician not being aware that there is insufficient
anesthetic delivery (Ghoneim, 2010). Situations associated with an inability to tolerate normal
doses of anesthesia include high risk patients (ASA class IV or V), hypovolemia, patients with
limited cardiac reserve, cardiac or trauma operations, and cesarean sections (Ghoneim, 2010).
Some patients require higher than normal anesthetics requirements. Age and
hypothermia affect the minimum alveolar concentration (MAC), which is commonly used as a
tool to determine adequate anesthesia. The MAC decreases by approximately 6% per decade of

9
age (Mapleson, 1996). MAC was also determined to be lower for two commonly used inhaled
anesthetics (halothane and isoflurane) in hypothermic piglets (Satas et al., 1996). Recently a
distinct phenotype (red hair) has been linked to a specific genotype demonstrating that red-haired
patients require significantly more inhaled anesthetic requirements (desflurane) than dark-haired
patients (Liem et al., 2004). Smith et al. found that rodents showed a rapid tolerance to the
inhalational anesthetic nitrous oxide, a phenomenon referred to as tachyphylaxis (Smith et al.,
1979). Research on rodents has also shown that chronic exposure to sub-anesthetic doses of
nitrous oxide causes tolerance, which is no longer seen six days after the termination of exposure
(Koblin et al., 1979). For humans, an acute tolerance to nitrous oxide within 10 to 60 minutes of
administration was shown in some patients but the reason was not clear (Ramsay et al., 1992).
From the pharmacologic perspective, chronic alcohol and opioid use also increase requirements
(McQuay et al., 1982; Shafer et al., 1983; Tammisto and Takki, 1973). Tammisto and Takki
reviewed the records of 151 chronic alcoholics and determined that they required higher doses of
anesthetics and also 20% of the patients exhibited signs of inadequate anesthesia (Tammisto and
Takki, 1973). Arguably, the most important reason for a patient’s increase for anesthetic
requirements is a history of AWR (Aranake et al., 2013; Ghoneim et al., 2009). Aranake et al.
demonstrated a relative risk of 5.0 (95% Confidence Interval 1.3-19.9) to experience another
AWR event when a patient had a history of AWR (Aranake et al., 2013). Patients with a history
of AWR from three clinical trials focused on AWR prevention were matched with patients who
did not have a history (Avidan et al., 2011; Avidan et al., 2008; Mashour et al., 2012);
importantly, the control group patients also had at least one risk factor for AWR.
The malfunction or misuse of anesthesia delivery systems are generally due to either lack
of servicing, neglect of the care provider to check for proper machine functionality prior to use,

10
and lack of vigilance by the anesthesia care provider. Increased vigilance of the anesthesia care
provider has been shown in one study to decrease the incidence of AWR in cardiac surgery
patients (Ranta et al., 1996). Ranta et al. performed a two phase study to address vigilance and
anesthesia awareness (Ranta et al., 1996). In phase one, patients were interviewed to determine
the incidence and identify the patients who experienced AWR. These findings were reported
back to the care providers for high risk cardiac patients including the administration of
anesthetics given. For phase two of the study they interviewed patients for documented AWR
and noted a decrease in the incidence from 4% to 1.5% between the two phases (Ranta et al.,
1996). Ranta et al. concluded that with education and increased vigilance the documented
incidence rate in a high risk population can be decreased (Ranta et al., 1996).
There are also several risk factors in addition to the stated known causes that also will put
a patient at increased risk for AWR: duration of laryngoscopy and intubation, history of difficult
intubation or anticipated difficult intubation, chronic pain patient presenting using high dose
opioids, planned use of relaxants during the maintenance of GA, absence of volatile anesthetic or
propofol use during maintenance of anesthesia (Ghoneim et al., 2009) and total intravenous
anesthesia (ASA Task Force, 2006; Ghoneim, 2010; Pandit et al., 2014).
Techniques for Monitoring Anesthetic Depth: MAC and EEG
The first public demonstration of a surgery under GA occurred in 1846 and
approximately one year later the “stages” of GA were described by Snow. The stages of
anesthesia essentially used the patient as the “monitor,” basing anesthetic depth on respiratory
patterns, muscle tone, and pupillary responses. Because the stages of anesthesia were

11
qualitative, the potency of anesthetic drugs could not be readily compared to one another
(Mashour, 2006).
In 1965 a turning point for modern anesthesia arose with the concept of minimum
alveolar concentration (MAC). MAC was developed as a way to quantify the anesthetic effect of
inhalational agents (Eger et al., 1965). MAC is defined as the minimum alveolar concentration
of inhaled anesthetic that will prevent movement from a noxious stimulus in 50% of subjects
(Eger et al., 1965). This concept worked well to quantify differences between different
inhalational anesthetics (anesthetic vapors), as potency could be related to a single behavioral
endpoint.
MAC is defined in terms of one atmospheric pressure and serves as an indicator for the
concentration of the anesthetic (Gelb, 2009). Specifically, the MAC represents the partial
pressure of the inhaled anesthetic vapor in the alveoli of the lungs (Gelb, 2009; Quasha et al.,
1980). When the partial pressure of any vapor is at equilibrium in the body, all tissues of the
body will have the same partial pressure of the vapor, including the alveoli of the lung, the brain,
and the blood (Quasha et al., 1980). Therefore, the MAC is a representation of the partial
pressure of the vapor in the brain but not the actual concentration of the vapor (Quasha et al.,
1980). However, the measurement of the expired partial pressure of the anesthetic vapor is
proportional to the actual anesthetic concentration affecting the brain of the specific anesthetic
vapor (Gelb, 2009).
12
To calculate the MAC for a specific time-point for a specific inhaled anesthetic vapor:
(Eger, 2001; Gelb, 2009; Quasha et al., 1980).
MAC = End-tidal expired partial pressure (captured by the attached gas analyzer) Known MAC value constant for that specific inhaled anesthetic vapor
The MAC for each specific inhaled anesthetic vapor is set for the age of 40. However,
MAC decreased by decade of life and therefore the MAC is age adjusted depending on the age of
the patient (Eger, 2001; Gelb, 2009; Mashour et al., 2009a; Quasha et al., 1980).
Some common limitations of MAC are: neuromuscular blockade that is commonly used
during surgery obscures the behavioral endpoint of MAC, MAC is specific to inhaled agents, and
anesthetic effects on mobility are mediated
in the spinal cord rather than the brain
(Mashour, 2006). In regards to anesthetic
monitoring to minimize the probability of
consciousness, MAC is not directly related
to the neuroanatomic substrate of
consciousness (Mashour, 2006). However,
MAC monitoring is the standard of care
currently for measuring depth of anesthesia.
Since MAC has limitations, this has led to a
renewed interest in electroencephalographic
(EEG) assessment of anesthetic depth, which was suggested by Gibbs et al. in 1937 (Gibbs,
1937).

13
EEG monitoring was the next logical step for assessing anesthetic depth because while
MAC is a pharmacologic measure, the EEG reflects activity of the end-organ of interest, the
brain. The EEG signal on the scalp is from the synaptic activity of the pyramidal cells in the
superficial layers of the cerebral cortex (Figure 1) (Olejniczak, 2006; Rampil, 1998; Sloan, 2006;
Teplan, 2002; Walczak, 2009). Pyramidal cells are a major neuronal cell type in the cortex.
They have a long straight dendrite that extends from the cell body up through the cortical layers
directly to the surface of the pial surface of the gyrus (Jameson and Sloan, 2006; Rampil, 1998;
Teplan, 2002; Walczak, 2009). If the neighboring pyramidal cells have similar altered
membrane potentials they combine additively in the extracellular fluid to create a larger current
flow that is detected on the scalp (Olejniczak, 2006; Rampil, 1998; Sloan, 2006; Teplan, 2002;
Walczak, 2009). Therefore, pyramidal cells can be affected by other local synaptic activity as
well as from other neural activity, specifically from the thalamus (Jameson and Sloan, 2006;
Sloan, 2006; Teplan, 2002; Walczak, 2009). The EEG electrodes on the scalp register changes
in voltage, which can fluctuate with changes in the current that flows between the dendrites and
the cortical pyramidal cells (Olejniczak, 2006; Sloan, 2006; Teplan, 2002; Voss and Sleigh,
2007; Walczak, 2009). The voltages are attenuated and smeared by the passage through the
cranium and the scalp, which in turn will allow higher voltages to become dominant readings on
the EEG (Voss and Sleigh, 2007). Therefore, the EEG monitors used for depth of anesthesia
monitoring report a frequency-distorted measure of mean dendritic currents of cortical pyramidal
neurons (Sloan, 2006; Teplan, 2002; Voss and Sleigh, 2007; Walczak, 2009).
There are five EEG frequency bands that are influenced by anesthetic administration:
gamma, beta, alpha, theta and delta. Gamma waves (25-50 Hz) are traditionally associated with
higher cognition and the processing of sensory stimulation in the awake brain (Jameson and

14
Sloan, 2006; John and Prichep, 2005). Beta waves (12-24 Hz) are traditionally associated with
the alert state (Freye and Levy, 2005; Sloan, 2006). Alpha waves (8-12 Hz) are seen when
patients are awake but with their eyes closed or in a relaxed state (Freye and Levy, 2005;
Jameson and Sloan, 2006; Sloan, 2006; Teplan, 2002). Theta waves (4-8 Hz) are normally seen
in sleep (Freye and Levy, 2005; Jameson and Sloan, 2006; Sloan, 2006). Delta waves (below 4
Hz) are traditionally demonstrated in deep sleep (Jameson and Sloan, 2006; Sloan, 2006).
The changes in EEG patterns are drug specific and not consistent across all anesthetics.
Numerous studies have been conducted to determine how commonly used anesthetics affect the
EEG. Long et al. investigated the EEG determinants of 14 patients emerging from GA with
thiopental, nitrous oxide-oxygen, and vecuronium and supplemented either isoflurane (inhaled)
or fentanyl (intravenous) (Long et al., 1989). Patients in the supplemented isoflurane group
showed “obvious changes” in their EEG before the patient responded to verbal commands to
open their eyes (Long et al., 1989). This was not seen in patients supplemented with fentanyl
during emergence of GA (Long et al., 1989). Long et al. concluded that when using isoflurane,
EEG determinants can be used to guide when a patient will emerge from GA but not when a
fentanyl-supplemented GA is used (Long et al., 1989). Drummond et al. investigated the median
frequency, spectral edge frequency, frequency band power ratio, total power, and dominance
shift of the EEG recording to determine if one specific component can be a predictor of the depth
of anesthesia during the emergence phase from isoflurane-nitrous oxide based anesthesia in 15
surgical patients (Drummond et al., 1991). The conclusion was that no one specific component
of the EEG can be used as predictor for the depth of anesthesia and that at best, the EEG
components can only be used as a trend when used in conjunction with other commonly used
clinical signs to measure the depth of anesthesia (Drummond et al., 1991). Sebel et al.

15
investigated movement on surgical incision (noxious stimuli) in patients with GA induced with
thiopental but maintained with three different MACs of isoflurane and found that for patients
who did not move, there was a statistically significant difference in their delta power on the EEG
(Sebel et al., 1995). Rundshaen et al. further validated the change in the delta power on the EEG
during intubation (noxious stimuli) when thiopental and fentanyl were used (Rundshagen et al.,
2004). Sakai et al. sought to investigate the use of ketamine and propofol infusions in 48
patients. Patients received either propofol infusion or ketamine plus propofol infusion in varying
doses. They concluded that when ketamine is included with propofol, less propofol is needed to
have clinical significant endpoints for hypnosis (Sakai et al., 1999). Although the addition of
ketamine decreases the dose of propofol to reach hypnosis endpoints, it did not depress the EEG
in proportion to the hypnotic effects (Sakai et al., 1999). Gamma waves were shown to be
significantly decreased when propofol induction was used in surgical patients, whereas ketamine
had the opposite effect (Lee et al., 2009). Ketamine increased the power in the gamma
bandwidth and decreased the power in the alpha wave on the EEG (Lee et al., 2013). In human
subjects, alpha oscillations appear prominently in the occipital lobe in the resting state with eyes
closed. However, alpha power and coherence is reduced in the occipital lobe and increased in
the frontal lobes in association with propofol-induced unconsciousness (Purdon et al., 2013).
This reverses with return of consciousness. Propofol and sevoflurane, when used as a GA for
maintenance of anesthesia, both demonstrated alpha oscillations on the EEG (Akeju et al., 2014).
Sevoflurane, but not propofol, demonstrated increased power in the theta component of the EEG
(Akeju et al., 2014). The evidence presented suggests that there is not one specific component
of the EEG that changes uniformly under anesthesia that could serve as the sole predictor of the

16
depth of anesthesia. Therefore, when using the EEG, either processed or un-processed, the type
of anesthetic used must be considered when interpreting the relevant changes in the EEG.
EEG Transformation to Bispectral Analysis for Anesthesia Depth Monitoring
The EEG is one of several voltage waveforms present on the scalp of a patient. In the
awake patient there is an electrocardiogram (ECG) from the carotid artery in the neck,
electromyography (EMG) from the muscles of the face, and electrooculography (EOG) from the
muscles around the eye. The patient’s body also acts as an antenna and the different voltage
waveforms interact with the EEG. Therefore, a well-designed amplifier is needed to remove or
attenuate the unwanted signals. For example, the EMG has some overlap with the EEG in the
gamma bandwidth. To rectify this, the raw EEG tracing is amplified and then put through a
band-pass filter to quantify and separate the EEG from the EMG. Some depth of anesthesia
monitors report the EMG with the EEG.
Signal processing is mandatory to remove any artifacts that are attributable to other
electrical activities. For the EEG, an analog signal must be transformed into a digital signal. By
definition, analog signals are continuous and smooth where digital signals represent discrete
points in time and the values are set to a specific time point (Rampil, 1998). The EEG varies
smoothly over a set time and is therefore an analog signal on the scalp (Rampil, 1998). When an
analog signal is translated to digital, it occurs at a specific time point (sampling interval) which is
known as sampling or digitizing (Figure 2) (Schwilden, 2006). There is a loss of fidelity of the
smooth continuous EEG signal when digitizing occurs at set specific time points. The number of
time points is selected using a sample rate (expressed in hertz (Hz)) which is the reciprocal of the
sampling interval (Rampil, 1998). The sampling interval is determined using Nyquist-Shannon’s
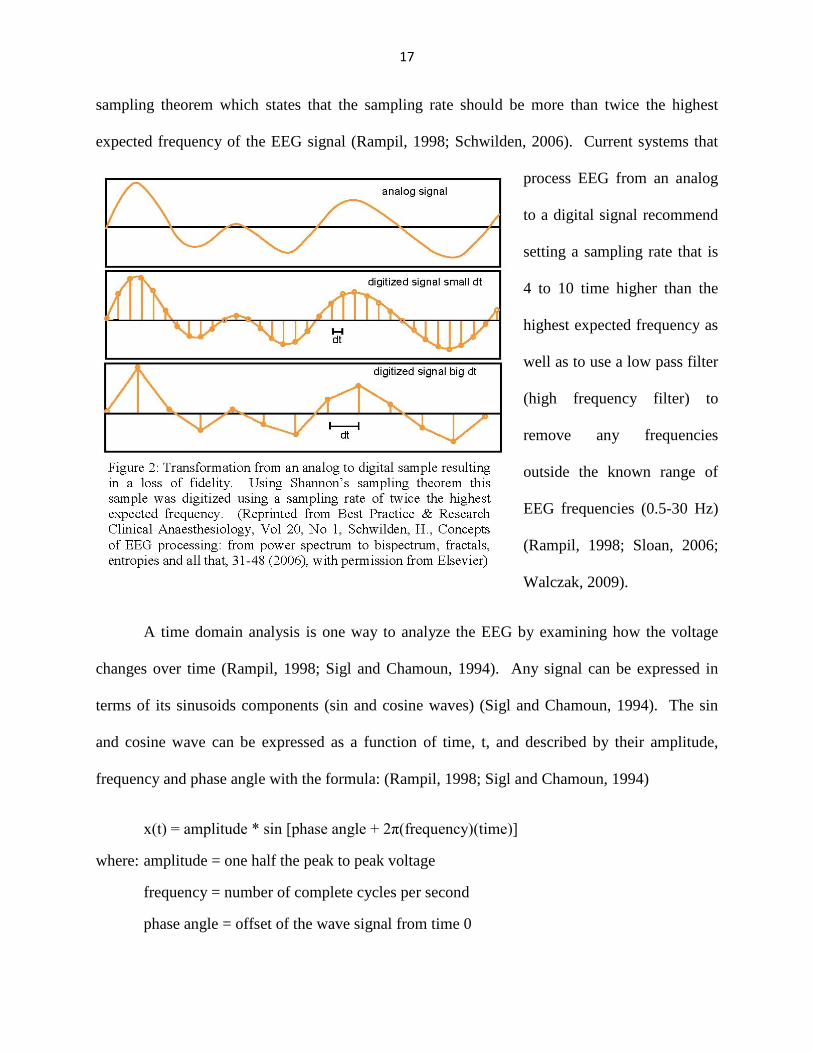
17
sampling theorem which states that the sampling rate should be more than twice the highest
expected frequency of the EEG signal (Rampil, 1998; Schwilden, 2006). Current systems that
process EEG from an analog
to a digital signal recommend
setting a sampling rate that is
4 to 10 time higher than the
highest expected frequency as
well as to use a low pass filter
(high frequency filter) to
remove any frequencies
outside the known range of
EEG frequencies (0.5-30 Hz)
(Rampil, 1998; Sloan, 2006;
Walczak, 2009).
A time domain analysis is one way to analyze the EEG by examining how the voltage
changes over time (Rampil, 1998; Sigl and Chamoun, 1994). Any signal can be expressed in
terms of its sinusoids components (sin and cosine waves) (Sigl and Chamoun, 1994). The sin
and cosine wave can be expressed as a function of time, t, and described by their amplitude,
frequency and phase angle with the formula: (Rampil, 1998; Sigl and Chamoun, 1994)
x(t) = amplitude * sin [phase angle + 2π(frequency)(time)]
where: amplitude = one half the peak to peak voltage
frequency = number of complete cycles per second
phase angle = offset of the wave signal from time 0

18
Complex EEG waveforms which may represent all five common frequencies bands can
be transformed from the time domain to a frequency domain using Fourier transformation (or
spectral analysis) based off of Fourier’s
Theorem (Rampil, 1998; Sigl and
Chamoun, 1994; Tonner and Scholz, 2006).
Fourier’s Theorem allows any waveform to
be shown as the sum of its respective sin
waves with different frequencies,
amplitudes, and phase angles (Walczak,
2009). The Fourier Transformation is
composed of discrete points that correspond
to a specific frequency (Equation 1) (Sigl
and Chamoun, 1994). The range of the
frequency for equation one is determined by
the sampling rate (ƒs) and will span from a
frequency of 0 to ƒs/2 (Sigl and Chamoun,
1994). Every component frequency will
have a power. The frequency domain
transformation is normally presented graphically as the magnitude of the frequency that
component contributed to the signal (or power). The power of each component is then used to
compute the power spectrum (Equation 2) (Sigl and Chamoun, 1994). The result of the Fourier
transformation, with the power spectrum, is the generation of a frequency spectrum as a function
of power (Figure 3), which will allow the user to quantify the extent to which frequency

19
components are present in the EEG signal (Freye and Levy, 2005; Rampil, 1998; Sigl and
Chamoun, 1994; Tonner and Scholz, 2006). Fourier transformation is quite laborious, even with
a computer, so in 1965 Cooley
and Tukey published an algorithm
for Fourier series computation of
digitized data, which was called
Fast Fourier Transformation and
is now used for processing of
EEG signals (Freye and Levy,
2005; Rampil, 1998).
Since the EEG is a
complex signal and is non-linear
in nature, one sinusoid
component may interact with
another sinusoid component and
therefore is not a function of just
one frequency. This interaction
is referred to as phase coupling.
For example, assume a simple
non-linear system where the
output is the square of the input
signal (Equation 3) (Sigl and
Chamoun, 1994). In the output, (ƒ1 + ƒ2), (ƒ1 - ƒ2), 2ƒ1, and 2ƒ2 are all dependent on the input

20
signal ƒ1 and ƒ2. Therefore, these are termed intermodulation products (IMP) (Sigl and
Chamoun, 1994). The corresponding phase angles of the IMP output signal are also dependent
on the input signal and are termed phase coupled. Phase coupling implies that the sinusoidal
components may have a common generator (Rampil, 1998). Phase coupling is typical in the
brain and you can use the degree of phase coupling to investigate relationships in changes to the
level of sedation seen with the use of anesthetics. To quantify the amount of phase coupling in
the system, a bispectral analysis is performed, which reflects the phase coupling across two
frequencies (Hagihira et al., 2001).
The bispectrum of the EEG measures the correlation of phases between different
frequency components and quantifies the relationship among three sinusoidal frequencies (the
triplet): frequencies ƒ1
and ƒ2 and modulation
component at frequency
ƒ1 + ƒ2 (Rampil, 1998;
Sigl and Chamoun,
1994). For each triplet,
the bispectrum,
B(ƒ1,ƒ2), is calculated based on the Fourier transformation (Equation 4) (Rampil, 1998; Sigl and
Chamoun, 1994). When computing the bispectrum, the signal is divided into relatively short
epochs for calculation and then averaged over a number of epochs to provide a stable estimate of
the true bispectral values (Rampil, 1998). Therefore, the bispectrum reflects the phase coupling
between the component sinsuoids as well as the power information (Rampil, 1998; Sigl and
Chamoun, 1994).
21
At any specific frequency you can have a single sinusoid component or intermodulation
products resulting from phase coupling. There is no way for the system to tell them apart from
one another, but the interest really lies in how much phase coupling is in the signal. Therefore,
to quantify the amount of phase
coupling in the signal, the
bicoherence is needed. To
calculate the bicoherence, you
first need to calculate the
maximum amount of phase
coupling that is possible. This
is referred to as the real-triple
product (RTP) (Equation 5)
(Sigl and Chamoun, 1994). The
bicoherence (BIC) is therefore
calculated as a ratio of the
actual amount of phase coupling
in the system (bispectrum) to
the square root of the maximum
amount of phase coupling possible (RTP) (Equation 6) (Sigl and Chamoun, 1994). The
bicoherence is presented as a percentage of phase coupling from 0% to 100% (Sigl and
Chamoun, 1994). Figure 4 is a representation of the signal transformation from a time domain,
to frequency domain, to bispectrum analysis of a patient prior to induction of anesthesia.

22

23
Calculation of the Burst Suppression to be Used in Anesthesia Depth Monitoring
During levels of deep
anesthesia, burst suppression
is seen in the time domain
signal; an EEG morphology
that—unlike other features
of the EEG during
anesthesia—is not observed
during natural sleep. Burst
suppression is defined as
periods of high or normal
voltage alternating to
periods of time with low or
isoelectric voltages (Rampil, 1998; Sigl and Chamoun, 1994; Tonner and Bein, 2006).
Burst suppression is induced by large doses of anesthetic and can be quantified by
reporting the burst suppression ratio (Figure 5) (Rampil, 1998; Sarkela et al., 2002; Tonner and
Bein, 2006). The burst suppression ratio equals the total time of burst suppression divided by the
epoch length used to analyze the sample (Sarkela et al., 2002).
Calculation of the Bispectral Index based on EEG Transformation
The Bispectral Index (BIS) is a complex parameter that is composed of a time domain
(burst suppression analysis), frequency domain (power spectrum, bispectrum interfrequency
phase relationships) and high order spectral subparameters and is proprietary in nature
(Johansen, 2006; Rampil, 1998). To calculate the BIS, based on the EEG transformation

24
principles discussed earlier, the EEG is filtered to exclude the high and low frequency artifacts of
the signal (Rampil, 1998). After the first filter pass, the signal is divided into epochs of 2
seconds in length (Rampil, 1998). There are a series of algorithms that the signal is processed
through with the goal to remove or ignore artifacts (Rampil, 1998). These algorithms can
remove ECG or pacemaker spikes from the signal and interpolate the missing EEG data. These
epochs can therefore still be used in the processing of BIS. Eye blinking from the EOG is
considered noise and is excluded from the analysis. The remaining epochs are then checked for
low-frequency electrode noise and if some are
detected another filtering process is applied to reject
the low frequencies. The variance is also calculated
for each epoch of the EEG (Rampil, 1998). The
variance of a specific epoch is investigated by
looking at the average of the previous recent epochs
of the raw EEG waveform. If there is a difference,
the new epoch will be marked as noisy and discarded
from the analysis; however, that epoch variance will
be incorporated into making a new updated average.
This change in the running average of the epoch
variances will allow for a slow adaptation to changes
of new variances. Once the EEG epoch is artifact
free or corrected, the degree of burst suppression is
calculated using the time domain of the epoch. The
degree of burst suppression calculation into the BIS

25
is done with two separate algorithms; burst suppression ratio (BSR) as described earlier and
QUAZI suppression index (detects burst suppression in the presence of wandering baseline
voltages) (Rampil, 1998). Next, the waveform data are ready to be converted to the frequency
domain per the Fast Fourier Transformation processes and the bispectrum is calculated. The
actual calculation of the BIS number is a proprietary combination of the EEG subparameters
already explained. The BIS value was derived from experimental data on approximately 5,000
hours of recording on 1,500 anesthetics that varied in the mode and type of drug given (Sigl and
Chamoun, 1994). The BIS reports a dimensionless number from 100 (awake) to 0 (isoelectric)
that decreases continuously with decreasing levels of consciousness and that incorporates the
power, frequency, beta activation, burst suppression, and bicoherence (Figure 6) (Gelb, 2009;
Johansen and Sebel, 2000; Rampil, 1998). The BIS that is presented to the observer is an
average value that is derived from the previous 60seconds of usable data (Rampil, 1998).
BIS Placement
Clinically, the BIS was
approved by the Food and
Drug Administration for
human subjects use in 1996
and uses a series of four
electrodes that are placed
along the forehead of the
patient according to the
international 10-20 electrode
nomenclature placement to monitor two channels of the EEG in a proprietary ipsilateral frontal-
26
temporal montage configuration (Figure 7 and Figure 8) (1991; Johansen, 2006; Teplan, 2002;
Watson et al., 2008). The four electrodes are placed on different coronal lines of the brain:
frontoparietal (FPz amd FP1), anterior frontal (AF7) and frontotemporal (FT9) (1991; Johansen,
2006). The sensor placed on AF7 (lead 4) is the grounding electrode and measures the
electromyography of the frontalis muscle of the
forehead (Johansen, 2006). The electrodes are
placed in a montage configuration that allows for
amplification of electrical activity in the brain based
on a pair of scalp electrodes (Sloan, 2006). The
proprietary BIS sensor montage is from lead 1 to
lead 3 and lead 2 to lead 3 (Figure 7) (Johansen,
2006). Each electrode is encased in a small plastic
sponge that is embedded in a conductive gel to have
good electrical contact with the patient’s skin. The
electrode impedance can be less than 5kohms if the
skin is prepped via an alcohol wipe prior to
placement (Glass et al., 1997; Rosow and Manberg,
2001). The four electrode configuration allows the monitor to perform an automatic impedance
check (Rosow and Manberg, 2001). The electrodes are connected to the BIS module via a single
cable for display to the clinician.
Anesthetic Effects on the BIS
The BIS is purported to measure a state of the brain and not the concentration of a
specific anesthetic drug. It is therefore necessary to interpret how the BIS value will change

27
depending on the medication type correlated to the sedation level of the patient. The raw EEG
component change with a specific anesthetic, therefore the processed EEG in the BIS value also
reacts differently depending on the anesthetic of choice.
GA is associated clinically with a decrease in the average EEG frequency and the
increase in the average power (Rosow and Manberg, 2001). However, most drugs used in GA
do not have a simple monotonic relationship to dose response in respect to the cases in EEG
frequency and power (Rosow and Manberg, 2001). The Bispectral analysis in the BIS is
advantageous to this situation since it is using the harmonic and phase relationship (bicoherence)
of the EEG.
In 1997, shortly after the approval for patient use, Glass et al. sought to determine the
sedation levels in relationship to the BIS values and drug concentrations in the blood for four
commonly used anesthetics and analgesics: propofol, midazolam, isoflurane, and alfentanil in
healthy volunteers (Glass et al., 1997). Each patient had a recorded BIS value and level of drug
concentration in the blood to correspond to the modified observer’s assessment of
alertness/sedation scale which ranges from 0 (does not respond to noxious stimulus) to 5
(responds readily to name spoken in normal tone) (Glass et al., 1997). Glass et al. determined
that for propofol, the BIS value correlated significantly better to levels of sedation than the blood
concentration (Glass et al., 1997). For midazolam and isoflurane, the BIS value was equally as
effective as the blood concentration levels in predicting levels of sedation (Glass et al., 1997).
No patients lost consciousness from alfentanil and therefore were excluded from the analysis
(Glass et al., 1997). All three subsequent group data were then pooled for BIS values to
determine the BIS value at which unconsciousness was induced. 50% of patients were
unconscious at a BIS value of 67 and 95% of patients were unconscious at a BIS value of 50
28
(Glass et al., 1997). Glass et al. was the first group to prove that BIS may be a valuable tool in
monitoring sedation and unconsciousness in patients under anesthetics. It is therefore common
practice to titrate anesthetics to a BIS value of 40-60 (Glass et al., 1997).
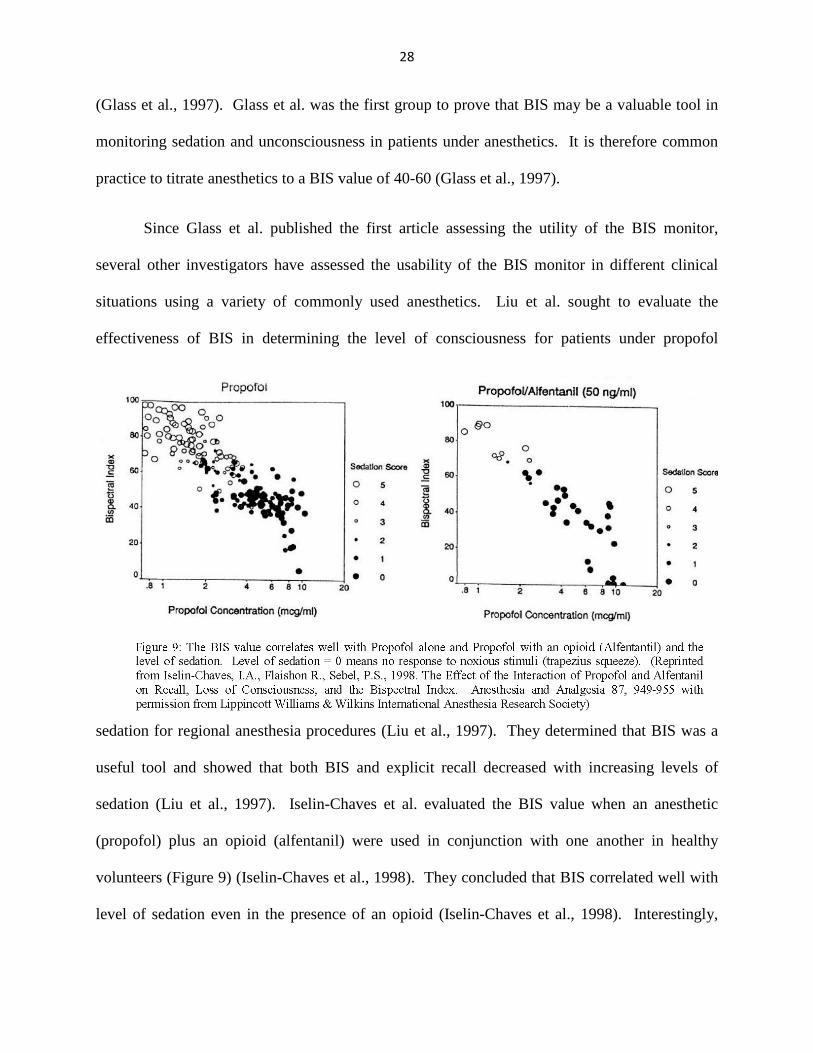
Since Glass et al. published the first article assessing the utility of the BIS monitor,
several other investigators have assessed the usability of the BIS monitor in different clinical
situations using a variety of commonly used anesthetics. Liu et al. sought to evaluate the
effectiveness of BIS in determining the level of consciousness for patients under propofol
sedation for regional anesthesia procedures (Liu et al., 1997). They determined that BIS was a
useful tool and showed that both BIS and explicit recall decreased with increasing levels of
sedation (Liu et al., 1997). Iselin-Chaves et al. evaluated the BIS value when an anesthetic
(propofol) plus an opioid (alfentanil) were used in conjunction with one another in healthy
volunteers (Figure 9) (Iselin-Chaves et al., 1998). They concluded that BIS correlated well with
level of sedation even in the presence of an opioid (Iselin-Chaves et al., 1998). Interestingly,

29
Iselin-Chaves et al. also discovered that BIS responds to painful stimuli by increasing in value
(Iselin-Chaves et al., 1998). However, this response can be ablated by giving opioids or
increasing the propofol concentration to control the pain from the stimuli (Iselin-Chaves et al.,
1998). Nitrous oxide is a commonly used gas during GA and therefore the use of nitrous oxide
as it relates to the BIS value was a necessary area of research. Rampil et al. sought to determine
the effects on the BIS and
EEG when healthy young
adult volunteers where given
nitrous oxide in five different
concentrations (Rampil et al.,
1998). It was determined that
nitrous oxide does cause an
increase in the theta and beta
waves in the EEG, however,
the BIS values did not change
and the volunteers remained
responsive (Figure 10)
(Rampil et al., 1998). Barr et al. shared the interpretation that nitrous oxide does not affect the
BIS values even when the subject is rendered unconscious (Barr et al., 1999). Puri followed up
these finding on nitrous oxide and published a case report on two patients who underwent open
heart surgery with nitrous oxide and isoflurane for anesthesia (Puri, 2001). The BIS values were
high when nitrous oxide was used but decreased when the nitrous oxide was stopped and then
increased again once re-initiated (Puri, 2001). This suggests that perhaps the use of nitrous oxide

30
in conjunction with other inhaled anesthetics may change the BIS values to a higher value and
therefore should not be used to guide a clinician’s decision making process to measure adequate
depth of anesthesia. Sevoflurane, which is another commonly used anesthetic vapor during GA,
did show a decrease in the BIS value when the subject was rendered unconscious (Figure 11)
(Barr et al., 1999).
Although not an anesthetic, the effect of neuromuscular blockade medications on the BIS
must also be understood.
Neuromuscular blockade
agents are commonly used for
part of or the entire surgical
case. Messner et al. sought to
determine the relationship
between electromyographic
activity and the BIS value
(Messner et al., 2003). It was
discovered that fully awake
volunteers had a substantial
decrease in BIS (down to 9)
due to the use of muscle blockade and concluded that BIS may not be a reliable marker for
assessing sedation in patients where neuromuscular blockade is needed (Messner et al., 2003).
Around the same time, investigators hypothesized that BIS monitoring could help to
decrease emergence times from anesthesia since the care provider could titrate the anesthetic to a
targeted BIS value and ensure the patient did not have excessive anesthesia that would delay

31
emergence. Gan et al. developed a prospective trial in which all patients received the same
anesthetic protocol consisting of propofol, alfentanil and nitrous oxide (Gan et al., 1997). Half
of the patients received BIS monitoring titrating anesthetics to reach BIS values between 40 and
60 during the case and half did not. They found that patients in the BIS monitoring groups
received less propofol during the case and had significantly faster recovery times than the
traditional monitoring group (Gan et al., 1997). This could be a potentially important finding to
help with the increasing cost in medical care. However, Yli-Hankala et al. also studied 80
patients undergoing surgery (Yli-Hankala et al., 1999). Half of the patients were randomly
allocated to BIS monitoring and half the patients were monitored per standard of care. Yli-
Hankala et al. also found that the patients receiving BIS monitoring had a decrease in the use of
anesthetics (propofol and sevoflurane) and quicker recovery times but concluded the observed
benefit did not justify the cost of the monitoring system (Yli-Hankala et al., 1999). Johansen et
al. analyzed profiles of 1,552 adult patients emerging from GA on and determined that when the
BIS was targeted and maintained between 50-65, patients had reduced emergence and recovery
times (Johansen et al., 2000). These studies suggest that with BIS monitoring targeted to a
specific value, the patients may need less anesthetic, emerge from anesthesia quicker and having
a faster post-anesthesia recovery profile. However, the results of these small efficacy trials have
not been validated by effectiveness data (Gan et al., 1997; Johansen et al., 2000; Yli-Hankala et
al., 1999).
The BIS monitor, along with other EEG-based modules, has limitations. There are
several commonly used drugs or devices that can interfere with the BIS function in routine
clinical care: use of depolarizing muscle relaxant, activation of electromagnetic equipment or
devices, patient warming systems or planned hypothermia induction (ASA Task Force, 2006).
32
Also, drugs such as ketamine and nitrous oxide have different receptor targets than the more
commonly used GABAergic drugs and may be associated with erroneous values (Jameson and
Sloan, 2006). Rampil et al. determined that although the EEG changes during nitrous oxide
administration for sedation, the BIS value did not change (Rampil et al., 1998). The patient’s
pre-existing co-morbidities may also may confound BIS values. Patients with Alzheimer’s
disease, severe hypoglycemia, cerebral ischemia, and neurologic diseases have been shown to
have lower BIS values (Mashour, 2006; Schnider et al., 1998). Some unforeseen intraoperative
events such as cerebral ischemia or hypoperfusion, gas embolism, and unrecognized hemorrhage
may also produce a rapid change in BIS values even though the anesthetic regimen remained
unchanged (ASA Task Force, 2006).
BIS Prospective Clinical Trials
The correlation of BIS values with sedation levels has been established in healthy
volunteers or in closely controlled trials. However, the utility of the BIS monitor in preventing
AWR had not been addressed until 2004. Since that time there have been three large randomized
trials investigating the utility of BIS when compared to standard of care monitoring in clinical
practice and targeted end-tidal anesthetic concentrations for high risk surgical patients under
general anesthesia: the B-Aware trial, the B-Unaware trial, and the BAG-RECALL trial.
The B-Aware trial assessed whether BIS monitoring decreases the incidence of AWR in
high risk surgical patients compared to standard of care monitoring techniques (Myles et al.,
2004). This was a multi-center double-blinded randomized trial in which patients were randomly
assigned to BIS monitoring or routine care. All patients received GA per their anesthesia care
provider and there were no set anesthetic protocols for the study. All patients received a BIS

33
electrode placed regardless of randomization but only those that were randomized to BIS
monitoring were actually connected to the BIS monitors for intraoperative monitoring. For
patients allocated to the BIS group, anesthesia was adjusted to maintain a targeted BIS value
between 40 and 60 during the surgical case from laryngoscopy (intubation) to surgical closure.
BIS was recorded per the anesthesia care provider every 5 minutes for the first hour and every 10
minutes after the first hour. All patients were interviewed for AWR post-operatively at 2-6
hours, 24-36 hours and 30 days. Any potential AWR patients were further evaluated by a
committee of three experienced anesthesiologists. The patients were coded as awareness,
possible awareness or no awareness. 2,503 patients were enrolled but 40 were excluded due to
various reasons (Myles et al., 2004). All patient baseline characteristics were similar between
the two groups. At the 30 day post-operative interview, the BIS group (n=2, 0.17%) had a
significantly lower incidence of AWR than the standard of care group (n=11, 0.91%) (Myles et
al., 2004). The combination of possible or definite AWR events showed no statistical difference
between the groups: 22 in the BIS group (1.8%) and 27 in the standard of care group (2.2%)
(Myles et al., 2004); however, “possible awareness” cases at that time included patients who
dreamt under anesthesia, which is no longer thought to be a “near-miss” awareness event
(Samuelsson et al., 2008). Myles et al. concluded that their B-Aware trial proved that BIS
monitoring could reduce the relative risk of awareness by 82% (95% CI 17-98%) in high risk
general anesthesia surgical patients (Myles et al., 2004). They also noted that the BIS patients
did not have a significant difference in the time to recover from GA than patients with normal
standard of care monitoring. Although this trial was performed in a routine clinical setting and
therefore the data are generalizable to the high risk surgical population, it is not generalizable to
patients at all risk levels of awareness. Myles et al. therefore suggested the use of BIS

34
monitoring is warranted in patients at high risk of AWR that are undergoing a general anesthetic
(Myles et al., 2004).
The B-Unaware trial assessed whether a BIS-based anesthetic protocol is better than a
protocol based on the measurement of end-tidal anesthetic concentration (MAC) for decreasing
AWR in high risk surgical patients undergoing GA (Avidan et al., 2008). This was a single-
center, prospective study in which consecutively numbered patients were pre-randomized in
blocks of 50 to BIS monitoring or 50 to MAC based monitoring. All patients received the BIS
sensor but for those patients randomized to the MAC group, the clinicians were not able to see
BIS values. MAC was visible to both group’s clinicians during the surgical case. For the BIS
group, an alert sounded if the BIS exceeded 60 or fell below 40; there were no set MAC alerts.
For the MAC group, an alert sounded if the concentrations fell below 0.7 MAC or exceeded 1.3
MAC. BIS and MAC concentrations were recorded every second and data were downloaded
into a computer system for analysis. All patients were interviewed three times (within 24 hours,
between 24-72 hours, and 30 days after extubation) using the Brice awareness interview. Any
patient interview that reported remembering something between “going to sleep” and “waking
up” via the Brice interview was hand-reviewed by an independent panel to determine if the
patient had definite awareness, potential awareness, or no awareness. 2000 patients were
enrolled but only 1941 completed the study due to various reasons; there were 967 in BIS group
and 974 in MAC group (Avidan et al., 2008). The patients in the MAC group had a statistically
significant larger population with underlying neurologic disease than the BIS group (Avidan et
al., 2008). Otherwise, the two groups had similar baseline co-morbidities. The B-Unaware trial
found that four patients had definite AWR; two in the BIS group and two in the MAC group
(Avidan et al., 2008). The overall incidence of definite AWR in this trial is 0.21% (Avidan et al.,

35
2008). Five patients had possible AWR; four in the BIS group and one in the MAC group. The
overall incidence of definite or possible AWR in this trial was 0.46% (Avidan et al., 2008).
Avidan et al. concluded that a structured BIS intraoperative protocol is not superior to a MAC
based monitoring approach nor did it reduce the administration of volatile anesthetic gases when
compared to a protocol based on MAC (Avidan et al., 2008). They noted that the BIS values
were persistently under 60 during the period of awareness for the majority of the definite and
possible AWR cases. Avidan et al. emphasized the point that these data cannot be extrapolated
to patients under total intravenous anesthesia since all patients received volatile agents for this
trial; importantly, approximately 43% of patients in the original B-Aware trial received total
intravenous anesthesia (Avidan et al., 2008). Avidan et al. concluded that BIS based protocol is
not superior to MAC based protocol in preventing AWR (Avidan et al., 2008).
The BAG-RECALL trial expanded upon the B-Unaware methodology in order to
determine definitively whether a BIS guided alerting system is superior to a MAC guided
alerting system in prevention of AWR (Avidan et al., 2011). The investigators prospectively
randomized 6,041 adult patients at high risk for AWR across three surgical centers (Avidan et
al., 2011). All patients received a BIS monitor but those randomized to the MAC guided alerting
system, the BIS values were blinded from the anesthesia provider. For patients randomized to
the BIS guided alerting system, both the BIS values and MAC values were visible to the
anesthesia provider. In the BIS guided group, an audible alarm was generated if the BIS value
when above 60 or fell below 40. There were no alarms set for the MAC values in this group. In
the MAC guided group, an audible alarm was generated if the MAC fell below 0.7 or exceeded
1.3 using an age-adjusted formula, since MAC values change with age. Data were electronically
captured at a minimum of 1 minute intervals. Patients were interviewed for awareness within 72

36
hours after surgery and at 30 days after tracheal extubation. Nine patients were found to have
definite AWR (0.16% incidence) and 27 patients were found to have definite or possible AWR
(0.47% incidence) (Avidan et al., 2011). When investigating the incidence of definite AWR by
randomization group, seven of the nine patients were allocated to the BIS targeted group (Avidan
et al., 2011). Nineteen of the 27 patients who were found to have definite or possible AWR were
in the BIS targeted group (Avidan et al., 2011). It was therefore concluded that alerts based on
BIS values are not superior to MAC-guided alerting system.
The B-Aware, B-Unaware, and BAG-RECALL all show that those patients randomized
to BIS monitoring have similar incidence of AWR (approximately 0.2%), which is lower than
what would be predicted in a high-risk population (approximately 1%). The studies differ in that
the B-Unaware and BAG-RECALL trials suggest that a MAC-based protocol may be as
efficacious as a BIS-based protocol in patients receiving inhaled anesthetics. However, the role
of BIS monitoring in reducing the incidence of anesthesia awareness still needs further
investigation, specifically as it relates to patients at all levels of risk undergoing anesthesia with
both intravenous and inhalational agents.
Decision Support Alerting Systems Driving Provider Actions
An advantage of having a processed EEG signal transformed into a numerical index is
that there is can be a quantitative threshold for decision support alerts to be implemented.
Decision support alerting is relatively new to the medical community and is based upon the use
of an automated clinical documentation system that is programmed to alert clinicians to a
potential adverse event. These alerts are designed to drive a change in clinical practice by
37
making the provider aware of the potential for an adverse event based upon set threshold criteria
for which going above or below could increase risk of patient harm.
Kucher et al. were one of the first investigative teams to use an electronic alert system to
alter an adverse event: venous thromboembolism in hospitalized patients (Kucher et al., 2005).
They hypothesized that electronic alerts sent to the provider would increase the rate at which
patients were administered prophylaxis against deep-vein thrombosis (DVT). The hospital
electronic database was queried in real time for patients at risk of DVT and determined if the
patient was on adequate prophylactic measures. For those patients that did not have adequate
prophylactic measures in place, they were randomly allocated to the clinician receiving an
electronic alert about DVT prophylactic measures or no alert sent to the treating clinician.
Kucher et al. found that the electronic alert reduced the risk of DVT or pulmonary embolism at
90 days by 41% (Kucher et al., 2005). This served as a proof of concept that a simple
programming technique could impact the adverse event rate of patients.
O’Reilly et al. were among the first investigators to use an anesthesia information system
(AIMS) to improve timely administration of prophylactic antibiotics (O'Reilly et al., 2006).
AIMS is an electronic record of all perioperative documentation and monitoring. These systems
can be as simple as having an automated history and physical section or as advanced as having
an intraoperative system that captures electronically all physiological variables, all medications,
and all surgical events. O’Reilly et al. saw a need for timely administration of prophylactic
antibiotics to decrease surgical site infections (O'Reilly et al., 2006). This was accomplished by
programming the AIMS to remind the anesthesiologist to administer the antibiotics within one
hour of the surgical incision. The program tracks the time of surgical incision and therefore
could remind the clinician when one hour had lapsed without an input of antibiotic
38
administration into the system. If the antibiotic was not administered the anesthesiologist was
prompted to answer why. The study was designed so clinician feedback was available and
compliance rates were posted around the operating rooms. Those with poor compliance were
specifically targeted by team members. A manual chart review prior to implementation of the
AIMS showed a 69% compliance rate (O'Reilly et al., 2006). After one year, the compliance rate
increased to 92% (O'Reilly et al., 2006). This study supported the concept that a simple
programming change can affect patient care and decrease adverse events.
Kheterpal et al. the following year at the same institution used the AIMS to improve
compliance for documentation of arterial line placement (Kheterpal et al., 2007). Documentation
of arterial line placement is important to professional fee reimbursement as well as to the need
for completeness of the medical record. Once again the AIMS was programmed into two
groups; the experimental group received alpha-numeric text messages and emails for up to 2
days after a stated operation to document the arterial line and the control group received no text
messages or emails. The AIMS could determine if an arterial line was placed for the patient and
used during the surgical operation and could also determine if a professional note used for fee
reimbursement was drafted into the system. If the patient had the arterial line but not the
professional note for fee reimbursement the case was considered non-compliant. Prior to the
study commencement, there was an 80% compliance rate for documentation. After the
complication of the study, the experimental group showed a 93% compliance rate compared to
an 84% compliance rate in the control group (p<0.001) (Kheterpal et al., 2007). Due to the
statistical increase in compliance, the department decided to implement the system for all
patients, which increased the departmental compliance to 99% and showed a profit of $151,000

39
in professional fee charges (Kheterpal et al., 2007). This study proves that alert systems are
beneficial.
The use of AIMS is now widely adapted across the country which lends itself to
developing and implementing new research technologies that use provider entered point-of-care
comorbidity information on a specific patient into the system and then integrate a risk profile
with the actual dynamic physiologic changes that occur during an operation to alert the clinician
to potential adverse outcomes. The research that has been previous completed using AIMS, has
proved the utility in the framework that the use of an AIMS can drive changes in provider care
and hopefully minimize adverse outcomes in surgical patients. Such technology therefore has
the potential to minimize complications such as intraoperative awareness.
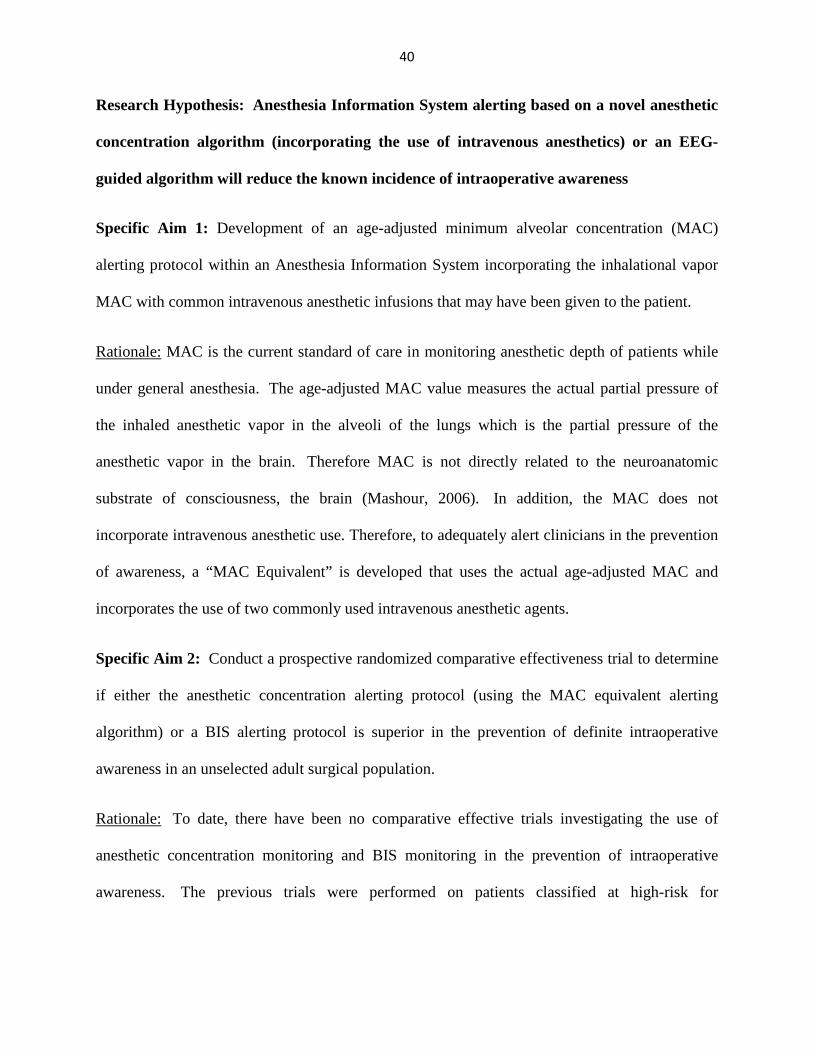
40
Research Hypothesis: Anesthesia Information System alerting based on a novel anesthetic
concentration algorithm (incorporating the use of intravenous anesthetics) or an EEG-
guided algorithm will reduce the known incidence of intraoperative awareness
Specific Aim 1: Development of an age-adjusted minimum alveolar concentration (MAC)
alerting protocol within an Anesthesia Information System incorporating the inhalational vapor
MAC with common intravenous anesthetic infusions that may have been given to the patient.
Rationale: MAC is the current standard of care in monitoring anesthetic depth of patients while
under general anesthesia. The age-adjusted MAC value measures the actual partial pressure of
the inhaled anesthetic vapor in the alveoli of the lungs which is the partial pressure of the
anesthetic vapor in the brain. Therefore MAC is not directly related to the neuroanatomic
substrate of consciousness, the brain (Mashour, 2006). In addition, the MAC does not
incorporate intravenous anesthetic use. Therefore, to adequately alert clinicians in the prevention
of awareness, a “MAC Equivalent” is developed that uses the actual age-adjusted MAC and
incorporates the use of two commonly used intravenous anesthetic agents.
Specific Aim 2: Conduct a prospective randomized comparative effectiveness trial to determine
if either the anesthetic concentration alerting protocol (using the MAC equivalent alerting
algorithm) or a BIS alerting protocol is superior in the prevention of definite intraoperative
awareness in an unselected adult surgical population.
Rationale: To date, there have been no comparative effective trials investigating the use of
anesthetic concentration monitoring and BIS monitoring in the prevention of intraoperative
awareness. The previous trials were performed on patients classified at high-risk for

41
intraoperative awareness (Avidan et al., 2011; Avidan et al., 2008; Myles et al., 2004) and used
only inhalational MAC monitoring compared with BIS monitoring.
Specific Aim 3: Identification of a specific population-based threshold using both age-adjusted
MAC and BIS for the prevention of intraoperative awareness using discrete continuous
anesthesia information system monitoring data.
Rationale: The protocols for MAC and BIS monitoring that have been previously used were not
determined using prospectively collected discrete data elements in the prevention of
intraoperative awareness. Therefore, using the unselected adult surgical population and the
discrete monitoring data electronically extracted from the anesthesia information system, a
specific threshold can be determined that maximizes sensitivity and specificity in the prevention
of intraoperative awareness.
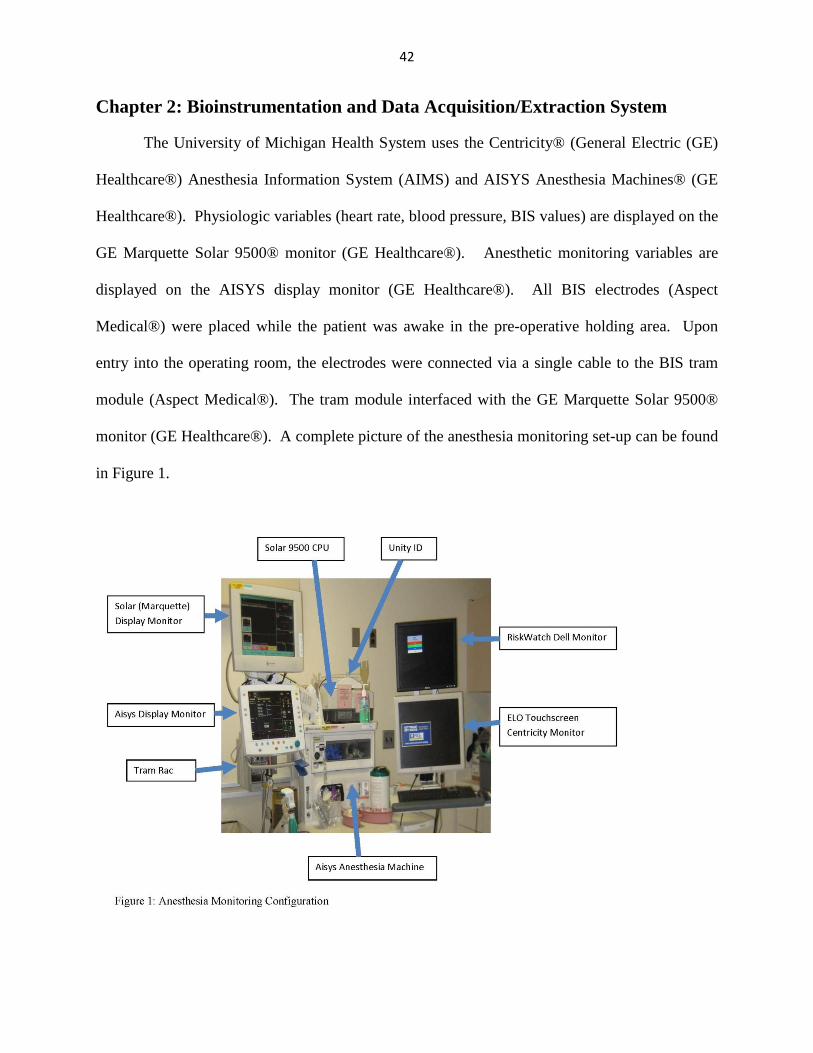
42
Chapter 2: Bioinstrumentation and Data Acquisition/Extraction System
The University of Michigan Health System uses the Centricity® (General Electric (GE)
Healthcare®) Anesthesia Information System (AIMS) and AISYS Anesthesia Machines® (GE
Healthcare®). Physiologic variables (heart rate, blood pressure, BIS values) are displayed on the
GE Marquette Solar 9500® monitor (GE Healthcare®). Anesthetic monitoring variables are
displayed on the AISYS display monitor (GE Healthcare®). All BIS electrodes (Aspect
Medical®) were placed while the patient was awake in the pre-operative holding area. Upon
entry into the operating room, the electrodes were connected via a single cable to the BIS tram
module (Aspect Medical®). The tram module interfaced with the GE Marquette Solar 9500®
monitor (GE Healthcare®). A complete picture of the anesthesia monitoring set-up can be found
in Figure 1.

43
The physiologic variables displayed on the GE Marquette Solar 9500® monitor and the
anesthetic variables from the AISYS Anesthesia Machines® are transmitted electronically every
30 seconds to one of many servers to be saved into databases over GE Unity Network (GE
Healthcare ®). A unity network interface device (ID) (GE Healthcare ®) is used as a
communication bridge between the different devices. The Unity Network ID (GE Healthcare ®)
connects the different devices via a device identification communication adapter (DIDCA)
automatically (Figure 2 and 3).
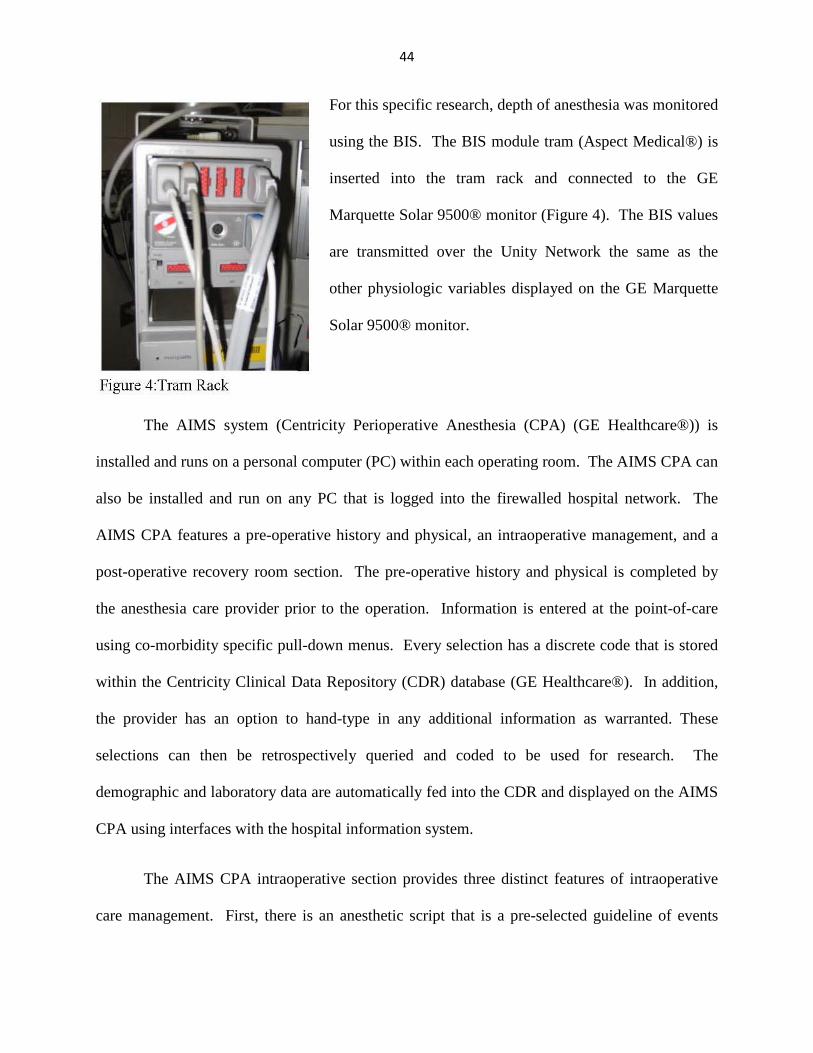
44
For this specific research, depth of anesthesia was monitored
using the BIS. The BIS module tram (Aspect Medical®) is
inserted into the tram rack and connected to the GE
Marquette Solar 9500® monitor (Figure 4). The BIS values
are transmitted over the Unity Network the same as the
other physiologic variables displayed on the GE Marquette
Solar 9500® monitor.
The AIMS system (Centricity Perioperative Anesthesia (CPA) (GE Healthcare®)) is
installed and runs on a personal computer (PC) within each operating room. The AIMS CPA can
also be installed and run on any PC that is logged into the firewalled hospital network. The
AIMS CPA features a pre-operative history and physical, an intraoperative management, and a
post-operative recovery room section. The pre-operative history and physical is completed by
the anesthesia care provider prior to the operation. Information is entered at the point-of-care
using co-morbidity specific pull-down menus. Every selection has a discrete code that is stored
within the Centricity Clinical Data Repository (CDR) database (GE Healthcare®). In addition,
the provider has an option to hand-type in any additional information as warranted. These
selections can then be retrospectively queried and coded to be used for research. The
demographic and laboratory data are automatically fed into the CDR and displayed on the AIMS
CPA using interfaces with the hospital information system.
The AIMS CPA intraoperative section provides three distinct features of intraoperative
care management. First, there is an anesthetic script that is a pre-selected guideline of events

45
expected to occur during the case. The script elements can be selected via a touchscreen in the
operating room which is then transmitted into the database with a specific date and time stamp.
Due to the nature of the operating room, the provider can adjust the time of a selection if there
was not the opportunity to document the event in
real-time. Each specific script element is also stored
with a discrete value and can be queried
retrospectively. The script elements define important
parts of the operation such as anesthesia start and
end, type of intubation (if any), and the type of
anesthetic used along with the time the doses were
administered (Figure 5). Second, the precise values
of the physiologic variables from both the monitor
and the anesthesia machine are displayed in table
format. This allows the clinician to review the
intraoperative record and determine if the patient
received a general anesthetic via inhalational of
intravenous agents (Figure 6 and 7). Finally, the physiologic waveforms from the monitor are
also displayed on the AIMS CPA screen.
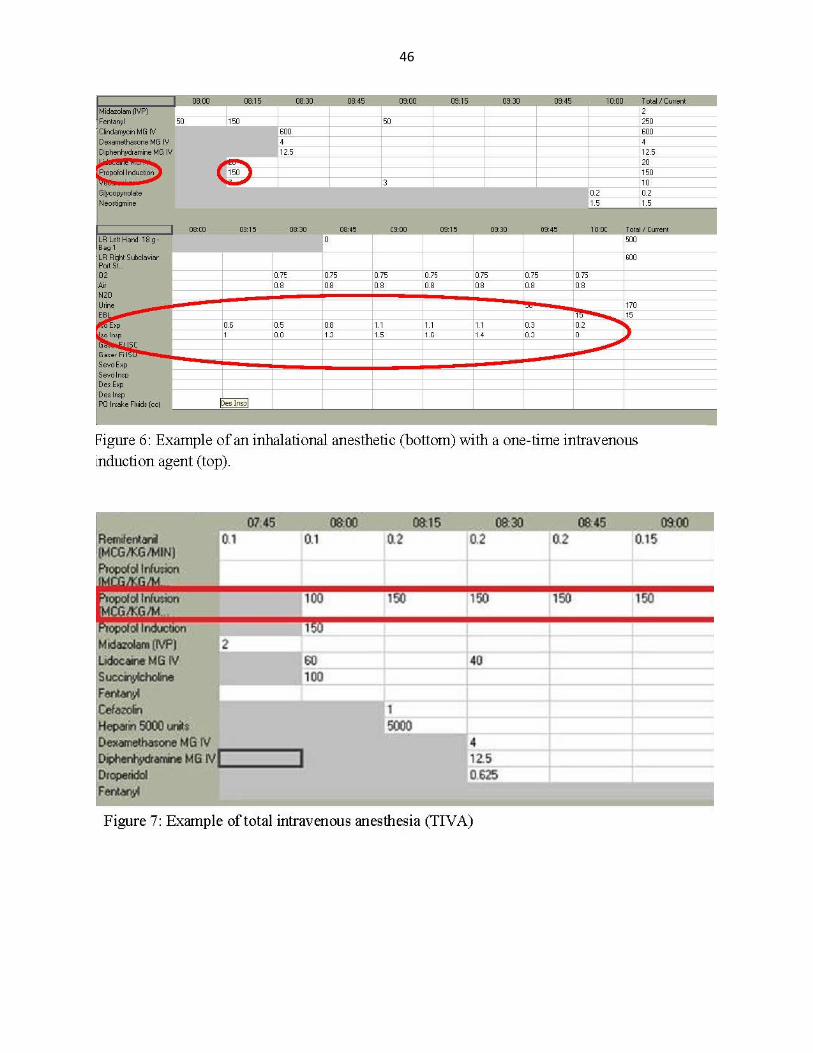
46

47
The transformation of monitor-capture to visualization on the AIMS CPA requires
numerous data transmission and data truncating steps (Figure 8, steps A-G described below).
The entire data acquisition system is running behind a firewalled password-protected system
within the University of Michigan Health System, which is monitored and regulated by the
Clinical Application Systems (CAS) team within the Department of Anesthesiology. The
monitors from the AISYS Anesthesia Machines® and GE Marquette Solar 9500® monitor (A)
are receiving information from the various physiologic variables being collected during the
operation. The physiologic variables that are collected can either be continuous or discrete. For
example, heart rate is collected each time the patient’s heart beats while a blood pressure taken
with a blood pressure cuff may only be taken every 3 to 5 minutes. The data from the monitors
(A) is then transmitted via the GE Unity Network (which is the monitor capture interface) to one
of many servers that is running GE’s monitor capture software (GE Healthcare®) (B). Each
server running the monitor capture software has two Ethernet connections. The first is a unity
network connection that is able to pull physiologic variables from the GE Marquette Solar
9500® monitor and the AISYS anesthesia machine and transmit those data to the hospital
network. The second Ethernet connection transmits data from the hospital network to the
hospital server. This monitor capture software (B) uses the IP address from each operating room
monitor and every 30 seconds pulls data from the monitors that is being transmitted over the
unity network. The data are inserted into a local database (C). Both the monitor capture
interface and the local database (B and C) reside on the same server. The 30-second data pulled
from the monitors via the monitor capture interface is then transmitted to a hospital level central
database (D) via a DataLink interface. The hospital level central database (D) holds the data
collected every 30-second off the unity network. Data are continuously being pulled and placed
48
into the hospital level central database regardless of whether an operation is occurring. Due to
the massive amount of discrete data points, this centralized hospital database is purged once a
week. The CAS team has developed a structured query language (SQL) (E) to extract data from
the centralized hospital database (D) into the Centricity CDR database (F). The data are
extracted from the centralized hospital database (D) into the Centricity CDR (F) for an actual
operation. Instead of the more granular 30-second data pull, this SQL code asks for data to be
pulled into Centricity CDR every 60 seconds. In addition, the data are also aggregated into 15-
minute snap-shots that are represented graphically in the intraoperative record in a table format
for the clinician to review in the AIMS CPA (Figures 6 and 7). As previously stated, the AIMS
CPA application is running (G) on a standard PC in the operating room at the patient’s bed side.
The AIMS CPA application (G) samples the Centricity CDR (F) for data every minute to update
the screen on the AIMS CPA application (G) that is visible to the clinicians. The clinicians’
hand-entered information into the AIMS CPA application (G) in real-time such as script
elements for start and end of operation or medications administered, is transmitted back to the
CDR database (F). There are continuous data transmissions between the CDR and AIMS CPA
application until the case has been ended by the clinician within the AIMS CPA application. The
CDR database (F) now holds continuously collected data at a rate of every 60-seconds, all
individual data entries (e.g., blood pressure by cuff) and any user entered information at the
point-of-care in the operating room into the AIMS CPA application such as script elements or
medications. All data transmitted to the CDR database (F) are kept indefinitely and considered
the patient’s medical record.
For research purposes the CDR database (F) can be queried using SQL. The SQL query
is extracted and entered in any statistical package for analysis at a later time. Each SQL query is

49
developed by the investigative team but written and executed by the CAS programmers. Since
all preoperative history and physical elements are stored as discrete variables, the investigator
can identify a specific co-morbidity of interest and code the data into binary (yes/no) or
categorical concepts for analysis. Continuous intraoperative physiologic variables can be
extracted either minute to minute as they are captured, a median over a set time-point, or a
high/low value during the operative case. All intraoperative data can be queried or alerts can be
generated by set anesthesia script elements that are time-stamped. For the research presented in
this dissertation, the script elements of “anesthesia induction end” to “surgical dressing end”
were used as the timestamps to capture all depth of anesthesia monitoring variables and to
determine when to alert the clinician. These script elements were used to document the exact
time that anesthesia was induced for the specific patient, who should thereafter be adequately
anesthetized; to the time that anesthesia would be reversed or turned off. In addition, to
determine any monitor capture interface issues with data transmission into the CDR database,
queries were developed to determine if standard measures from the anesthesia machine were
invalid. If the CPA application had a documented start and end of the surgical case time-
stamped but the anesthetic depth value for MAC and the end-tidal carbon dioxide were both
zero, those cases were classified as monitor capture interface issues.

50

51
Chapter 3 – Development of a Novel Electronic Algorithm for Detecting Potentially Insufficient Anesthesia: Implications for the Prevention of Intraoperative Awareness
With growing recognition of the problem of intraoperative awareness (AWR), there is a
strong impetus to develop effective methods of detecting insufficient levels of anesthesia.
Assessment of anesthetic depth has evolved from stages and planes of anesthesia, to the concept
of minimum alveolar concentration (MAC), to more recent techniques based on
electroencephalography (EEG) (Mashour, 2006). There is still controversy, however, regarding
the efficacy of EEG-based technology in the prevention of awareness. The B-Aware trial was a
prospective study of high-risk patients that demonstrated a benefit of Bispectral Index (BIS)
monitoring compared to a routine care group (Myles et al., 2004). One limitation of this trial
was that the BIS-guided approach was not compared to another protocol-based anesthetic. The
recent B-Unaware trial was a prospective study that instead compared a BIS-guided anesthetic to
a protocol based on >0.7 MAC end-tidal anesthetic gas concentrations (Avidan et al., 2008). The
B-Unaware study did not demonstrate any benefit of a BIS-guided protocol compared to a MAC-
guided protocol. One limitation of the B-Unaware trial was that it was restricted to inhalational
agents. Since the BIS monitor is sensitive to the effects of intravenous anesthetics, a protocol
that incorporates the MAC-sparing effects of such agents may be a better comparator to the
EEG-based approach.
Methods
We developed an electronic algorithm that employs our anesthesia information
management system to calculate a "MAC equivalent" based on total inhalational MAC, as well
as documented infusions or boluses of intravenous agents. The algorithm for analysis of an

52
active case is as follows, with an associated electronic pager alert triggered if implemented in
real time.
• Conditions for an “active case” are: 1. data capture is possible (i.e., not a paper record) 2. data capture is active (i.e., “patient in room” has been electronically
entered and end-tidal [Et] CO2 is detected) 3. case has been identified as a general anesthetic 4. “anesthesia induction end” has already been documented 5. request for recovery room bed or transport to an intensive care unit has not
been documented 6. surgical dressing completion has not been documented
• The alerting system checks the most recent value (within a specified time period) of: 1. Et Sevoflurane (MAC=2.0) 2. Et Isoflurane (MAC=1.2) 3. Et Desflurane (MAC=6) 4. Et Nitrous Oxide (MAC=105)
and compares it to the MAC of each agent. It adds the resulting MAC values together for “current total MAC.”
• The system then checks for a charted propofol infusion in mcg/kg/min and divides by 150, assuming that 150 mcg/kg/min is “1.0 MAC” for propofol. The analogous concept of MAC for propofol is “Cp50”- the plasma or blood concentrations at which 50% of patients do not move in response to a noxious stimulus (Smith et al., 1994). Since we do not have the technology at our institution to calculate Cp50 or Cp50-awake, we have chosen the above propofol dose as an initial value based on clinical experience. The resultant MAC equivalent is added to current total MAC.
• The system next checks for a dexmedetomidine infusion with a rate of 0.2 mcg/kg/hour or greater. If present, it multiplies the current total inhalational MAC by 2, as dexmedetomidine can reduce MAC by 50% (Aantaa et al., 1997).
• At this point, the “current total MAC” is defined as: Et Sevo /2 + Et Iso /1.2 + Et Des/6 + Et Nitrous /105 + propofol rate (in mcg/kg/min)/150. If dexmedetomidine is >0.2 mcg/kg/hour, inhalational MAC is multiplied by 2.
• If this total MAC is below a set threshold, the system assesses whether a bolus of propofol, midazolam, etomidate, or thiopental has been documented in the preceding 10 minutes.
• The system then triggers an alert if total age-adjusted MAC is below the assigned threshold AND no bolus has been documented in the preceding 10 minutes. Age adjustment for MAC is only performed for volatile agents and is based on calculations derived from prior literature (Eger, 2001; Nickalls and Mapleson, 2003) (Table 1).
• If implemented, the clinician electronically signed into the case receives an alphanumeric page stating “Potentially insufficient anesthesia, please check vaporizers and intravenous lines.”
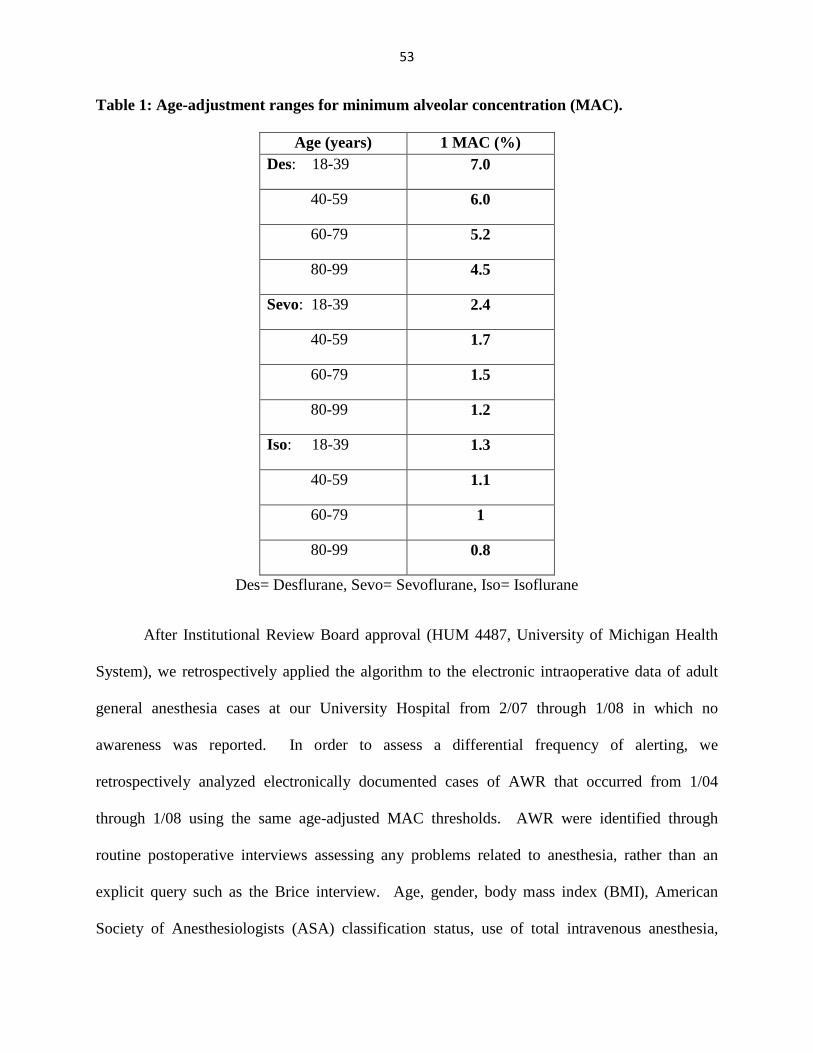
53
Table 1: Age-adjustment ranges for minimum alveolar concentration (MAC).
Age (years) 1 MAC (%) Des: 18-39 7.0
40-59 6.0
60-79 5.2
80-99 4.5
Sevo: 18-39 2.4
40-59 1.7
60-79 1.5
80-99 1.2
Iso: 18-39 1.3
40-59 1.1
60-79 1
80-99 0.8
Des= Desflurane, Sevo= Sevoflurane, Iso= Isoflurane
After Institutional Review Board approval (HUM 4487, University of Michigan Health
System), we retrospectively applied the algorithm to the electronic intraoperative data of adult
general anesthesia cases at our University Hospital from 2/07 through 1/08 in which no
awareness was reported. In order to assess a differential frequency of alerting, we
retrospectively analyzed electronically documented cases of AWR that occurred from 1/04
through 1/08 using the same age-adjusted MAC thresholds. AWR were identified through
routine postoperative interviews assessing any problems related to anesthesia, rather than an
explicit query such as the Brice interview. Age, gender, body mass index (BMI), American
Society of Anesthesiologists (ASA) classification status, use of total intravenous anesthesia,

54
emergent cases, and cardiac cases were assessed and compared between the two groups
(awareness vs. no awareness). Comparisons were made using Chi-Square, Fischer’s Exact Test,
or Mann Whitney U Test, where appropriate. P values <0.05 were considered statistically
significant.
The B-Unaware trial used 0.7 MAC as a threshold; we started above this value and
decreased thresholds until they approached MAC awake (Eger, 2001). The threshold for
analysis was set to <0.8, <0.7, <0.6, <0.5, <0.4 age-adjusted MAC. After calculating the
incidence of alert triggering in cases with or without awareness, positive and negative likelihood
ratios were calculated.
Results
From 2/07 through 1/08, we identified 15,091 cases valid for analysis that had no
documented AWR. From 1/04 through 1/08, we identified 12 cases of AWR for which
electronic data were available (9 of these are discussed and documented in Mashour et al, 2009).
Demographic data from the two groups are demonstrated in Table 2. The only significant
difference between the two groups was an increased incidence of ASA 3, 4, and 5 patients in the
awareness group (75%) compared to the non-awareness group (40%) (P=0.02).
In all cases analyzed, the incidence of triggers decreased as MAC thresholds were
decreased (Table 3). The AWR, however, demonstrated a higher frequency of alert triggers at
all MAC thresholds. The <0.8 age-adjusted MAC threshold was most sensitive to AWR and had
the best negative likelihood ratio, since it triggered in 12/12 cases. The threshold of <0.5 age-
adjusted MAC was associated with the best positive likelihood ratio.
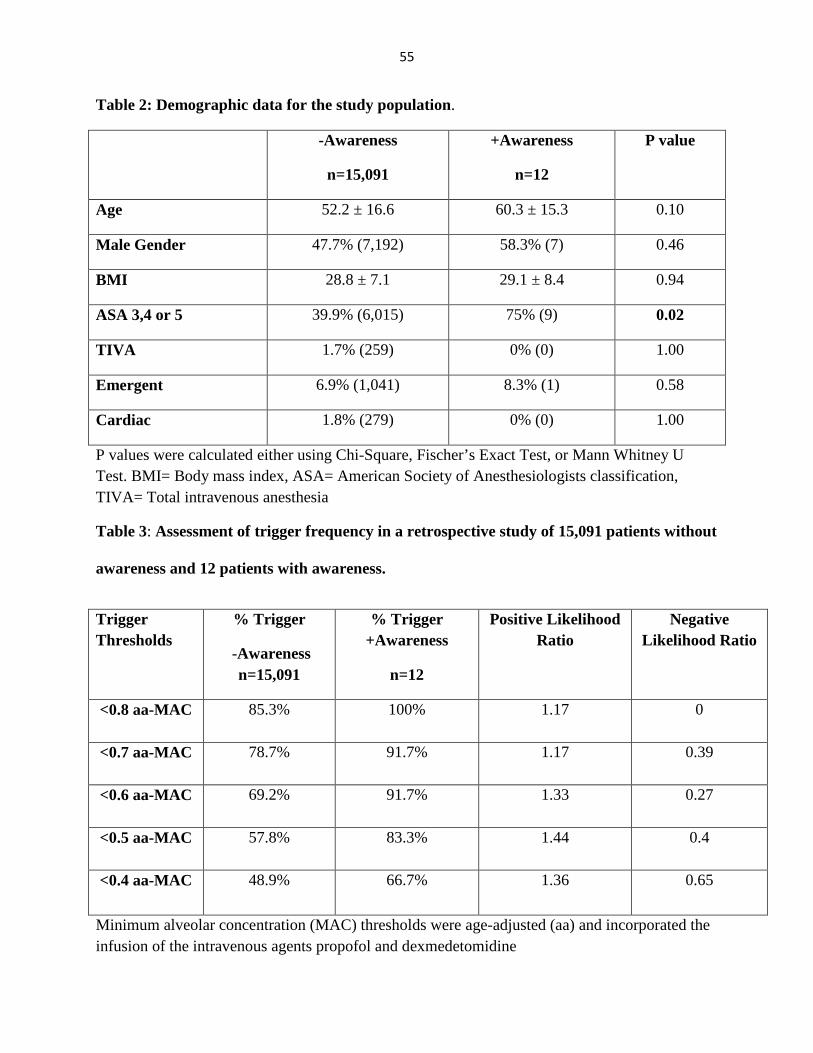
55
Table 2: Demographic data for the study population.
-Awareness
n=15,091
+Awareness
n=12
P value
Age 52.2 ± 16.6 60.3 ± 15.3 0.10
Male Gender 47.7% (7,192) 58.3% (7) 0.46
BMI 28.8 ± 7.1 29.1 ± 8.4 0.94
ASA 3,4 or 5 39.9% (6,015) 75% (9) 0.02
TIVA 1.7% (259) 0% (0) 1.00
Emergent 6.9% (1,041) 8.3% (1) 0.58
Cardiac 1.8% (279) 0% (0) 1.00
P values were calculated either using Chi-Square, Fischer’s Exact Test, or Mann Whitney U Test. BMI= Body mass index, ASA= American Society of Anesthesiologists classification, TIVA= Total intravenous anesthesia
Table 3: Assessment of trigger frequency in a retrospective study of 15,091 patients without
awareness and 12 patients with awareness.
Trigger Thresholds
% Trigger
-Awareness n=15,091
% Trigger +Awareness
n=12
Positive Likelihood Ratio
Negative Likelihood Ratio
<0.8 aa-MAC 85.3% 100% 1.17 0
<0.7 aa-MAC 78.7% 91.7% 1.17 0.39
<0.6 aa-MAC 69.2% 91.7% 1.33 0.27
<0.5 aa-MAC 57.8% 83.3% 1.44 0.4
<0.4 aa-MAC 48.9% 66.7% 1.36 0.65
Minimum alveolar concentration (MAC) thresholds were age-adjusted (aa) and incorporated the infusion of the intravenous agents propofol and dexmedetomidine
56
Discussion
Electronic alerts have been developed and employed at our institution and have been
shown to increase compliance with both clinical and administrative tasks (Kheterpal et al., 2007;
O'Reilly et al., 2006). To our knowledge, this is the first report of an electronic algorithm and
alert system designed to detect potentially insufficient anesthesia. Empirically-derived
refinement of both the algorithm and alert threshold will help further determine the optimal
“signal-to-noise” ratio (i.e., tradeoff between sensitivity and specificity) for detecting insufficient
anesthesia related to true intraoperative awareness events. It is important to note that the present
findings are consistent with clinically relevant investigations in AWR. Our alert system would
have triggered in 78.7% of cases with a threshold of <0.7 effective MAC, which is comparable to
the 74.5% incidence of end-tidal gas concentrations <0.7 MAC in the B-Unaware study (Avidan
et al., 2008).
One advantage of the system is its ease of installation and cost efficiency: assuming that
an anesthesia information management system is in place, the algorithm can be employed
readily. A second advantage is that a more comprehensive assessment of anesthetic agents can
be accomplished, in contrast to the limited MAC calculation available on many monitors. MAC-
sparing infusions or boluses are common and should be accounted for in a MAC-based protocol.
A third advantage is that the algorithm can be readily modified and could potentially include data
from EEG-based monitors as well.
One disadvantage of the algorithm is that it only incorporates intravenous infusions or
boluses that have been electronically documented. In general, poor documentation could lead to
under- or over-alerting. For example, a mechanical malfunction of an intravenous line that
resulted in no anesthetic delivery would not be detected if not charted, as there is no direct

57
information from the patient as in the case of end-tidal gas concentrations. Another disadvantage
is that in our protocol, the MAC equivalent for propofol is established by convention rather than
a physiologic measure such as Cp50 (Smith et al., 1994). In the future, both of these
disadvantages may be compensated for if the use of end-tidal propofol concentrations becomes a
standard of practice (Takita et al., 2007). Furthermore, we cannot attest to the complete absence
of awareness cases in the control group, as a prospective approach to awareness detection was
not used (Mashour et al., 2009c). Nonetheless, even assuming the reported incidence of
awareness cases at 0.15% in the control group, it would likely not affect the outcome given the
awareness incidence of 100% in the test group. Finally, this algorithm obviously requires an
anesthesia information management system and alphanumeric paging system already in place.
The exclusion of opiates from our algorithm merits discussion. It is well known that,
beyond a certain dosing threshold, opiates have a MAC-sparing effect. A combination of
premedication, intermittent boluses, and continuous infusions—often with different agents—is
common in the perioperative setting. Incorporating this heterogeneous practice would add
considerable complexity to the algorithm in this initial phase of development. It is important to
note that cases traditionally conducted with high-dose opiates, such as cardiac surgery, are still
associated with a high incidence of intraoperative awareness (Avidan et al., 2008; Myles et al.,
2004). It is also important to note that current practice does not typically include even a simple
MAC alarm (Umesh et al., 2009). Thus, the development of an automated, modifiable alerting
system that can be programmed at different thresholds of age-adjusted MAC—and that is
inclusive of selected intravenous sedative-hypnotic agents—is already a major advance
compared to existing technology. A large clinical trial testing the algorithm in comparison to the

58
BIS monitor is currently being conducted (clinical trial NCT00689091), which will help
elucidate empirically whether opiates need to be included in the next iteration of the algorithm.
In conclusion, we have developed a novel electronic algorithm and alerting system that
may help detect insufficient anesthesia and that is more sensitive to cases of intraoperative
awareness. The prospective study of such an electronic alert system may be useful as a standard
of comparison for EEG-based systems and warrants further investigation as an adjunct in the
prevention of awareness during general anesthesia.
Reprinted in entirety from Springer: Journal of Clinical Monitoring and Computing (23) 2009: 273-277, A Novel Electronic Algorithm for Detecting Potentially Insufficient Anesthesia: Implications for the Prevention of Intraoperative Awareness, Mashour G.A., Esaki, R.K., Vandervest, J.C., Shanks A., Kheterpal, S. Entire text with tables with kind permission from Springer Science and Business Media
59
Chapter 4 – Prevention of Intraoperative Awareness with Explicit Recall in an Unselected Surgical Population: A Randomized Comparative Effectiveness Trial
Intraoperative awareness with explicit recall (AWR) of surgical events is a potentially
devastating event associated with post-traumatic stress disorder (Leslie et al., 2010) and has an
incidence of approximately 0.15% for all risk levels (Sandin et al., 2000; Sebel et al., 2004).
Processed electroencephalographic monitors have been developed to assess anesthetic depth and
potentially prevent AWR, which is considered a sentinel event by the Joint Commission
(JACHO, 2004). The Bispectral Index® (BIS) monitor (Covidien, Boulder, CO) processes a
frontal electroencephalographic channel to calculate a dimensionless number from 100 (awake)
to 0 (no detectable brain activity) in order to provide a measure of the patient's level of
consciousness; a BIS range of 40 to 60 is suggested to be consistent with the state of general
anesthesia (Avidan et al., 2011; Avidan et al., 2008; Myles et al., 2004).
Past efficacy trials have evaluated the role of protocols based on the BIS monitor (Avidan
et al., 2011; Avidan et al., 2008; Myles et al., 2004) and anesthetic concentrations (Avidan et al.,
2011; Avidan et al., 2008) for the prevention of AWR. However, these studies were performed
exclusively in patients at high risk for the complication. A large cohort study did find that BIS
monitoring decreased the incidence of AWR in a broad surgical population compared with
historical controls, but was limited by its observational design, changing practice patterns
regarding end-tidal anesthetic concentration monitoring, and exclusion of patients not receiving
neuromuscular blockers (Ekman et al., 2004). As such, there are currently no comparative
effectiveness data to guide the decisions of providers or policy makers as they attempt to prevent
AWR in the >200 million major surgeries performed worldwide each year (Weiser et al., 2008).

60
Similarly, there are no effectiveness data supporting the claim that anesthetic
consumption is reduced with the use of a BIS monitor, which has been suggested to decrease
inhaled anesthetic use by up to 38% (Song et al., 1997). These data are reinforced by meta-
analyses of small efficacy trials of both inhaled and intravenous anesthesia (Liu, 2004;
Punjasawadwong et al., 2007). It has recently been argued that decreased anesthetic use and the
ensuing clinical benefits such as faster recovery or reduced nausea and vomiting make the BIS
monitor cost-effective and that it should therefore be routinely incorporated (Klopman and Sebel,
2011).
Here we describe a comparative effectiveness study with active comparators and a two-
sided superiority design. This randomized controlled trial compared alerting protocols based on
either anesthetic concentration or BIS values in an unselected surgical population at three
hospitals within a tertiary academic medical center. The primary outcome was the incidence of
definite AWR; prespecified secondary outcomes included the incidence of definite or possible
AWR, as well as anesthetic usage and recovery variables.
Materials and Methods
A detailed description of the experimental protocol for the Michigan Awareness Control Study
(ClinicalTrials.gov number NCT00689091) has been previously reported (Mashour et al.,
2009b). The conduct of the study and the reporting of results followed the Consolidated
Standards of Reporting Trials guidelines (Schulz et al., 2010).
Participants
The study received approval from the Institutional Review Board of the University of
Michigan, Ann Arbor, (HUM00013626) and was deemed to be of minimal risk. A full discussion

61
of the risks and benefits was conducted with each patient approached. Patient consent to
interventions and follow-up was electronically documented in our perioperative information
system (Centricity®, General Electric Healthcare, Waukesha, WI). Patients were recruited from
three hospitals of the University of Michigan Health System from May 2008 until May 2010.
Inclusion criteria were age >18 years, general anesthesia using inhalational or intravenous
technique for any surgical case that did not involve the forehead, and availability for follow-up
interviews. Exclusion criteria were intracranial procedures, adhesive allergy, psychosis, or
history of traumatic brain injury. All patients enrolled in the study were blinded to group
assignment and had the BIS electrode applied to the left side of the forehead by a member of the
research staff prior to entering the operating room.
To detect a reduction in the incidence of AWR from 0.15% to 0.04% (Ekman et al.,
2004), we calculated a need for 14,072 per group or a total n = 28,144 with 80% power and a
significance level of 5%. We targeted a total recruitment of 30,000 patients, with a pre-specified
interim analysis after 20,000 patients were recruited (2/3 target sample) (Mashour et al., 2009b).
A constant likelihood group sequential method with formal futility boundaries was used with a
two-sided O’Brien-Fleming stopping rule. There was no contingency for early termination for
efficacy. An acceptance region plot (or a futility region plot) was generated using SAS statistical
software (SAS version 9.2, Carey, NC). The two-sided futility boundary (for the differences in
proportions between the BIS and the anesthetic concentration group) at the planned interim
analysis was from -0.0005434 to 0.0005434. The difference between the proportions observed at
the interim analysis was 0.0003275422 (11/9376 cases of definite awareness in the anesthetic
concentration group minus 8/9460 cases of definite awareness in the BIS group), which is within
the stopping boundary for futility.

62
Study Design
The University of Michigan Health System utilizes the Centricity® electronic
perioperative information system in all of its operating rooms. Using this system, automated real-
time analysis of BIS values or minimum alveolar concentration (MAC) was performed every
five minutes, with the transmission of provider-specific electronic alphanumeric paging alerts in
less than 60 seconds. Operating rooms were randomized every three months based on even- or
odd-numbered operating rooms to either (1) electronic alerts in the event of median BIS values
>60, or (2) electronic alerts for median age-adjusted MAC level of <0.5. The threshold of age-
adjusted MAC <0.5 was chosen based on a retrospective analysis of electronically documented
cases with and without awareness that occurred prior to the onset of the study (Mashour et al.,
2009a), as well as the high frequency with which thresholds of higher MAC are crossed (Avidan
et al., 2008). In addition to the age-adjusted MAC of standard inhaled anesthetics, alerting
based on anesthetic concentrations also reflected documented intravenous anesthetic infusions
and bolus doses (Mashour et al., 2009a). Paging alerts to the clinician electronically signed into
and physically present during the case reported either the median BIS value or anesthetic
concentration level for the prior 5 min epoch, followed by "Potentially insufficient anesthesia-
please check vaporizers and intravenous lines." (Specific coding for the electronic alerts can be
found in Appendix I.)
In the BIS-targeted rooms, BIS values appeared on the main monitoring screen and were
automatically recorded. In the anesthetic alert-targeted rooms, BIS values neither appeared on
the monitor nor were accessible intraoperatively. Other aspects of anesthetic care (e.g., choice of
anesthetic agents, benzodiazepines) were not standardized for this study.
63
Randomization and Blinding
Randomization was performed using a random-number, computer-generated block
scheme based on even or odd operating room number. The blocks were defined within a specific
year of the study based on the original start date of recruitment. The study year was divided into
four quarters by calendar month (three months per quarter). Within a specific study year, the
odd-numbered operating rooms and even-numbered operating rooms were randomized to BIS
alerting two times and anesthetic concentration alerting two times. If the odd-numbered
operating rooms were randomized to one alerting protocol, the even-numbered operating rooms
were randomized to the alternative alerting protocol for that quarter of the study year. Patients,
postoperative interviewers, and all case reviewers were blinded to group assignment.
Practitioners receiving pages regarding BIS or MAC values were not blinded to group
assignment. However, practitioners were not made aware of the randomization scheme or dates
for randomization change during the study.
Technical Factors
The BIS monitors used in the Michigan awareness control study were not free-standing
devices, but modules that interfaced with the Solar 9500 (General Electric®) anesthetic monitors
used in our institution’s operating rooms. During scheduled quality control checks within the
first two months of the trial, it became clear that in some instances there was a failure of BIS
values to be generated. Technical representatives from both manufacturers confirmed this as a
known software interface problem. Since the study was designed as an effectiveness trial, the
decision was made to proceed and use the population receiving neither the BIS nor anesthetic
concentration protocol as a post hoc “no intervention” group for the purpose of secondary
64
analysis. Failure to generate BIS values was similar in both even (17%) and odd (19%)
numbered operating rooms, which was the randomization scheme for alerting protocols.
Main Outcome Measures
Blinded, trained interviewers used the modified Brice interview (Brice et al., 1970)
employed in other studies of intraoperative awareness (Avidan et al., 2011; Avidan et al., 2008;
Myles et al., 2004; Sebel et al., 2004) to screen patients 28 to 30 days after surgery via telephone.
A single interview was performed in contrast to past trials (Avidan et al., 2011; Avidan et al.,
2008; Myles et al., 2004) due to the high number of patients recruited; the 28 to 30 day interview
was chosen because it would likely detect the most clinically significant awareness events. If
patients could not be reached by telephone after multiple attempts, a written form of the
interview was sent to the patient. Any patients reporting AWR during the Brice interview had a
more detailed interview by an anesthesiologist committee member blinded to the intervention.
All patients reporting AWR were offered psychiatric care.
For those patients who reported AWR, three blinded experts independently determined
whether the reported event was definite, possible, or no awareness based on the data obtained
from the first two interviews (Brice screening and follow-up). These individuals also reviewed
awareness events for the BAG-RECALL trial (ClinicalTrials.gov number NCT00682825)
(Avidan et al., 2011; Avidan et al., 2009). We compared inter-rater agreement using Fleiss’s
Kappa statistic for the three blinded assessments of awareness, which showed fair agreement
(0.25). In the event of a conflict, a fourth blinded expert reviewer from another institution made
the final determination; this expert reviews cases for the American Society of Anesthesiologists
Anesthesia Awareness Registry. The qualitative aspects of the awareness report were classified

65
using the Michigan Awareness Classification Instrument (Mashour et al., 2010). Class 1 is
defined as isolated auditory perceptions, class 2 is tactile perceptions, class 3 is pain, class 4 is
paralysis and class 5 is paralysis and pain. If an event is also associated with distress, the class
number is modified with a “D.”
Anesthetic usage, time to meeting recovery room discharge criteria, and incidence of
postoperative nausea/vomiting were prespecified secondary outcomes (Mashour et al., 2009b).
Postanesthesia care unit discharge criteria include (among other variables): oxygen saturation
>92% or preoperative baseline (at appropriate levels of supplemental oxygen), core temperature
between 36⁰ and 38⁰ Celsius, normal heart rate and rhythm (or no worse than baseline status),
other hemodynamic vital signs within normal physiologic range for age or within 20% of
baseline values, normal neurological evaluation, pain score ≤4, postoperative nausea and
vomiting ≤2. BIS values, MAC values, and doses of propofol, midazolam, fentanyl and
morphine were assessed across all groups.
Statistical Analysis
The primary outcome was the incidence of definite AWR in the anesthetic concentration
and BIS groups using modified intention-to-treat analysis. Modified intention-to-treat was
defined as a patient who was randomized and was interviewed at 30 days. Prespecified
secondary analysis was conducted to determine the combined incidence of definite and possible
AWR as well as the classification of events. Significance was assessed using a two-tailed
Pearson chi-square test. Confidence intervals were calculated using Newcombe’s method
without continuity correction (Newcombe, 1998). The average number of paging alerts

66
generated in the groups was compared with the incidence of definite or possible AWR events
using a linear regression R-Squared test.
Patient characteristics, comorbidities, and risk factors for awareness (Table 1) were
analyzed to determine if there were statistically significant differences between the anesthetic
concentration and BIS groups in the modified intention-to-treat analysis. The Kolmogorov-
Smirnov statistic was used to determine normality for the two continuous variables (age and
body mass index). If the p-value was significant (<0.05), the assumption of normality was
violated and nonparametric analyses (e.g., Mann-Whitney U test) were used. Nonparametric
data are presented as median and interquartile range [25th to 75th percentile]. Parametric data are
presented as mean ± standard deviation. For categorical variables, a two-tailed Pearson chi-
square test was used, where a p-value of <0.05 was considered statistically significant. All
categorical data are presented as number (percentage). For ease of interpretation we have defined
cardiovascular disease as having one or more of the following conditions: history of myocardial
infarction, congestive heart failure, valvular heart disease, dysrhythmia, endocarditis, peripheral
vascular occlusive disease, angina or orthopnea. We have defined lung disease as having one or
more of the following conditions: history of pulmonary hypertension, chronic obstructive
pulmonary disease or dyspnea. We have defined liver disease as having one or more of the
following conditions: history of cirrhosis, acute liver failure, or chronic liver failure. We have
defined neuropsychiatric disease as having one or more of the following conditions: history of
stroke or transient ischemic attack, seizures, depression, bipolar disorder, anxiety disorder, or
posttraumatic stress disorder. We have defined alcohol abuse as having 3 or more drinks daily
and/or high withdrawal potential.
67
For the other key secondary outcomes, all continuous elements were assessed for
normality as described. We chose to use the post hoc grouping variable (anesthetic
concentration, BIS, and no intervention) to assess the secondary outcomes and therefore post hoc
comparison testing was employed for elements in Table 2. The median BIS values were
compared between the BIS and anesthetic concentration groups using a Mann-Whitney U test; a
Kruskal-Wallis test was used to compare median anesthetic dosages and discharge times among
the anesthetic concentration, BIS, and no intervention groups. A two-tailed Pearson chi-square
test was used to compare the outcomes of nausea or vomiting among the three groups.
Bonferroni adjustments were used for the Mann-Whitney U test variables. For the variables that
were analyzed using the Kruskal-Wallis test, pair-wise comparisons using a series of Mann-
Whitney U tests were performed if the omnibus test was significant. For the Bonferroni
adjustment, we started at an alpha level of 0.05. Based on the number of comparisons required,
the new alpha level to measure significance was 0.002. We calculated a total of 22 comparisons
based on the number of embedded Mann-Whitney U tests that were performed for Kruskal-
Wallis tests with significant omnibus tests. Only those pairwise comparisons with a p-value
<0.002 were reported in Table 2 as statistically significant differences. If there were no
statistically significant pairwise comparisons, “NS” (no significance) was reported for ease of
interpretation. Statistical software IBM SPSS statistics version 19 (IBM Corp, Somers, NY) was
used.

68
Results
Recruitment and patient characteristics
A total of 21,601 patients were enrolled in the study at the time of interim analysis, with a
97% recruitment rate (Figure 1). As described in the methods, the study was terminated due to
futility. Of the study cohort, 18,836 or 87% of the patients were available for postoperative
interview assessing awareness at one month; 9460 patients were randomized to the BIS group
and 9376 patients were randomized to the anesthetic concentration group (Figure 1). Patient
characteristics and comorbidities for the modified intention-to-treat BIS and anesthetic
concentration groups are demonstrated in Table 1. There were no adverse events related to the
study.
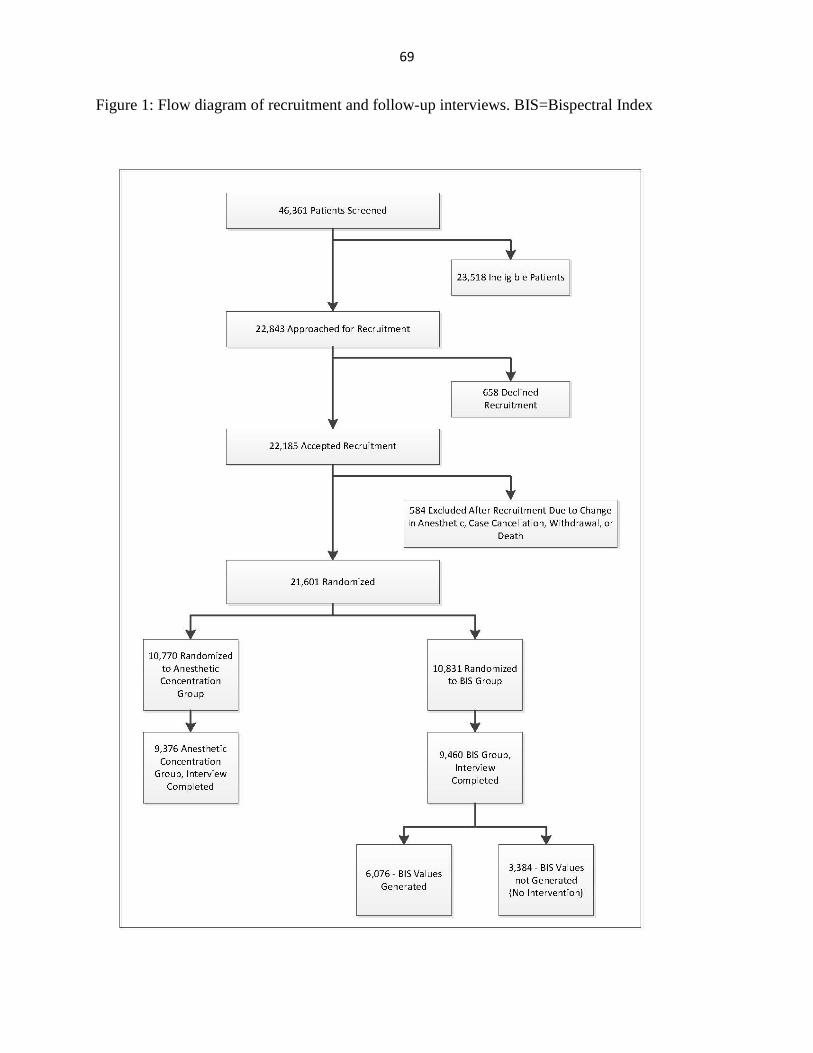
69
Figure 1: Flow diagram of recruitment and follow-up interviews. BIS=Bispectral Index

70
Table 1: Patient characteristics, comorbidities, and risk factors for awareness
Anesthetic
concentration
n (%)
(N=9,376)
Bispectral
Index
n (%)
(N=9,460)
p-value
Male Sex 4,199 (45) 4,237 (45) 0.99
Age in years* 53 [41 to 64] 53 [41 to 64] 0.79
Body Mass Index (kg/m2)* 28 [25 to 33] 28 [24 to 33] 0.50
Cardiovascular Disease 1,702 (18) 1,723 (18) 0.91
Lung Disease 950 (10) 967 (10) 0.84
Renal Disease 601 (6.4) 612 (6.5) 0.87
Liver Disease 88 (0.9) 58 (0.6) 0.01
Neuropsychiatric Disease 2,003 (21) 2,053 (22) 0.57
History of Awareness 50 (0.5) 59 (0.6) 0.41
History of Difficult Intubation 45 (0.5) 40 (0.4) 0.56
Narcotic Dependency 9 (0.1) 11 (0.1) 0.67
Alcohol Abuse 205 (2.2) 180 (1.9) 0.17
Current Anti-Convulsant Therapy 222 (2.4) 202 (2.1) 0.28
Current Benzodiazepine, Barbiturates, or GABA agonist 3,490 (37) 3,438 (36) 0.21
*Non-parametric data presented as median [25th to 75th percentile interquartile] range.
All categorical data elements are presented as number (%)
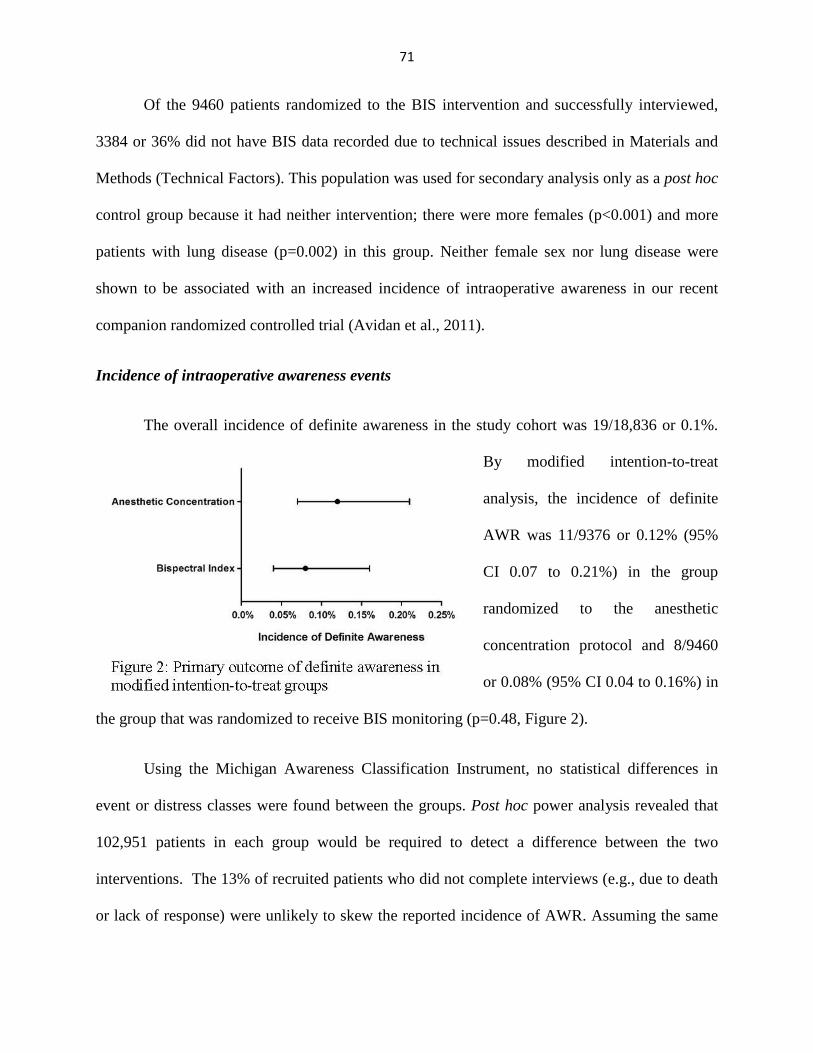
71
Of the 9460 patients randomized to the BIS intervention and successfully interviewed,
3384 or 36% did not have BIS data recorded due to technical issues described in Materials and
Methods (Technical Factors). This population was used for secondary analysis only as a post hoc
control group because it had neither intervention; there were more females (p<0.001) and more
patients with lung disease (p=0.002) in this group. Neither female sex nor lung disease were
shown to be associated with an increased incidence of intraoperative awareness in our recent
companion randomized controlled trial (Avidan et al., 2011).
Incidence of intraoperative awareness events
The overall incidence of definite awareness in the study cohort was 19/18,836 or 0.1%.
By modified intention-to-treat
analysis, the incidence of definite
AWR was 11/9376 or 0.12% (95%
CI 0.07 to 0.21%) in the group
randomized to the anesthetic
concentration protocol and 8/9460
or 0.08% (95% CI 0.04 to 0.16%) in
the group that was randomized to receive BIS monitoring (p=0.48, Figure 2).
Using the Michigan Awareness Classification Instrument, no statistical differences in
event or distress classes were found between the groups. Post hoc power analysis revealed that
102,951 patients in each group would be required to detect a difference between the two
interventions. The 13% of recruited patients who did not complete interviews (e.g., due to death
or lack of response) were unlikely to skew the reported incidence of AWR. Assuming the same

72
incidence rates found in the modified intention-to-treat groups, 100,000 simulations were run to
generate cumulative distribution functions that demonstrate the probability of a significant
difference of outcome if the 2765 patients not interviewed were included. Using a Fisher’s exact
test, the likelihood of a significant difference with inclusion of this population was 0.016%.
By post hoc analysis, the incidence of definite AWR was 11/9376 or 0.12% in the
anesthetic concentration group, 3/6076 or 0.05% in the group that actually received BIS
monitoring, and 5/3384 or 0.15% in the no intervention group (p=0.27). Based on the 0.12%
awareness incidence in the anesthetic concentration group and the 0.05% awareness incidence in
the group that received BIS monitoring, a post hoc power analysis revealed that 29,996 patients
in each group would be required to
detect a difference between the two
interventions. The combined
incidence of definite and possible
AWR cases was 0.08% in the group
that received BIS monitoring,
0.20% in the anesthetic
concentration group and 0.38% in
the no intervention group (p=0.006, Figure 3). By post hoc analysis, the cohort receiving no
intervention had 4.7 times more definite or possible awareness events compared to the cohort
receiving the BIS protocol (p=0.001; 95% CI 1.7 to 13.1). Of patients with definite or possible
awareness receiving BIS monitoring, 50% had no 5-min epoch of BIS values <60 during the case
and 50% had at least one 5-min epoch of median BIS value >60.
73
By secondary analysis using post hoc grouping, the average number of alerts in the no
intervention group (0/case), anesthetic concentration group (1/case), and BIS group (2.2/case)
varied inversely with the incidence of definite and possible awareness events (r2=0.951).
BIS Values, Anesthetic Usage, and Recovery
The secondary outcome measures of anesthetic use and recovery times were performed
using the post hoc comparison groups of anesthetic concentration, BIS, and no intervention.
Since the decision was made to present the data using the three post hoc groups instead of the
modified intention-to-treat grouping (BIS or anesthetic concentration), Bonferroni adjustments
were performed as described in the Statistical Analysis section of the Materials and Methods.
Data are presented in Table 2, with only significant pair-wise comparisons reported. There was a
statistically significant difference in the median MAC for pairwise comparisons of anesthetic
concentration to no intervention groups and also for BIS to no intervention groups. Intraoperative
propofol bolus dosing showed a significant pair-wise comparison between the BIS and no
intervention groups. The total midazolam dose showed no statistically significant differences.
Total fentanyl and total morphine use had statistically significant pair-wise comparisons for all
combinations of the three grouping variables. Although statistically significant, the clinical
relevance of these differences is unclear.
Median time to meeting recovery room discharge criteria was 98 min (interquartile range
66 to 140) for anesthetic concentration group, 95 min (interquartile range 64 to 138) for the BIS
group, and 94 min (interquartile range 64 to 133) for the no intervention group. There was a
significant pair-wise comparison between the no intervention and anesthetic concentration
groups. There was no evidence for reduced recovery time in patients receiving BIS monitoring

74
compared to no intervention. There was no statistically significant difference among the three
groups for reduced nausea or reduced vomiting upon first assessment in the recovery room
(Table 2).
Table 2: Anesthetic use and recovery variables
Anesthetic concentration
(N=9,376)
Bispectral Index
(N=6,076)
No intervention
(N=3,384)
p-value
BIS Values* % complete data (n)
40 [34 to 46] 41% (3,885)
40 [35 to 44] 100% (6,076)
N/A N/A
NS
MAC Values** %complete data (n)
0.9 [0.8 to 1.1] 98% (9,170)
0.9 [0.8 to 1.1] 99% (5,988)
0.9 [0.8 to 1.1] 98% (3,303)
<0.001 (Pairwise-comparisons of No
Intervention to Anesthetic
Concentration AND No
intervention to BIS)
Propofol Intraoperative Bolus (mg)** % complete data (n)
170 [130 to 200]
100% (9,376)
180 [130 to 200]
100% (6,076)
170 [120 to 200]
100% (3,384)
<0.001 (Pair-wise comparison of No
intervention to BIS)
Midazolam (mg)** % complete data (n)
2 [2 to 4] 100% (9,376)
2 [2 to 4] 100% (6,076)
2 [2 to 4] 100% (3,384)
NS
Fentanyl (µg)** % complete data (n)
175 [100 to 250] 100% (9,376)
200 [100 to 250] 100% (6,076)
150 [100 to 250] 100% (3,384)
<0.001 (All pairwise
comparisons) Morphine (mg)** % complete data (n)
0 [0 to 5] >99.9% (9,374)
0 [0 to 5] >99.9% (6,074)
0 [0 to 3] >99.9% (3,383)
<0.001 (All pairwise
comparisons) PACU Discharge Readiness (min)** % complete data (n)
98 [66 to 140]
91% (8,527)
95 [64 to 138]
91% (5,521)
94 [64 to 133]
90% (3,043)
0.001 (Pairwise comparison No intervention to
anesthetic concentration)
No Nausea (% of patients) (n)*** % complete data (n)
92% (6,184)
72% (6,787)
93% (4,042)
72% (4,403)
93% (2,286)
74% (2,506)
NS
No Vomiting (% of patients) (n) *** % complete data (n)
99% (7,149)
78% (7,329)
99% (4,617)
77% (4,707)
99% (2,608)
79% (2,687)
NS

75
Note: Bonferroni adjustments were made due to post hoc comparisons (α=0.002). All data using the Kruskal-Wallis test also had pair-wise comparisons using a series of Mann-Whitney U tests if the omnibus test was significant. Only p-values < 0.002 in the pairwise comparisons were reported as statistically significant differences for these post hoc tests. *Non-parametric data presented as median [25th to 75th percentile interquartile] ranges and evaluated using Mann-Whitney U test .**Non-parametric data presented as median [25th to 75th percentile interquartile] ranges and evaluated using Kruskal-Wallis test. ***Categorical data evaluated using Pearson chi-square.
BIS=Bispectral Index, MAC=minimum alveolar concentration, TIVA=total intravenous anesthesia, PACU=postanesthesia care unit.
Discussion
This is the largest prospective randomized controlled trial ever conducted on the
prevention of AWR and the only such effectiveness trial. This negative study was unable to
determine if an alerting protocol based on BIS values or anesthetic concentration was superior in
preventing definite intraoperative awareness. Other conclusions of the study are that (1)
comparative effectiveness trials with definitive results regarding the prevention of AWR in
unselected patients will likely not be feasible, (2) post hoc secondary analysis suggests that a
protocol based on the BIS monitor probably reduces awareness events compared to routine care
without a protocol, (3) increased provider alerting is a possible mechanism for decreasing
awareness events when comparing two protocols, (4) the BIS monitoring protocol used in this
trial is not associated with a reduction in the use of anesthetic drugs in routine clinical practice,
and (5) the BIS monitoring protocol used in this trial is not associated with reduced recovery
time or incidence of nausea and vomiting in routine clinical practice.
The B-Aware study demonstrated that a BIS-guided protocol significantly reduced the
incidence of AWR in a high-risk population compared to no intervention (Myles et al., 2004).
Subsequently, the B-Unaware study demonstrated no difference between a BIS-guided and

76
MAC-guided protocol in the high-risk population (Avidan et al., 2008), a finding supported by
the recent BAG-RECALL trial (Avidan et al., 2011). The current study differs from all past
trials in that it assessed AWR prevention in an unselected, representative surgical population as
opposed to the high-risk population alone. The primary results of our study are consistent with
the B-Unaware and BAG-RECALL trials in that no statistically significant difference in the
prevention of AWR could be demonstrated between anesthetic concentration and BIS monitoring
protocols. However, the results of the post hoc secondary analysis are consistent with the B-
Aware trial (Myles et al., 2004) in that the BIS monitor showed a trend toward reducing the
incidence of awareness events compared to a group with no intervention. One methodological
similarity of the current trial, the B-Aware trial (Myles et al., 2004) and the observational study
by Ekman et al., 2004 is that anesthetic administration was not restricted to potent inhaled agents
alone, as it was in the B-Unaware and BAG-RECALL trials (Avidan et al., 2011; Avidan et al.,
2008). Our study supports the conclusion of a recent Cochrane database review suggesting that
the BIS monitor may reduce AWR when compared to assessing clinical signs alone, but not
when compared to a protocol based on anesthetic concentration (Punjasawadwong et al., 2007).
The use of the BIS monitor in the current study generated approximately twice as many
alerts as that of the anesthetic concentration protocol. Therefore, increased alerting could
potentially be a mechanism of decreased definite or possible AWR events, an interpretation
supported by the results of our companion trial. In the BAG-RECALL study, the alarm
frequency based on anesthetic concentration was approximately 2-fold higher than that based on
BIS values; the higher alarm rate with the anesthetic concentration protocol was associated with
fewer definite and possible AWR events. The different alerting threshold in BAG-RECALL
(0.7MAC) and the current trial (0.5MAC) likely explains the ostensibly disparate outcomes. It is

77
important to note that there was a high incidence of false positive alerting, which mitigates any
conclusion regarding alerting protocols as a method of preventing AWR.
Efficacy trials and meta-analyses have suggested that the BIS monitor can significantly
reduce consumption of anesthetic drugs, which leads to improved outcomes such as faster
recovery or reduced nausea and vomiting. These data have been used to argue that the BIS
monitor is cost-effective and should be routinely adopted for every general anesthetic (Klopman
and Sebel, 2011). The BIS protocol used in the current study was not shown to reduce anesthetic
dosing, which is in contrast to the recent Cochrane database review (Punjasawadwong et al.,
2007). Furthermore, the BIS protocol used in the current study was not associated with reduced
recovery time or reduced incidence of nausea and vomiting compared to routine care. One
hypothesis to explain the discrepancy is that conclusions derived from efficacy trials or meta-
analyses based on such trials are not sufficiently robust to hold in a test of effectiveness.
Another hypothesis to explain the discrepancy is that the difference in BIS-guided protocols
between the current and past studies led to disparate outcomes.
Limitations of our study include insufficient numbers to answer with precision whether
and to what extent there is a difference in the definite AWR incidence between protocols based
on BIS values and anesthetic concentrations. This limitation likely reflects the rarity of AWR in
an unselected surgical population and is informative regarding the future investigation of
protocols to reduce AWR. Another limitation of the trial was the proportion of patients
randomized to the BIS protocol who did not receive BIS monitoring. However, this unplanned
technical issue has yielded useful secondary findings and is mitigated by the following
considerations: (1) even complete compliance would almost certainly not have been sufficient to
detect a significant difference in the modified intention-to-treat groups, (2) the population

78
receiving neither intervention yielded useful information regarding the effect of anesthetic
protocols compared to routine care, a matter of recent controversy,(Crosby, 2011) (3) the
incidence of definite and possible AWR events in the no-intervention group was equivalent to
that previously reported (Punjasawadwong et al., 2007; Sandin et al., 2000; Sebel et al., 2004),
which validates the methodology of the trial and suggests that a single interview at 30 days was
sufficient to detect clinically relevant AWR, and (4) the number of prospectively-studied patients
who received BIS monitoring nonetheless exceeds all major efficacy trials combined (Avidan et
al., 2011; Avidan et al., 2008; Myles et al., 2004).
In conclusion, this effectiveness study could not detect a difference between BIS and
anesthetic concentration protocols in reducing the incidence of definite AWR with explicit recall.
By post hoc analysis, we demonstrated that the BIS monitor may play a role in reducing AWR
compared to no intervention. These findings are consistent with conclusions of a Cochrane
review based on various efficacy studies (Punjasawadwong et al., 2007). In contrast to the
Cochrane review, the BIS protocol used in this study was not associated with improved recovery.
This is my primary body of work and was previously published in full with tables and figures by Wolters Kluwer Health Lippincott Williams & Wilkins: Shanks AM, Mashour GA, Tremper KK, Kheterpal S, Turner CR, Ramachandran SK, Picton P, Schueller C, Morris M, Vandervest JC, Lin N, Avidan MS. Prevention of Intraoperative Awareness with Explicit Recall in an Unselected Surgical Population: A Randomized Comparative Effectiveness Trial. Anesthesiology 2012, 117 (4) 717-725. Reuse is free and no permission is required.

79
Chapter 5 – Systematic Review for Alerting Thresholds for the Prevention of Intraoperative Awareness with Explicit Recall
Intraoperative awareness with explicit recall (AWR) of surgical events can be a
devastating complication for patients, with significant psychological sequalae (Domino et al.,
1999; Ghoneim et al., 2009; Leslie et al., 2010; Moerman et al., 1993; Osterman et al., 2001;
Schwender et al., 1998). The incidence of definite AWR in patients undergoing general
anesthesia is reported to be between 1 and 2 out of 1,000 cases and as high as 3 to 4 of 1,000
cases for both possible and definite AWR events (Mashour et al., 2012; Sandin et al., 2000;
Sebel et al., 2004); in patients at high risk for AWR, the incidence approaches 1% (Myles et al.,
2004). It has been posited that the primary reason for AWR is insufficient anesthesia (Ghoneim
et al., 2009; Nickalls and Mahajan, 2010), suggesting that alerting protocols could prevent AWR
if a specific threshold was identified.
Two common surrogates for anaesthetic depth are minimum alveolar concentration
(MAC) measured by end-tidal anesthetic concentration (ETAC), and the Bispectral Index®
(BIS). Alerting algorithms based on either MAC or BIS values can be implemented easily to
notify the provider of potentially insufficient anesthesia. The rapid expansion of electronic
Anesthesia Information Systems (AIMS) allows for enhanced use of alerting algorithms with the
potential to combine demographic, co-morbidity, physiologic and anesthetic concentration
variables. In addition, the AIMS allow the provider to be notified via pager for potentially
insufficient anesthesia even when the alarms on the primary monitoring system have been
silenced.
Clinical trials investigating the prevention of AWR (Avidan et al., 2008; Mashour et al.,
2012; Myles et al., 2004; Zhang et al., 2011) used specific thresholds for potentially insufficient
80
anesthesia, with the provider either being instructed to keep the BIS value between 40 and 60 or
with audible alarms if the BIS or MAC values fell outside defined ranges. The MAC and BIS
values chosen were based on previously published work, but to date, there has been no
systematic study of the appropriate threshold for MAC or BIS alarms for the prevention of AWR
based on prospectively collected data.
The parent trial for this study (Mashour et al., 2012) investigated whether the use of
alerting algorithms in cases randomized to either anaesthetic concentration or BIS values
decreased the incidence of AWR. It did not investigate the discrete MAC or BIS data elements
to determine whether there is a specific value that would maximize the sensitivity and specificity
in the prevention of AWR or explore any changes in provider behaviour when alerts are
generated. Therefore, the objective of this study was to test the hypothesis that there is an
evidence-based alerting threshold for MAC or BIS values that would maximize the sensitivity
and specificity of alarms aimed at preventing AWR. In addition, we sought to determine if
alerting the provider changes behaviour with respect to anaesthetic management in the
prevention of AWR.
Materials and Methods
This study is a pre-specified secondary analysis of the Michigan Awareness Control
Study (MACS) (ClinicalTrials.gov No. NCT00689091) (Mashour et al., 2012). The parent trial
and this secondary analysis were approved by the Institutional Review Board (IRB HUM 13626,
initial study approval 8/14/2007) of the University of Michigan, 2800 Plymouth Road, Building
520 Room 3214, Ann Arbor, MI 48109 (Chairmen: Drs Michael Geisser and John Weg). In
brief, we screened all adult patients between May 2008 and May 2010 presenting to a

81
multihospital healthcare system for surgery in which general anaesthesia using inhaled or
intravenous anaesthetic. A detailed discussion with each patient took place and verbal informed
consent was obtained and documented in our AIMS. Patients were excluded if the use of a BIS
monitor was impractical (e.g. intracranial procedures, adhesive allergy, surgery involving the
forehead) or underlying brain disorder rendered the BIS a questionable measure of consciousness
(e.g., history of traumatic brain injury). The BIS Quatro sensor (Covidien, Boulder, Colorado,
USA) was attached preoperatively in all patients by a member of the research staff. Alerts to
notify the provider of potentially insufficient anaesthetic dosing were based on either the age-
adjusted MAC (aaMAC) (Nickalls and Mapleson, 2003) or BIS values. For the parent trial,
aaMAC was calculated based on pre-specified age groups (Mashour et al., 2009a).
A detailed description of the randomisation and blinding is explained elsewhere
(Mashour et al., 2012; Mashour et al., 2009b) and is briefly summarized here. The study was
divided into eight quarters (eight 3-month periods over 2 years), with MAC and BIS alerting
algorithms randomly assigned for each quarter. For the MAC alerting rooms, the real-time BIS
values were hidden from the provider’s view. In addition, if the median ETAC for a 5-min
epoch was less than 0.5 aaMAC, an alphanumeric paging alert was sent to the provider in the
room. For the BIS alerting group, the BIS values were visible to the provider. In addition, if the
median BIS value for a 5-min epoch was greater than 60, an alphanumeric paging alert was
generated. A study team member contacted each patient and administered the modified Brice
interview 28-30 days after surgery (Abouleish and Taylor, 1976; Brice et al., 1970). As
described previously, after the modified Brice interview and additional interviews of potential
AWR patients (Mashour et al., 2012) were performed, each event was categorized as no AWR,
possible AWR or definite AWR. Data from other trials in which the authors were involved
82
(Avidan et al., 2011; Avidan et al., 2008) could not be included due to differences in data
acquisition systems and incomplete records of alarm delivery.
For the MACS trial, Centricity® (GE Healthcare, Madison, Wisconsin, USA) was the
AIMS system used for programming alerts and notifying providers via alphanumeric text paging.
Centricity® interfaces with the haemodynamic monitors (GE Marquette Solar 9500, Milwaukee,
Wisconsin, USA) and also with the anaesthesia machine (AISYS Anesthesia Machine, GE
Healthcare). ETAC values were automatically calculated in real time from the expired volatile
anaesthetic concentrations that were collected by the AISYS anaesthesia machine and
transmitted to Centricity®. BIS and ETAC data elements were electronically captured for every
patient by the AIMS every 60s and were available for later study extraction and analysis.
For this secondary analysis, we included cases in which inhaled volatile agents were used
as the primary anaesthetic. We excluded total intravenous anaesthetic (TIVA) cases, any case
for which a propofol infusion was used in conjunction with a volatile anaesthetic and any case
with missing volatile anaesthetic data due to infrequent AIMS data interface issues.
Secondary Analysis Methodology
All cases were reviewed to ensure complete data for ETAC and BIS values from an
electronically documented time of “anesthesia induction end” to the time of “request for
postanaesthesia care unit (PACU) bed” or “transport to the ICU.” For this secondary analysis,
aaMAC was calculated on the basis of the age documented in the AIMS at the time of operation
and not on the pre-specified age groups as in the parent trial (Nickalls and Mapleson, 2003).
The surgery was divided into 5-min epochs (during the AIMS timestamps listed previously) and
the median ETAC was calculated for each of those 5-min epochs. The overall median ETAC
83
was also calculated for each case. The same technique was used for patients with valid BIS
monitoring data.
Data were analyzed two different ways to determine a single threshold for the prevention
of AWR for ETAC and BIS values. First, the data were dichotomised by whether any 5-min
epoch was below (aaMAC) or above (BIS) a set value throughout the case. The maximum
sensitivity, specificity and Youden’s Index were calculated. Second, the median ETAC and BIS
values for the case were analysed using a receiver operating characteristic curve c-statistic. If the
c-statistic demonstrated adequate discriminating capacity (> 0.70), then the value with the
maximum sensitivity and specificity would be computed and retrospectively applied to the
database to determine a single threshold for the prevention of AWR.
To investigate whether the alerting algorithm changes provider behaviour, we first
calculated the percentage of the case during which the anaesthetic concentrations triggered the
alarm. This percentage was calculated by dividing the number of 5-min epochs that met the
ETAC alerting threshold by the number of 5-min epochs overall. We chose to present the data as
the percentage of the case duration instead of total minutes of the case to account for the variance
in length of procedures. A control group that had no real-time alerting interventions, distinct
from the ETAC and BIS groups, was used to explore whether there is a behavioural effect by
retrospectively applying the ETAC alerting algorithm. This group received neither BIS nor
MAC alerts yet was still assessed for AWR; the anaesthetic was delivered on the basis of routine
clinical and hemodynamic variables. The control group resulted from technical interface issues
from the parent trial and was not prespecified (Mashour et al., 2012). However, as there was a
“no intervention” group that resulted from MACS, we could assess whether there was a
behavioural effect attributable to having alerts generated throughout the case. This was
84
accomplished by retrospectively applying the ETAC alerting algorithm to the “no intervention”
group and calculating what percentage of time the case would have triggered an alarm if an
algorithm had been active in real time. The percentage of the case during which the anaesthetic
triggered the ETAC alerting algorithm was then compared between the original ETAC
intervention arm and post hoc control group. The mean percentage of the case that triggered an
alarm was also examined for change in behaviour across the study period for both the ETAC and
BIS arms. If the mean percentage changed across the quarters, this would indicate that
anesthetic delivery behaviour had changed.
Statistical Analysis
Due to the low incidence of definite AWR in the parent trial and the potential
psychological impact of possible AWR, we combined definite and possible AWR events into one
category for this secondary analysis. To determine whether there was a single threshold that
maximises sensitivity and specificity for the prevention of AWR, aaMAC for all cases was
dichotomised by whether the case did or did not have any 5-min median epochs in which the
aaMAC was less than 0.4, less than 0.5, less than 0.6, less than 0.7, less than 0.8 or less than 0.9.
The same dichotomising technique was used for cases with valid BIS data that had at least one 5-
min median epoch with BIS more than 60, more than 70, BIS more than 80 or more 90. The
baseline BIS threshold was set at 60 because this generally represents the threshold between
general anesthesia (<60) and sedation or wakefulness (>60) (Glass et al., 1997). Sensitivity,
specificity and Youden’s Index were then calculated to determine whether there was an optimal
threshold for the prevention of AWR for either aaMAC or BIS. The Youden’s Index was
calculated as (sensitivity + specificity – 1) (Bewick et al., 2004). A Youden’s Index of 1 would
indicate the threshold is perfect and a Youden’s index of 0 would indicate the threshold has no

85
diagnostic value in the prevention of AWR (Bewick et al., 2004). Next, a c-statistic was
calculated from a receiver operating characteristic curve to determine whether there is a single
diagnostic threshold for either ETAC or BIS that can be quantified for prevention of AWR. If
the c-statistic was deemed adequate (>0.70), then the continuous data for both aaMAC and BIS
would be analysed to determine the specific threshold in the prevention of AWR.
A Mann-Whitney U test was performed to assess whether providers receiving the original
MAC alerts differed statistically when compared to the “no intervention” (i.e. no alert) group for
the entire time period and by quarter of the study. To determine whether there was a
behavioural change, as documented by a significant difference in the percentage of the case that
triggered an alert for potentially insufficient anaesthesia, a Kruskal-Wallis test was performed for
both MAC and BIS arms across the study period. Data are displayed as the mean percentage of
the case to trigger an alert ± 2x SEM.
SPSS® version 20 (IBM® Corp, Armonk, New York, USA) was used for all analyses.
Data extraction from AIMS was completed using structured query language. A p-value of less
than 0.05 was considered statistically significant throughout.
Results
The parent trial had a total of 18,836 patients with complete information on the AWR
outcome. We excluded 231 cases because of the use of TIVA, 297 for agent analyser device
technical issues and 2,240 for use of an adjunct intraoperative propofol infusion. This resulted in
the dataset of 16,068 patients, with a total of 32 definite or possible AWR events (Figure 1).
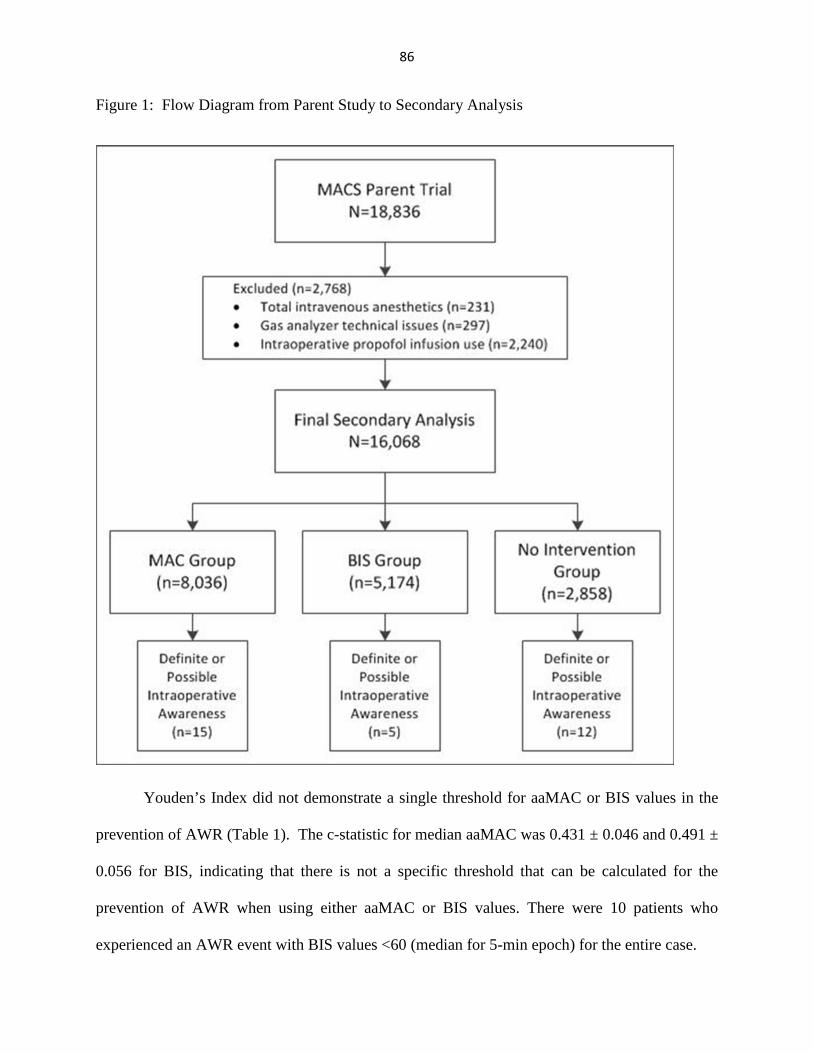
86
Figure 1: Flow Diagram from Parent Study to Secondary Analysis
Youden’s Index did not demonstrate a single threshold for aaMAC or BIS values in the
prevention of AWR (Table 1). The c-statistic for median aaMAC was 0.431 ± 0.046 and 0.491 ±
0.056 for BIS, indicating that there is not a specific threshold that can be calculated for the
prevention of AWR when using either aaMAC or BIS values. There were 10 patients who
experienced an AWR event with BIS values <60 (median for 5-min epoch) for the entire case.

87
Table 1: Sensitivity, Specificity, and Youden’s Index for each case that had valid measurements for End-tidal Anesthetic Concentration and Bispectral Index values
aaMAC
Sensitivity (95% CI) Specificity (95% CI) Youden’s Index
aaMAC <0.4 0.28 (0.14-0.47) 0.79 (0.79-0.79) 0.07 (-0.06 – 0.26)
aaMAC <0.5 0.38 (0.22-0.56) 0.71 (0.71-0.71) 0.08 (-0.08-0.27)
aaMAC <0.6 0.44 (0.27-0.62) 0.59 (0.59-0.60) 0.03 (-0.14-0.24)
aaMAC<0.7 0.59 (0.41-0.76) 0.45 (0.45-0.45) 0.05 (-0.14-0.21)
aaMAC<0.8 0.78 (0.60-0.90) 0.30 (0.30-0.30) 0.08 (-0.10-0.20)
aaMAC<0.9 0.81 (0.63-0.92) 0.18 (0.18-0.18) -0.01 (-0.19-0.10)
BIS
Sensitivity (95% CI) Specificity (95% CI) Youden’s Index
BIS ≥ 60 0.09 (0.01-0.43) 0.72 (0.72-0.72) -0.19(-0.28-0.15)
BIS ≥ 70 0.00 (0.00-0.32) 0.91 (0.91-0.91) -0.09 (-0.09-0.24)
BIS ≥ 80 0.00 (0.00-0.32) 0.97 (0.97-0.97) -0.03 (-0.03-0.29)
BIS ≥ 90 0.00 (0.00-0.31) 0.99 (0.99-0.99) -0.01 (-0.01-0.31) aaMAC = age-adjusted MAC; BIS = Bispectral Index; CI = Confidence Interval When applying the ETAC alerting algorithm retrospectively to the “no intervention” (i.e.
no alerts) cases, we determined that cases randomised to MAC alerting had a statistically shorter
mean percentage of the case that generated an alert for potentially insufficient anaesthesia than
the “no intervention” cases (2.4% ± 7.5% versus 3.1% ± 8.5%, p=0.009). Four of the eight
quarters demonstrated these findings, although the remaining quarters did not reach statistical
significance (Figure 2). In the trend analysis by study period, the mean percentage of the case
that triggered a potentially insufficient anaesthetic alert in the ETAC arm increased significantly
(p <0.001) (Figure 3). However, the mean percentage of the case that generated a BIS alert via
the alerting algorithm did not change across the study period (p=0.38) (Figure 4).
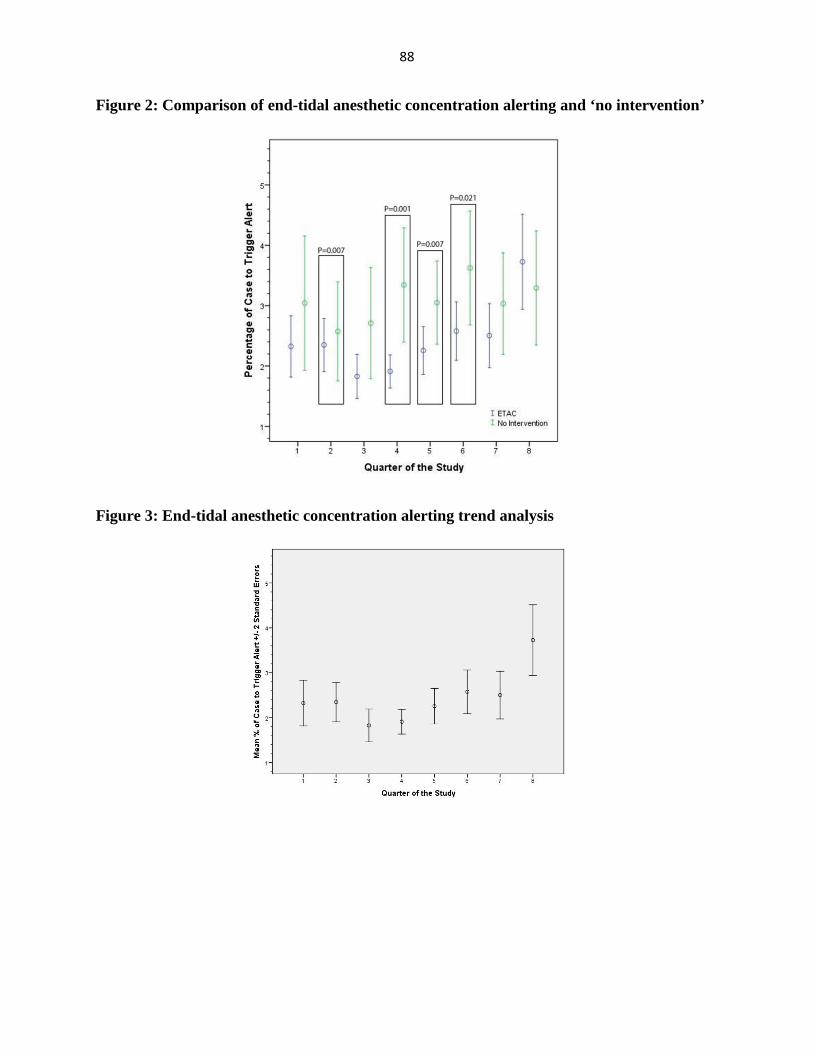
88
Figure 2: Comparison of end-tidal anesthetic concentration alerting and ‘no intervention’
Figure 3: End-tidal anesthetic concentration alerting trend analysis
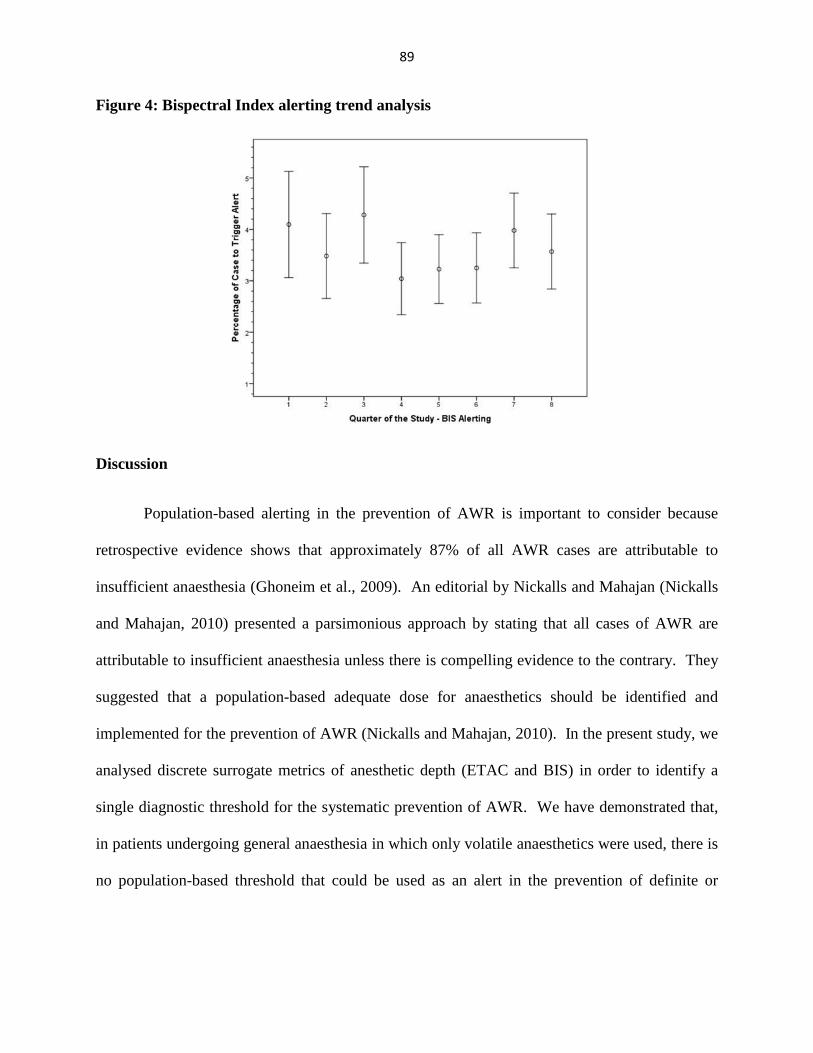
89
Figure 4: Bispectral Index alerting trend analysis
Discussion
Population-based alerting in the prevention of AWR is important to consider because
retrospective evidence shows that approximately 87% of all AWR cases are attributable to
insufficient anaesthesia (Ghoneim et al., 2009). An editorial by Nickalls and Mahajan (Nickalls
and Mahajan, 2010) presented a parsimonious approach by stating that all cases of AWR are
attributable to insufficient anaesthesia unless there is compelling evidence to the contrary. They
suggested that a population-based adequate dose for anaesthetics should be identified and
implemented for the prevention of AWR (Nickalls and Mahajan, 2010). In the present study, we
analysed discrete surrogate metrics of anesthetic depth (ETAC and BIS) in order to identify a
single diagnostic threshold for the systematic prevention of AWR. We have demonstrated that,
in patients undergoing general anaesthesia in which only volatile anaesthetics were used, there is
no population-based threshold that could be used as an alert in the prevention of definite or

90
possible AWR for either ETAC or BIS. The population data from Youden’s index suggest that
the thresholds studied would not result in the eradication of AWR.
The thresholds that we selected were representative of what would be considered
standard of care aaMAC for patients under general anaesthesia. Concentrations higher than 1.0
aaMAC were excluded from this analysis because of very high false positive alarms at thresholds
of at least 0.7 MAC (Mashour et al., 2009a). It is important to note that Youden’s index
incorporates data on both sensitivity and specificity. As Table 1 indicates, lower alerting
thresholds (e.g., higher anaesthetic concentrations) increase sensitivity at the cost of decreasing
specificity. Thus, including thresholds of AWR alerting beyond 1 MAC would further increase
sensitivity, but would probably not increase Youden’s index due to the concomitant decrease in
specificity. In addition, the c-statistics indicated that, for both aaMAC and BIS, there was
approximately a 50% chance (essentially random) of determining the correct threshold in the
prevention of AWR using a population-based approach (Bewick et al., 2004).
To date, multiple randomised controlled trials have been conducted using a population-
based alerting (or monitoring) strategy in which a specific alarm or range for ETAC or BIS was
established for the prevention of AWR (Avidan et al., 2011; Avidan and Mashour, 2013; Avidan
et al., 2008; Mashour et al., 2012; Myles et al., 2004). Myles et al. found that BIS monitoring
(maintained between 40 and 60) was associated with a relative risk reduction of 82% in surgical
patients at high risk for AWR when compared to routine monitoring (Myles et al., 2004). The
next two trials used audible alerts to notify the provider of potentially insufficient anesthesia in
patients at high risk for AWR. Avidan et al. found that both BIS and ETAC alarms reduced
observed awareness events compared to the expected incidence (Avidan et al., 2011; Avidan et
al., 2008). Mashour et al. included unselected surgical patients requiring general anesthesia and

91
demonstrated that BIS alerting protocols reduced the incidence of definite or possible AWR
compared to no intervention (Mashour et al., 2012). The persistence of AWR in previous trials
suggests that population-based alerting approaches for insufficient anaesthesia will not eradicate
AWR. The current study adds to the literature by suggesting that it was not simply the empirical
or arbitrary determination of alerting thresholds in past trials that failed to eradicate AWR
because our systematic analysis and comparison suggest that no one threshold exists. Rather
than arguing that BIS or ETAC alerts are not useful, we would instead encourage clinicians to
choose some threshold to prevent egregious causes of AWR (such as an empty vaporiser). Past
randomised controlled trials demonstrate that alerts are, in fact, associated with reduced AWR.
At an individual level, we know that there is a specific threshold at which the patient will
be likely to experience AWR. The identification of such a threshold will, in the future, probably
be guided by risk factors for AWR coupled with more sophisticated monitoring. Previous work
has reported specific patient-based risk factors for AWR. Further identification of risk factors, in
conjunction with developments in monitoring the neural substrates of consciousness, must
ultimately be incorporated into prevention strategies for AWR at an individualised level.
Fundamentally, individualised-based alerting strategies would not be beneficial without
establishing evidence that real-time alarms are capable of changing behaviour. We have
demonstrated that real-time alerting alters the administration of anaesthetics. When
retrospectively applying the MAC alerting algorithm to the “no intervention” cases in the parent
trial, the providers that were not alerted to potentially insufficient anesthesia had lower MAC
values throughout the case than those that were actually alerted in real time. This indicates that
the providers receiving alerts were statistically more likely to keep the anesthetic concentration
within the stated range for the trial and, we infer, changed their behaviour to do so. These results

92
confirm other previously published studies that providing clinicians with alerts can drive a
change in clinical care (Bates et al., 2001; Eden et al., 2009; Kheterpal et al., 2007; Kooij et al.,
2008; Kucher et al., 2005; O'Reilly et al., 2006; St Jacques et al., 2005; Wax et al., 2007).
When alerting is used to notify providers to change behaviour, there is the potential for
alert fatigue, which is defined as the provider becoming less responsive due to an alarm
becoming bothersome or ineffective. Alert fatigue is an increasingly prevalent phenomenon in
the medical community, especially with the rapid advancement of electronic medical records
(Baker, 2009; Kesselheim et al., 2011; Lee et al., 2010). Block et al. surveyed anaesthesiologists
practising in the USA and found that 70% of the time alarms were silenced was due to the
perception of a false alarm (Block et al., 1999). Only 16% of providers stated that they never
turn off alarms (Block et al., 1999). Therefore, it is imperative to minimise false alarms—and,
consequently, alert fatigue—in developing an alerting strategy for AWR, a difficult task given
the rarity of the outcome. This is one reason why the current study focused on sensitivity and
specificity. We found evidence of alert fatigue as well as possible desensitisation to ETAC alerts
across the study period. The mean percentage of the case that generated an ETAC alert changed
significantly during the last quarter of the trial, with alerts having increased approximately 1.2%
from the previous quarter and 1.5% from the beginning of the study. These data could indicate
that the providers thought the alerts were false alarms and therefore were becoming desensitised
and fatigued as the study continued (delayed alert fatigue). However, these findings were only
found in the last quarter of the study and could also be an outlier. The BIS alerting rate was
consistent throughout the study and showed no evidence of generating desensitisation or alert
fatigue.

93
The main limitation of this study was the small number of AWR outcomes in our
population (n=32). To move towards an individualized alerting approach, a multinomial logistic
regression model must be developed that incorporates patient-specific risk factors (such as
history of AWR (Aranake et al., 2013)) along with anaesthetic concentrations and, if possible,
neurophysiologic indices. Furthermore, we used the median from a 5-min period and must
acknowledge that individual BIS or MAC values could have nonetheless fluctuated in a way that
might not be detected with our methodology. Finally, the current study only investigated a
threshold using general anaesthesia with inhaled anaesthetics and is therefore not generalisable to
cases performed using TIVA.
In conclusion, we could not identify a single practical threshold of ETAC or BIS values
that can be chosen for the eradication of definite and possible AWR in a broad surgical
population. Although alerts have been demonstrated to prevent AWR, future work must move
towards an individualised patient-based approach incorporating specific risk factors as well as
monitoring the neural substrates of consciousness. Indeed, recent studies have demonstrated
promise in identifying correlates of anaesthetic-induced unconsciousness based on the
neurobiology of consciousness (Casali et al., 2013; Lee et al., 2013). Finally, we were able to
demonstrate that providing alerts via an AIMS can influence intraoperative care, but ETAC
alerting has the potential for desensitisation and alert fatigue.
This is my primary body of work and was previously published in full with tables and figures by Wolters Kluwer Health Lippincott Williams & Wilkins: Shanks AM, Avidan MS, Kheterpal S, Tremper KK, Vandervest JC, Cavanaugh JM, Mashour GA. Alerting thresholds for the prevention of intraoperative awareness with explicit recall. Europeon Journal of Anaesthesiology 2014 (31) 1-8. Reuse is free and no permission is required
94
Chapter 6 - Intraoperative Awareness Monitoring and Past Research Overview
By conducting the largest prospective clinical trial on AWR in an unselected surgical
adult population, it was determined that BIS alerting did not appear to be superior to MAC-based
alarms incorporating IV anesthetics at preventing AWR events. Through a secondary analysis of
the traditional MAC calculations and investigating individual BIS values, it was demonstrated
that there is no single population-based alerting algorithm using either the MAC or BIS values to
alert the clinician in the prevention and eradication of AWR. Therefore, the field of
anesthesiology must move past the population-based approach in alerting for the eradication of
AWR and develop a patient-based alerting system.
Over the past decade, the medical community has recognized the need to develop
enhanced monitoring techniques with the aim of preventing intraoperative awareness with recall
(AWR). The Joint Commission on Accreditation of Hospital Organizations issued a sentinel
event in 2004 stating that “anesthesia awareness is under-recognized and under-treated”
(JACHO, 2004). They specifically recommended use of effective anesthesia monitoring tools to
aid in the prevention of AWR (JACHO, 2004). The American Society of Anesthesiologists
(ASA) developed a task force in 2006 to “provide guidance for the intraoperative use of brain
function monitors as they relate to intraoperative awareness” (ASA Task Force, 2006). Since
this time, several large prospective trials have been completed to determine superior methods of
alerting clinicians to the possibility of insufficient anesthesia, which is the most common cause
of AWR, using both anesthetic concentration monitoring and brain function monitoring (such as
the Bispectral Index [BIS]) (Avidan et al., 2011; Avidan et al., 2008; Mashour et al., 2012;
Myles et al., 2004; Zhang et al., 2011).

95
Anesthetic depth has traditionally been quantified for the clinician as “minimum alveolar
concentration” (MAC). MAC represents the concentration of anesthetic that will suppress
movement in response to a noxious stimulus in 50% of the population, was developed for
inhalational anesthetics only and quantifies differences in potency among the different
inhalational agents (Eger et al., 1965). MAC represents the partial pressure of the inhaled
anesthetic vapor in the alveoli of the lungs (Gelb, 2009; Quasha et al., 1980). The partial
pressure of any vapor in the body, when at equilibrium, will be the same in all tissues in the
body, including the brain. Therefore, the MAC represents the partial pressure of the vapor in the
brain, but not the actual concentration of the anesthetic vapor (Quasha et al., 1980). Brain wave
monitoring, derived from a processed electroencephalographic (EEG) wave, reflects the activity
of the end organ of interest in AWR, the brain, and is not based on a pharmacologic measure.
However, there is not one specific component of the processed EEG that can used as a predictor
of the depth of anesthesia and the type of anesthetic used affects the EEG interpretation
(Drummond et al., 1991).
Starting in 2004, several prospective randomized trials were completed to investigate if
anesthetic concentration monitoring (MAC) or EEG-based monitoring (BIS) were superior in
prevention of AWR (Avidan et al., 2011; Avidan et al., 2008; Myles et al., 2004). The B-Aware
trial compared BIS monitoring to routine clinical care in a high risk surgical population for the
prevention of AWR (Myles et al., 2004). Myles et al. concluded that BIS monitoring reduced the
relative risk of AWR by 82% and suggested all high risk patients should be monitored with the
BIS (Myles et al., 2004). The B-Aware trial did not alert the clinicians when the BIS values
were outside a targeted range and had no active comparator in the control group. Therefore, in
2008 the B-Unaware trial investigated if BIS, when compared to MAC monitoring, had a lower

96
incidence of AWR in the high risk surgical population using targeted alerting mechanisms
(Avidan et al., 2008). Avidan et al. demonstrated no statistically significant difference in the
incidence of AWR between the two monitoring techniques and suggested the B-Unaware trial
did not support routine use of BIS monitoring in high risk surgical population (Avidan et al.,
2008). Avidan et al. followed up on this finding with a multi-center BAG-RECALL trial to
compare BIS and MAC monitoring in the prevention of awareness in high risk surgical patients
with targeting alerting mechanisms (Avidan et al., 2011). Once again, the superiority of BIS,
when compared to MAC, could not be established (Avidan et al., 2011).
The B-Aware, B-Unaware, and BAG-RECALL trials all investigated different AWR
monitoring techniques in the high risk surgical population. The targeted BIS values for each trial
were based on validated research that showed 95% of patients were unconsciousness when the
BIS value was 50 and recommended that anesthetics should be titrated to a BIS value between 40
and 60 to prevent AWR (Glass et al., 1997). The targeted MAC values for the B-Unaware and
BAG-RECALL trials were based on the assumption that 0.7 MAC would general suppress
consciousness and memory for surgical events. The value of 0.7 MAC was chosen because
when several anesthetic volatile agents are used in conjunction with one another an end-tidal
anesthetic concentration (ETAC) is equated since the MAC equivalents for each agent are
additive. Research has demonstrated that 50% of subjects will lose responsiveness to a
command when the ETAC is one-third of the MAC (Eger, 2001). Therefore, if the ETAC is
maintained above the 0.7 MAC, this may reduce AWR (Ghoneim, 2010; Gonsowski et al.,
1995). The B-Unaware and BAG-RECALL trials restricted their anesthetics to inhalational
agents only. Furthermore, the B-Aware, B-Unaware, and BAG-RECALL trials did not focus on
unselected surgical patients at all risk levels for AWR. Finally, since many surgical cases are
97
now using a combined technique between IV and inhalational anesthetics, an “anesthetic
concentration” concept was needed when investigating AWR prevention alerting techniques.
Development of the Anesthetic Concentration Alert Incorporating IV Anesthetics
To adequately assess if alerting techniques based on MAC or BIS are superior in the
prevention of AWR, the traditional MAC concept must also include IV anesthetics in addition to
the inhaled anesthetics used. Intravenous anesthetics are known to have a “MAC sparing” effect
(Mashour et al., 2009a). Therefore, we developed a “MAC equivalent” alert that incorporated
the inhalational anesthetic vapor MAC with IV agents (Mashour et al., 2009a). The algorithm
for the “MAC equivalent” alert was based on clinical experience and was not validated or
verified by independent measures. Using a retrospective review, we identified 15,091 cases that
did not have AWR and 12 cases of AWR from a generalized surgical population at a large
tertiary academic hospital (Mashour et al., 2009a). We retrospectively applied our “MAC
equivalent” algorithm for both AWR and non-AWR cases to determine at which MAC
equivalent (age-adjusted) threshold would demonstrate optimal sensitivity and specificity in the
detection of AWR.
In the selection of the proper threshold to use for anesthetic concentration alerting for
future prospective trials that incorporate the effects of IV anesthetics on the MAC value, an
optimal signal-to-noise ratio must be determined that results in a tradeoff between sensitivity and
specificity. We concluded that a threshold of <0.8 was most sensitive to the detection of AWR
and had the best negative likelihood ratio but the threshold of <0.5 was associated with the best
positive likelihood ratio (Mashour et al., 2009a). Therefore, we selected <0.5 age-adjusted MAC

98
equivalent to be used as the alerting threshold for the Michigan Awareness Control Study
(clinical trial NCT00689091) (Mashour et al., 2012).
Michigan Awareness Control Study
The Michigan Awareness Control Study (MACS) sought to determine if a BIS or
anesthetic concentration (adjusted for IV anesthetic effects) alerting for possible insufficient
anesthesia would decrease the incidence of AWR in an unselected and broad surgical population
(Mashour et al., 2012). The results demonstrated that BIS and MAC alerting techniques did not
differ with respect to the prevention of AWR. However, when BIS alerting was compared
against routine standard of care (i.e. no alerting to clinicians), we demonstrated a 4.7-fold
reduction in definite or possible AWR (Mashour et al., 2012). Therefore, MACS findings
support the conclusions found in the B-Aware, B-Unaware, and BAG-RECALL trials even
though the patient populations were different and the anesthetic concentration alerting adjusted
for the effects of IV anesthetics. For this trial, the anesthetic concentration alerting was based
upon the “MAC equivalent” algorithm and is not directly comparable to the B-Unaware and
BAG-RECALL trials.
Systematic Analysis of Alerting Thresholds in the Prevention of AWR
There have been no systematic analyses of appropriate thresholds to develop population-
based alerting algorithms in the prevention of AWR. Three trials (Avidan et al., 2011; Avidan et
al., 2008; Mashour et al., 2012) specifically investigated AWR between two empirically derived
alerting protocols with pre-defined thresholds. However, there was no principled approach to
determining the optimal alerting threshold for each of these techniques. Therefore, we sought to
identify a threshold for AWR alerting for both BIS and MAC monitoring using granular

99
continuous data electronically captured during the MACS trial (Shanks et al., 2014). Since the
“MAC equivalent” alert has not been validated, this study only used age-adjusted MAC
(aaMAC) values. All cases that were performed under total IV anesthesia or any case that used
an IV infusion with an inhalational anesthetic were removed for this secondary analysis (Shanks
et al., 2014).
Two techniques were employed to determine an appropriate threshold for both BIS and
aaMAC alerts using the granular data. First, data were dichotomized based on whether a 5-
minute epoch during the surgical case was below (for aaMAC) or above (for BIS) clinically
relevant thresholds. The sensitivity, specificity, and Youden’s Index were also calculated.
Second, the median MAC and BIS values were individually analyzed using a receiver operator
characteristic (ROC) curve c-statistic. If the c-statistic was deemed adequate to demonstrate a
discriminating capacity (>0.70), then the value for MAC and BIS with the maximum sensitivity
and specificity would be calculated and retrospectively applied to the database.
Youden’s index did not demonstrate a single threshold for either aaMAC or BIS in the
prevention of AWR (Shanks et al., 2014). Neither c-statistic reached discriminating capacity to
determine a threshold based on the median continuous aaMAC and BIS data (Shanks et al.,
2014). Therefore, we have demonstrated that in patients receiving only volatile anesthetics, no
population-based threshold can be used to alert clinicians in the prevention of AWR (Shanks et
al., 2014).
Future Directions of a Patient-Based Monitoring Approach in the Prevention of AWR
The prospective clinical trials on the prevention of AWR (Avidan et al., 2011; Avidan et
al., 2008; Mashour et al., 2012; Myles et al., 2004) and the secondary systematic analyses of

100
granular data (Shanks et al., 2014) have demonstrated that the field of anesthesiology must move
beyond the population-based approach in prevention of AWR and towards an individualized
patient-based approach. The specific neuroscientific mechanisms of anesthetic-induced
unconsciousness are beyond the scope of this project. However, to discuss a patient-based
monitoring approach in the prevention of AWR, a brief discussion of consciousness and
unconsciousness within brain networks is warranted.
Consciousness is a complex process that is poorly understood. One current theory
suggests that that there is a feedback of information from the frontal cortex to more primary
sensory areas in the brain that helps select neural information for representation and
“broadcasting” (Changeux, 2012; Dehaene and Changeux, 2011; Dehaene et al., 1998). This
model is referred to as the Global Neuronal Workspace (GNW). Specifically, the GNW states
that to form a conscious experience, there is a set of long-range excitatory axons originating with
the pyramidal cells of the prefrontal cortex that extend towards the thalamocortical loops
(Changeux, 2012; Dehaene and Changeux, 2011; Dehaene et al., 1998). In support of this and
other theories related to information synthesis in the brain, anesthetics disrupt this feedback
connectivity from the frontal cortex in association with unconsciousness (Lee et al., 2013). This
finding is consistent with the cognitive unbinding paradigm of general anesthesia (Changeux,
2012; Lee et al., 2009; Mashour, 2004, 2013).
To determine accurately that a patient is unconscious during exposure to a general
anesthetic, practical assessment of connectivity disruption is needed. Recently Lee et al. studied
frontal-parietal feedback connectivity disruption in surgical patients anesthetized with three
commonly used anesthetics: ketamine, propofol and sevoflurane (Lee et al., 2013). Eight-
channel EEG recording was conducted and normalized symbolic transfer entropy was used as an

101
analytic technique assessing directed connectivity (Lee et al., 2013). The authors demonstrated
that each of these molecularly and neurophysiologically diverse anesthetics disrupted feedback
connectivity (Lee et al., 2013). Another technique for identifying the breakdown of cortical
connectivity and communication is the perturbational complexity index (PCI). PCI assesses the
EEG’s response to transcranial magnetic stimulation and is an index of the level of information
contained in the response of the brain to the perturbation of the stimulus (Casali et al., 2013).
The findings indicated that PCI successfully demonstrated the breakdown of cortical
communication in anesthetized patients (Casali et al., 2013). These two recent studies have
demonstrated that in humans undergoing anesthesia, it is possible to demonstrate a disruption of
cortical connectivity and communication across all major classes of anesthetics.
Patient Monitoring Towards the Eradication of Awareness – The Next Steps
We have demonstrated that there is no discriminating threshold at the population-based
level below which (aaMAC) or above which (BIS) AWR is eradicated (Shanks et al., 2014).
Therefore, it is imperative to revise the assumptions that there is one set value for all patients to
prevent AWR towards an individualized patient-based approach. This study has demonstrated
the need for patient-based algorithms in the prevention of AWR and the need to incorporate the
neurobiology of consciousness (and unconsciousness). One way to develop and validate a
patient-based alerting algorithm, is to use a multivariate logistic regression model that will
determine independent predictors of AWR. Individual risk factors that have already been
associated with an increased incidence of AWR will be covariates in the model, including:
patient history of AWR (Aranake et al., 2013), high risk surgery, volume status, chronic use of
alcohol, chronic use of opioids (either as a Boolean concept or the morphine equivalents for
current opioid consumption), chronic use of sedative hypnotics, acute use of amphetamines,
102
female sex, age (binned by decade of life), obesity (categorized by the World Health
Organization standards) and multiple approaches to assessing depth of anesthesia (Schneider et
al., 2014). The multivariate logistic regression model would need to be developed on a set of
patients with prospectively collected data in an AIMS as well as post-operative Brice interviews
to document the AWR event. This would require a minimum of 200 AWR patients in the
development database as well as another 200 patients in the validation database to follow the rule
of 10 which was developed to prevent overfitting the logistic regression model and states that for
every covariate placed into a model, there must be at least 10 patients with the outcome of
interest (AWR) (Harrell et al., 1984). When a model is overfit, the results may be “fitting” the
noise and not the actual signal or the true underlying covariates that are independent predictors
of AWR and can be used in patient-based alerting algorithms. Currently there are no trials that
have been conducted that would allow this level of modeling to be performed properly. Once the
data are available, the independent risk factors that are identified, and validated, can then be
programmed into an AIMS system to risk-adjust and alert clinicians on a patient-based level for
the prevention of AWR.

103
Appendix I: Actual SQL code for Alerting Algorithms
Below is the actual SQL code running in real-time within the Centricity (GE Healthcare®)
database to alert providers when the median anesthetic concentration <0.5 or the median BIS
value was >60 for a 5 minute period
Anesthetic Concentration Alert Algorithm
IF @age_in_years <= 39 SELECT @sevo_mac = 2.4 , @iso_mac = 1.3 , @halo_mac = 0.9 , @des_mac = 7.0 , @nitrous_mac = 105 IF @age_in_years >= 40 AND @age_in_years <= 59 SELECT @sevo_mac = 1.7 , @iso_mac = 1.1 , @halo_mac = 0.75 , @des_mac = 6.0 , @nitrous_mac = 105 IF @age_in_years >= 60 AND @age_in_years <= 79 SELECT @sevo_mac = 1.5 , @iso_mac = 1.0 , @halo_mac = 0.7 , @des_mac = 5.2 , @nitrous_mac = 105 IF @age_in_years >= 80 SELECT @sevo_mac = 1.2 , @iso_mac = 0.8 , @halo_mac = 0.65 , @des_mac = 4.5 , @nitrous_mac = 105 SELECT @total_mac = ( ( @sevo_conc / @sevo_mac ) + ( @iso_conc / @iso_mac ) + ( @des_conc / @des_mac ) + ( @nitrous_conc / @nitrous_mac ) ) IF @total_mac <= @mac_threshold BEGIN --GET THE CURRENT DEX Rate IF @dex_rate >= 0.2
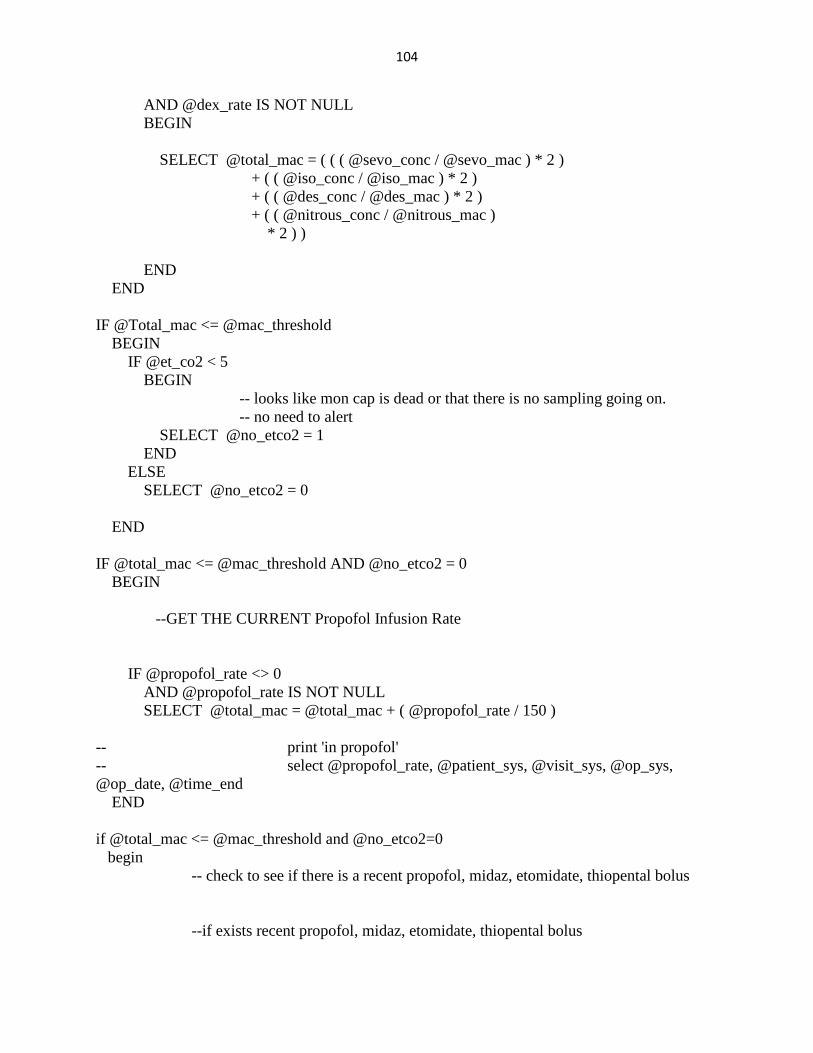
104
AND @dex_rate IS NOT NULL BEGIN SELECT @total_mac = ( ( ( @sevo_conc / @sevo_mac ) * 2 ) + ( ( @iso_conc / @iso_mac ) * 2 ) + ( ( @des_conc / @des_mac ) * 2 ) + ( ( @nitrous_conc / @nitrous_mac ) * 2 ) ) END END IF @Total_mac <= @mac_threshold BEGIN IF @et_co2 < 5 BEGIN -- looks like mon cap is dead or that there is no sampling going on. -- no need to alert SELECT @no_etco2 = 1 END ELSE SELECT @no_etco2 = 0 END IF @total_mac <= @mac_threshold AND @no_etco2 = 0 BEGIN --GET THE CURRENT Propofol Infusion Rate IF @propofol_rate <> 0 AND @propofol_rate IS NOT NULL SELECT @total_mac = @total_mac + ( @propofol_rate / 150 ) -- print 'in propofol' -- select @propofol_rate, @patient_sys, @visit_sys, @op_sys, @op_date, @time_end END if @total_mac <= @mac_threshold and @no_etco2=0 begin -- check to see if there is a recent propofol, midaz, etomidate, thiopental bolus --if exists recent propofol, midaz, etomidate, thiopental bolus

105
SELECT @hypnotic_bolus_yn=1 --else select @hypnotic_bolus_yn =0 end if @room_number_int % 2 = 0 --Even Rooms begin select @bis_room_yn =1 select @mac_room_yn = 0 end else --Odd Rooms begin select @bis_room_yn =0 select @mac_room_yn =1 END if @total_mac <= @mac_threshold and @no_etco2=0 select @mac_alert_yn=1 IF @mac_room_yn = 1 AND @mac_alert_yn = 1 BEGIN --If user has NOT choosen to "suspend" alerts for 15 minutes: --Page user of a MAC alert END BIS Alert Algorithm
if @bis_value > @bis_threshold select @bis_alert_yn=1 IF @bis_room_yn = 1 AND @bis_alert_yn = 1 BEGIN --If user has NOT choosen to "suspend" alerts for 15 minutes: --Page user of a BIS alert END --Insert alert into log table of all alerts.
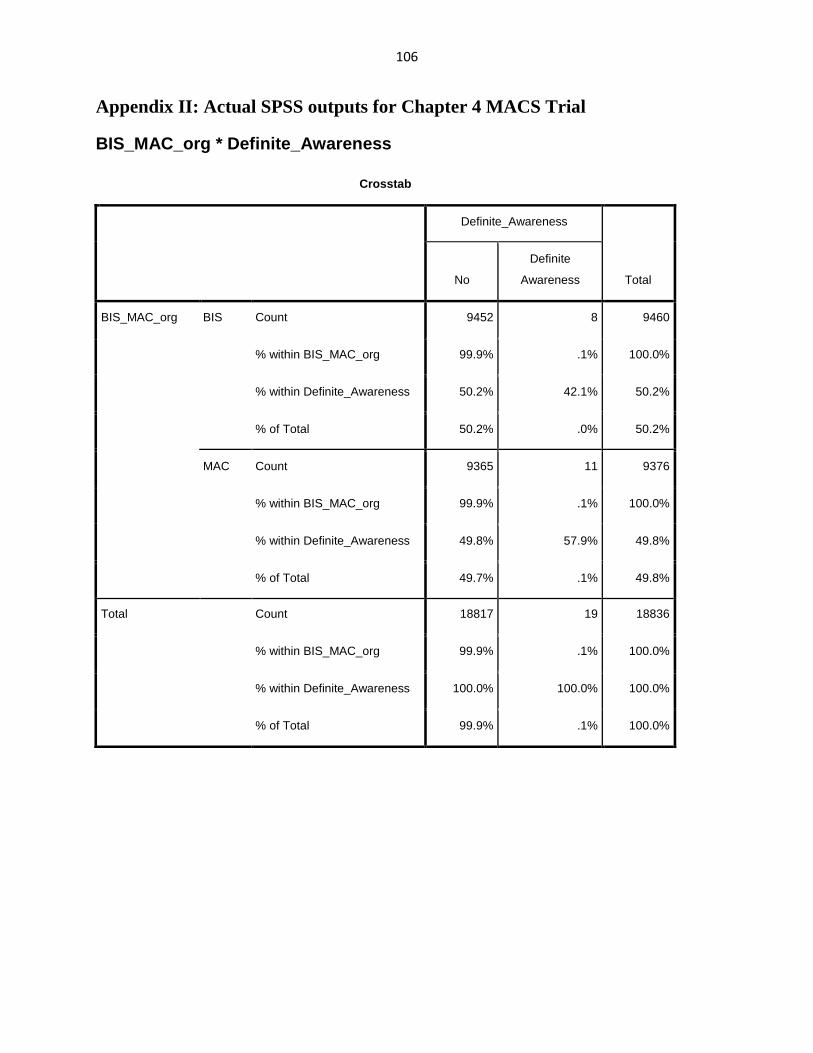
106
Appendix II: Actual SPSS outputs for Chapter 4 MACS Trial
BIS_MAC_org * Definite_Awareness
Crosstab
Definite_Awareness
Total No
Definite
Awareness
BIS_MAC_org BIS Count 9452 8 9460
% within BIS_MAC_org 99.9% .1% 100.0%
% within Definite_Awareness 50.2% 42.1% 50.2%
% of Total 50.2% .0% 50.2%
MAC Count 9365 11 9376
% within BIS_MAC_org 99.9% .1% 100.0%
% within Definite_Awareness 49.8% 57.9% 49.8%
% of Total 49.7% .1% 49.8%
Total Count 18817 19 18836
% within BIS_MAC_org 99.9% .1% 100.0%
% within Definite_Awareness 100.0% 100.0% 100.0%
% of Total 99.9% .1% 100.0%

107
Chi-Square Tests
Value df
Asymp. Sig. (2-
sided)
Exact Sig. (2-
sided)
Exact Sig. (1-
sided)
Pearson Chi-Square .501a 1 .479
Continuity Correctionb .229 1 .632
Likelihood Ratio .503 1 .478
Fisher's Exact Test .501 .317
Linear-by-Linear Association .501 1 .479
N of Valid Cases 18836
a. 0 cells (.0%) have expected count less than 5. The minimum expected count is 9.46.
b. Computed only for a 2x2 table
Risk Estimate
Value
95% Confidence Interval
Lower Upper
Odds Ratio for BIS_MAC_org
(BIS / MAC)
1.388 .558 3.452
For cohort
Definite_Awareness = No
1.000 .999 1.001
For cohort
Definite_Awareness = Definite
Awareness
.721 .290 1.791
N of Valid Cases 18836
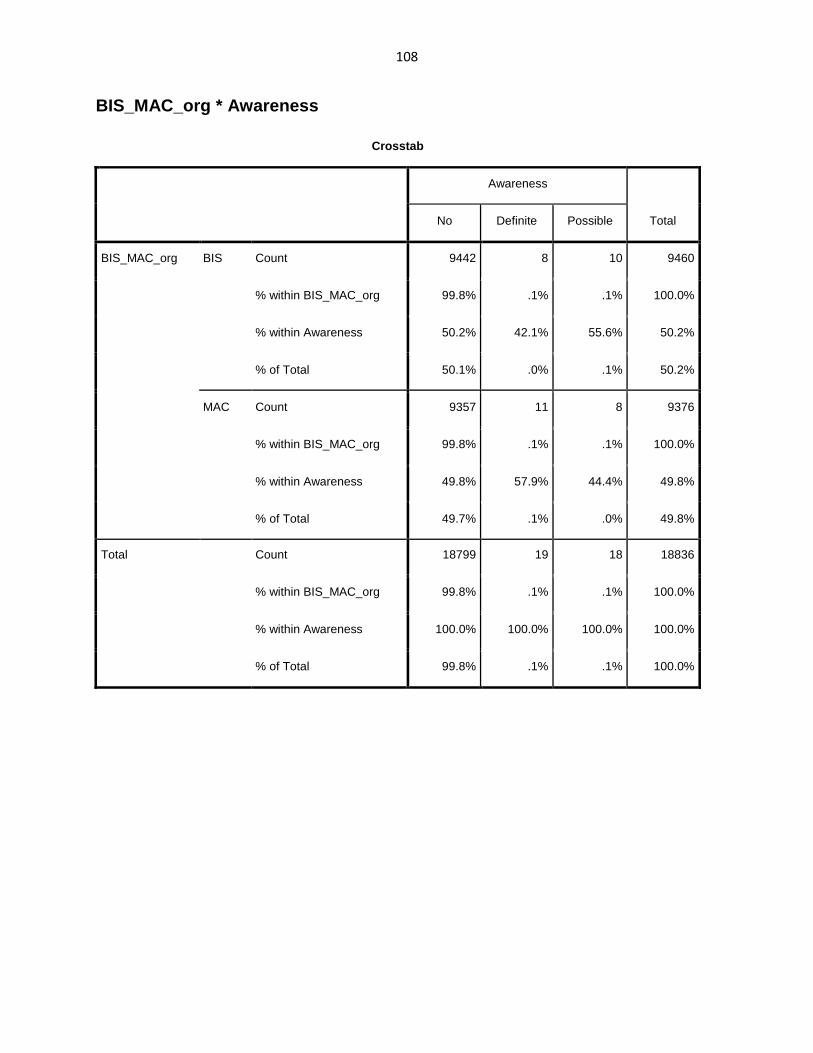
108
BIS_MAC_org * Awareness
Crosstab
Awareness
Total No Definite Possible
BIS_MAC_org BIS Count 9442 8 10 9460
% within BIS_MAC_org 99.8% .1% .1% 100.0%
% within Awareness 50.2% 42.1% 55.6% 50.2%
% of Total 50.1% .0% .1% 50.2%
MAC Count 9357 11 8 9376
% within BIS_MAC_org 99.8% .1% .1% 100.0%
% within Awareness 49.8% 57.9% 44.4% 49.8%
% of Total 49.7% .1% .0% 49.8%
Total Count 18799 19 18 18836
% within BIS_MAC_org 99.8% .1% .1% 100.0%
% within Awareness 100.0% 100.0% 100.0% 100.0%
% of Total 99.8% .1% .1% 100.0%

109
Chi-Square Tests
Value df
Asymp. Sig. (2-
sided)
Pearson Chi-Square .706a 2 .703
Likelihood Ratio .708 2 .702
Linear-by-Linear Association .006 1 .937
N of Valid Cases 18836
a. 0 cells (.0%) have expected count less than 5. The minimum expected
BIS_MAC_org * Definite_or_Possible_Awareness
Crosstab
Definite_or_Possible_Awareness
Total No
Definite or
Possible
Awareness
BIS_MAC_org BIS Count 9442 18 9460
% within BIS_MAC_org 99.8% .2% 100.0%
% within
Definite_or_Possible_Awarene
ss
50.2% 48.6% 50.2%
% of Total 50.1% .1% 50.2%
MAC Count 9357 19 9376
% within BIS_MAC_org 99.8% .2% 100.0%
% within
Definite_or_Possible_Awarene
ss
49.8% 51.4% 49.8%
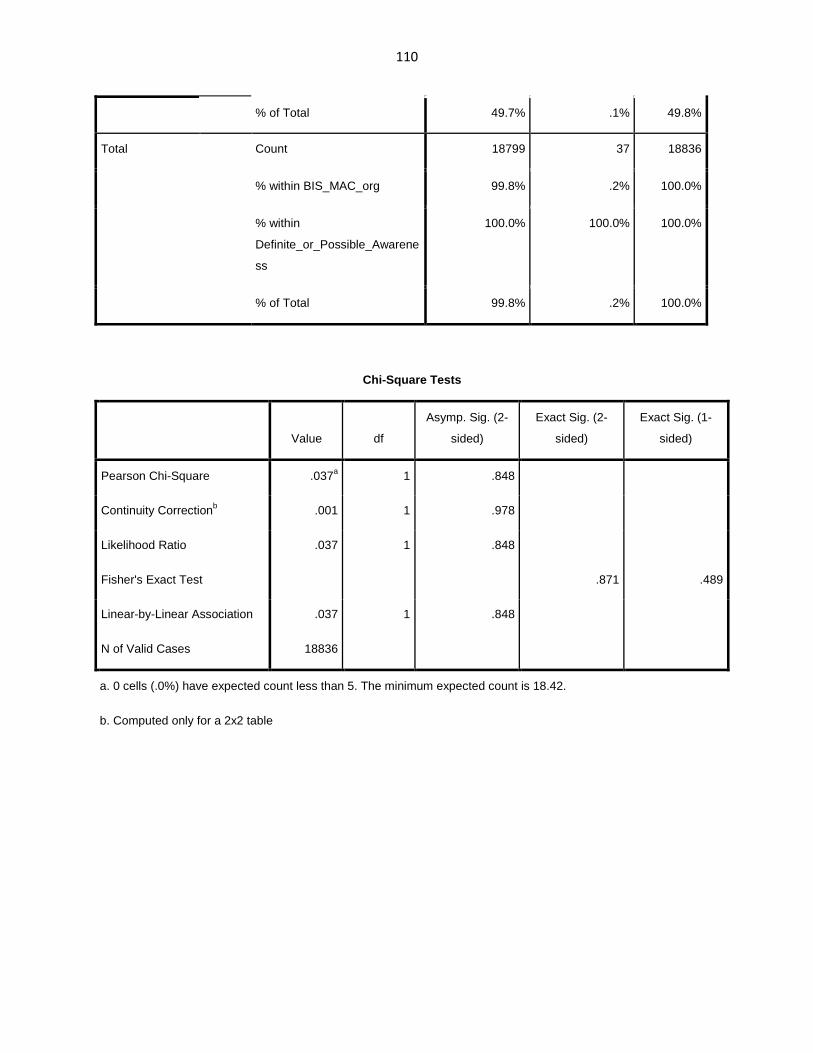
110
% of Total 49.7% .1% 49.8%
Total Count 18799 37 18836
% within BIS_MAC_org 99.8% .2% 100.0%
% within
Definite_or_Possible_Awarene
ss
100.0% 100.0% 100.0%
% of Total 99.8% .2% 100.0%
Chi-Square Tests
Value df
Asymp. Sig. (2-
sided)
Exact Sig. (2-
sided)
Exact Sig. (1-
sided)
Pearson Chi-Square .037a 1 .848
Continuity Correctionb .001 1 .978
Likelihood Ratio .037 1 .848
Fisher's Exact Test .871 .489
Linear-by-Linear Association .037 1 .848
N of Valid Cases 18836
a. 0 cells (.0%) have expected count less than 5. The minimum expected count is 18.42.
b. Computed only for a 2x2 table

111
Risk Estimate
Value
95% Confidence Interval
Lower Upper
Odds Ratio for BIS_MAC_org
(BIS / MAC)
1.065 .559 2.031
For cohort
Definite_or_Possible_Awaren
ess = No
1.000 .999 1.001
For cohort
Definite_or_Possible_Awaren
ess = Definite or Possible
Awareness
.939 .493 1.788
N of Valid Cases 18836
New_groups * Definite_Awareness
Crosstab
Definite_Awareness
Total No
Definite
Awareness
New_groups MAC Count 9365 11 9376
% within New_groups 99.9% .1% 100.0%
% within Definite_Awareness 49.8% 57.9% 49.8%
% of Total 49.7% .1% 49.8%
BIS with BIS Count 6073 3 6076
% within New_groups 100.0% .0% 100.0%
% within Definite_Awareness 32.3% 15.8% 32.3%

112
% of Total 32.2% .0% 32.3%
BIS no BIS Count 3379 5 3384
% within New_groups 99.9% .1% 100.0%
% within Definite_Awareness 18.0% 26.3% 18.0%
% of Total 17.9% .0% 18.0%
Total Count 18817 19 18836
% within New_groups 99.9% .1% 100.0%
% within Definite_Awareness 100.0% 100.0% 100.0%
% of Total 99.9% .1% 100.0%
Chi-Square Tests
Value df
Asymp. Sig. (2-
sided)
Pearson Chi-Square 2.589a 2 .274
Likelihood Ratio 2.857 2 .240
Linear-by-Linear Association .000 1 .989
N of Valid Cases 18836
a. 1 cells (16.7%) have expected count less than 5. The minimum expected
count is 3.41.
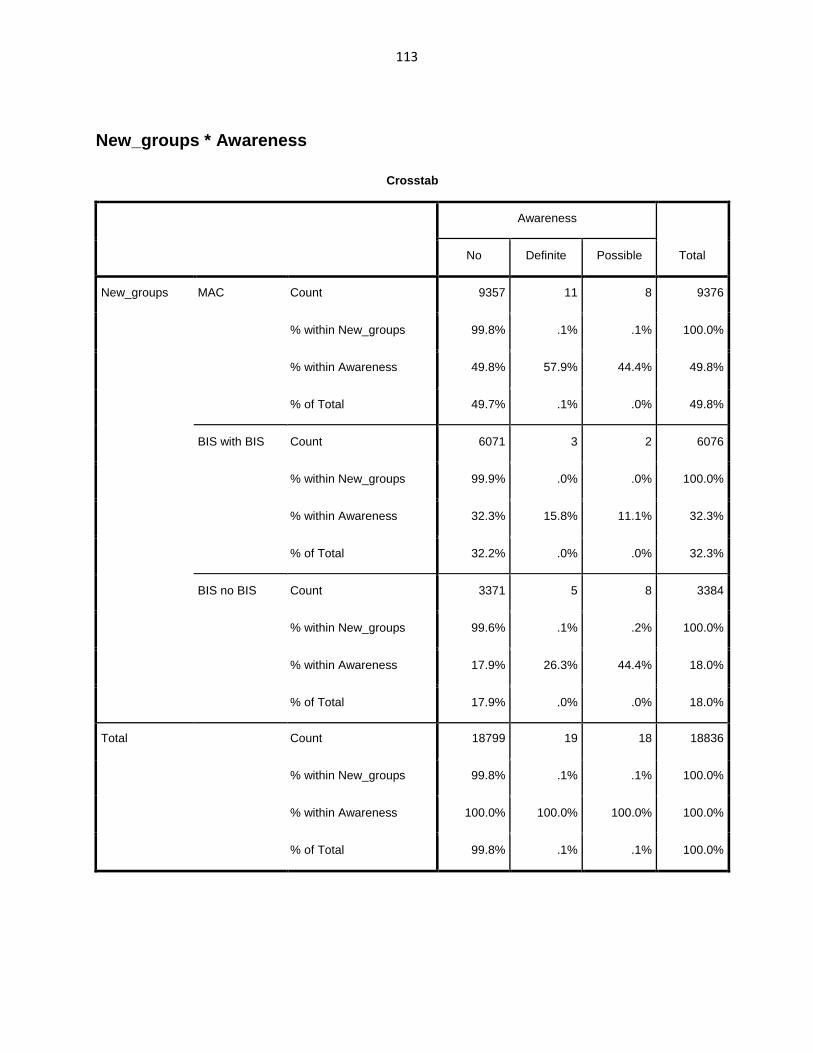
113
New_groups * Awareness
Crosstab
Awareness
Total No Definite Possible
New_groups MAC Count 9357 11 8 9376
% within New_groups 99.8% .1% .1% 100.0%
% within Awareness 49.8% 57.9% 44.4% 49.8%
% of Total 49.7% .1% .0% 49.8%
BIS with BIS Count 6071 3 2 6076
% within New_groups 99.9% .0% .0% 100.0%
% within Awareness 32.3% 15.8% 11.1% 32.3%
% of Total 32.2% .0% .0% 32.3%
BIS no BIS Count 3371 5 8 3384
% within New_groups 99.6% .1% .2% 100.0%
% within Awareness 17.9% 26.3% 44.4% 18.0%
% of Total 17.9% .0% .0% 18.0%
Total Count 18799 19 18 18836
% within New_groups 99.8% .1% .1% 100.0%
% within Awareness 100.0% 100.0% 100.0% 100.0%
% of Total 99.8% .1% .1% 100.0%
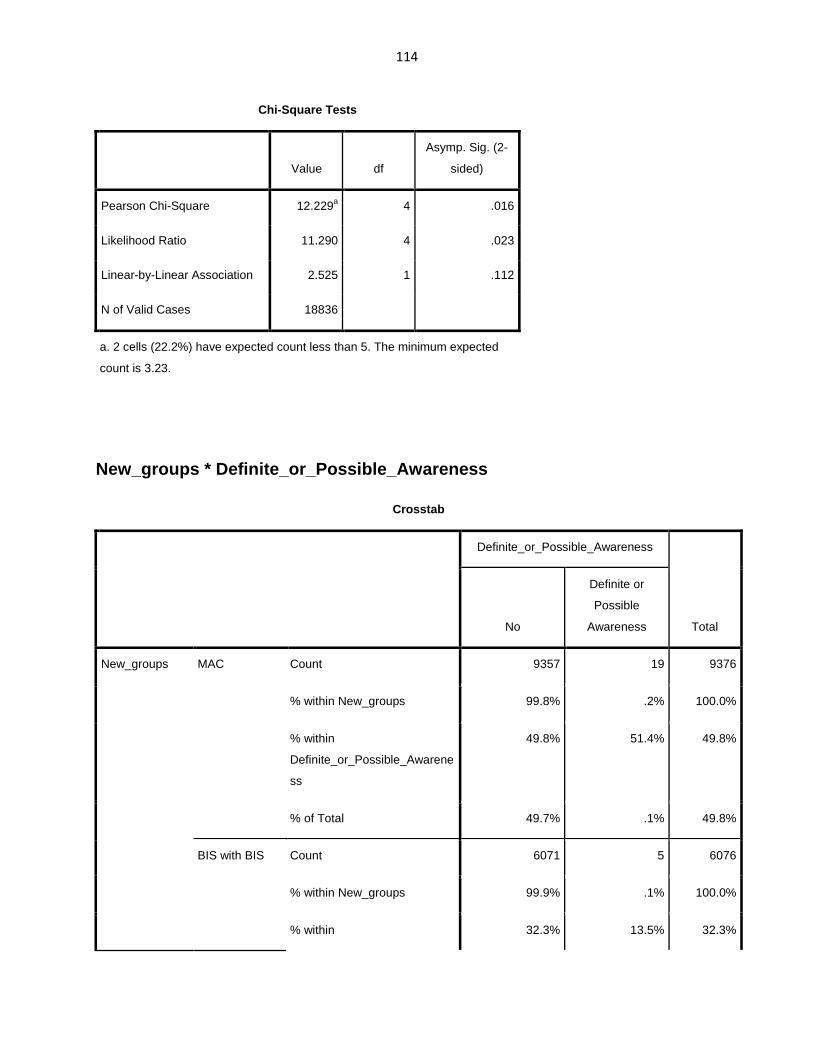
114
Chi-Square Tests
Value df
Asymp. Sig. (2-
sided)
Pearson Chi-Square 12.229a 4 .016
Likelihood Ratio 11.290 4 .023
Linear-by-Linear Association 2.525 1 .112
N of Valid Cases 18836
a. 2 cells (22.2%) have expected count less than 5. The minimum expected
count is 3.23.
New_groups * Definite_or_Possible_Awareness
Crosstab
Definite_or_Possible_Awareness
Total No
Definite or
Possible
Awareness
New_groups MAC Count 9357 19 9376
% within New_groups 99.8% .2% 100.0%
% within
Definite_or_Possible_Awarene
ss
49.8% 51.4% 49.8%
% of Total 49.7% .1% 49.8%
BIS with BIS Count 6071 5 6076
% within New_groups 99.9% .1% 100.0%
% within 32.3% 13.5% 32.3%

115
Definite_or_Possible_Awarene
ss
% of Total 32.2% .0% 32.3%
BIS no BIS Count 3371 13 3384
% within New_groups 99.6% .4% 100.0%
% within
Definite_or_Possible_Awarene
ss
17.9% 35.1% 18.0%
% of Total 17.9% .1% 18.0%
Total Count 18799 37 18836
% within New_groups 99.8% .2% 100.0%
% within
Definite_or_Possible_Awarene
ss
100.0% 100.0% 100.0%
% of Total 99.8% .2% 100.0%
Chi-Square Tests
Value df
Asymp. Sig. (2-
sided)
Pearson Chi-Square 10.139a 2 .006
Likelihood Ratio 9.942 2 .007
Linear-by-Linear Association 1.565 1 .211
N of Valid Cases 18836
a. 0 cells (.0%) have expected count less than 5. The minimum expected
count is 6.65.

116
Definite_Awareness
Frequency Percent Valid Percent
Cumulative
Percent
Valid No 18817 99.9 99.9 99.9
Definite Awareness 19 .1 .1 100.0
Total 18836 100.0 100.0
USE ALL.
COMPUTE filter_$=(Definite_or_Possible_Awareness = 1).
VARIABLE LABEL filter_$ 'Definite_or_Possible_Awareness = 1 (FILTER)'.
VALUE LABELS filter_$ 0 'Not Selected' 1 'Selected'.
FORMAT filter_$ (f1.0).
FILTER BY filter_$.
EXECUTE.
CROSSTABS
/TABLES=New_groups BY Distress_Awareness_Class
/FORMAT=AVALUE TABLES
/STATISTICS=CHISQ
/CELLS=COUNT ROW COLUMN TOTAL
/COUNT ROUND CELL.
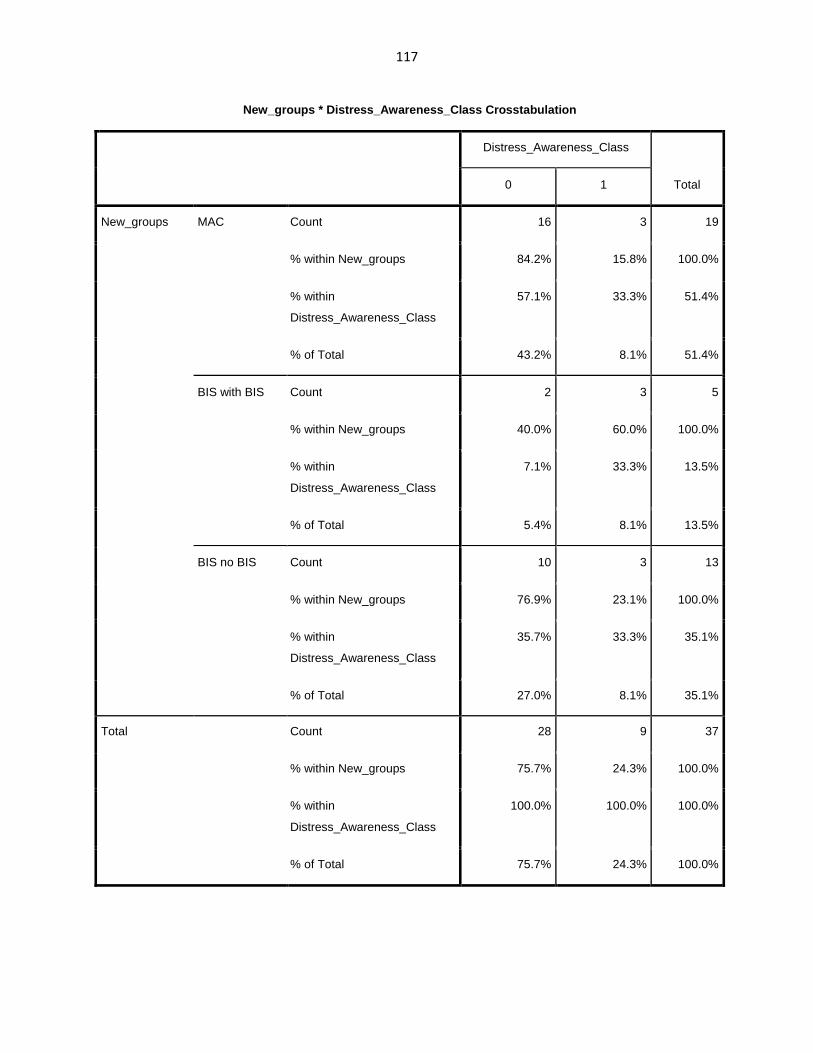
117
New_groups * Distress_Awareness_Class Crosstabulation
Distress_Awareness_Class
Total 0 1
New_groups MAC Count 16 3 19
% within New_groups 84.2% 15.8% 100.0%
% within
Distress_Awareness_Class
57.1% 33.3% 51.4%
% of Total 43.2% 8.1% 51.4%
BIS with BIS Count 2 3 5
% within New_groups 40.0% 60.0% 100.0%
% within
Distress_Awareness_Class
7.1% 33.3% 13.5%
% of Total 5.4% 8.1% 13.5%
BIS no BIS Count 10 3 13
% within New_groups 76.9% 23.1% 100.0%
% within
Distress_Awareness_Class
35.7% 33.3% 35.1%
% of Total 27.0% 8.1% 35.1%
Total Count 28 9 37
% within New_groups 75.7% 24.3% 100.0%
% within
Distress_Awareness_Class
100.0% 100.0% 100.0%
% of Total 75.7% 24.3% 100.0%

118
Chi-Square Tests
Value df
Asymp. Sig. (2-
sided)
Pearson Chi-Square 4.220a 2 .121
Likelihood Ratio 3.705 2 .157
Linear-by-Linear Association .363 1 .547
N of Valid Cases 37
a. 4 cells (66.7%) have expected count less than 5. The minimum expected
count is 1.22.
FILTER OFF.
USE ALL.
EXECUTE.
FREQUENCIES VARIABLES=Class_Awareness
/ORDER=ANALYSIS.
Frequencies
Class_Awareness
Frequency Percent Valid Percent
Cumulative
Percent
Valid 18799 99.8 99.8 99.8
1 16 .1 .1 99.9
2 8 .0 .0 99.9
2D 4 .0 .0 100.0
3 3 .0 .0 100.0
3D 2 .0 .0 100.0
4 1 .0 .0 100.0

119
4D 2 .0 .0 100.0
5D 1 .0 .0 100.0
Total 18836 100.0 100.0
COMPUTE filter_$=(gas_analyzer_problem = 0).
VARIABLE LABELS filter_$ 'gas_analyzer_problem = 0 (FILTER)'.
VALUE LABELS filter_$ 0 'Not Selected' 1 'Selected'.
FORMATS filter_$ (f1.0).
FILTER BY filter_$.
EXECUTE.
* Custom Tables.
CTABLES
/VLABELS VARIABLES=New_groups medianMAC DISPLAY=LABEL
/TABLE New_groups BY medianMAC [MEAN, STDDEV, MEDIAN, PTILE 25, PTILE 75, VALIDN F40.0]
/CATEGORIES VARIABLES=New_groups ORDER=A KEY=VALUE EMPTY=INCLUDE.
Custom Tables
medianMAC
Mean
Standard
Deviation Median Percentile 25 Percentile 75 Valid N
New_groups MAC .9391 .2648 .9400 .7905 1.1110 9083
BIS with BIS .9372 .2599 .9400 .8105 1.1110 5956
BIS no BIS .9108 .2771 .9400 .7690 1.0760 3272

120
*Nonparametric Tests: Independent Samples.
NPTESTS
/INDEPENDENT TEST (medianMAC) GROUP (New_groups)
/MISSING SCOPE=ANALYSIS USERMISSING=EXCLUDE
/CRITERIA ALPHA=0.05 CILEVEL=95.
Nonparametric Tests
* Custom Tables.
CTABLES
/VLABELS VARIABLES=New_groups Induction_propofol DISPLAY=LABEL
/TABLE New_groups [C] BY Induction_propofol [MEAN, STDDEV, MEDIAN, PTILE 25, PTILE 75, VALIDN
F40.0]
/CATEGORIES VARIABLES=New_groups ORDER=A KEY=VALUE EMPTY=INCLUDE.
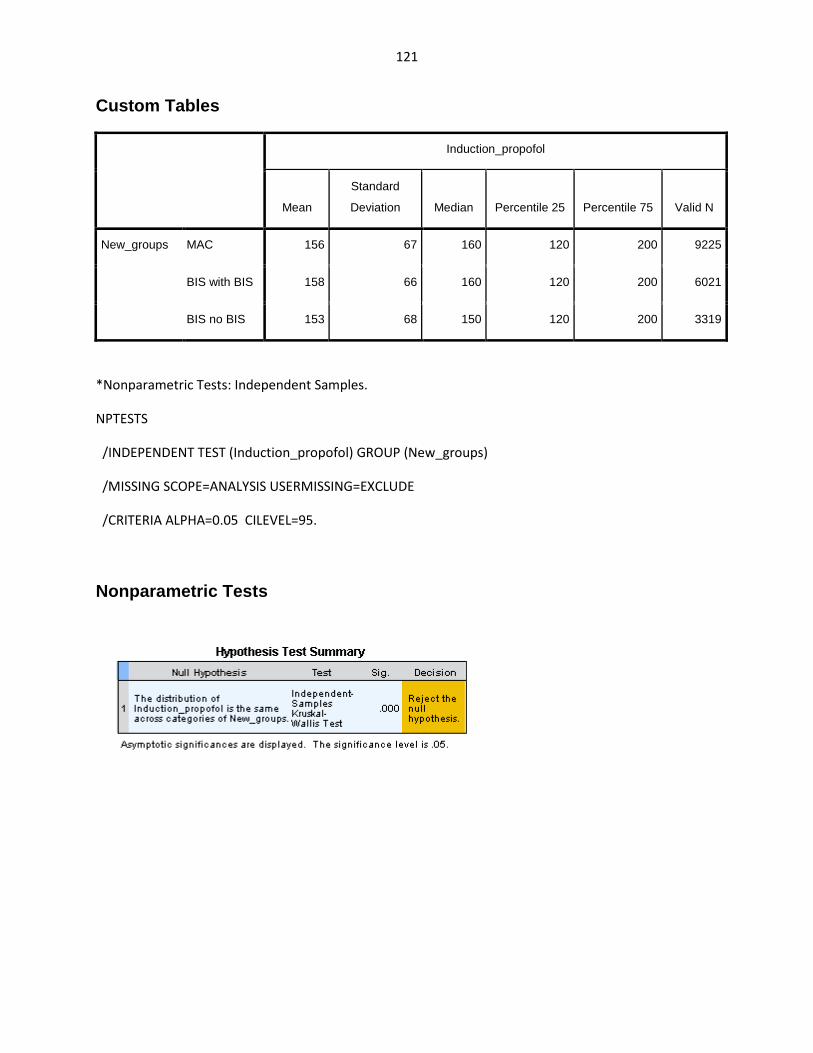
121
Custom Tables
Induction_propofol
Mean
Standard
Deviation Median Percentile 25 Percentile 75 Valid N
New_groups MAC 156 67 160 120 200 9225
BIS with BIS 158 66 160 120 200 6021
BIS no BIS 153 68 150 120 200 3319
*Nonparametric Tests: Independent Samples.
NPTESTS
/INDEPENDENT TEST (Induction_propofol) GROUP (New_groups)
/MISSING SCOPE=ANALYSIS USERMISSING=EXCLUDE
/CRITERIA ALPHA=0.05 CILEVEL=95.
Nonparametric Tests

122
* Custom Tables.
CTABLES
/VLABELS VARIABLES=New_groups Intraop_propofol DISPLAY=LABEL
/TABLE New_groups [C] BY Intraop_propofol [MEAN, STDDEV, MEDIAN, PTILE 25, PTILE 75, VALIDN F40.0]
/CATEGORIES VARIABLES=New_groups ORDER=A KEY=VALUE EMPTY=INCLUDE.
Custom Tables
Intraop_propofol
Mean
Standard
Deviation Median Percentile 25 Percentile 75 Valid N
New_groups MAC 167 78 170 130 200 9225
BIS with BIS 171 77 180 130 200 6021
BIS no BIS 164 79 170 120 200 3319
*Nonparametric Tests: Independent Samples.
NPTESTS
/INDEPENDENT TEST (Intraop_propofol) GROUP (New_groups)
/MISSING SCOPE=ANALYSIS USERMISSING=EXCLUDE
/CRITERIA ALPHA=0.05 CILEVEL=95.
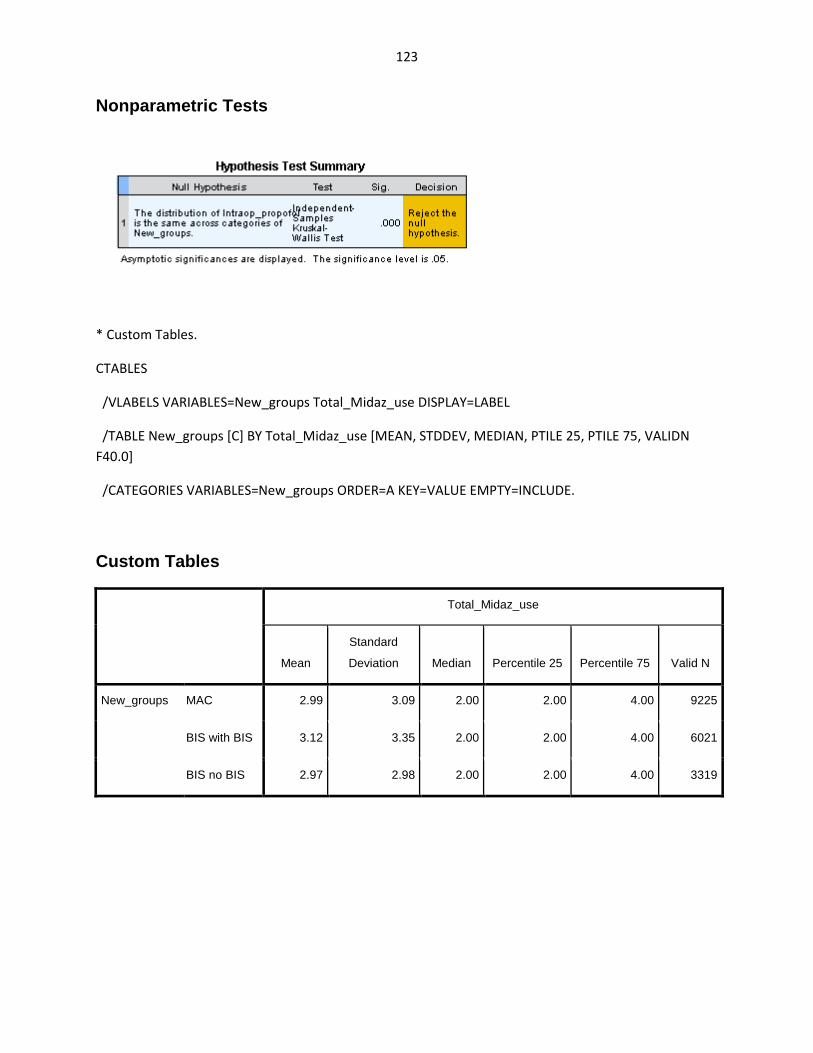
123
Nonparametric Tests
* Custom Tables.
CTABLES
/VLABELS VARIABLES=New_groups Total_Midaz_use DISPLAY=LABEL
/TABLE New_groups [C] BY Total_Midaz_use [MEAN, STDDEV, MEDIAN, PTILE 25, PTILE 75, VALIDN F40.0]
/CATEGORIES VARIABLES=New_groups ORDER=A KEY=VALUE EMPTY=INCLUDE.
Custom Tables
Total_Midaz_use
Mean
Standard
Deviation Median Percentile 25 Percentile 75 Valid N
New_groups MAC 2.99 3.09 2.00 2.00 4.00 9225
BIS with BIS 3.12 3.35 2.00 2.00 4.00 6021
BIS no BIS 2.97 2.98 2.00 2.00 4.00 3319
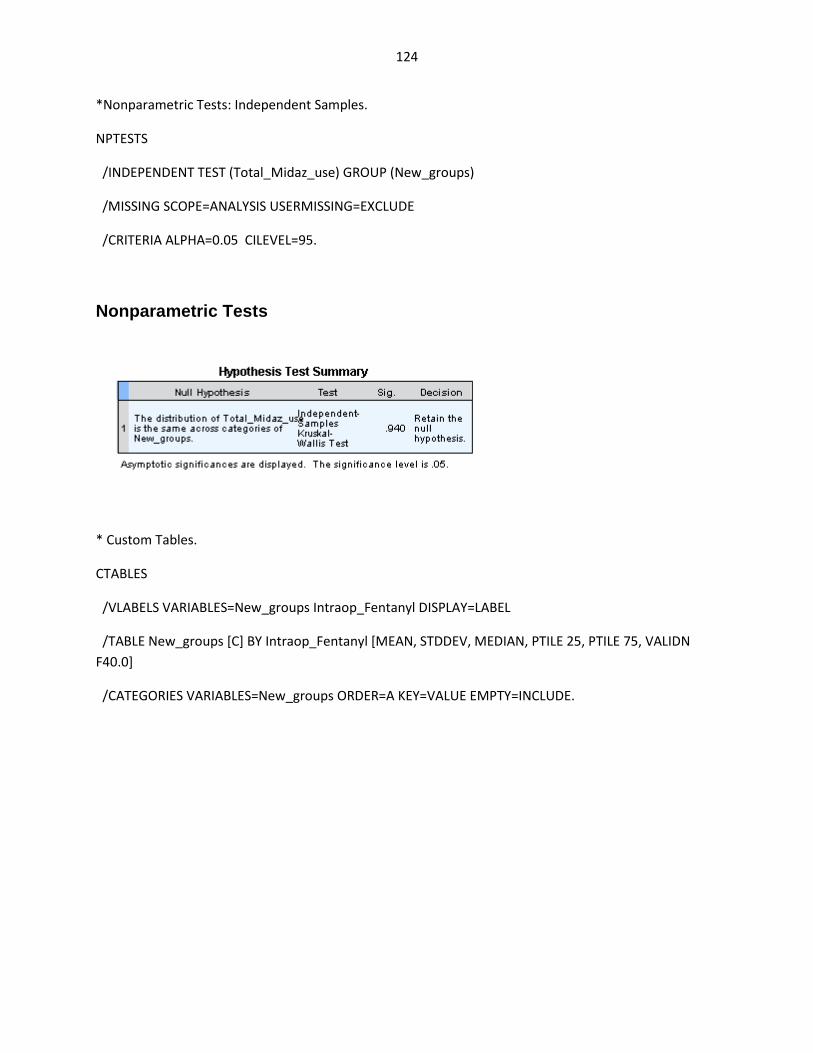
124
*Nonparametric Tests: Independent Samples.
NPTESTS
/INDEPENDENT TEST (Total_Midaz_use) GROUP (New_groups)
/MISSING SCOPE=ANALYSIS USERMISSING=EXCLUDE
/CRITERIA ALPHA=0.05 CILEVEL=95.
Nonparametric Tests
* Custom Tables.
CTABLES
/VLABELS VARIABLES=New_groups Intraop_Fentanyl DISPLAY=LABEL
/TABLE New_groups [C] BY Intraop_Fentanyl [MEAN, STDDEV, MEDIAN, PTILE 25, PTILE 75, VALIDN F40.0]
/CATEGORIES VARIABLES=New_groups ORDER=A KEY=VALUE EMPTY=INCLUDE.

125
Custom Tables
Intraop_Fentanyl
Mean
Standard
Deviation Median Percentile 25 Percentile 75 Valid N
New_groups MAC 203.0 193.2 175.0 100.0 250.0 9225
BIS with BIS 216.3 214.9 200.0 100.0 250.0 6021
BIS no BIS 188.7 196.0 150.0 100.0 250.0 3319
*Nonparametric Tests: Independent Samples.
NPTESTS
/INDEPENDENT TEST (Intraop_Fentanyl) GROUP (New_groups)
/MISSING SCOPE=ANALYSIS USERMISSING=EXCLUDE
/CRITERIA ALPHA=0.05 CILEVEL=95.
Nonparametric Tests
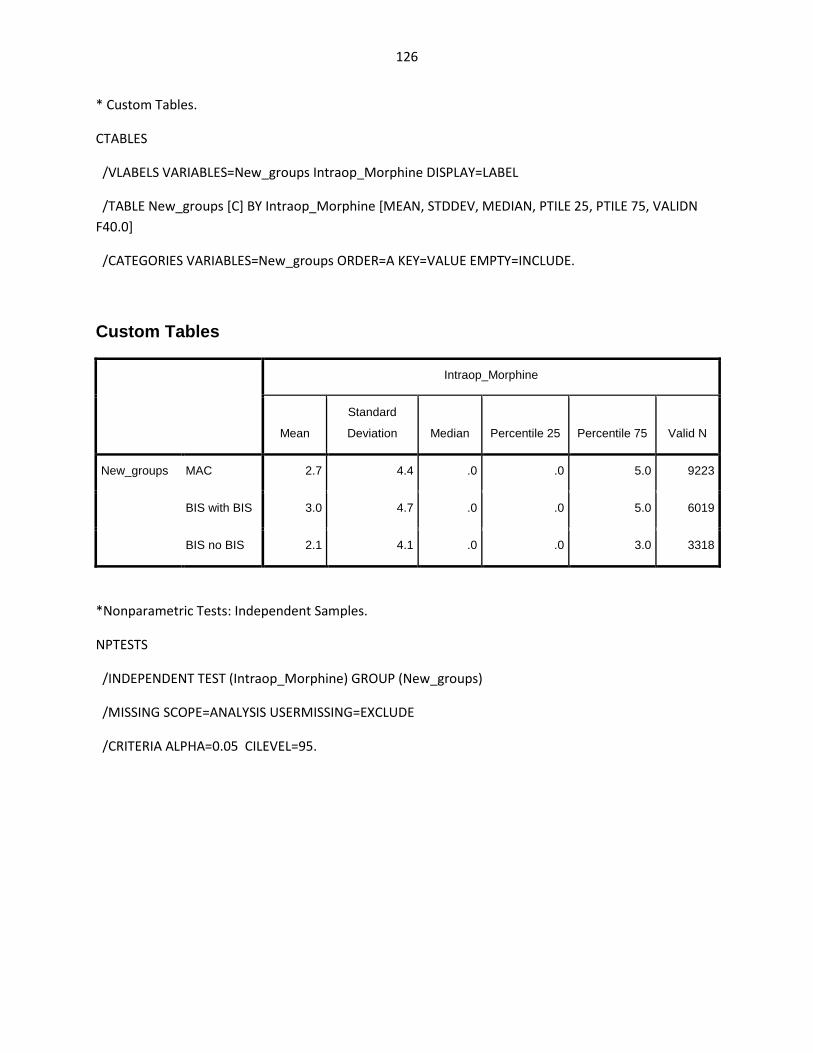
126
* Custom Tables.
CTABLES
/VLABELS VARIABLES=New_groups Intraop_Morphine DISPLAY=LABEL
/TABLE New_groups [C] BY Intraop_Morphine [MEAN, STDDEV, MEDIAN, PTILE 25, PTILE 75, VALIDN F40.0]
/CATEGORIES VARIABLES=New_groups ORDER=A KEY=VALUE EMPTY=INCLUDE.
Custom Tables
Intraop_Morphine
Mean
Standard
Deviation Median Percentile 25 Percentile 75 Valid N
New_groups MAC 2.7 4.4 .0 .0 5.0 9223
BIS with BIS 3.0 4.7 .0 .0 5.0 6019
BIS no BIS 2.1 4.1 .0 .0 3.0 3318
*Nonparametric Tests: Independent Samples.
NPTESTS
/INDEPENDENT TEST (Intraop_Morphine) GROUP (New_groups)
/MISSING SCOPE=ANALYSIS USERMISSING=EXCLUDE
/CRITERIA ALPHA=0.05 CILEVEL=95.

127
Nonparametric Tests
* Custom Tables.
CTABLES
/VLABELS VARIABLES=New_groups PACU_time DISPLAY=LABEL
/TABLE New_groups [C] BY PACU_time [MEAN, STDDEV, MEDIAN, PTILE 25, PTILE 75, VALIDN F40.0]
/CATEGORIES VARIABLES=New_groups ORDER=A KEY=VALUE EMPTY=INCLUDE.
Custom Tables
PACU_time
Mean
Standard
Deviation Median Percentile 25 Percentile 75 Valid N
New_groups MAC 112.64 69.13 98.00 66.00 140.00 8401
BIS with BIS 109.48 65.84 95.00 64.00 138.00 5473
BIS no BIS 107.27 63.37 94.00 64.00 133.00 2990

128
*Nonparametric Tests: Independent Samples.
NPTESTS
/INDEPENDENT TEST (PACU_time) GROUP (New_groups)
/MISSING SCOPE=ANALYSIS USERMISSING=EXCLUDE
/CRITERIA ALPHA=0.05 CILEVEL=95.
Nonparametric Tests
CROSSTABS
/TABLES=New_groups BY PACU_Nausea_yn PACU_Vomit_yn
/FORMAT=AVALUE TABLES
/STATISTICS=CHISQ RISK
/CELLS=COUNT ROW COLUMN TOTAL
/COUNT ROUND CELL.

129
Crosstabs
New_groups * PACU_Nausea_yn
Crosstab
PACU_Nausea_yn
Total None Yes
New_groups MAC Count 6184 511 6695
% within New_groups 92.4% 7.6% 100.0%
% within PACU_Nausea_yn 49.4% 50.5% 49.5%
% of Total 45.7% 3.8% 49.5%
BIS with BIS Count 4042 324 4366
% within New_groups 92.6% 7.4% 100.0%
% within PACU_Nausea_yn 32.3% 32.0% 32.3%
% of Total 29.9% 2.4% 32.3%
BIS no BIS Count 2286 177 2463
% within New_groups 92.8% 7.2% 100.0%
% within PACU_Nausea_yn 18.3% 17.5% 18.2%
% of Total 16.9% 1.3% 18.2%
Total Count 12512 1012 13524
% within New_groups 92.5% 7.5% 100.0%
% within PACU_Nausea_yn 100.0% 100.0% 100.0%
% of Total 92.5% 7.5% 100.0%

130
Chi-Square Tests
Value df
Asymp. Sig. (2-
sided)
Pearson Chi-Square .554a 2 .758
Likelihood Ratio .556 2 .757
Linear-by-Linear Association .553 1 .457
N of Valid Cases 13524
a. 0 cells (.0%) have expected count less than 5. The minimum expected
count is 184.31.
New_groups * PACU_Vomit_yn
Crosstab
PACU_Vomit_yn
Total None Yes
New_groups MAC Count 7149 83 7232
% within New_groups 98.9% 1.1% 100.0%
% within PACU_Vomit_yn 49.7% 49.4% 49.7%
% of Total 49.2% .6% 49.7%
BIS with BIS Count 4617 52 4669
% within New_groups 98.9% 1.1% 100.0%
% within PACU_Vomit_yn 32.1% 31.0% 32.1%
% of Total 31.7% .4% 32.1%
BIS no BIS Count 2608 33 2641
% within New_groups 98.8% 1.2% 100.0%

131
% within PACU_Vomit_yn 18.1% 19.6% 18.2%
% of Total 17.9% .2% 18.2%
Total Count 14374 168 14542
% within New_groups 98.8% 1.2% 100.0%
% within PACU_Vomit_yn 100.0% 100.0% 100.0%
% of Total 98.8% 1.2% 100.0%
Chi-Square Tests
Value df
Asymp. Sig. (2-
sided)
Pearson Chi-Square .280a 2 .869
Likelihood Ratio .275 2 .871
Linear-by-Linear Association .096 1 .757
N of Valid Cases 14542
a. 0 cells (.0%) have expected count less than 5. The minimum expected
count is 30.51.
FILTER OFF.
USE ALL.
EXECUTE.

132
Median_BIS
Mean
Standard
Deviation Median Percentile 25 Percentile 75 Valid N
New_groups MAC 41.2 10.5 40.0 34.0 46.0 3816
BIS with BIS 40.4 8.7 40.0 35.0 44.5 6021
BIS no BIS . . . . . 0
USE ALL.
COMPUTE filter_$=(TIVA = 1).
VARIABLE LABELS filter_$ 'TIVA = 1 (FILTER)'.
VALUE LABELS filter_$ 0 'Not Selected' 1 'Selected'.
FORMATS filter_$ (f1.0).
FILTER BY filter_$.
EXECUTE.
* Custom Tables.
CTABLES
/VLABELS VARIABLES=New_groups Intraop_propofol_infusionCC DISPLAY=LABEL
/TABLE New_groups [C] BY Intraop_propofol_infusionCC [MEAN, STDDEV, MEDIAN, PTILE 25, PTILE 75]
/CATEGORIES VARIABLES=New_groups ORDER=A KEY=VALUE EMPTY=INCLUDE.
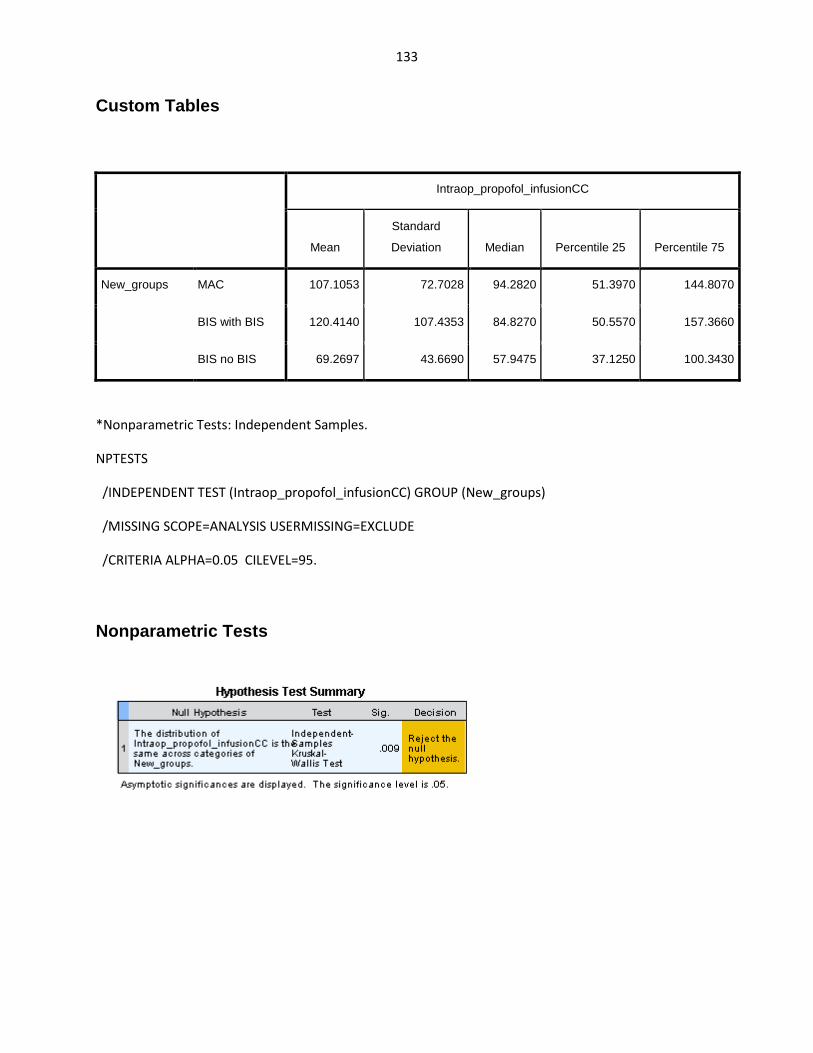
133
Custom Tables
Intraop_propofol_infusionCC
Mean
Standard
Deviation Median Percentile 25 Percentile 75
New_groups MAC 107.1053 72.7028 94.2820 51.3970 144.8070
BIS with BIS 120.4140 107.4353 84.8270 50.5570 157.3660
BIS no BIS 69.2697 43.6690 57.9475 37.1250 100.3430
*Nonparametric Tests: Independent Samples.
NPTESTS
/INDEPENDENT TEST (Intraop_propofol_infusionCC) GROUP (New_groups)
/MISSING SCOPE=ANALYSIS USERMISSING=EXCLUDE
/CRITERIA ALPHA=0.05 CILEVEL=95.
Nonparametric Tests
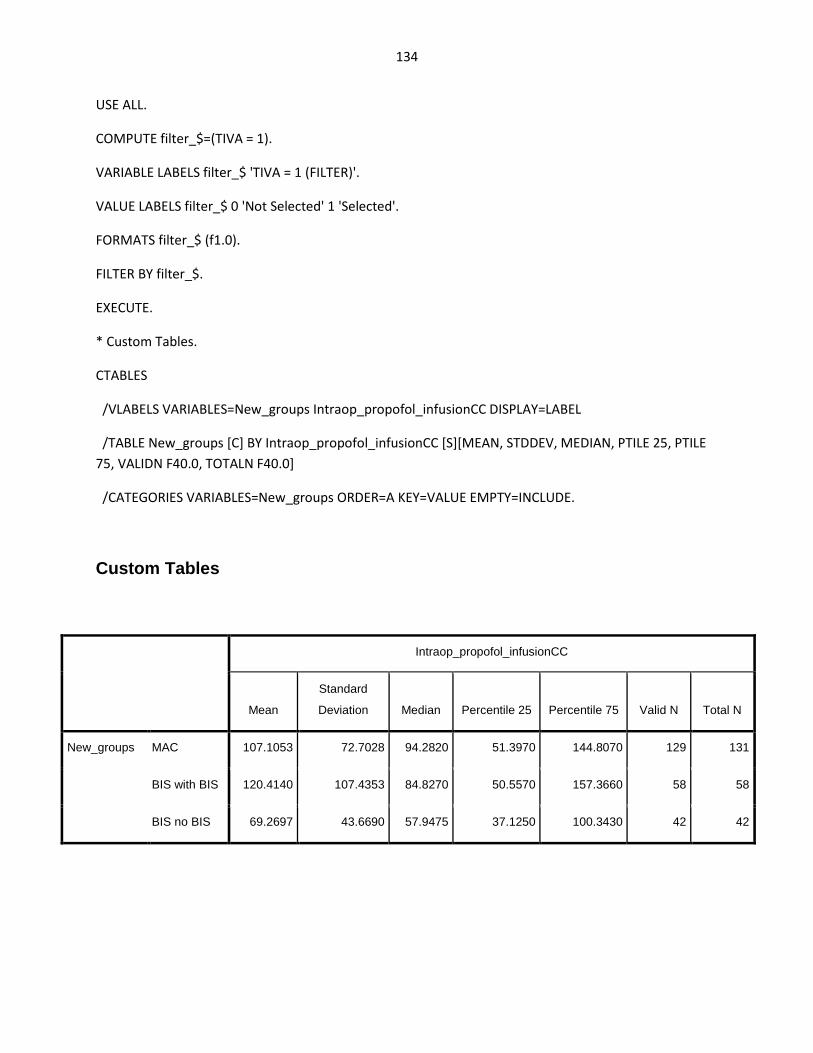
134
USE ALL.
COMPUTE filter_$=(TIVA = 1).
VARIABLE LABELS filter_$ 'TIVA = 1 (FILTER)'.
VALUE LABELS filter_$ 0 'Not Selected' 1 'Selected'.
FORMATS filter_$ (f1.0).
FILTER BY filter_$.
EXECUTE.
* Custom Tables.
CTABLES
/VLABELS VARIABLES=New_groups Intraop_propofol_infusionCC DISPLAY=LABEL
/TABLE New_groups [C] BY Intraop_propofol_infusionCC [S][MEAN, STDDEV, MEDIAN, PTILE 25, PTILE 75, VALIDN F40.0, TOTALN F40.0]
/CATEGORIES VARIABLES=New_groups ORDER=A KEY=VALUE EMPTY=INCLUDE.
Custom Tables
Intraop_propofol_infusionCC
Mean
Standard
Deviation Median Percentile 25 Percentile 75 Valid N Total N
New_groups MAC 107.1053 72.7028 94.2820 51.3970 144.8070 129 131
BIS with BIS 120.4140 107.4353 84.8270 50.5570 157.3660 58 58
BIS no BIS 69.2697 43.6690 57.9475 37.1250 100.3430 42 42

135
APPENDIX III: Actual SPSS outputs for Chapter 5
New_groups * Definite_or_Possible_Awareness Crosstabulation
Definite_or_Possible_Awareness Total
No Definite or Possible
Awareness
New_groups
MAC
Count 8021 15 8036
% within New_groups 99.8% 0.2% 100.0%
% within
Definite_or_Possible_Awareness 50.0% 46.9% 50.0%
% of Total 49.9% 0.1% 50.0%
BIS with
BIS
Count 5169 5 5174
% within New_groups 99.9% 0.1% 100.0%
% within
Definite_or_Possible_Awareness 32.2% 15.6% 32.2%
% of Total 32.2% 0.0% 32.2%
BIS no BIS
Count 2846 12 2858
% within New_groups 99.6% 0.4% 100.0%
% within
Definite_or_Possible_Awareness 17.7% 37.5% 17.8%
% of Total 17.7% 0.1% 17.8%
Total
Count 16036 32 16068
% within New_groups 99.8% 0.2% 100.0%
% within
Definite_or_Possible_Awareness 100.0% 100.0% 100.0%
% of Total 99.8% 0.2% 100.0%

136
Crosstabs
Definite_Awareness * BIS_60_alert_triggered_yn
Crosstab
BIS_60_alert_triggered_yn Total
No BIS >60 BIS >60 at least
once
Definite_Awareness
No
Count 3750 1401 5151
% within Definite_Awareness 72.8% 27.2% 100.0%
% within
BIS_60_alert_triggered_yn 99.9% 99.9% 99.9%
% of Total 72.8% 27.2% 99.9%
Definite Awareness
Count 2 1 3
% within Definite_Awareness 66.7% 33.3% 100.0%
% within
BIS_60_alert_triggered_yn 0.1% 0.1% 0.1%
% of Total 0.0% 0.0% 0.1%
Total
Count 3752 1402 5154
% within Definite_Awareness 72.8% 27.2% 100.0%
% within
BIS_60_alert_triggered_yn 100.0% 100.0% 100.0%
% of Total 72.8% 27.2% 100.0%

137
Chi-Square Tests
Value df Asymp. Sig. (2-
sided)
Exact Sig. (2-
sided)
Exact Sig. (1-
sided)
Pearson Chi-Square .057a 1 .811
Continuity Correctionb .000 1 1.000
Likelihood Ratio .055 1 .815
Fisher's Exact Test 1.000 .614
Linear-by-Linear
Association .057 1 .811
N of Valid Cases 5154
a. 2 cells (50.0%) have expected count less than 5. The minimum expected count is .82.
b. Computed only for a 2x2 table
Risk Estimate
Value 95% Confidence Interval
Lower Upper
Odds Ratio for Definite_Awareness
(No / Definite Awareness) 1.338 .121 14.771
For cohort BIS_60_alert_triggered_yn
= No BIS >60 1.092 .491 2.431
For cohort BIS_60_alert_triggered_yn
= BIS >60 at least once .816 .165 4.045
N of Valid Cases 5154

138
Definite_Awareness * BIS_70_yn
Crosstab
BIS_70_yn Total
.00 1.00
Definite_Awarenes
s
No
Count 4744 407 5151
% within
Definite_Awareness 92.1% 7.9% 100.0%
% within BIS_70_yn 99.9% 100.0% 99.9%
% of Total 92.0% 7.9% 99.9%
Definite Awareness
Count 3 0 3
% within
Definite_Awareness 100.0% 0.0% 100.0%
% within BIS_70_yn 0.1% 0.0% 0.1%
% of Total 0.1% 0.0% 0.1%
Total
Count 4747 407 5154
% within
Definite_Awareness 92.1% 7.9% 100.0%
% within BIS_70_yn 100.0% 100.0% 100.0%
% of Total 92.1% 7.9% 100.0%

139
Chi-Square Tests
Value df Asymp. Sig. (2-
sided)
Exact Sig. (2-
sided)
Exact Sig. (1-
sided)
Pearson Chi-Square .257a 1 .612
Continuity Correctionb .000 1 1.000
Likelihood Ratio .494 1 .482
Fisher's Exact Test 1.000 .781
Linear-by-Linear
Association .257 1 .612
N of Valid Cases 5154
a. 2 cells (50.0%) have expected count less than 5. The minimum expected count is .24.
b. Computed only for a 2x2 table
Risk Estimate
Value 95% Confidence Interval
Lower Upper
For cohort BIS_70_yn = .00 .921 .914 .928
N of Valid Cases 5154
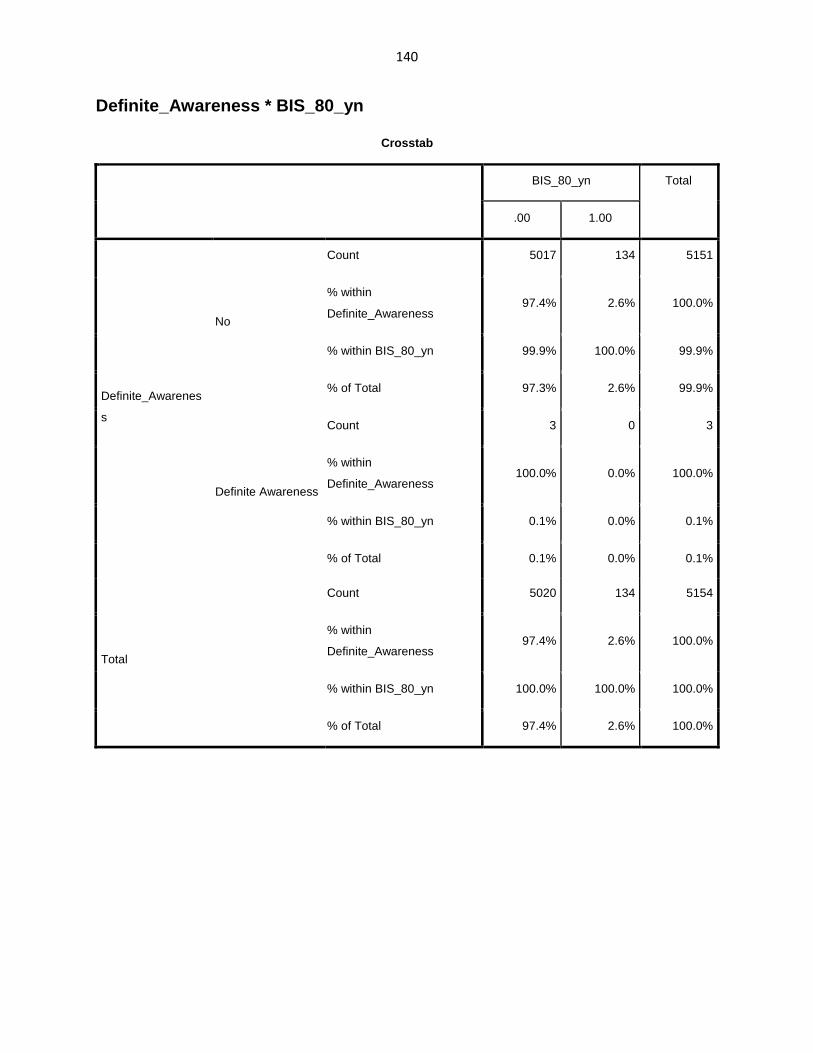
140
Definite_Awareness * BIS_80_yn
Crosstab
BIS_80_yn Total
.00 1.00
Definite_Awarenes
s
No
Count 5017 134 5151
% within
Definite_Awareness 97.4% 2.6% 100.0%
% within BIS_80_yn 99.9% 100.0% 99.9%
% of Total 97.3% 2.6% 99.9%
Definite Awareness
Count 3 0 3
% within
Definite_Awareness 100.0% 0.0% 100.0%
% within BIS_80_yn 0.1% 0.0% 0.1%
% of Total 0.1% 0.0% 0.1%
Total
Count 5020 134 5154
% within
Definite_Awareness 97.4% 2.6% 100.0%
% within BIS_80_yn 100.0% 100.0% 100.0%
% of Total 97.4% 2.6% 100.0%
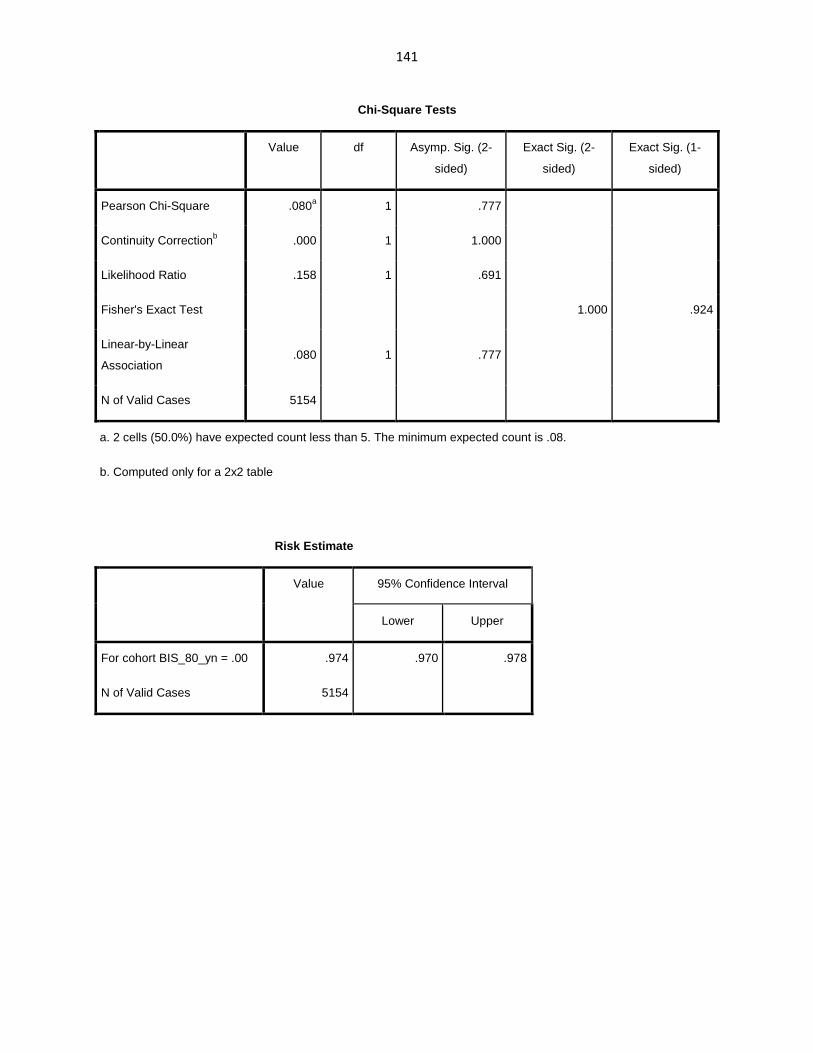
141
Chi-Square Tests
Value df Asymp. Sig. (2-
sided)
Exact Sig. (2-
sided)
Exact Sig. (1-
sided)
Pearson Chi-Square .080a 1 .777
Continuity Correctionb .000 1 1.000
Likelihood Ratio .158 1 .691
Fisher's Exact Test 1.000 .924
Linear-by-Linear
Association .080 1 .777
N of Valid Cases 5154
a. 2 cells (50.0%) have expected count less than 5. The minimum expected count is .08.
b. Computed only for a 2x2 table
Risk Estimate
Value 95% Confidence Interval
Lower Upper
For cohort BIS_80_yn = .00 .974 .970 .978
N of Valid Cases 5154

142
Definite_Awareness * BIS_90_yn
Crosstab
BIS_90_yn Total
.00 1.00
Definite_Awarenes
s
No
Count 5113 38 5151
% within
Definite_Awareness 99.3% 0.7% 100.0%
% within BIS_90_yn 99.9% 100.0% 99.9%
% of Total 99.2% 0.7% 99.9%
Definite Awareness
Count 3 0 3
% within
Definite_Awareness 100.0% 0.0% 100.0%
% within BIS_90_yn 0.1% 0.0% 0.1%
% of Total 0.1% 0.0% 0.1%
Total
Count 5116 38 5154
% within
Definite_Awareness 99.3% 0.7% 100.0%
% within BIS_90_yn 100.0% 100.0% 100.0%
% of Total 99.3% 0.7% 100.0%

143
Chi-Square Tests
Value df Asymp. Sig. (2-
sided)
Exact Sig. (2-
sided)
Exact Sig. (1-
sided)
Pearson Chi-Square .022a 1 .881
Continuity Correctionb .000 1 1.000
Likelihood Ratio .044 1 .833
Fisher's Exact Test 1.000 .978
Linear-by-Linear
Association .022 1 .881
N of Valid Cases 5154
a. 2 cells (50.0%) have expected count less than 5. The minimum expected count is .02.
b. Computed only for a 2x2 table
Risk Estimate
Value 95% Confidence Interval
Lower Upper
For cohort BIS_90_yn = .00 .993 .990 .995
N of Valid Cases 5154

144
Definite_Awareness * BIS_50_yn
Crosstab
BIS_50_yn Total
.00 1.00
Definite_Awarenes
s
No
Count 2489 2662 5151
% within
Definite_Awareness 48.3% 51.7% 100.0%
% within BIS_50_yn 100.0% 99.9% 99.9%
% of Total 48.3% 51.6% 99.9%
Definite Awareness
Count 1 2 3
% within
Definite_Awareness 33.3% 66.7% 100.0%
% within BIS_50_yn 0.0% 0.1% 0.1%
% of Total 0.0% 0.0% 0.1%
Total
Count 2490 2664 5154
% within
Definite_Awareness 48.3% 51.7% 100.0%
% within BIS_50_yn 100.0% 100.0% 100.0%
% of Total 48.3% 51.7% 100.0%
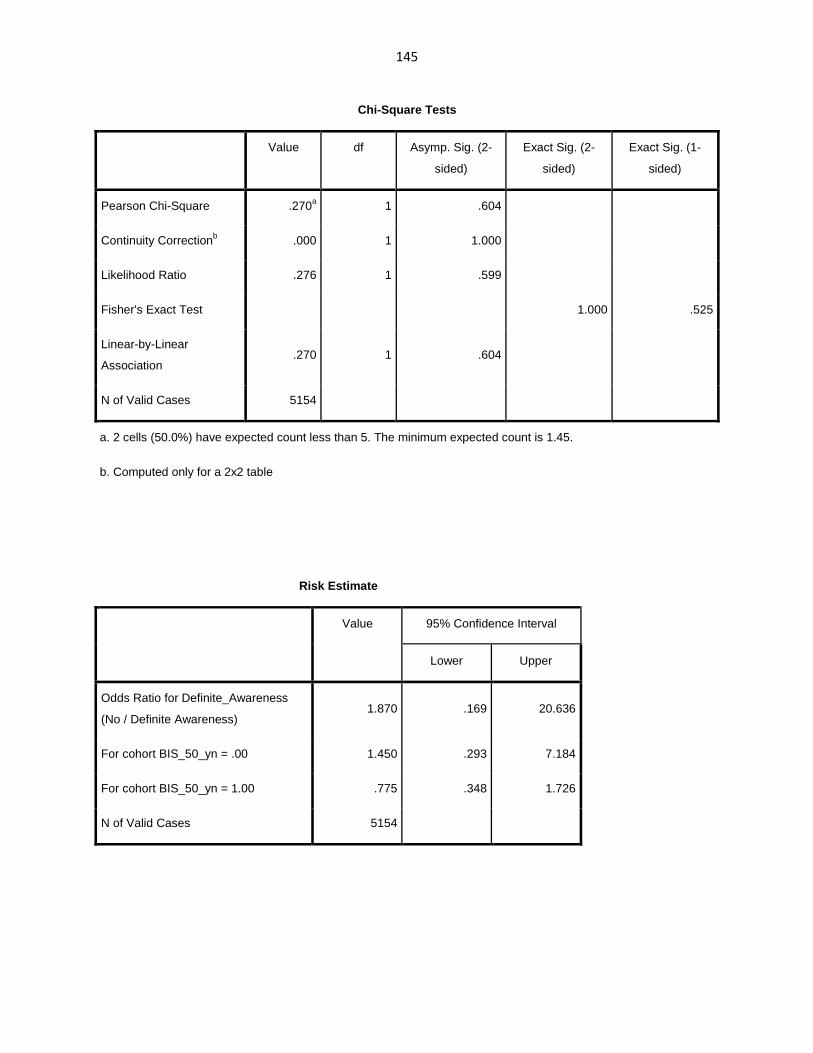
145
Chi-Square Tests
Value df Asymp. Sig. (2-
sided)
Exact Sig. (2-
sided)
Exact Sig. (1-
sided)
Pearson Chi-Square .270a 1 .604
Continuity Correctionb .000 1 1.000
Likelihood Ratio .276 1 .599
Fisher's Exact Test 1.000 .525
Linear-by-Linear
Association .270 1 .604
N of Valid Cases 5154
a. 2 cells (50.0%) have expected count less than 5. The minimum expected count is 1.45.
b. Computed only for a 2x2 table
Risk Estimate
Value 95% Confidence Interval
Lower Upper
Odds Ratio for Definite_Awareness
(No / Definite Awareness) 1.870 .169 20.636
For cohort BIS_50_yn = .00 1.450 .293 7.184
For cohort BIS_50_yn = 1.00 .775 .348 1.726
N of Valid Cases 5154

146
Definite_or_Possible_Awareness * BIS_60_alert_triggered_yn
Crosstab
BIS_60_alert_triggered_yn Total
No BIS >60 BIS >60 at least
once
Definite_or_Possible_Awarene
ss
No
Count 3748 1401 5149
% within
Definite_or_Possible_Awarenes
s
72.8% 27.2% 100.0%
% within
BIS_60_alert_triggered_yn 99.9% 99.9% 99.9%
% of Total 72.7% 27.2% 99.9%
Definite or Possible
Awareness
Count 4 1 5
% within
Definite_or_Possible_Awarenes
s
80.0% 20.0% 100.0%
% within
BIS_60_alert_triggered_yn 0.1% 0.1% 0.1%
% of Total 0.1% 0.0% 0.1%
Total
Count 3752 1402 5154
% within
Definite_or_Possible_Awarenes
s
72.8% 27.2% 100.0%
% within
BIS_60_alert_triggered_yn 100.0% 100.0% 100.0%
% of Total 72.8% 27.2% 100.0%

147
Chi-Square Tests
Value df Asymp. Sig. (2-
sided)
Exact Sig. (2-
sided)
Exact Sig. (1-
sided)
Pearson Chi-Square .131a 1 .717
Continuity Correctionb .000 1 1.000
Likelihood Ratio .140 1 .709
Fisher's Exact Test 1.000 .586
Linear-by-Linear
Association .131 1 .717
N of Valid Cases 5154
a. 2 cells (50.0%) have expected count less than 5. The minimum expected count is 1.36.
b. Computed only for a 2x2 table
Risk Estimate
Value 95% Confidence Interval
Lower Upper
Odds Ratio for
Definite_or_Possible_Awareness (No /
Definite or Possible Awareness)
.669 .075 5.989
For cohort BIS_60_alert_triggered_yn
= No BIS >60 .910 .587 1.411
For cohort BIS_60_alert_triggered_yn
= BIS >60 at least once 1.360 .236 7.857
N of Valid Cases 5154

148
Definite_or_Possible_Awareness * BIS_70_yn
Crosstab
BIS_70_yn Total
.00 1.00
Definite_or_Possible_Awarenes
s
No
Count 4742 407 5149
% within
Definite_or_Possible_Awareness 92.1% 7.9% 100.0%
% within BIS_70_yn 99.9% 100.0% 99.9%
% of Total 92.0% 7.9% 99.9%
Definite or Possible
Awareness
Count 5 0 5
% within
Definite_or_Possible_Awareness 100.0% 0.0% 100.0%
% within BIS_70_yn 0.1% 0.0% 0.1%
% of Total 0.1% 0.0% 0.1%
Total
Count 4747 407 5154
% within
Definite_or_Possible_Awareness 92.1% 7.9% 100.0%
% within BIS_70_yn 100.0% 100.0% 100.0%
% of Total 92.1% 7.9% 100.0%
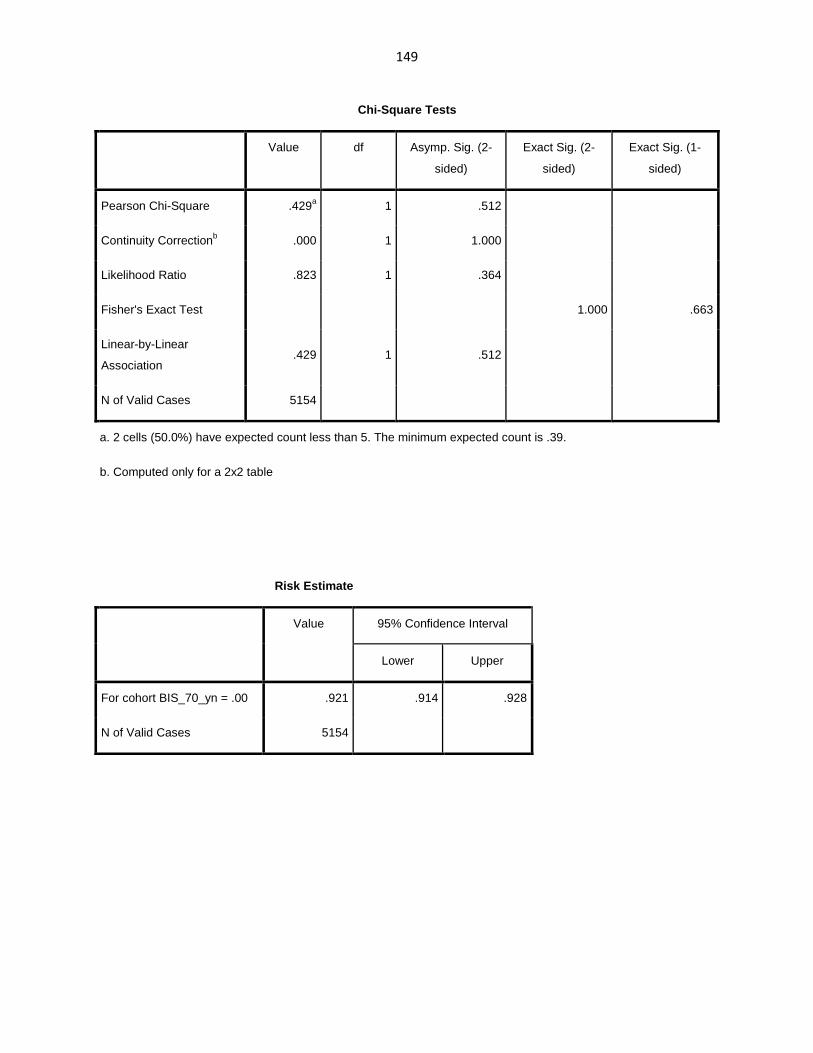
149
Chi-Square Tests
Value df Asymp. Sig. (2-
sided)
Exact Sig. (2-
sided)
Exact Sig. (1-
sided)
Pearson Chi-Square .429a 1 .512
Continuity Correctionb .000 1 1.000
Likelihood Ratio .823 1 .364
Fisher's Exact Test 1.000 .663
Linear-by-Linear
Association .429 1 .512
N of Valid Cases 5154
a. 2 cells (50.0%) have expected count less than 5. The minimum expected count is .39.
b. Computed only for a 2x2 table
Risk Estimate
Value 95% Confidence Interval
Lower Upper
For cohort BIS_70_yn = .00 .921 .914 .928
N of Valid Cases 5154

150
Definite_or_Possible_Awareness * BIS_80_yn
Crosstab
BIS_80_yn Total
.00 1.00
Definite_or_Possible_Awarenes
s
No
Count 5015 134 5149
% within
Definite_or_Possible_Awareness 97.4% 2.6% 100.0%
% within BIS_80_yn 99.9% 100.0% 99.9%
% of Total 97.3% 2.6% 99.9%
Definite or Possible
Awareness
Count 5 0 5
% within
Definite_or_Possible_Awareness 100.0% 0.0% 100.0%
% within BIS_80_yn 0.1% 0.0% 0.1%
% of Total 0.1% 0.0% 0.1%
Total
Count 5020 134 5154
% within
Definite_or_Possible_Awareness 97.4% 2.6% 100.0%
% within BIS_80_yn 100.0% 100.0% 100.0%
% of Total 97.4% 2.6% 100.0%

151
Chi-Square Tests
Value df Asymp. Sig. (2-
sided)
Exact Sig. (2-
sided)
Exact Sig. (1-
sided)
Pearson Chi-Square .134a 1 .715
Continuity Correctionb .000 1 1.000
Likelihood Ratio .264 1 .608
Fisher's Exact Test 1.000 .877
Linear-by-Linear
Association .134 1 .715
N of Valid Cases 5154
a. 2 cells (50.0%) have expected count less than 5. The minimum expected count is .13.
b. Computed only for a 2x2 table
Risk Estimate
Value 95% Confidence Interval
Lower Upper
For cohort BIS_80_yn = .00 .974 .970 .978
N of Valid Cases 5154

152
Definite_or_Possible_Awareness * BIS_90_yn
Crosstab
BIS_90_yn Total
.00 1.00
Definite_or_Possible_Awarenes
s
No
Count 5111 38 5149
% within
Definite_or_Possible_Awareness 99.3% 0.7% 100.0%
% within BIS_90_yn 99.9% 100.0% 99.9%
% of Total 99.2% 0.7% 99.9%
Definite or Possible
Awareness
Count 5 0 5
% within
Definite_or_Possible_Awareness 100.0% 0.0% 100.0%
% within BIS_90_yn 0.1% 0.0% 0.1%
% of Total 0.1% 0.0% 0.1%
Total
Count 5116 38 5154
% within
Definite_or_Possible_Awareness 99.3% 0.7% 100.0%
% within BIS_90_yn 100.0% 100.0% 100.0%
% of Total 99.3% 0.7% 100.0%

153
Chi-Square Tests
Value df Asymp. Sig. (2-
sided)
Exact Sig. (2-
sided)
Exact Sig. (1-
sided)
Pearson Chi-Square .037a 1 .847
Continuity Correctionb .000 1 1.000
Likelihood Ratio .074 1 .786
Fisher's Exact Test 1.000 .964
Linear-by-Linear
Association .037 1 .847
N of Valid Cases 5154
a. 2 cells (50.0%) have expected count less than 5. The minimum expected count is .04.
b. Computed only for a 2x2 table
Risk Estimate
Value 95% Confidence Interval
Lower Upper
For cohort BIS_90_yn = .00 .993 .990 .995
N of Valid Cases 5154

154
Definite_or_Possible_Awareness * BIS_50_yn
Crosstab
BIS_50_yn Total
.00 1.00
Definite_or_Possible_Awarenes
s
No
Count 2488 2661 5149
% within
Definite_or_Possible_Awareness 48.3% 51.7% 100.0%
% within BIS_50_yn 99.9% 99.9% 99.9%
% of Total 48.3% 51.6% 99.9%
Definite or Possible
Awareness
Count 2 3 5
% within
Definite_or_Possible_Awareness 40.0% 60.0% 100.0%
% within BIS_50_yn 0.1% 0.1% 0.1%
% of Total 0.0% 0.1% 0.1%
Total
Count 2490 2664 5154
% within
Definite_or_Possible_Awareness 48.3% 51.7% 100.0%
% within BIS_50_yn 100.0% 100.0% 100.0%
% of Total 48.3% 51.7% 100.0%

155
Chi-Square Tests
Value df Asymp. Sig. (2-
sided)
Exact Sig. (2-
sided)
Exact Sig. (1-
sided)
Pearson Chi-Square .138a 1 .710
Continuity Correctionb .000 1 1.000
Likelihood Ratio .140 1 .709
Fisher's Exact Test 1.000 .532
Linear-by-Linear
Association .138 1 .710
N of Valid Cases 5154
a. 2 cells (50.0%) have expected count less than 5. The minimum expected count is 2.42.
b. Computed only for a 2x2 table
Risk Estimate
Value 95% Confidence Interval
Lower Upper
Odds Ratio for
Definite_or_Possible_Awareness (No /
Definite or Possible Awareness)
1.402 .234 8.400
For cohort BIS_50_yn = .00 1.208 .413 3.536
For cohort BIS_50_yn = 1.00 .861 .421 1.763
N of Valid Cases 5154

156
New_groups * AAMAC_0.4_yn
Crosstab
AAMAC_0.4_yn Total
No AAMAC<0.4 alerts
1+ AAMAC <0.4 alerts
New_groups
MAC
Count 6397 1639 8036
% within New_groups
79.6% 20.4% 100.0%
% within AAMAC_0.4_yn
74.3% 71.6% 73.8%
% of Total 58.7% 15.0% 73.8%
BIS no BIS
Count 2209 649 2858
% within New_groups
77.3% 22.7% 100.0%
% within AAMAC_0.4_yn
25.7% 28.4% 26.2%
% of Total 20.3% 6.0% 26.2%
Total
Count 8606 2288 10894
% within New_groups
79.0% 21.0% 100.0%
% within AAMAC_0.4_yn
100.0% 100.0% 100.0%
% of Total 79.0% 21.0% 100.0%

157
Chi-Square Tests
Value df Asymp. Sig. (2-
sided)
Exact Sig. (2-
sided)
Exact Sig. (1-
sided)
Pearson Chi-Square 6.795a 1 .009
Continuity Correctionb 6.656 1 .010
Likelihood Ratio 6.712 1 .010
Fisher's Exact Test .009 .005
Linear-by-Linear
Association 6.794 1 .009
N of Valid Cases 10894
a. 0 cells (.0%) have expected count less than 5. The minimum expected count is 600.25.
b. Computed only for a 2x2 table
Risk Estimate
Value 95% Confidence Interval
Lower Upper
Odds Ratio for New_groups (MAC /
BIS no BIS) 1.147 1.034 1.271
For cohort AAMAC_0.4_yn = No
AAMAC<0.4 alerts 1.030 1.007 1.054
For cohort AAMAC_0.4_yn = 1+
AAMAC <0.4 alerts .898 .829 .973
N of Valid Cases 10894
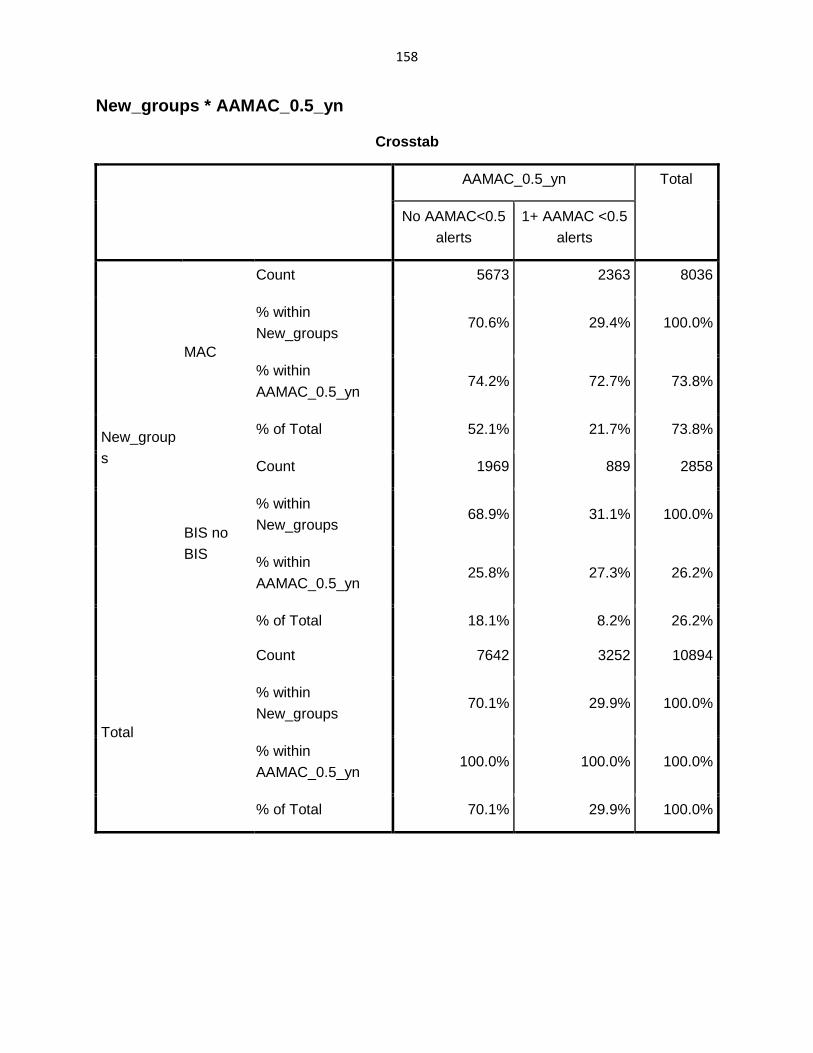
158
New_groups * AAMAC_0.5_yn
Crosstab
AAMAC_0.5_yn Total
No AAMAC<0.5 alerts
1+ AAMAC <0.5 alerts
New_groups
MAC
Count 5673 2363 8036
% within New_groups
70.6% 29.4% 100.0%
% within AAMAC_0.5_yn
74.2% 72.7% 73.8%
% of Total 52.1% 21.7% 73.8%
BIS no BIS
Count 1969 889 2858
% within New_groups
68.9% 31.1% 100.0%
% within AAMAC_0.5_yn
25.8% 27.3% 26.2%
% of Total 18.1% 8.2% 26.2%
Total
Count 7642 3252 10894
% within New_groups
70.1% 29.9% 100.0%
% within AAMAC_0.5_yn
100.0% 100.0% 100.0%
% of Total 70.1% 29.9% 100.0%
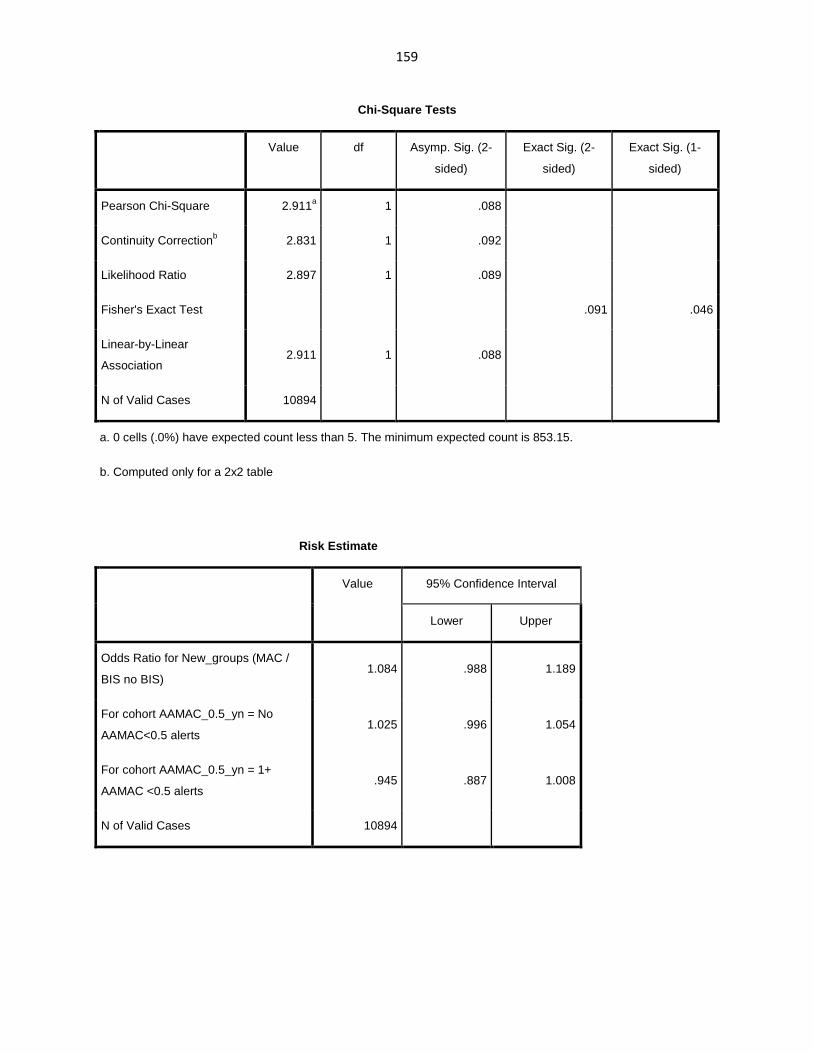
159
Chi-Square Tests
Value df Asymp. Sig. (2-
sided)
Exact Sig. (2-
sided)
Exact Sig. (1-
sided)
Pearson Chi-Square 2.911a 1 .088
Continuity Correctionb 2.831 1 .092
Likelihood Ratio 2.897 1 .089
Fisher's Exact Test .091 .046
Linear-by-Linear
Association 2.911 1 .088
N of Valid Cases 10894
a. 0 cells (.0%) have expected count less than 5. The minimum expected count is 853.15.
b. Computed only for a 2x2 table
Risk Estimate
Value 95% Confidence Interval
Lower Upper
Odds Ratio for New_groups (MAC /
BIS no BIS) 1.084 .988 1.189
For cohort AAMAC_0.5_yn = No
AAMAC<0.5 alerts 1.025 .996 1.054
For cohort AAMAC_0.5_yn = 1+
AAMAC <0.5 alerts .945 .887 1.008
N of Valid Cases 10894
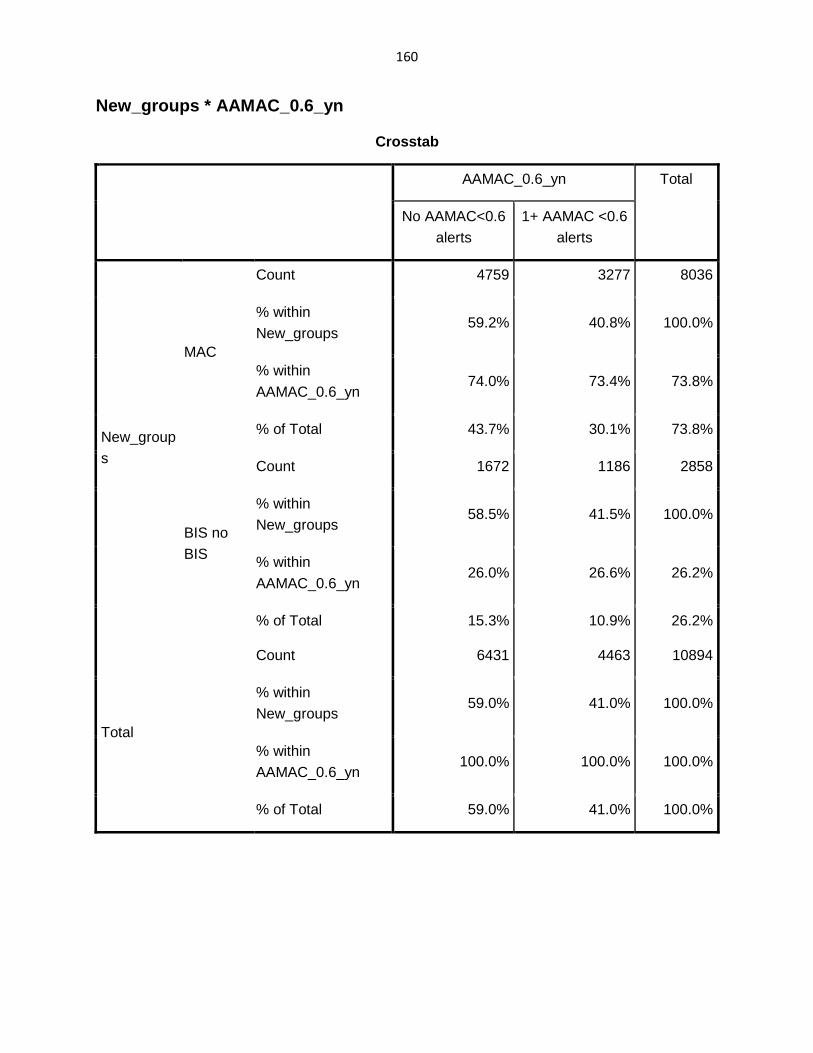
160
New_groups * AAMAC_0.6_yn
Crosstab
AAMAC_0.6_yn Total
No AAMAC<0.6 alerts
1+ AAMAC <0.6 alerts
New_groups
MAC
Count 4759 3277 8036
% within New_groups
59.2% 40.8% 100.0%
% within AAMAC_0.6_yn
74.0% 73.4% 73.8%
% of Total 43.7% 30.1% 73.8%
BIS no BIS
Count 1672 1186 2858
% within New_groups
58.5% 41.5% 100.0%
% within AAMAC_0.6_yn
26.0% 26.6% 26.2%
% of Total 15.3% 10.9% 26.2%
Total
Count 6431 4463 10894
% within New_groups
59.0% 41.0% 100.0%
% within AAMAC_0.6_yn
100.0% 100.0% 100.0%
% of Total 59.0% 41.0% 100.0%

161
Chi-Square Tests
Value df Asymp. Sig. (2-
sided)
Exact Sig. (2-
sided)
Exact Sig. (1-
sided)
Pearson Chi-Square .450a 1 .502
Continuity Correctionb .421 1 .517
Likelihood Ratio .450 1 .502
Fisher's Exact Test .507 .258
Linear-by-Linear
Association .450 1 .502
N of Valid Cases 10894
a. 0 cells (.0%) have expected count less than 5. The minimum expected count is 1170.85.
b. Computed only for a 2x2 table
Risk Estimate
Value 95% Confidence Interval
Lower Upper
Odds Ratio for New_groups (MAC /
BIS no BIS) 1.030 .945 1.123
For cohort AAMAC_0.6_yn = No
AAMAC<0.6 alerts 1.012 .977 1.049
For cohort AAMAC_0.6_yn = 1+
AAMAC <0.6 alerts .983 .934 1.034
N of Valid Cases 10894

162
New_groups * AAMAC_0.7_yn
Crosstab
AAMAC_0.7_yn Total
No AAMAC<0.7 alerts
1+ AAMAC <0.7 alerts
New_groups
MAC
Count 3653 4383 8036
% within New_groups
45.5% 54.5% 100.0%
% within AAMAC_0.7_yn
73.9% 73.7% 73.8%
% of Total 33.5% 40.2% 73.8%
BIS no BIS
Count 1293 1565 2858
% within New_groups
45.2% 54.8% 100.0%
% within AAMAC_0.7_yn
26.1% 26.3% 26.2%
% of Total 11.9% 14.4% 26.2%
Total
Count 4946 5948 10894
% within New_groups
45.4% 54.6% 100.0%
% within AAMAC_0.7_yn
100.0% 100.0% 100.0%
% of Total 45.4% 54.6% 100.0%

163
Chi-Square Tests
Value df Asymp. Sig. (2-
sided)
Exact Sig. (2-
sided)
Exact Sig. (1-
sided)
Pearson Chi-Square .040a 1 .842
Continuity Correctionb .032 1 .859
Likelihood Ratio .040 1 .842
Fisher's Exact Test .844 .429
Linear-by-Linear
Association .040 1 .842
N of Valid Cases 10894
a. 0 cells (.0%) have expected count less than 5. The minimum expected count is 1297.56.
b. Computed only for a 2x2 table
Risk Estimate
Value 95% Confidence Interval
Lower Upper
Odds Ratio for New_groups (MAC /
BIS no BIS) 1.009 .926 1.099
For cohort AAMAC_0.7_yn = No
AAMAC<0.7 alerts 1.005 .959 1.053
For cohort AAMAC_0.7_yn = 1+
AAMAC <0.7 alerts .996 .958 1.035
N of Valid Cases 10894

164
New_groups * AAMAC_0.8_yn
Crosstab
AAMAC_0.8_yn Total
No AAMAC<0.8 alerts
1+ AAMAC <0.8 alerts
New_groups
MAC
Count 2460 5576 8036
% within New_groups
30.6% 69.4% 100.0%
% within AAMAC_0.8_yn
74.1% 73.6% 73.8%
% of Total 22.6% 51.2% 73.8%
BIS no BIS
Count 859 1999 2858
% within New_groups
30.1% 69.9% 100.0%
% within AAMAC_0.8_yn
25.9% 26.4% 26.2%
% of Total 7.9% 18.3% 26.2%
Total
Count 3319 7575 10894
% within New_groups
30.5% 69.5% 100.0%
% within AAMAC_0.8_yn
100.0% 100.0% 100.0%
% of Total 30.5% 69.5% 100.0%

165
Chi-Square Tests
Value df Asymp. Sig. (2-
sided)
Exact Sig. (2-
sided)
Exact Sig. (1-
sided)
Pearson Chi-Square .308a 1 .579
Continuity Correctionb .282 1 .595
Likelihood Ratio .308 1 .579
Fisher's Exact Test .586 .298
Linear-by-Linear
Association .308 1 .579
N of Valid Cases 10894
a. 0 cells (.0%) have expected count less than 5. The minimum expected count is 870.73.
b. Computed only for a 2x2 table
Risk Estimate
Value 95% Confidence Interval
Lower Upper
Odds Ratio for New_groups (MAC /
BIS no BIS) 1.027 .936 1.127
For cohort AAMAC_0.8_yn = No
AAMAC<0.8 alerts 1.019 .955 1.087
For cohort AAMAC_0.8_yn = 1+
AAMAC <0.8 alerts .992 .965 1.020
N of Valid Cases 10894

166
New_groups * AAMAC_0.9_yn
Crosstab
AAMAC_0.9_yn Total
No AAMAC<0.9 alerts
1+ AAMAC <0.9 alerts
New_groups
MAC
Count 1433 6603 8036
% within New_groups
17.8% 82.2% 100.0%
% within AAMAC_0.9_yn
73.8% 73.8% 73.8%
% of Total 13.2% 60.6% 73.8%
BIS no BIS
Count 509 2349 2858
% within New_groups
17.8% 82.2% 100.0%
% within AAMAC_0.9_yn
26.2% 26.2% 26.2%
% of Total 4.7% 21.6% 26.2%
Total
Count 1942 8952 10894
% within New_groups
17.8% 82.2% 100.0%
% within AAMAC_0.9_yn
100.0% 100.0% 100.0%
% of Total 17.8% 82.2% 100.0%

167
Chi-Square Tests
Value df Asymp. Sig. (2-
sided)
Exact Sig. (2-
sided)
Exact Sig. (1-
sided)
Pearson Chi-Square .001a 1 .978
Continuity Correctionb .000 1 1.000
Likelihood Ratio .001 1 .978
Fisher's Exact Test .999 .501
Linear-by-Linear
Association .001 1 .978
N of Valid Cases 10894
a. 0 cells (.0%) have expected count less than 5. The minimum expected count is 509.48.
b. Computed only for a 2x2 table
Risk Estimate
Value 95% Confidence Interval
Lower Upper
Odds Ratio for New_groups (MAC /
BIS no BIS) 1.002 .896 1.120
For cohort AAMAC_0.9_yn = No
AAMAC<0.9 alerts 1.001 .914 1.097
For cohort AAMAC_0.9_yn = 1+
AAMAC <0.9 alerts 1.000 .980 1.020
N of Valid Cases 10894
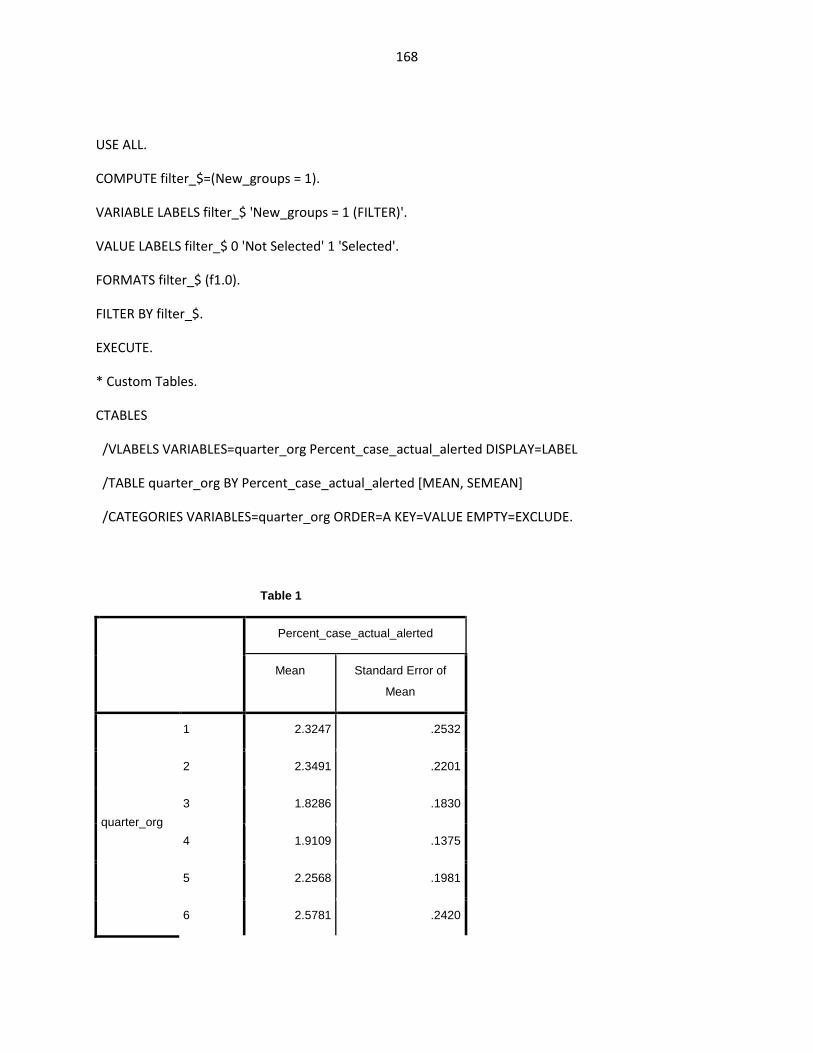
168
USE ALL.
COMPUTE filter_$=(New_groups = 1).
VARIABLE LABELS filter_$ 'New_groups = 1 (FILTER)'.
VALUE LABELS filter_$ 0 'Not Selected' 1 'Selected'.
FORMATS filter_$ (f1.0).
FILTER BY filter_$.
EXECUTE.
* Custom Tables.
CTABLES
/VLABELS VARIABLES=quarter_org Percent_case_actual_alerted DISPLAY=LABEL
/TABLE quarter_org BY Percent_case_actual_alerted [MEAN, SEMEAN]
/CATEGORIES VARIABLES=quarter_org ORDER=A KEY=VALUE EMPTY=EXCLUDE.
Table 1
Percent_case_actual_alerted
Mean Standard Error of
Mean
quarter_org
1 2.3247 .2532
2 2.3491 .2201
3 1.8286 .1830
4 1.9109 .1375
5 2.2568 .1981
6 2.5781 .2420
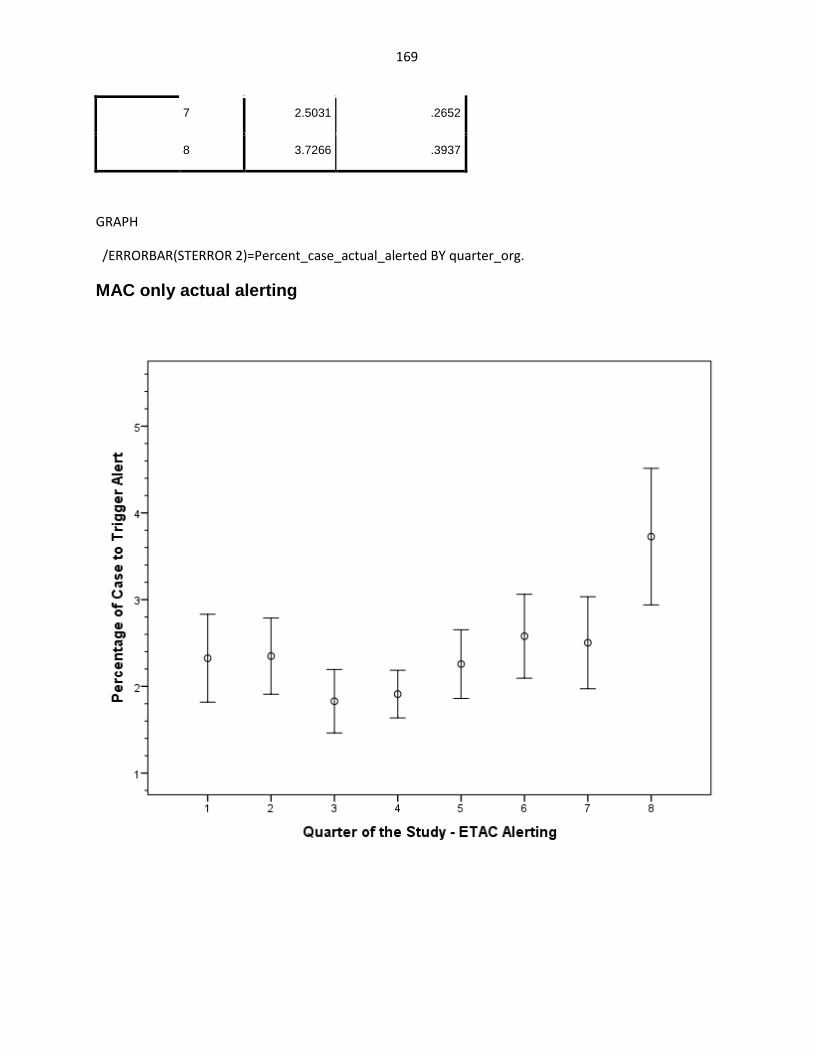
169
7 2.5031 .2652
8 3.7266 .3937
GRAPH
/ERRORBAR(STERROR 2)=Percent_case_actual_alerted BY quarter_org.
MAC only actual alerting

170
GRAPH
/ERRORBAR(STERROR 2)=Percent_BIS_60 BY quarter_org.
BIS alerting
* Custom Tables.

171
CTABLES
/VLABELS VARIABLES=quarter_org Percent_BIS_60 DISPLAY=LABEL
/TABLE quarter_org [C] BY Percent_BIS_60 [MEAN, SEMEAN]
/CATEGORIES VARIABLES=quarter_org ORDER=A KEY=VALUE EMPTY=EXCLUDE.
Table 1
Percent_BIS_60
Mean Standard Error of
Mean
quarter_org
1 4.10 .52
2 3.48 .41
3 4.28 .47
4 3.04 .35
5 3.23 .33
6 3.25 .34
7 3.98 .36
8 3.57 .36
FILTER OFF.
USE ALL.
EXECUTE.
USE ALL.
COMPUTE filter_$=(New_groups = 1 OR New_groups = 3).
VARIABLE LABELS filter_$ 'New_groups = 1 OR New_groups = 3 (FILTER)'.
VALUE LABELS filter_$ 0 'Not Selected' 1 'Selected'.
FORMATS filter_$ (f1.0).

172
FILTER BY filter_$.
EXECUTE.
GRAPH
/ERRORBAR(STERROR 2)=Percent_case_actual_alerted BY quarter_org
/PANEL COLVAR=New_groups COLOP=CROSS.

173
GRAPH
/ERRORBAR(STERROR 2)=Percent_case_actual_alerted BY quarter_org BY New_groups.
FILTER OFF.
USE ALL.
EXECUTE.
DATASET ACTIVATE DataSet1.
SAVE OUTFILE='D:\amysha\Desktop\MACS '+
'alerting\BIS_dissertation_merged_with_deletions_NO_PROPOFOL_INFUSIONS_21Aug12.sav'
/COMPRESSED.
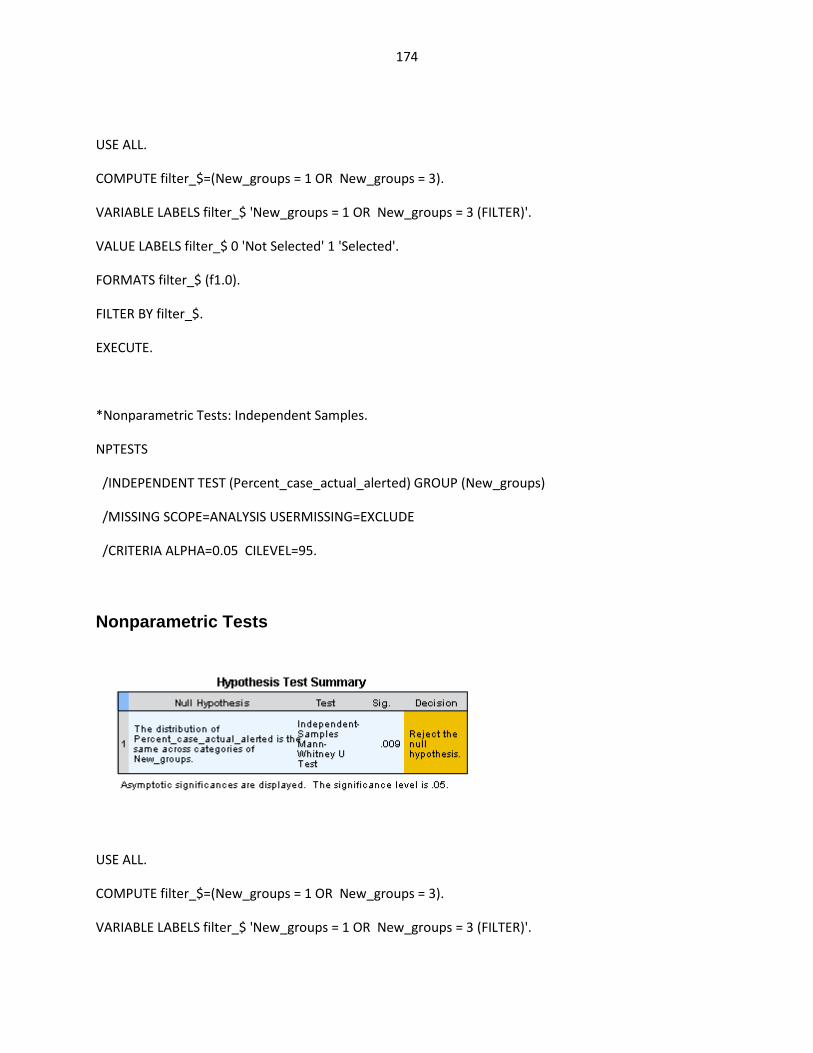
174
USE ALL.
COMPUTE filter_$=(New_groups = 1 OR New_groups = 3).
VARIABLE LABELS filter_$ 'New_groups = 1 OR New_groups = 3 (FILTER)'.
VALUE LABELS filter_$ 0 'Not Selected' 1 'Selected'.
FORMATS filter_$ (f1.0).
FILTER BY filter_$.
EXECUTE.
*Nonparametric Tests: Independent Samples.
NPTESTS
/INDEPENDENT TEST (Percent_case_actual_alerted) GROUP (New_groups)
/MISSING SCOPE=ANALYSIS USERMISSING=EXCLUDE
/CRITERIA ALPHA=0.05 CILEVEL=95.
Nonparametric Tests
USE ALL.
COMPUTE filter_$=(New_groups = 1 OR New_groups = 3).
VARIABLE LABELS filter_$ 'New_groups = 1 OR New_groups = 3 (FILTER)'.

175
VALUE LABELS filter_$ 0 'Not Selected' 1 'Selected'.
FORMATS filter_$ (f1.0).
FILTER BY filter_$.
EXECUTE.
* Custom Tables.
CTABLES
/VLABELS VARIABLES=New_groups quarter_org Percent_case_actual_alerted DISPLAY=LABEL
/TABLE New_groups > quarter_org BY Percent_case_actual_alerted [MEAN]
/CATEGORIES VARIABLES=New_groups ORDER=A KEY=VALUE EMPTY=INCLUDE
/CATEGORIES VARIABLES=quarter_org ORDER=A KEY=VALUE EMPTY=EXCLUDE.
Custom Tables
Table 1
Percent_case_actual_
alerted
Mean
New_groups MAC quarter_org
1 2.3247
2 2.3491
3 1.8286
4 1.9109
5 2.2568
6 2.5781
7 2.5031
8 3.7266
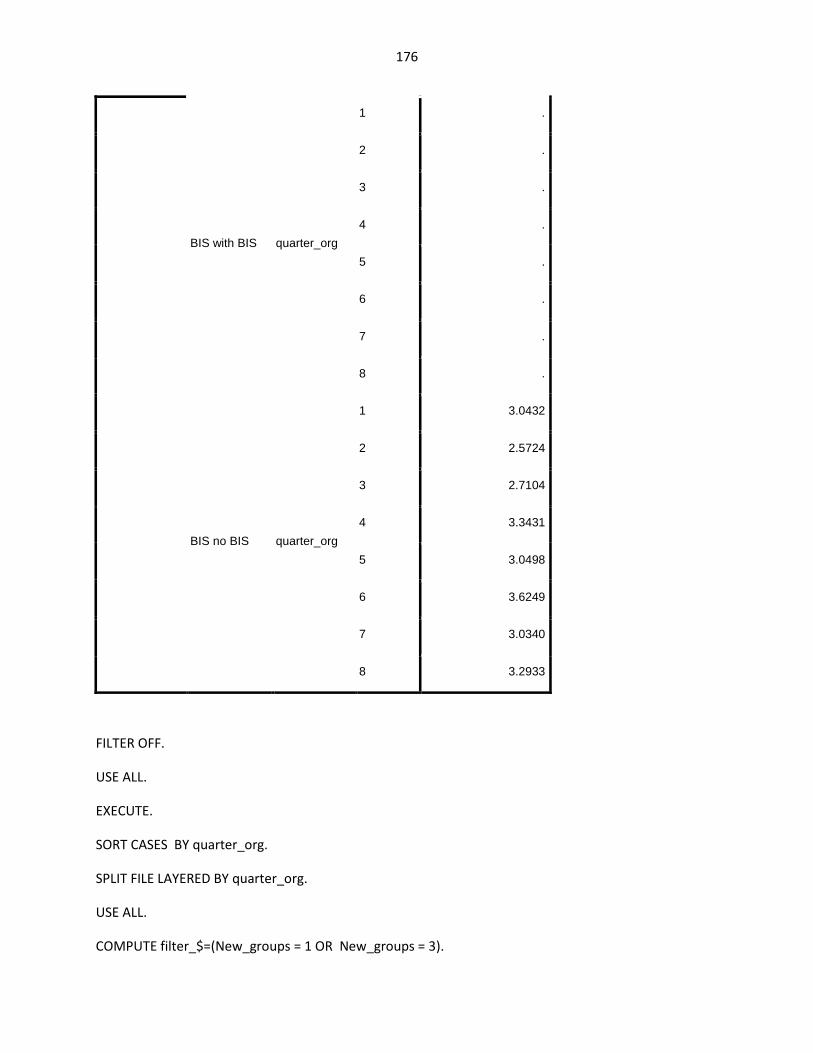
176
BIS with BIS quarter_org
1 .
2 .
3 .
4 .
5 .
6 .
7 .
8 .
BIS no BIS quarter_org
1 3.0432
2 2.5724
3 2.7104
4 3.3431
5 3.0498
6 3.6249
7 3.0340
8 3.2933
FILTER OFF.
USE ALL.
EXECUTE.
SORT CASES BY quarter_org.
SPLIT FILE LAYERED BY quarter_org.
USE ALL.
COMPUTE filter_$=(New_groups = 1 OR New_groups = 3).

177
VARIABLE LABELS filter_$ 'New_groups = 1 OR New_groups = 3 (FILTER)'.
VALUE LABELS filter_$ 0 'Not Selected' 1 'Selected'.
FORMATS filter_$ (f1.0).
FILTER BY filter_$.
EXECUTE.
*Nonparametric Tests: Independent Samples.
NPTESTS
/INDEPENDENT TEST (Percent_case_actual_alerted) GROUP (New_groups)
/MISSING SCOPE=ANALYSIS USERMISSING=EXCLUDE
/CRITERIA ALPHA=0.05 CILEVEL=95.
quarter_org = 1
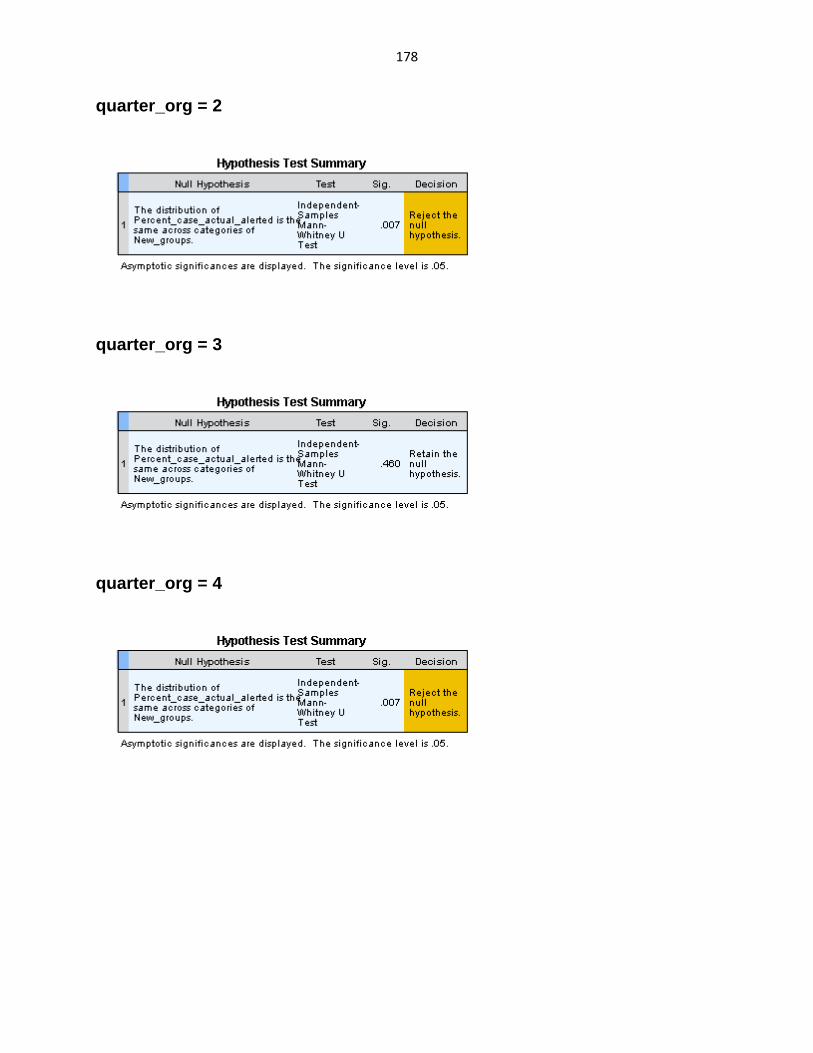
178
quarter_org = 2
quarter_org = 3
quarter_org = 4

179
quarter_org = 5
quarter_org = 6
quarter_org = 7

180
quarter_org = 8

181
REFERENCES
1991. American Electroencephalographic Society guidelines for standard electrode position
nomenclature. Journal of clinical neurophysiology : official publication of the American
Electroencephalographic Society 8, 200-202.
Aantaa, R., Jaakola, M.L., Kallio, A., Kanto, J., 1997. Reduction of the minimum alveolar
concentration of isoflurane by dexmedetomidine. Anesthesiology 86, 1055-1060.
Abouleish, E., Taylor, F.H., 1976. Effect of morphine-diazepam on signs of anesthesia,
awareness, and dreams of patients under N2O for cesarean section. Anesthesia and
analgesia 55, 702-705.
Akeju, O., Westover, M.B., Pavone, K.J., Sampson, A.L., Hartnack, K.E., Brown, E.N., Purdon,
P.L., 2014. Effects of sevoflurane and propofol on frontal electroencephalogram power
and coherence. Anesthesiology 121, 990-998.
Aranake, A., Gradwohl, S., Ben-Abdallah, A., Lin, N., Shanks, A., Helsten, D.L., Glick, D.B.,
Jacobsohn, E., Villafranca, A.J., Evers, A.S., Avidan, M.S., Mashour, G.A., 2013.
Increased risk of intraoperative awareness in patients with a history of awareness.
Anesthesiology 119, 1275-1283.
ASA Task Force, 2006. Practice advisory for intraoperative awareness and brain function
monitoring: a report by the american society of anesthesiologists task force on
intraoperative awareness. Anesthesiology 104, 847-864.
Avidan, M.S., Jacobsohn, E., Glick, D., Burnside, B.A., Zhang, L., Villafranca, A., Karl, L.,
Kamal, S., Torres, B., O'Connor, M., Evers, A.S., Gradwohl, S., Lin, N., Palanca, B.J.,
Mashour, G.A., Group, B.-R.R., 2011. Prevention of intraoperative awareness in a high-
risk surgical population. The New England journal of medicine 365, 591-600.

182
Avidan, M.S., Mashour, G.A., 2013. Prevention of intraoperative awareness with explicit recall:
making sense of the evidence. Anesthesiology 118, 449-456.
Avidan, M.S., Palanca, B.J., Glick, D., Jacobsohn, E., Villafranca, A., O'Connor, M., Mashour,
G.A., Group, B.-R.S., 2009. Protocol for the BAG-RECALL clinical trial: a prospective,
multi-center, randomized, controlled trial to determine whether a bispectral index-guided
protocol is superior to an anesthesia gas-guided protocol in reducing intraoperative
awareness with explicit recall in high risk surgical patients. BMC anesthesiology 9, 8.
Avidan, M.S., Zhang, L., Burnside, B.A., Finkel, K.J., Searleman, A.C., Selvidge, J.A., Saager,
L., Turner, M.S., Rao, S., Bottros, M., Hantler, C., Jacobsohn, E., Evers, A.S., 2008.
Anesthesia awareness and the bispectral index. The New England journal of medicine
358, 1097-1108.
Baker, D.E., 2009. Medication alert fatigue: the potential for compromised patient safety.
Hospital Pharmacy, 460-461.
Barr, G., Jakobsson, J.G., Owall, A., Anderson, R.E., 1999. Nitrous oxide does not alter
bispectral index: study with nitrous oxide as sole agent and as an adjunct to i.v.
anaesthesia. British journal of anaesthesia 82, 827-830.
Bates, D.W., Cohen, M., Leape, L.L., Overhage, J.M., Shabot, M.M., Sheridan, T., 2001.
Reducing the frequency of errors in medicine using information technology. Journal of
the American Medical Informatics Association : JAMIA 8, 299-308.
Bewick, V., Cheek, L., Ball, J., 2004. Statistics review 13: receiver operating characteristic
curves. Critical care 8, 508-512.

183
Blake, D.D., Weathers, F.W., Nagy, L.M., Kaloupek, D.G., Gusman, F.D., Charney, D.S.,
Keane, T.M., 1995. The development of a Clinician-Administered PTSD Scale. J Trauma
Stress 8, 75-90.
Block, F.E., Jr., Nuutinen, L., Ballast, B., 1999. Optimization of alarms: a study on alarm limits,
alarm sounds, and false alarms, intended to reduce annoyance. Journal of clinical
monitoring and computing 15, 75-83.
Brice, D.D., Hetherington, R.R., Utting, J.E., 1970. A simple study of awareness and dreaming
during anaesthesia. British journal of anaesthesia 42, 535-542.
Casali, A.G., Gosseries, O., Rosanova, M., Boly, M., Sarasso, S., Casali, K.R., Casarotto, S.,
Bruno, M.A., Laureys, S., Tononi, G., Massimini, M., 2013. A theoretically based index
of consciousness independent of sensory processing and behavior. Science translational
medicine 5, 198ra105.
Changeux, J.P., 2012. Conscious processing: implications for general anesthesia. Current opinion
in anaesthesiology 25, 397-404.
Cook, T.M., Andrade, J., Bogod, D.G., Hitchman, J.M., Jonker, W.R., Lucas, N., Mackay, J.H.,
Nimmo, A.F., O'Connor, K., O'Sullivan, E.P., Paul, R.G., Palmer, J.H., Plaat, F.,
Radcliffe, J.J., Sury, M.R., Torevell, H.E., Wang, M., Hainsworth, J., Pandit, J.J., Royal
College of, A., Association of Anaesthetists of Great, B., Ireland, 2014. 5th National
Audit Project (NAP5) on accidental awareness during general anaesthesia: patient
experiences, human factors, sedation, consent, and medicolegal issues. British journal of
anaesthesia 113, 560-574.
Crosby, G., 2011. General anesthesia--minding the mind during surgery. N Engl J Med 365, 660-
661.

184
Dehaene, S., Changeux, J.P., 2011. Experimental and theoretical approaches to conscious
processing. Neuron 70, 200-227.
Dehaene, S., Kerszberg, M., Changeux, J.P., 1998. A neuronal model of a global workspace in
effortful cognitive tasks. Proceedings of the National Academy of Sciences of the United
States of America 95, 14529-14534.
Domino, K.B., Posner, K.L., Caplan, R.A., Cheney, F.W., 1999. Awareness during anesthesia: a
closed claims analysis. Anesthesiology 90, 1053-1061.
Drummond, J.C., Brann, C.A., Perkins, D.E., Wolfe, D.E., 1991. A comparison of median
frequency, spectral edge frequency, a frequency band power ratio, total power, and
dominance shift in the determination of depth of anesthesia. Acta anaesthesiologica
Scandinavica 35, 693-699.
Eden, A., Pizov, R., Toderis, L., Kantor, G., Perel, A., 2009. The impact of an electronic
reminder on the use of alarms after separation from cardiopulmonary bypass. Anesthesia
and analgesia 108, 1203-1208.
Eger, E.I., 2nd, 2001. Age, minimum alveolar anesthetic concentration, and minimum alveolar
anesthetic concentration-awake. Anesthesia and analgesia 93, 947-953.
Eger, E.I., 2nd, Saidman, L.J., Brandstater, B., 1965. Minimum alveolar anesthetic
concentration: a standard of anesthetic potency. Anesthesiology 26, 756-763.
Ekman, A., Lindholm, M.L., Lennmarken, C., Sandin, R., 2004. Reduction in the incidence of
awareness using BIS monitoring. Acta anaesthesiologica Scandinavica 48, 20-26.
Errando, C.L., Sigl, J.C., Robles, M., Calabuig, E., Garcia, J., Arocas, F., Higueras, R., Del
Rosario, E., Lopez, D., Peiro, C.M., Soriano, J.L., Chaves, S., Gil, F., Garcia-Aguado, R.,

185
2008. Awareness with recall during general anaesthesia: a prospective observational
evaluation of 4001 patients. British journal of anaesthesia 101, 178-185.
Freye, E., Levy, J.V., 2005. Cerebral monitoring in the operating room and the intensive care
unit: an introductory for the clinician and a guide for the novice wanting to open a
window to the brain. Part I: The electroencephalogram. Journal of clinical monitoring and
computing 19, 1-76.
Gan, T.J., Glass, P.S., Windsor, A., Payne, F., Rosow, C., Sebel, P., Manberg, P., 1997.
Bispectral index monitoring allows faster emergence and improved recovery from
propofol, alfentanil, and nitrous oxide anesthesia. BIS Utility Study Group.
Anesthesiology 87, 808-815.
Gelb, A.W., Leslie, K., Stanski, D.R., Shafer, S.L., 2009. Monitoring the Depth of Anesthesia,
in: Miller, R.D., Eriksson, L.I., Fleisher, L., Weiner-Kronish, J.P., Young, W.L. (Ed.),
Miller's Anesthesia, 7 ed. Elsevier, Philadelphia, PA, pp. 1229-1265.
Ghoneim, M.M., 2010. Etiology and risk factors of intraoperative awareness, in: Mashour, G.A.
(Ed.), Consciousness, Awareness, and Anesthesia. Cambridge University Press, New
York, NY, pp. 90-113.
Ghoneim, M.M., Block, R.I., Haffarnan, M., Mathews, M.J., 2009. Awareness during anesthesia:
risk factors, causes and sequelae: a review of reported cases in the literature. Anesthesia
and analgesia 108, 527-535.
Gibbs, F.A., Gibbs, E. L., Lennox, W. G, 1937. Effect on the Electro-encephalogram of Certain
Drugs which Influence Nervous Activity. Archives of internal medicine 60, 154-166.

186
Glass, P.S., Bloom, M., Kearse, L., Rosow, C., Sebel, P., Manberg, P., 1997. Bispectral analysis
measures sedation and memory effects of propofol, midazolam, isoflurane, and alfentanil
in healthy volunteers. Anesthesiology 86, 836-847.
Gonsowski, C.T., Chortkoff, B.S., Eger, E.I., 2nd, Bennett, H.L., Weiskopf, R.B., 1995.
Subanesthetic concentrations of desflurane and isoflurane suppress explicit and implicit
learning. Anesthesia and analgesia 80, 568-572.
Hagihira, S., Takashina, M., Mori, T., Mashimo, T., Yoshiya, I., 2001. Practical issues in
bispectral analysis of electroencephalographic signals. Anesthesia and analgesia 93, 966-
970, table of contents.
Harrell, F.E., Jr., Lee, K.L., Califf, R.M., Pryor, D.B., Rosati, R.A., 1984. Regression modelling
strategies for improved prognostic prediction. Statistics in medicine 3, 143-152.
Iselin-Chaves, I.A., Flaishon, R., Sebel, P.S., Howell, S., Gan, T.J., Sigl, J., Ginsberg, B., Glass,
P.S., 1998. The effect of the interaction of propofol and alfentanil on recall, loss of
consciousness, and the Bispectral Index. Anesthesia and analgesia 87, 949-955.
JACHO, 2004. Joint commission on accreditation of hospital organizations sentinel event alert
Report No. 32.
Jameson, L.C., Sloan, T.B., 2006. Using EEG to monitor anesthesia drug effects during surgery.
Journal of clinical monitoring and computing 20, 445-472.
Johansen, J.W., 2006. Update on bispectral index monitoring. Best practice & research. Clinical
anaesthesiology 20, 81-99.
Johansen, J.W., Sebel, P.S., 2000. Development and clinical application of
electroencephalographic bispectrum monitoring. Anesthesiology 93, 1336-1344.
187
Johansen, J.W., Sebel, P.S., Sigl, J.C., 2000. Clinical impact of hypnotic-titration guidelines
based on EEG bispectral index (BIS) monitoring during routine anesthetic care. Journal
of clinical anesthesia 12, 433-443.
John, E.R., Prichep, L.S., 2005. The anesthetic cascade: a theory of how anesthesia suppresses
consciousness. Anesthesiology 102, 447-471.
Kesselheim, A.S., Cresswell, K., Phansalkar, S., Bates, D.W., Sheikh, A., 2011. Clinical decision
support systems could be modified to reduce 'alert fatigue' while still minimizing the risk
of litigation. Health affairs 30, 2310-2317.
Kheterpal, S., Gupta, R., Blum, J.M., Tremper, K.K., O'Reilly, M., Kazanjian, P.E., 2007.
Electronic reminders improve procedure documentation compliance and professional fee
reimbursement. Anesthesia and analgesia 104, 592-597.
Klopman, M.A., Sebel, P.S., 2011. Cost-effectiveness of bispectral index monitoring. Current
opinion in anaesthesiology 24, 177-181.
Koblin, D.D., Dong, D.E., Eger, E.I., 2nd, 1979. Tolerance of mice to nitrous oxide. The Journal
of pharmacology and experimental therapeutics 211, 317-325.
Kooij, F.O., Klok, T., Hollmann, M.W., Kal, J.E., 2008. Decision support increases guideline
adherence for prescribing postoperative nausea and vomiting prophylaxis. Anesthesia and
analgesia 106, 893-898, table of contents.
Kucher, N., Koo, S., Quiroz, R., Cooper, J.M., Paterno, M.D., Soukonnikov, B., Goldhaber, S.Z.,
2005. Electronic alerts to prevent venous thromboembolism among hospitalized patients.
The New England journal of medicine 352, 969-977.
Lee, E.K., Mejia, A.F., Senior, T., Jose, J., 2010. Improving Patient Safety through Medical
Alert Management: An Automated Decision Tool to Reduce Alert Fatigue. AMIA ...
188
Annual Symposium proceedings / AMIA Symposium. AMIA Symposium 2010, 417-
421.
Lee, U., Ku, S., Noh, G., Baek, S., Choi, B., Mashour, G.A., 2013. Disruption of frontal-parietal
communication by ketamine, propofol, and sevoflurane. Anesthesiology 118, 1264-1275.
Lee, U., Mashour, G.A., Kim, S., Noh, G.J., Choi, B.M., 2009. Propofol induction reduces the
capacity for neural information integration: implications for the mechanism of
consciousness and general anesthesia. Consciousness and cognition 18, 56-64.
Leslie, K., Chan, M.T., Myles, P.S., Forbes, A., McCulloch, T.J., 2010. Posttraumatic stress
disorder in aware patients from the B-aware trial. Anesthesia and analgesia 110, 823-828.
Liem, E.B., Lin, C.M., Suleman, M.I., Doufas, A.G., Gregg, R.G., Veauthier, J.M., Loyd, G.,
Sessler, D.I., 2004. Anesthetic requirement is increased in redheads. Anesthesiology 101,
279-283.
Liu, J., Singh, H., White, P.F., 1997. Electroencephalographic bispectral index correlates with
intraoperative recall and depth of propofol-induced sedation. Anesthesia and analgesia
84, 185-189.
Liu, S.S., 2004. Effects of Bispectral Index monitoring on ambulatory anesthesia: a meta-
analysis of randomized controlled trials and a cost analysis. Anesthesiology 101, 311-
315.
Long, C.W., Shah, N.K., Loughlin, C., Spydell, J., Bedford, R.F., 1989. A comparison of EEG
determinants of near-awakening from isoflurane and fentanyl anesthesia. Spectral edge,
median power frequency, and delta ratio. Anesthesia and analgesia 69, 169-173.
Mapleson, W.W., 1996. Effect of age on MAC in humans: a meta-analysis. British journal of
anaesthesia 76, 179-185.

189
Mashour, G.A., 2004. Consciousness unbound: toward a paradigm of general anesthesia.
Anesthesiology 100, 428-433.
Mashour, G.A., 2006. Monitoring consciousness: EEG-based measures of anesthetic depth.
Seminars in Anesthesia, Perioperative Medicine and Pain 25, 205-210.
Mashour, G.A., 2013. Cognitive unbinding: a neuroscientific paradigm of general anesthesia and
related states of unconsciousness. Neuroscience and biobehavioral reviews 37, 2751-
2759.
Mashour, G.A., Esaki, R.K., Tremper, K.K., Glick, D.B., O'Connor, M., Avidan, M.S., 2010. A
novel classification instrument for intraoperative awareness events. Anesthesia and
analgesia 110, 813-815.
Mashour, G.A., Esaki, R.K., Vandervest, J.C., Shanks, A., Kheterpal, S., 2009a. A novel
electronic algorithm for detecting potentially insufficient anesthesia: implications for the
prevention of intraoperative awareness. Journal of clinical monitoring and computing 23,
273-277.
Mashour, G.A., Kent, C., Picton, P., Ramachandran, S.K., Tremper, K.K., Turner, C.R., Shanks,
A., Avidan, M.S., 2013. Assessment of intraoperative awareness with explicit recall: a
comparison of 2 methods. Anesthesia and analgesia 116, 889-891.
Mashour, G.A., Shanks, A., Tremper, K.K., Kheterpal, S., Turner, C.R., Ramachandran, S.K.,
Picton, P., Schueller, C., Morris, M., Vandervest, J.C., Lin, N., Avidan, M.S., 2012.
Prevention of intraoperative awareness with explicit recall in an unselected surgical
population: a randomized comparative effectiveness trial. Anesthesiology 117, 717-725.
Mashour, G.A., Tremper, K.K., Avidan, M.S., 2009b. Protocol for the "Michigan Awareness
Control Study": A prospective, randomized, controlled trial comparing electronic alerts
190
based on bispectral index monitoring or minimum alveolar concentration for the
prevention of intraoperative awareness. BMC anesthesiology 9, 7.
Mashour, G.A., Wang, L.Y., Turner, C.R., Vandervest, J.C., Shanks, A., Tremper, K.K., 2009c.
A retrospective study of intraoperative awareness with methodological implications.
Anesthesia and analgesia 108, 521-526.
McQuay, H., Weir, L., Porter, B., O'Sullivan, G., Paterson, G., Moore, A., Bullingham, R., 1982.
A model for comparison of local anesthetics in man. Anesthesia and analgesia 61, 418-
422.
Messner, M., Beese, U., Romstock, J., Dinkel, M., Tschaikowsky, K., 2003. The bispectral index
declines during neuromuscular block in fully awake persons. Anesthesia and analgesia
97, 488-491, table of contents.
Moerman, N., Bonke, B., Oosting, J., 1993. Awareness and recall during general anesthesia.
Facts and feelings. Anesthesiology 79, 454-464.
Myles, P.S., Leslie, K., McNeil, J., Forbes, A., Chan, M.T., 2004. Bispectral index monitoring to
prevent awareness during anaesthesia: the B-Aware randomised controlled trial. Lancet
363, 1757-1763.
Myles, P.S., Williams, D.L., Hendrata, M., Anderson, H., Weeks, A.M., 2000. Patient
satisfaction after anaesthesia and surgery: results of a prospective survey of 10,811
patients. British journal of anaesthesia 84, 6-10.
Newcombe, R.G., 1998. Two-sided confidence intervals for the single proportion: comparison of
seven methods. Statistics in medicine 17, 857-872.
Nickalls, R.W., Mahajan, R.P., 2010. Awareness and anaesthesia: think dose, think data. British
journal of anaesthesia 104, 1-2.
191
Nickalls, R.W., Mapleson, W.W., 2003. Age-related iso-MAC charts for isoflurane, sevoflurane
and desflurane in man. British journal of anaesthesia 91, 170-174.
O'Reilly, M., Talsma, A., VanRiper, S., Kheterpal, S., Burney, R., 2006. An anesthesia
information system designed to provide physician-specific feedback improves timely
administration of prophylactic antibiotics. Anesthesia and analgesia 103, 908-912.
Olejniczak, P., 2006. Neurophysiologic basis of EEG. Journal of clinical neurophysiology :
official publication of the American Electroencephalographic Society 23, 186-189.
Osterman, J.E., Hopper, J., Heran, W.J., Keane, T.M., van der Kolk, B.A., 2001. Awareness
under anesthesia and the development of posttraumatic stress disorder. Gen Hosp
Psychiatry 23, 198-204.
Pandit, J.J., Andrade, J., Bogod, D.G., Hitchman, J.M., Jonker, W.R., Lucas, N., Mackay, J.H.,
Nimmo, A.F., O'Connor, K., O'Sullivan, E.P., Paul, R.G., Palmer, J.H., Plaat, F.,
Radcliffe, J.J., Sury, M.R., Torevell, H.E., Wang, M., Hainsworth, J., Cook, T.M., Royal
College of, A., Association of Anaesthetists of Great, B., Ireland, 2014. 5th National
Audit Project (NAP5) on accidental awareness during general anaesthesia: summary of
main findings and risk factors. British journal of anaesthesia 113, 549-559.
Pollard, R.J., Coyle, J.P., Gilbert, R.L., Beck, J.E., 2007. Intraoperative awareness in a regional
medical system: a review of 3 years' data. Anesthesiology 106, 269-274.
Punjasawadwong, Y., Boonjeungmonkol, N., Phongchiewboon, A., 2007. Bispectral index for
improving anaesthetic delivery and postoperative recovery. The Cochrane database of
systematic reviews, CD003843.
Purdon, P.L., Pierce, E.T., Mukamel, E.A., Prerau, M.J., Walsh, J.L., Wong, K.F., Salazar-
Gomez, A.F., Harrell, P.G., Sampson, A.L., Cimenser, A., Ching, S., Kopell, N.J.,
192
Tavares-Stoeckel, C., Habeeb, K., Merhar, R., Brown, E.N., 2013. Electroencephalogram
signatures of loss and recovery of consciousness from propofol. Proceedings of the
National Academy of Sciences of the United States of America 110, E1142-1151.
Puri, G.D., 2001. Paradoxical changes in bispectral index during nitrous oxide administration.
British journal of anaesthesia 86, 141-142.
Quasha, A.L., Eger, E.I., 2nd, Tinker, J.H., 1980. Determination and applications of MAC.
Anesthesiology 53, 315-334.
Rampil, I.J., 1998. A primer for EEG signal processing in anesthesia. Anesthesiology 89, 980-
1002.
Rampil, I.J., Kim, J.S., Lenhardt, R., Negishi, C., Sessler, D.I., 1998. Bispectral EEG index
during nitrous oxide administration. Anesthesiology 89, 671-677.
Ramsay, D.S., Brown, A.C., Woods, S.C., 1992. Acute tolerance to nitrous oxide in humans.
Pain 51, 367-373.
Ranta, S., Jussila, J., Hynynen, M., 1996. Recall of awareness during cardiac anaesthesia:
influence of feedback information to the anaesthesiologist. Acta anaesthesiologica
Scandinavica 40, 554-560.
Ranta, S.O., Laurila, R., Saario, J., Ali-Melkkila, T., Hynynen, M., 1998. Awareness with recall
during general anesthesia: incidence and risk factors. Anesthesia and analgesia 86, 1084-
1089.
Rosow, C., Manberg, P.J., 2001. Bispectral index monitoring. Anesthesiol Clin North America
19, 947-966, xi.
Rundshagen, I., Schroder, T., Prichep, L.S., John, E.R., Kox, W.J., 2004. Changes in cortical
electrical activity during induction of anaesthesia with thiopental/fentanyl and tracheal

193
intubation: a quantitative electroencephalographic analysis. British journal of anaesthesia
92, 33-38.
Sakai, T., Singh, H., Mi, W.D., Kudo, T., Matsuki, A., 1999. The effect of ketamine on clinical
endpoints of hypnosis and EEG variables during propofol infusion. Acta
anaesthesiologica Scandinavica 43, 212-216.
Samuelsson, P., Brudin, L., Sandin, R.H., 2008. Intraoperative dreams reported after general
anaesthesia are not early interpretations of delayed awareness. Acta anaesthesiologica
Scandinavica 52, 805-809.
Sandin, R.H., Enlund, G., Samuelsson, P., Lennmarken, C., 2000. Awareness during anaesthesia:
a prospective case study. Lancet 355, 707-711.
Sarkela, M., Mustola, S., Seppanen, T., Koskinen, M., Lepola, P., Suominen, K., Juvonen, T.,
Tolvanen-Laakso, H., Jantti, V., 2002. Automatic analysis and monitoring of burst
suppression in anesthesia. Journal of clinical monitoring and computing 17, 125-134.
Satas, S., Haaland, K., Thoresen, M., Steen, P.A., 1996. MAC for halothane and isoflurane
during normothermia and hypothermia in the newborn piglet. Acta anaesthesiologica
Scandinavica 40, 452-456.
Schneider, G., Jordan, D., Schwarz, G., Bischoff, P., Kalkman, C.J., Kuppe, H., Rundshagen, I.,
Omerovic, A., Kreuzer, M., Stockmanns, G., Kochs, E.F., European Multicenter,
E.A.M.S.G., Research Group Knowledge-based Signal, P., 2014. Monitoring depth of
anesthesia utilizing a combination of electroencephalographic and standard measures.
Anesthesiology 120, 819-828.
194
Schnider, T.W., Luginbuhl, M., Petersen-Felix, S., Mathis, J., 1998. Unreasonably low bispectral
index values in a volunteer with genetically determined low-voltage
electroencephalographic signal. Anesthesiology 89, 1607-1608.
Schulz, K.F., Altman, D.G., Moher, D., Group, C., 2010. CONSORT 2010 statement: updated
guidelines for reporting parallel group randomised trials. Bmj 340, c332.
Schwender, D., Kunze-Kronawitter, H., Dietrich, P., Klasing, S., Forst, H., Madler, C., 1998.
Conscious awareness during general anaesthesia: patients' perceptions, emotions,
cognition and reactions. British journal of anaesthesia 80, 133-139.
Schwilden, H., 2006. Concepts of EEG processing: from power spectrum to bispectrum, fractals,
entropies and all that. Best practice & research. Clinical anaesthesiology 20, 31-48.
Sebel, P.S., Bowdle, T.A., Ghoneim, M.M., Rampil, I.J., Padilla, R.E., Gan, T.J., Domino, K.B.,
2004. The incidence of awareness during anesthesia: a multicenter United States study.
Anesthesia and analgesia 99, 833-839.
Sebel, P.S., Bowles, S.M., Saini, V., Chamoun, N., 1995. EEG bispectrum predicts movement
during thiopental/isoflurane anesthesia. J Clin Monit 11, 83-91.
Shafer, A., White, P.F., Schuttler, J., Rosenthal, M.H., 1983. Use of a fentanyl infusion in the
intensive care unit: tolerance to its anesthetic effects? Anesthesiology 59, 245-248.
Shanks, A.M., Avidan, M.S., Kheterpal, S., Tremper, K.K., Vandervest, J.C., Cavanaugh, J.M.,
Mashour, G.A., 2014. Alerting thresholds for the prevention of intraoperative awareness
with explicit recall: A secondary analysis of the Michigan Awareness Control Study.
European journal of anaesthesiology.
Sigl, J.C., Chamoun, N.G., 1994. An introduction to bispectral analysis for the
electroencephalogram. J Clin Monit 10, 392-404.
195
Sloan, T.B., 2006. Electrophysiological monitoring, in: Hemmings, H.C., Hopkins, P.M. (Ed.),
Foundation of Anesthesia: Basic Sciences for Clinical Practice, 2 ed. Elsevier Mosby, pp.
163-172.
Smith, C., McEwan, A.I., Jhaveri, R., Wilkinson, M., Goodman, D., Smith, L.R., Canada, A.T.,
Glass, P.S., 1994. The interaction of fentanyl on the Cp50 of propofol for loss of
consciousness and skin incision. Anesthesiology 81, 820-828; discussion 826A.
Smith, R.A., Winter, P.M., Smith, M., Eger, E.I., 2nd, 1979. Rapidly developing tolerance to
acute exposures to anesthetic agents. Anesthesiology 50, 496-500.
Song, D., Joshi, G.P., White, P.F., 1997. Titration of volatile anesthetics using bispectral index
facilitates recovery after ambulatory anesthesia. Anesthesiology 87, 842-848.
St Jacques, P., Sanders, N., Patel, N., Talbot, T.R., Deshpande, J.K., Higgins, M., 2005.
Improving timely surgical antibiotic prophylaxis redosing administration using
computerized record prompts. Surgical infections 6, 215-221.
Takita, A., Masui, K., Kazama, T., 2007. On-line monitoring of end-tidal propofol concentration
in anesthetized patients. Anesthesiology 106, 659-664.
Tammisto, T., Takki, S., 1973. Nitrous oxide-oxygen-relaxant anaesthesia in alcoholics: a
retrospective study. Acta Anaesthesiol Scand Suppl 53, 68-75.
Teplan, M., 2002. Fundamentals of EEG Measurement. Measurement Science Review 2, 1-11.
Tonner, P.H., Bein, B., 2006. Classic electroencephalographic parameters: median frequency,
spectral edge frequency etc. Best practice & research. Clinical anaesthesiology 20, 147-
159.
Tonner, P.H., Scholz, J., 2006. The sinking brain: how to measure consciousness in anaesthesia.
Best practice & research. Clinical anaesthesiology 20, 1-9.
196
Umesh, G., Jasvinder, K., Shetty, N., 2009. Low minimum alveolar concentration alarm: a
standard for prevention of awareness during general anaesthesia maintained by
inhalational anaesthetics. Journal of clinical monitoring and computing 23, 185-186.
Voss, L., Sleigh, J., 2007. Monitoring consciousness: the current status of EEG-based depth of
anaesthesia monitors. Best practice & research. Clinical anaesthesiology 21, 313-325.
Walczak, T.S., Chokroverty, S., 2009. Electroencephalography, Electromyography, and Electro-
Oculography: General Principles and Basic Technology, in: Chokroverty, S. (Ed.), Sleep
Disorders Medicine: Basic Science, Technical Considerations, and Clinical Aspects, 3 ed.
Saunders Elsevier, Philadelphia, PA, pp. 157-181.
Watson, P.L., Shintani, A.K., Tyson, R., Pandharipande, P.P., Pun, B.T., Ely, E.W., 2008.
Presence of electroencephalogram burst suppression in sedated, critically ill patients is
associated with increased mortality. Critical care medicine 36, 3171-3177.
Wax, D.B., Beilin, Y., Levin, M., Chadha, N., Krol, M., Reich, D.L., 2007. The effect of an
interactive visual reminder in an anesthesia information management system on
timeliness of prophylactic antibiotic administration. Anesthesia and analgesia 104, 1462-
1466, table of contents.
Weiser, T.G., Regenbogen, S.E., Thompson, K.D., Haynes, A.B., Lipsitz, S.R., Berry, W.R.,
Gawande, A.A., 2008. An estimation of the global volume of surgery: a modelling
strategy based on available data. Lancet 372, 139-144.
Whitlock, E.L., Rodebaugh, T.L., Hassett, A.L., Shanks, A.M., Kolarik, E., Houghtby, J., West,
H.M., Burnside, B.A., Shumaker, E., Villafranca, A., Edwards, W.A., Levinson, C.A.,
Langer, J.K., Fernandez, K.C., El-Gabalawy, R., Zhou, E.Y., Sareen, J., Jacobsohn, E.,
Mashour, G.A., Avidan, M.S., 2014. Psychological Sequelae of Surgery in a Prospective

197
Cohort of Patients from Three Intraoperative Awareness Prevention Trials. Anesthesia
and analgesia.
Xu, L., Wu, A.S., Yue, Y., 2009. The incidence of intra-operative awareness during general
anesthesia in China: a multi-center observational study. Acta anaesthesiologica
Scandinavica 53, 873-882.
Yli-Hankala, A., Vakkuri, A., Annila, P., Korttila, K., 1999. EEG bispectral index monitoring in
sevoflurane or propofol anaesthesia: analysis of direct costs and immediate recovery.
Acta anaesthesiologica Scandinavica 43, 545-549.
Zhang, C., Xu, L., Ma, Y.Q., Sun, Y.X., Li, Y.H., Zhang, L., Feng, C.S., Luo, B., Zhao, Z.L.,
Guo, J.R., Jin, Y.J., Wu, G., Yuan, W., Yuan, Z.G., Yue, Y., 2011. Bispectral index
monitoring prevent awareness during total intravenous anesthesia: a prospective,
randomized, double-blinded, multi-center controlled trial. Chinese medical journal 124,
3664-3669.

198
ABSTRACT
NOVEL INCORPORATION OF BIOMEDICAL ENGINEERING ALGORITHMS (BISPECTRAL INDEX GUIDED OR ANESTHETIC
CONCENTRATION GUIDED) IN REAL-TIME DECISION SUPPORT TO PREVENT INTRAOPERATIVE AWARENESS USING AN ELECTRONIC
ANESTHESIA INFORMATION MANAGEMENT SYSTEM by
AMY MELANIE SHANKS
May 2015
Advisors: Drs. John M. Cavanaugh and George A. Mashour
Major: Biomedical Engineering
Degree: Doctor of Philosophy
Background: Intraoperative awareness with explicit recall (AWR) is a feared
complication of surgery that can lead to significant psychological distress. Several large
prospective trials have been completed comparing two methods of monitoring anesthetic depth
[minimum alveolar concentration (MAC) or electroencephalography (EEG) monitoring using the
bispectral index (BIS)] for the prevention of AWR. However, these trials were conducted in
high risk populations, limiting generalizability.
Research Hypothesis: Real-time decision support with Anesthesia Information
Management System alerts based on a novel anesthetic concentration algorithm (incorporating
the use of intravenous anesthetics) or an EEG-guided algorithm will reduce the known incidence
of AWR.

199
Methods: First, a MAC-equivalent alerting algorithm that incorporates the use of
intravenous anesthetics was developed and retrospectively applied to previously collected data.
A threshold was calculated that demonstrated optimal sensitivity and specificity for detecting
AWR. Next, a large prospective randomized controlled trial was performed in an unselected
surgical population to compare the MAC-equivalent or a BIS alerting algorithm for the
prevention of AWR. Finally, discrete intraoperative data collected during that trial were
analyzed to determine which specific threshold for MAC or BIS demonstrated optimal sensitivity
and specificity in the eradication of AWR.
Results: Retrospective analysis revealed that a MAC-equivalent of <0.5 was associated
with the highest positive likelihood ratio; this was used as the threshold in the prospective trial.
No difference was detected between BIS or MAC-equivalent alerting algorithms in the reduction
of AWR. Post hoc analysis revealed that BIS, when compared to routine clinical care without
alerts, demonstrated a 4.7 fold reduction in definite or possible AWR. By secondary analysis,
neither MAC nor BIS demonstrated a discrete population-based threshold with optimal
sensitivity and specificity in the prevention of AWR.
Conclusion: No difference was detected in the reduction of AWR between BIS or MAC
alerting. However, BIS alerting when compared to standard of care reduced the incidence of
AWR. There were no discriminating thresholds of MAC or BIS values at the population level
associated with the eradication of AWR. In conclusion, real-time decision support reduces the
incidence of AWR but individualized patient-based alerting algorithms will be required for its
eradication. .

200
AUTOBIOGRAPHICAL STATEMENT
Amy received her Bachelors of Science in Physiology from Michigan State University in
May 1999. Several months later, her professional career started at the University of Michigan
Health System (UMHS) in the Department of Anesthesiology as a clinical research assistant.
During her pursuit of her doctorate degree, Amy has continuously worked full-time at UMHS.
She completed her Master’s Degree in Biomedical Engineering at Wayne State University from
2001-2003. Amy started her doctoral work in the Fall of 2004 in Biomedical Engineering at
Wayne State University and has actively pursued completion while continuing to grow her career
at UMHS.
During her tenure at UMHS, Amy has transitioned from clinical research assistant, to
clinical research manager, before moving onto becoming an integral team member that
developed and executed the clinical outcomes research infrastructure using UMHS’ Anesthesia
Information System (AIMS). The Department of Anesthesiology is recognized globally for their
perioperative outcomes research using AIMS data and over the past several years has developed
the Multicenter Perioperative Outcomes Group (MPOG). Amy currently serves as the Research
Director of MPOG under the direction of Drs. Sachin Kheterpal and Kevin K. Tremper. She also
serves as the lead of the Statistics Core in the Department of Anesthesiology and has been an
author on 53 peer-reviewed articles.