nouvelle présentation powerpoint - expert in lng · supply - operationnal supply - under...
TRANSCRIPT

Investor Presentation
January 11-12, 2018

2
This document is strictly confidential. Any unauthorised access to, appropriation of, copying,
modification, use or disclosure thereof, in whole or in part, by any means, for any purpose,
infringes GTT’s rights. This document is part of GTT’s proprietary know-how and may contain
trade secrets protected worldwide by TRIPS and EU Directives against their unlawful
acquisition, use and disclosure. It is also protected by Copyright law. The production, offering
or placing on the market of, the importation, export or storage of goods or services using GTT’s
trade secrets or know-how is subject to GTT’s prior written consent. Any violation of these
obligations may give rise to civil or criminal liability. © GTT, 2010-2018
Disclaimer

3
Disclaimer
This presentation does not contain or constitute an offer of securities for sale or an invitation or inducement to invest in securities in France, the
United States or any other jurisdiction.
It includes only summary information and does not purport to be comprehensive. No representation, warranty or undertaking, express or implied, is
made as to, and no reliance should be placed on, the accuracy, completeness or correctness of the information or opinions contained in this
presentation. None of GTT or any of its affiliates, directors, officers and employees shall bear any liability (in negligence or otherwise) for any loss
arising from any use of this presentation or its contents.
The market data and certain industry forecasts included in this presentation were obtained from internal surveys, estimates, reports and studies,
where appropriate, as well as external market research, including Poten & Partners, Wood Mackenzie and Clarkson Research Services Limited,
publicly available information and industry publications. GTT, its affiliates, shareholders, directors, officers, advisors and employees have not
independently verified the accuracy of any such market data and industry forecasts and make no representations or warranties in relation thereto.
Such data and forecasts are included herein for information purposes only. Where referenced, as regards the information and data contained in this
presentation provided by Clarksons Research and taken from Clarksons Research’s database and other sources, Clarksons Research has advised
that: (i) some information in the databases is derived from estimates or subjective judgments; (ii) the information in the databases of other maritime
data collection agencies may differ from the information in Clarksons Research database; (iii) while Clarksons Research has taken reasonable care
in the compilation of the statistical and graphical information and believes it to be accurate and correct, data compilation is subject to limited audit
and validation procedures.
Any forward-looking statements contained herein are based on current GTT’s expectations, beliefs, objectives, assumptions and projections
regarding present and future business strategies and the distribution environment in which GTT operates, and any other matters that are not
historical fact. Forward-looking statements are not guarantees of future performances and are subject to various risks, uncertainties and other
factors, many of which are difficult to predict and generally beyond the control of GTT and its shareholders. Actual results, performance or
achievements, or industry results or other events, could materially differ from those expressed in, or implied or projected by, these forward-looking
statements. For a detailed description of these risks and uncertainties, please refer to the section “Risk Factors” of the Document de Référence
(“Registration Document”) registered by GTT with the Autorité des Marchés Financiers (“AMF”) under No. R.17-030 on April 27, 2017 and the half-
yearly financial report released on July 20, 2017, which are available on the AMF’s website at www.amf-france.org and on GTT’s website at
www.gtt.fr.
The forward-looking statements contained in this presentation are made as at the date of this presentation, unless another time is specified in
relation to them. GTT disclaims any intent or obligation to update any forward-looking statements contained in this presentation.

4
GTT, a French engineering company, global leader in liquefied gas containment systems
Key figures
Profile
Leading engineering company
Expert in liquefied gas containment
systems
More than 50-year track record
Activities
Designs and licenses membrane
technologies for containment of
liquefied gas during shipping or
onshore and offshore storage
Provides design studies, construction
assistance and innovative services
in € million H1 2016 H1 2017
Total Revenues 116.9 111.3
Royalties
Services
111.1
5.8
103.4
7.9
Net Income 60.5 61.2
Net margin (%) 51.8% 55.0%
As at June 2017
344 employees(1)
(1) Excluding interns

5
Key Highlights
Revenues for the first nine months 2017: €168.5 million
Movements in the order book during the first nine months 2017
Deliveries: 24 (21 LNGC/VLEC, 2 FSRU, 1 FLNG)
Among deliveries, the Prelude FLNG and the first icebreaking LNGC
New orders: 14 (8 LNGC, 5 FSRU, 1 FLNG)
Order book of 86 units as at Sept 30, 2017
70 LNGC(1), 11 FSRU/RV(1), 2 FLNG, 2 Onshore storage
and 1 LNG bunker barge
Q4 new orders
3 new FSRU orders and 4 new LNGC orders
Order from HZ and CMA-CGM to design the LNG fuel tanks for 9 container ships
New service offering
Global service agreement with Teekay (Q1) and Chevron (Q4)
Services contract for Shell Prelude FLNG (Q4)
Acquisition of Ascenz (Q4)
(1) Including a LNGC order conversion into a FSRU order
Notes: LNGC – Liquefied Natural Gas Carrier, VLEC – Very Large Ethane Carrier, FSRU – Floating Storage and Regasification Unit, RV – Regasification Vessel, FLNG – Floating Liquefied Natural
Gas

6
Market update (November 2017)

7
-
50
100
150
200
250
300
350
400
450
2018 2019 2020 2021 2022 2023 2024 2025 2026 2027
mtp
a
Supply - Operationnal Supply - Under Construction Demand
LNG Supply & Demand could balance from 2021
Sources: Wood Mackenzie ; GTT Analysis
No demand adjustment
S&D balance in early 2023
New FIDs from early 2019
Demand adjustment due to low prices
and FSRUs availability
S&D balance in 2021
New FIDs from 2017
Intermediate
scenario
LNG Supply & Demand balance forecast

8
Important new LNG volumes to hit the market in 2019 and 2020
0
10
20
30
40
50
60
70
80
90
2017 2018 2019 2020 2021 2022 2023
mtp
a
Cameroon GoFLNG
PETRONAS FLNG 2
Elba Island LNG Export
Coral FLNG
Prelude FLNG
Tangguh Phase 2
Freeport Train 3
Freeport Train 2
Sabine Pass Export Train 5
Cove Point Export
Freeport Train 1
Ichthys
Corpus Christi LNG
Cameron LNG Export
Yamal LNG
Contracted supply from liquefaction projects under construction
Main sources: GTT analysis, Wood Mackenzie
+12
mtpa
+31
mtpa
+25
mtpa
~ +70 Mtpa of contracted supply to come on stream by 2020
New ship orders to be placed from early 2018 to be delivered in late 2019 / early 2020

9
2%
18%
43%
31%
15%
0%
10%
20%
30%
40%
50%
0
20
40
60
80
100
120
140
160
Japan S. Korea China India TOTAL
gro
wth
mtp
a
Jan-16 to Sept-16 Jan-17 to Sept-17 Growth YoY (rhs)
Asian LNG imports growing in 2017 vs. 2016 due to structural energy mix evolution
Main sources : National Custody Agencies and Ministries ; Wood Mackenzie
Demand of top-4 LNG importing
countries (60% of imports in 2016)
grew by 15% in 2017 vs. 2016 (Jan
to Sept. YoY), mainly due to:
Coal to Gas switch, especially in
China due to environmental
considerations and LNG
competitiveness vs. coal
Lower nuclear restart, especially in
Japan due to social and legal issues
Coal progressive slowdown in
China and South Korea expected
to strengthen in the mid/long term
Top-4 LNG importers demand comparison 2017 vs. 2016

10
5,5
6,0
6,5
7,0
7,5
8,0
8,5
9,0
9,5
10,0
40 45 50 55 60 65
LN
G p
rice -
$/M
btu
Oil price - $/b
US LNG is competitive in Asia
US
LN
G
Asian LNG
2017 avg.
Asian LNG < US LNG US LNG < Asian LNG
Asian LNG < US LNG
US LNG vs. Asian LNG price depending on Henry Hub and Oil prices
2017 avg. : JCC = 53,3$/b and Henry Hub = 3,0$/Mbtu
US LNG ≈ 7.1$/Mbtu
Asian LNG ≈ 8.0$/Mbtu
US LNG:
• HH+15%
• Tolling Fee: 2.25$
• Shipping: 1.43$ (US East ->Japan, 174k
cbm Me-GI or X-DF)
Hypothesis
Asian LNG:
• Slope: 14% of JCC price
• Constant: 0.5$
Main sources: GTT analysis, EIA, Wood Mackenzie
Sp
read
2016 avg.
11
Break even
0
20 000
40 000
60 000
80 000
100 000
120 000
140 000
160 000D
ec 1
0
Ja
n 1
1
Feb
11
Mar
11
Apr
11
May 1
1
Ju
n 1
1
Ju
l 11
Aug
11
Sep
11
Oct 11
No
v 1
1
De
c 1
1
Ja
n 1
2
Feb
12
Mar
12
Apr
12
May 1
2
Ju
n 1
2
Ju
l 12
Aug
12
Sep
12
Oct 12
No
v 1
2
De
c 1
2
Ja
n 1
3
Feb
13
Mar
13
Apr
13
May 1
3
Ju
n 1
3
Ju
l 13
Aug
13
Sep
13
Oct 13
No
v 1
3
De
c 1
3
Ja
n 1
4
Feb
14
Mar
14
Apr
14
May 1
4
Ju
n 1
4
Ju
l 14
Aug
14
Sep
14
Oct 14
No
v 1
4
De
c 1
4
Ja
n 1
5
Feb
15
Mar
15
Apr
15
May 1
5
Ju
n 1
5
Ju
l 15
Aug
15
Sep
15
Oct 15
No
v 1
5
De
c 1
5
Ja
n 1
6
Feb
16
Mar
16
Apr
16
May 1
6
Ju
n 1
6
Ju
l 16
Aug
16
Sep
16
Oct 16
No
v 1
6
De
c 1
6
Ja
n 1
7
Feb
17
Mar
17
Apr
17
May 1
7
Ju
n 1
7
Ju
l 17
Aug
17
Sep
17
Oct 17
No
v 1
7
$/d
D/TFDE 160k cbm Steam Turbine 145k cbm
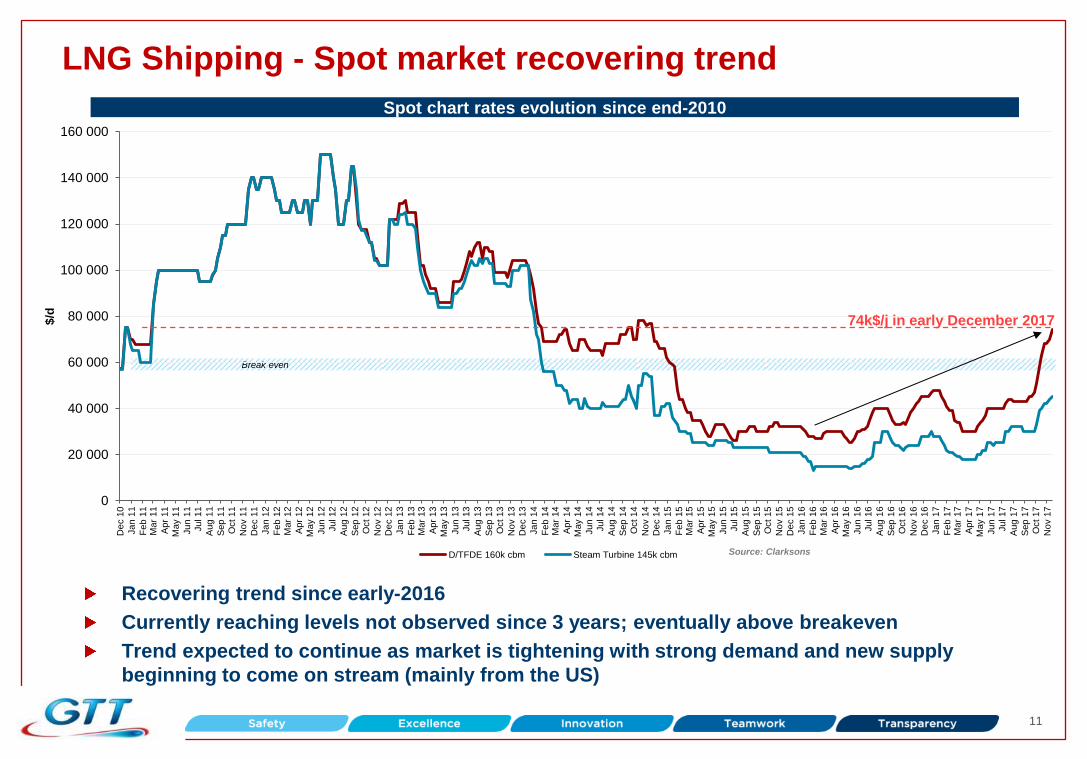
LNG Shipping - Spot market recovering trend
Spot chart rates evolution since end-2010
Recovering trend since early-2016
Currently reaching levels not observed since 3 years; eventually above breakeven
Trend expected to continue as market is tightening with strong demand and new supply
beginning to come on stream (mainly from the US)
Source: Clarksons
74k$/j in early December 2017

12
LNG Shipping: c.50 LNGC orders expected from under construction projects
Main sources : GTT analysis, Wood Mackenzie, Clarksons
Project ahead of schedule or catching-up Project behind schedule or slowing-down
Most liquefaction projects under
construction expected to start-up in
time
c.50 LNGCs to order to lift additional
volumes
Vessels to be ordered by 2018-2019
(3 years construction time)
Downside risks:
LNG contracts swapping (shorter routes)
Start-up delays and/or slow ramp-up
Wide majority of 2016 and 2017 LNGC
orders were dedicated to under
construction projects
New FIDs ahead
Fortuna FLNG (2.2 Mtpa), Sabine Pass T6,
Corpus T3, Cameron T4, Magnolia, Golden
Pass and Delphin are the near term
contenders for sanction Projects associated with 2016 – 2017 LNGCs orders
Note : All LNGCs numbers normalized to 164.4k cbm net capacity (174k gross)
LNGC requirement for under construction liquefaction projects
Project Location Forecasted
Start-Up
Total Capacity
(Mtpa)
LNGC
requirement
Wheatstone LNG T1 Australia Q3-17 4.5 4
Sabine Pass Export Phase 2 - T4 USA Q3-17 4.5 11
Yamal LNG T1 Russia Q4-17 5.5 10
Sengkang LNG Indonesia Q4-17 0.5 0
Cove Point Export USA Q4-17 5.3 6
Prelude FLNG Australia Q2-18 3.6 3
Cameroon GoFLNG Cameroon Q2-18 2.2 5
Wheatstone LNG T2 Australia Q3-18 4.5 4
Ichthys Australia Q3-18 8.9 7
Cameron LNG Export T1 USA Q3-18 5.0 12
Yamal LNG T2 Russia Q4-18 5.5 10
Cameron LNG Export T2 USA Q4-18 5.0 12
Elba Island LNG Export USA Q4-18 2.5 5
Freeport T1 USA Q4-18 5.1 13
Corpus Christi LNG T1 USA Q1/Q2-19 4.5 8
Sabine Pass Export Train 5 USA Q2-19 4.5 11
Freeport T2 USA Q2-19 5.1 14
Corpus Christi LNG T2 USA Q2-19 4.5 8
Cameron LNG Export T3 USA Q3-19 5.0 12
Yamal LNG T3 Russia Q3-19 5.5 10
Freeport T3 USA Q4-19 5.1 6
Tangguh Phase 2 Indonesia Q4-20 3.8 2
PETRONAS FLNG 2 Malaysia Q4-20 1.5 1
Coral LNG Mozambique Q1-22 3.4 6
177.3
115.3
10.3
51.7
TOTAL
- Current Orderbook
- Overcapacity (= Laid Up & Idle vessels < 30 years old)*
Expected orders
* Vessels available on the spot market
no to be considered here
13
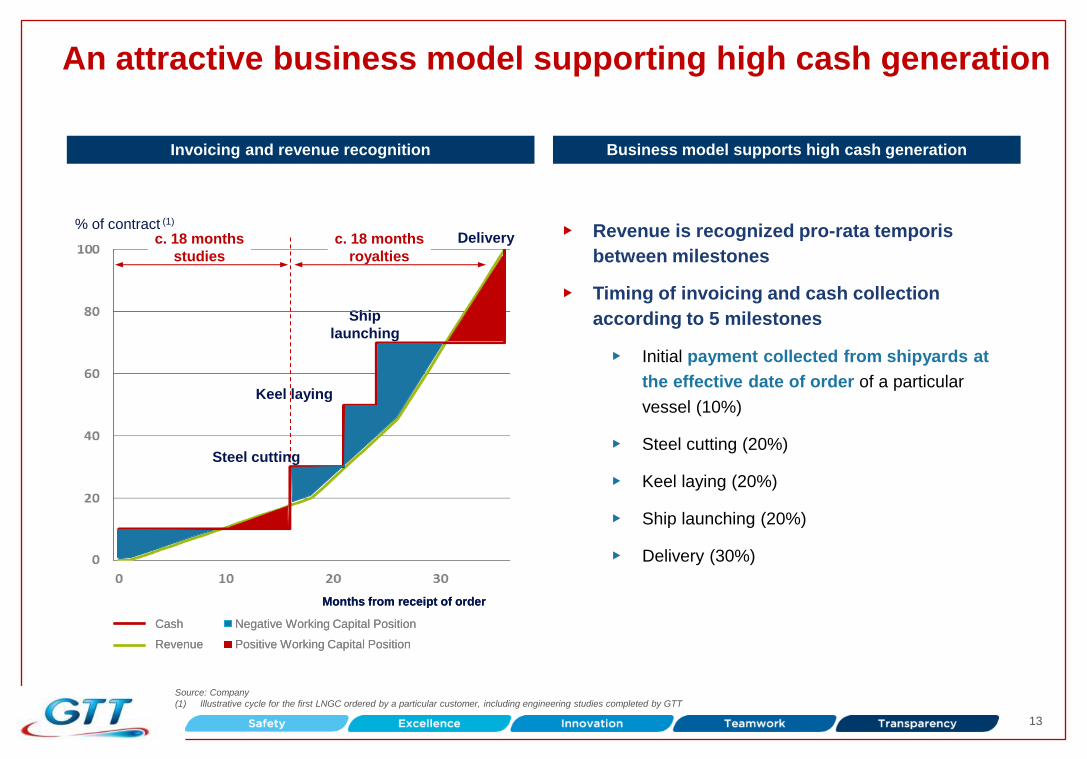
An attractive business model supporting high cash generation
Source: Company
(1) Illustrative cycle for the first LNGC ordered by a particular customer, including engineering studies completed by GTT
Invoicing and revenue recognition Business model supports high cash generation
Months from receipt of order
▶ Revenue is recognized pro-rata temporis
between milestones
▶ Timing of invoicing and cash collection
according to 5 milestones
▶ Initial payment collected from shipyards at
the effective date of order of a particular
vessel (10%)
▶ Steel cutting (20%)
▶ Keel laying (20%)
▶ Ship launching (20%)
▶ Delivery (30%)
Negative Working Capital Position
Positive Working Capital Position
Cash
Revenue
% of contract (1)
Months from receipt of order
Negative Working Capital Position
Positive Working Capital Position
Cash
Revenue
Steel cutting
Keel laying
Ship
launching
Delivery c. 18 months
studies
c. 18 months
royalties

14
Business Activity

15
Core business and adjacent markets
LNGC/VLEC82%
FSRU10%
FLNG1%
Services7%
GTT order estimates over 2017-2026 GTT Q3 2017 Sales
LNGC: between 235 and 255 units
12 orders secured during 2017
FSRU: between 30 and 40 units
8 orders secured during 2017
FLNG: between 5 and 10 units
1 order secured during 2017
Onshore tanks: between 5 and 10 units
Courtesy of Excelerate Energy Courtesy of Shell

16
Focus on GTT’s competitive advantages
Source: Company data and comment (Dec. 31, 2016)
(1) Other technologies have been developed, however are not known to have obtained final certification or orders to date. Excludes vessel orders below 30,000 m3
GTT’s technology positioning (1)
GTT Moss SPB KC-1
Technology ▶ Membrane ▶ Spherical tank ▶ Tank ▶ Membrane
Construction
costs
▶ Requires less steel and
aluminum than tanks for
a given LNG capacity
▶ Higher costs ▶ Higher costs ▶ Slightly higher costs
than GTT
Operating
costs
▶ More efficient use of
space
▶ Limited BOR (0.07%)
▶ Higher fuel / fee costs ▶ Higher fuel / fee costs ▶ Higher opex due to
BOR (0.16%)
LNGCs in
construction ▶ 82 ▶ 19 ▶ 4 ▶ 2
LNGCs in
operation ▶ 312 ▶ 109 ▶ 2 small ▶ None
Other ▶ Value added services ▶ Higher centre of gravity;
harder to navigate
▶ Japanese technology
developed 25 years ago. No
significant experience
▶ Korean technology with no
experience at sea
GTT technologies : cost effective, volume optimisation and high return of experience

17
$5.6 M
$9.1 M
$10.6 M
$11.4 M
0 M$
2 M$
4 M$
6 M$
8 M$
10 M$
12 M$
-2 bp -4 bp -6 bp -8 bp
Value of reducing BOR(1) to a charterer Performance of GTT technologies
Focus on GTT’s competitive advantages
BOR currently represents ~1/3 of LNG shipping costs (~55% being charter rate)
Reduction of BOR(1) represents significant savings for the charterer (up to $11.4M in a 10-year period)
0.15%
0.085%
0.07%
0.15%
0.115% 0.11% 0.10%
0.09%
0,00%
0,04%
0,08%
0,12%
0,16%
MarkIII
MarkFlex
Mark V NO96 NO96GW
NO96L03
NO96L03+
NO96Max
-8 bp -6 bp
10 year NPV of reduced BOR(1) for an LNGC(2)
Source: Company
(1) Boil off rate per day
(2) Assuming 174,000 m3 vessel equipped with NO96 membrane; using 6% discount rate; $7.15/Mbtu Asian gas price assumption. NPV calculated vs. a BOR of 0.15%
1992 2011 2013/16 2011/12 1994 2016
LNG Boil Off Rate (BOR)(1) of GTT systems developed since 2010
0.16%
0.12%
0.08%
0.04%
0.00%
$12 M
$10 M
$8 M
$6 M
$0 M
$2 M
$4 M

18
LNG fuel focus – CMA CGM order
LNG integrated membrane tanks of 18,600 cbm
Space optimization
Designed for one bunkering operation per round trip
Mark III Flex (270 mm) technology for the fuel storage
system
Polyurethane Foam 130 kg/m3 and 210 kg/m3
Sea proven technology
Guaranteed Boil Off Gas
Maximal pressure: 700 mbarg
Flexibility to handle and store Boil Off Gas
Positive impact on global LNG demand
LNG Consumption of 300,000 tons per year
for the 9 vessels, i.e. eq. 0.1% of LNG global production

19
Current LNG Fuel market situation
A recent market which has started with small ships and where Type C technology has been
preferred (tugs, ferries, PSV, … with LNG tanks up to several hundreds of m3)
Large vessel segment where GTT technologies is the most relevant is just emerging (container
ships, bulkers, … with several thousands of m3 and more)
0
500
1 000
1 500
2 000
2 500
3 000
3 500
4 000
Market avg ~750 cbm
Max
Min
Avg.
Total LNG
tanks capacity
Source: DNV GL
Notes:
• Data available for ~70% of the 237 vessels
• CMA-CGM order not counted in
Total LNG fuel tank by ship type (in service & on order)
cb
m
CM
A-C
GM

20
LNG is the only solution allowing comprehensive environmental compliance
Pollutant Level HFO (Heavy Fuel Oil)
LS HFO (Low Sulfur
HFO)
ULS HFO (Ultra Low Sulfur
HFO)
MGO /
MDO1
(Marine Gasoil/Diesel
Oil)
Scrubber
+HFO LNG
SOx (Sulfur Oxides)
3,5%
0,5%
0,1%
NOx2
(Nitrogen Oxides)
Tier II
Tier III +EGR/SCR3 Except for
certain
engines
No Under condition Yes Compliance
LNG is the only mature solution directly compliant with all environmental regulations
Implementation of NOx reduction in Northern Europe will degrade oil fuel’s and
Scrubber’s competitiveness
1) Only DMA and DMB class
2) Depends primarily on engine technology
3) EGR: Exhaust Gas Recirculation ; SCR: Selective Catalytic Reduction

21
LNG fuel Market potential: to be driven by newbuilds
Cruise ships
Container ships (ULCS)
Ferries
PCTC
Tugs
LPG Carriers
Bulkers (VLOC)
Oil Tankers (VLCC)
Chemical Tankers
Plateform Supply Vessels
Dredgers
General Cargo
-
5 000
10 000
15 000
20 000
0 100 200 300 400 500 600 700 800 900
Est.
maxim
um
LN
G f
uel
tan
ks c
ap
acit
y -
cb
m
Historical average annual orders (2005-2016) Source: GTT analysis, Clarksons
Shipping markets newbuild potential
• 3,000+ avg. annual orders (2005-2016)
• Fleet of 90’000+ vessels in 2017

22
GTT LNG solutions offering
GTT has developed solutions for the main applications of LNG Fuel
Solutions for Container Vessels new build
and retrofit
Lean bunker barge to standardize the
market Cost effective solution for bulk carriers
Cruise Ship – optimizing the space for
additional passengers
A wide network of partnerships is being set up to benefit
from these various opportunities
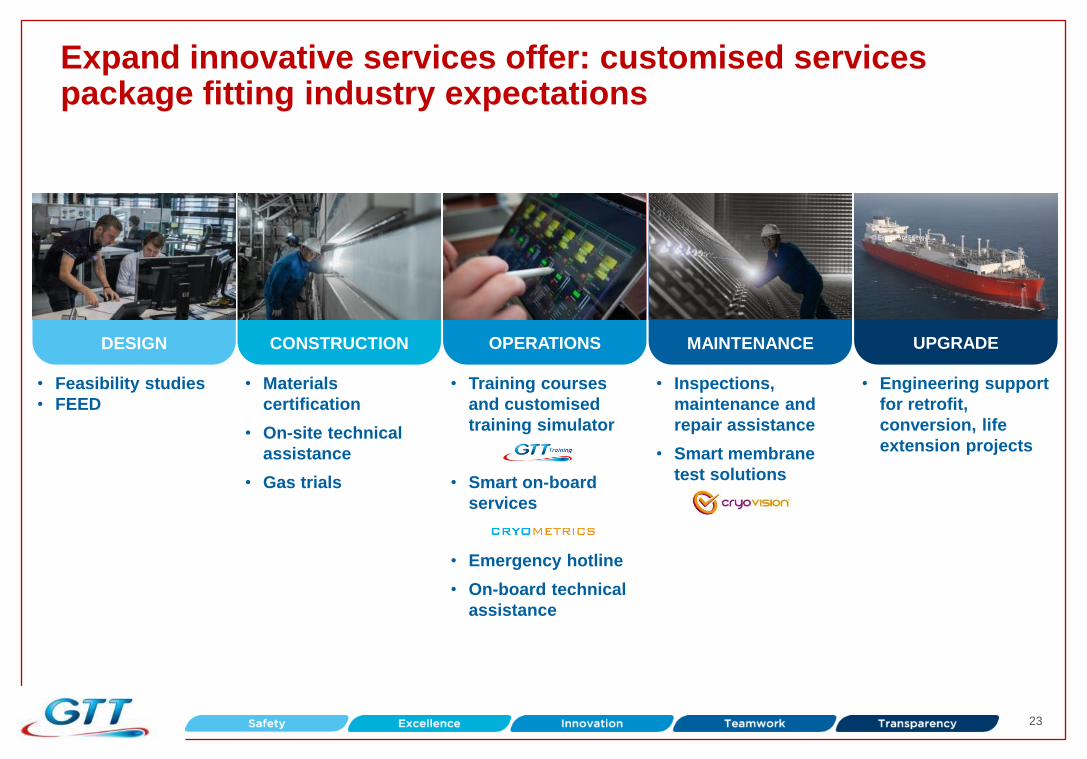
23
Expand innovative services offer: customised services package fitting industry expectations
• Training courses
and customised
training simulator
• Smart on-board
services
• Emergency hotline
• On-board technical
assistance
OPERATIONS
• Feasibility studies
• FEED
DESIGN
• Materials
certification
• On-site technical
assistance
• Gas trials
CONSTRUCTION
• Inspections,
maintenance and
repair assistance
• Smart membrane
test solutions
MAINTENANCE
• Engineering support
for retrofit,
conversion, life
extension projects
UPGRADE
© Excelerate Energy

24
Ascenz transaction
Acquisition of 75% of the share capital from founders and several
investment funds
Founders to retain 25% of the share capital and continue to
manage the company
Funded in cash
No significant impact on GTT’s financial structure
Commercial and technical synergies

25
Ascenz is a dynamic EMS provider
Activities, markets & awards
Based in Singapore, founded in 2008
Provides remote fuel consumption and bunkering
monitoring solutions
Positioned on fast growing markets
Markets : Offshore Supply Vessels (OSV),
container ships, oil and crude carriers, bulk
carriers, bunker ships and gas carriers (target) –
360+ ships equiped
Recipient of the 2016 Singapore « Enterprise 50
award » for local companies excelling in their
domain, Founders nominated as Singapore’s EY
Entrepreneurs of the year 2017
Track record in real time data acquisition for a
fleet of vessels

26
GTT’s strategic roadmap
Growth,
Technology,
Transformation Superior LNG
gas handling
systems
Advanced decision
support systems
Gas handling technologies
Fuel Gas handling system for vessels
Smart shipping
Framework service and
maintenance contract
(Shell Prelude)
Courtesy of Shell
27
Financials

28
426 426
100
300
500
As at Dec 31, 2016,on 2017-2021
As at June 30, 2017,on 2017-2021
216
160
46
4
223208
80
153
0
100
200
300
2017 2018 2019 2020 2021
As at Dec 31, 2016 As at June 30, 2017
38
32
21
4
37 35
28
8
10
20
40
2017 2018 2019 2020 2021
As at Dec 31, 2016 As at June 30, 2017
Revenues expected from current order book
Order book in units
In €M
9688
30
60
90
120
As at Dec 31, 2016 As at June 30, 2017
Order book by year of delivery (units per year)
Order book overview (H1 2017)
Order book in value
In €M
In units In units
(1) 2017 deliveries include 21 vessels delivered until June 30, 2017 / Delivery dates could move according to the shipyards/EPCs’ building timetables.
(2) Taking into account 2017 H1 revenues from royalties (€103M), the total amount would have been €529M (3) 2017 H1 revenues from royalties. (4) 2017 H1 deliveries
(1)
120
103(3)
(2)
16
21(4)

29
H1 2017 financial performance
Key highlights Summary financials
(2)
Decrease in revenues (-4.7%)
Revenues derived from royalties: -6.9%
Impacted by the low level of orders during 2016
Revenues from services: +36.4%
Strong margins
High level of margins (>50%)
Increase of 1.2% in EBITDA, EBIT and net income
Free Cash Flow
H1 Free cashflow impacted by working capital
movement linked to a seasonal effect (payment under
profit sharing scheme)
High cash position of €77 M (+ €13 M classified in
financial assets)
Interim dividend: 1.33€ per share to be paid in
September 2017
(1) Defined as EBIT + the depreciation charge on assets under IFRS
(2) Defined as EBITDA - capex - change in working capital
(3) Defined as December 31 working capital – June 30 working capital
(4) Defined as trade and other receivables + other current assets – trade and other payables – other current liabilities
In € M H1 2016 H1 2017 Change
Total Revenues 116.9 111.3 -4.7%
EBITDA(1) 73.7 74.6 +1.2%
Margin (%) 63.1% 67.0%
Operating Income 72.1 73.0 +1.2%
Margin (%) 61.7% 65.6%
Net income 60.5 61.2 +1.2%
Margin (%) 51.8% 55.0%
Free Cash Flow(2) 42.0 64.5 +53.6%
Change in Working
Capital(3) 30.5 8.8 nm
Capex 1.2 1.3 +10.0%
Dividend paid 50.4 49.3 -2.2%
in € M 31/12/2016 30/06/2017
Cash Position 73.4 77.3 +1.2%
Working Capital
Requirement(4) 18.9 27.8 +46.8%

30
Cost base
GTT operational costs Key highlights
External costs
Down 11% mainly due to a decrease in subcontracted
tests and studies and in legal fees
-1pt in % of sales
Staff costs down 2% due to a decrease in staff
count
A cost base offering a high operating leverage
GTT H1 2017 costs by nature
External costs
46%
in € M H1 2016 H1 2017 Change
(%)
Cost of sales (1.4) (0.9) -12%
% sales (1%) (1%)
Subcontracted Test
and Studies (8.7) (7.1) -18%
Rental and
Insurance (2.7) (2.7) +3%
Travel Expenditures (4.4) (4.0) -9%
Other External Costs (5.0) (4.7) -7%
Total External
Costs (20.7) (18.5) -11%
% sales (18%) (17%)
Salaries and Social
Charges (17.6) (17.1) -3%
Share-based
payments (0.5) (0.4) -12%
Profit Sharing (3.0) (3.1) +4%
Total Staff Costs (21.0) (20.6) -2%
% sales (18%) (19%)
Other (1.6) 1.8 nm
% sales (1%) 2%
Staff costs
51%
Cost of sales
2%

31
9 months 2017 revenues at €169 million
Total revenues: €168.5 million
Revenues from royalties: -6.3% at
€157.1 million
LNGC: -8.2%, impacted by the low level of orders
in 2016
FSRU: + 14.8%
FLNG: +12.7%
Revenues from services: +26.6% at €11.4
million
Mainly driven by studies and maintenance
contracts for ships in service
Summary financials Key highlights
in € M 9M 2016 9M 2017 Change
(%)
Revenues 176.7 168.5 -4.6%
Royalties 167.7 157.1 -6.3%
% of revenues 95% 93%
LNGC/VLEC 151.3 138.8 -8.2%
% of revenues 86% 82%
FSRU 14.3 16.4 +14.8%
% of revenues 8% 10%
FLNG 1.6 1.8 +12.7%
% of revenues 1% 1%
Onshore storage 0.2 0.0 ns
% of revenues 0% 0%
Barge 0.3 0.1 -67.6%
% of revenues 0% 0%
Services 9.0 11.4 +26.6%
% of revenues 5% 7%

32
Outlook

33
2017 Outlook confirmed
GTT revenue(1) 2017 revenue estimated in a range of €225 M to €240 M
Dividend
Payment(3)
2017 dividend amount at least equivalent to 2015 and 2016
2018 – 2019: payout of at least 80%
Net margin(2) Net margin above 50%
(1) In the absence of any significant delays or cancellations in orders. Variations in order intake between periods could lead to fluctuations in revenues
(2) Excluding potential acquisitions effect and at constant scope
(3) Subject to approval of Shareholders' meeting. GTT by-laws provide that dividends may be paid in cash or in shares based on each shareholder’s preference

34
Power barge
Thank you for your attention
Ice breaking
LNG carrier
Multigas carrier
LPG carrier
Bunker barge
Small scale LNG carrier at
import terminal Gravity-based system
FLNG
Onshore tank
LNG carrier
© S
TX
, E
ngie
,
Exce
lera
te
FSRU

35
Appendices

36
Appendix: a streamlined group and organisation
* Member of the executive committee
GT
T G
rou
p
Philippe Berterottière* Chairman and Chief Executive
Officer
GT
T S
A o
rga
nis
ati
on
Lélia Ghilini*
General Counsel
Julien Bec
LNG as fuel
~16 employees
Frédérique
Coeuille*
Innovation
~93 employees
David Colson*
Commercial
~24 employees
Karim Chapot*
Technical
~172 employees
Marc Haestier*
Finance &
Administration
~30 employees
Isabelle Delattre*
Human Resources
~10 employees
GTT North America GTT Training Cryovision GTT SEA PTE Ltd Cryometrics

37
Appendix: a responsible company
Social and societal responsibility
Social
Employment: recruit, retain and develop talents >>> 6.6% of turnover in 2016
Compensation: implement an attractive and evolutive system
Training: develop employability and expertise >>> 13,654 hours of training in 2016
Safety: improve preventive measures through action plans
Health: annual survey on working conditions >>> Satisfaction rate of 81% in 2016
Societal: continuous and constructive dialogue with all the LNG stakeholders
Environmental responsibility
Stakeholders
Performance of GTT systems
Safety of installations and crew
LNG training sessions for customers and partners
Hotline for shipowners
GTT
Environmental responsibility at site
A proactive sustainable development policy

38
Appendix: external growth policy
Support the mainstays of GTT strategy
A continuous approach, towards selective acquisitions
Key criteria include sector attractiveness ; business model ; differentiation through
technology ; size and profitability ; ease of integration

39
Appendix: GTT exposure to the liquefied gas shipping and storage value chain
Source: Company data
Offshore
clients:
shipyards
Onshore
clients:
EPC
contractors Onshore storage
liquefaction plant
Onshore storage re-
gasification terminal
Floating LNG Production,
Storage and Offloading
unit (FLNG)
Liquefied Natural Gas
Carrier
(LNGC)
Floating Storage and
Regasification Unit (FSRU)
LNG fuelled
ship
Gas-to-wire
Power plant
Platform /
Installation
Tank in
industrial plant
Ethane/ multigas
Carriers
Barge
Exploration
& Production Liquefaction Shipping Regasification
Off Take /
Consumption

40
Appendix: GTT ecosystem
End clients and prescribers
licences its membrane
technology and receives
royalties
provides engineering
studies, on-site technical
and maintenance assistance
receives new
technology
certification and
approval
provides services
provides services
and maintenance
Oil & Gas
Companies Shipowners
Classification
Societies
Shipyards Direct clients
End clients and prescribers
Regulatory oversight of the industry

41
Appendix - LNGCs
Vessel equipped for transporting LNG
Existing GTT fleet: 318 units(1)
In order: 73 units
21 construction shipyards under license
GTT order estimates over 2017-2026:
235-255 units(2)
80.4%
% sales(3)
H1 2017
(1) As of June 30, 2017. Excludes vessel orders below 30,000 m3.
(2) Including orders received in H1 2017.
(3) Including ethane carriers.
Our strengths
Technological leadership, boil-off divided by 2 in the last 5 years
Long term industrial partnerships with major shipyards
A unique position in the LNG ecosystem, nurtured by 50 years of experience, expertise
and customer orientation
Our core business

42
Appendix - FSRUs
Main drivers
New buyers
Competitive advantage vs. land-based
terminals
Better acceptability
Reduced construction time / availability
Flexibility / no upfront capex
Adapted to more volatile LNG prices
Stationary vessel capable of loading, storing
and re-gasifying LNG
Existing GTT fleet: 20 FSRU(1)
In order: 10 units
GTT order estimates over 2017-2026:
30-40 units(2)
The solution for emerging countries
11.5%
% sales
H1 2017
GTT key advantages
Competitive cost
Volume optimisation
High return of
experience
(1) As of June 30, 2017.
(2) Including orders received in H1 2017
Courtesy of Excelerate Energy

43
Appendix: FSRUs – The importing countries game changer is gaining momentum
Major competitive advantage vs. land-based terminals:
Quick to build/deploy & mobile
Better local acceptability & easier permitting
Affordable / no upfront CapEx
Adapted to more volatile LNG prices
Quality controlled construction in shipyards with available
and skilled workforce
-
1
2
3
4
No. of countr
ies
FSRU FSU Conventional Source: Wood Mackenzie
Since 2008, more than half of new LNG importing countries have
chosen FSRUs instead of onshore terminals
FSRUs market outlook
Source: GasLog
More than 30 FSRUs currently in
service or under construction
8 orders of FSRUs since
January 2017
11% of 2016 LNG imports
through FSRUs
Worldwide development
Asia (India, China, …)
Europe (Turkey, Croatia, …)
South & West Africa
LatAm & Carribeans

44
Appendix - FLNGs
Main drivers
Monetisation of stranded offshore gas reserves
Better acceptability (no NIMBY syndrom)
Floating unit which ensure treatment of
gas, liquefy and store it
Existing GTT fleet: 2 units(1)
In order: 2 units
GTT order estimates over 2017-2026: 5-10
units(2)
The new frontier of the LNG world
0.9%
% sales
H1 2017
GTT key advantages
Extended amortization perspectives
Deck space available for liquefaction
equipment
More affordable cost
(1) As of June 30, 2017.
(2) Including one order received in H1 2017.
Courtesy of Shell

45
Appendix: LNG as fuel & Bunkering
Fuel prices spread narrowing since 2014
favouring small-mid vessels projects
(‘000 cbm LNG tanks)
Larger vessels market (>10,000 cbm LNG
tanks) expecting better price environment to
see major investments
GTT’s solution highly suited and competitive
for this market
Space efficiency
Cost
Weight
Planning
5
10
15
20
25
June 2014 June 2015 June 2016 June 2017
$/m
mb
tu
LNG NE Asia LNG NW Europe LNG US
HFO Avg. MGO/MDO Avg.
Marine fuel prices since June 2014 (delivered onboard)
Up t
o $
13/m
mbu
$4
Main sources : GTT Analysis, Argus LNG, Bunker Index
Bunkering cost hypothesis : $2/mmbtu
Liquefaction fees for US LNG : $2.5/mmbtu
HFO and MDO avg. based on Singapore, Rotterdam and Los Angeles prices

46
Appendix: GTT membrane technologies
NO 96
Primary Invar membrane
Primary insulation
box
Secondary Invar
membrane
Inner hull
Secondary
insulation box
Invar
tongue
Coupler
Composite secondary membrane (Triplex)
Inner
hull
Metallic insert
Top bridge pad
Primary stainless steel
membrane
Corner panel
Hard wood key
Resin ropes Insulation panel
Mark III
Back Plywood
Secondary insulation layer (RPUF)
Primary insulation layer
(RPUF)
Top plywood

47
Appendix: key emerging LNGC trade routes
Increasing distance between export and import areas is supporting demand for
LNG carriers
Nigeria
United Kingdom
Qatar
China
India
Australia
Indonesia
Malaysia
Russia
United States of America
Japan
70
4
7 29
17 21
78 78
25 31
11 26
17 18
45
76
83 72
26
63
19 36
1.2
1.8
0.6
0.9
2.2
32 33
Korea
Largest producers
Largest consumers
Current key trade routes Key emerging trade routes
LNG supply (Mtpa) in 2016 and 2026
LNG demand (Mtpa) in 2016 and 2026 Other consumers
Other producers
Required LNGC per Mtpa
Source: Company

48
Appendix: Most of additional LNG production is already contracted
~90% of additional volumes is already
contracted by 2026
High enough to secure financing
Contracted vs. Uncontracted additionnal LNG production by 2026
Sources: Wood Mackenzie
Remaining production to be sold on the
spot market
87% 87% 85% 86%
88% 89% 89% 90% 90%
0%
10%
20%
30%
40%
50%
60%
70%
80%
90%
100%
0
20
40
60
80
100
120
2018 2019 2020 2021 2022 2023 2024 2025 2026
mtp
a
Contracted production Uncontracted production Contracted Share
49
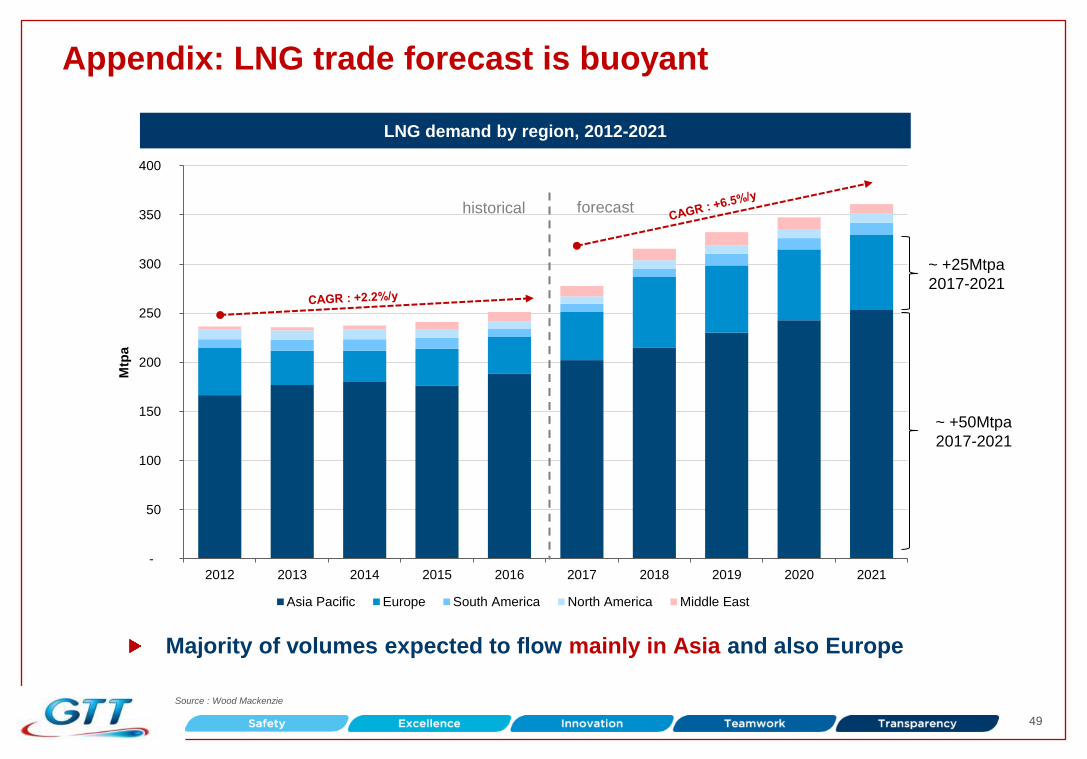
Appendix: LNG trade forecast is buoyant
Majority of volumes expected to flow mainly in Asia and also Europe
Source : Wood Mackenzie
-
50
100
150
200
250
300
350
400
2012 2013 2014 2015 2016 2017 2018 2019 2020 2021
Mtp
a
Asia Pacific Europe South America North America Middle East
LNG demand by region, 2012-2021
historical forecast
~ +25Mtpa
2017-2021
~ +50Mtpa
2017-2021

50
Evolution of new
GTT orders (1)(2)
163
222251
142
75 5689
218 227 226 236
57%
65% 64%
42%
31% 33%
44%
55%51%
52% 51%
2006 2007 2008 2009 2010 2011 2012 2013 2014 2015 2016
Revenue Net Margin
34
19
41
7
44
26
37
47
35
5
2006 2007 2008 2009 2010 2011 2012 2013 2014 2015 2016
LNGC/VLEC FSRU/FLNG Onshore storage Barge
Source: Company
(1) Orders received by period
(2) Excl. vessel conversions
(3) Represents order position as at December based on company data, including LNGC, VLEC, FLNG, FSRU and on-shore storage units
(4) Figures presented in IFRS from 2010 to 2015, French GAAP from 2006 to 2009
Evolution of
revenue (in € M)
and net margin (4)
99 120 112 66 30 18 52 77
Backlog (# of orders)
Appendix: track record of high margin and strong increase in backlog since 2010
114 118
2008
Economic crisis
US shale gas boom
2011
Fukushima
96

51
Appendix: illustrative LNGC revenue recognition summary
2016 key statistics Illustrative revenue /cash recognition
Source: Company
2%4%
38%
56%
Year 0 Year 1 Year 2 Year 3
c. 18 months
studies
c. 18 months
royalties
% of total revenues – order of 4 LNGCs placed on June 30 of year 0
Studies
collected on the
first vessel of
the order
TOTAL LNGC ORDERS
Total orders: 5
Of which first vessels: 2
PRICING
Fixed rate of €341.26/m² as
at October 2016
Indexed to French labour
cost
AVERAGE REVENUE PER LNGC
First vessel: €9.5 M
Second and subsequent
vessels: €7.6 M
