notes to consolidated financial statements | financial...
TRANSCRIPT

Notes to consolidated financial statements December31, 2017
1. Corporate Information and Basis of Presentation
Corporate InformationQIAGEN N.V. is a public limited liability company ('naamloze vennootschap') under Dutch law with registered office
at Hulsterweg 82, 5912 PL Venlo, The Netherlands. QIAGEN N.V., a Netherlands holding company, and
subsidiaries (we, our or the Company) is the leading global provider of Sample to Insight solutions to transform
biological materials into valuable molecular insights. Our sample technologies isolate and process DNA, RNA and
proteins from blood, tissue and other materials. Assay technologies make these biomolecules visible and ready for
analysis. Bioinformatics software and knowledge bases interpret data to report relevant, actionable insights.
Automation solutions tie these together in seamless and cost-effective molecular testing workflows. We provide these
workflows to four major customer classes: Molecular Diagnostics (human healthcare), Applied Testing (forensics,
veterinary testing and food safety), Pharma (pharmaceutical and biotechnology companies) and Academia (life
sciences research). We market our products in more than 130 countries.
Basis of PresentationThe accompanying consolidated financial statements were prepared in accordance with U.S. generally accepted
accounting principles (GAAP) and all amounts are presented in U.S. dollars rounded to the nearest thousand, unless
otherwise indicated. The consolidated financial statements have been prepared on a historical cost basis, except for
derivative financial instruments, contingent consideration and available-for-sale financial instruments that have been
measured at fair value.
On January 6, 2017, we acquired OmicSoft Corporation, located in Cary, North Carolina (U.S.). On June 28,
2016, we acquired Exiqon A/S, located in Vedbaek, Denmark and on November 20, 2015, we acquired MO BIO
Laboratories, Inc., located in Carlsbad, California. Accordingly, at the acquisition dates, all of the assets acquired
and liabilities assumed were recorded at their respective fair values and our consolidated results of operations
include the operating results from the acquired companies from the acquisition dates.
Certain prior year amounts related to deferred taxes have been reclassified in Note 16 Income Taxes and the
Consolidated Statements of Cash Flows. Certain prior year amounts related to restructuring costs have been
reclassified to conform to the current year presentation. For the year ended December 31, 2016, $26.3 million and
$25.0 million costs were reclassified out of research and development and sales and marketing, respectively, to
general and administrative, restructuring, integration and other. These reclassifications had no effect on income from
operations.
2. Effects of New Accounting Pronouncements
Adoption of New Accounting Standards
FINANCIAL RESULTS

The following new FASB Accounting Standards Updates (ASU) were effective for the year ended December 31,
2017.
ASU 2015-11, Inventory (Topic 330): Simplifying the Measurement of Inventory requires in scope inventory,
including inventory measured using first-in, first out (FIFO) or average cost, to be measured at the lower of cost and
net realizable value. Net realizable value is the estimated selling price in the ordinary course of business, less
reasonably predictable costs of completion, disposal, and transportation. The adoption of ASU 2015-11 did not
have a material impact on our consolidated financial statements.
ASU 2016-07, Investments - Equity Method and Joint Ventures (Topic 323): Simplifying the Transition to the Equity
Method of Accounting eliminates the requirement to retroactively adopt the equity method of accounting when an
investment qualifies for use of the equity method as a result of an increase in the level of ownership or degree of
influence. The new guidance had no impact on our consolidated financial statements.
ASU 2016-09, Compensation - Stock Compensation (Topic 718): Improvements to Employee Share-Based Payment
Accounting is intended to simplify several aspects of the accounting for share-based payment transactions, including
the income tax consequences, classification of awards as either equity or liabilities, and classification on the
statement of cash flows. The new guidance became effective for us on January 1, 2017. The impact of the adoption
of ASU 2016-09 is limited to the recording of any windfall or shortfall benefit directly to the tax provision and the
reclassification of certain items in our statement of cash flows. We will continue estimating stock-based compensation
award forfeitures in determining the amount of compensation cost to be recognized each period. As a result of this
adoption, we expect volatility in our effective tax rate as any windfall or shortfall tax benefits related to our share-
based compensation will be recorded directly into our results of operations. Additionally, excess tax benefits after
adoption are classified as cash flows from operating activities instead of cash flows from financing activities. We
adopted this standard on a prospective basis and during 2017, $5.2 million of excess tax benefit was recognized
directly to the tax provision and classified as cash flows from operating activities.
New Accounting Standards Not Yet AdoptedThe following new FASB Accounting Standards Updates, which are not yet adopted, have been grouped by their
required effective dates:
First Quarter of 2018ASU 2014-09, Revenue from Contracts with Customers (Topic 606) affects any entity that either enters into contracts
with customers to transfer goods or services or enters into contracts for the transfer of nonfinancial assets unless those
contracts are within the scope of other standards (e.g., insurance contracts or lease contracts). In August 2015, the
FASB issued Accounting Standards Update No. 2015-14 (ASU 2015-14), Revenue from Contracts with Customers
(Topic 606): Deferral of the Effective Date which defers the effective date of ASU 2014-09 to interim and annual
reporting periods beginning after December 15, 2017. The FASB has continued to issue accounting standards
updates to clarify and provide implementation guidance related to Revenue from Contracts with Customers, including
ASU 2016-08 Revenue from Contract with Customers: Principal versus Agent Considerations, ASU 2016-10 Revenue
from Contracts with Customers: Identifying Performance Obligations and Licensing, and ASU 2016-12 Revenue from
Contracts with Customers: Narrow-Scope Improvements and Practical Expedients. An entity should apply the
amendments either retrospectively to each prior reporting period presented and the entity may elect certain practical
expedients (the full retrospective method of adoption); or, retrospectively with the cumulative effect of initially
applying this ASU recognized at the date of initial application (the modified retrospective method of adoption).
We will adopt this standard on its effective date, January 1, 2018 using the modified retrospective method. The new
standard is largely consistent with the existing guidance and current practices applied by our business and we do
not expect a material impact on our existing revenue accounting policies. The new standard also requires additional
disclosures including quantitative and qualitative disclosures about the nature, amount, timing and uncertainty of

revenue and cash flows from customer contracts. The Company is in the process of finalizing changes to support
recognition and disclosure under the new revenue standard.
ASU 2016-01, Financial Instruments - Overall (Subtopic 825-10): Recognition and Measurement of Financial Assets
and Financial Liabilities will impact certain aspects of recognition, measurement, presentation and disclosure of
financial instruments. The new guidance makes targeted improvements to existing U.S. GAAP by:
The amendments will become effective for our financial statements beginning in the first quarter of 2018 and require
adoption using a cumulative-effect adjustment to the balance sheet as of the beginning of the fiscal year of adoption.
The implementation of the amendments is expected to increase the volatility of net income as gains or losses in future
periods will be recognized in net income; however the extent of any volatility will be dependent upon the
significance of the equity investments at the time of adoption. At December 31, 2017, we had a net unrealized loss
of $0.9 million net of tax, and at December 31, 2016, we had a net unrealized loss, net of tax, of $0.2 million from
equity investments recorded in equity, respectively.
ASU No. 2016-15, Statement of Cash Flows (Topic 320): Classification of Certain Cash Receipts and Cash
Payments (a consensus of the FASB Emerging Issues Task Force), addresses eight classification issues related to the
statement of cash flows:
requiring equity investments (except those accounted for under the equity method of accounting, or those that result
in consolidation of the investee) to be measured at fair value with changes in fair value recognized in net income;
requiring public business entities to use the exit price notion when measuring the fair value of financial instruments
for disclosure purposes;
requiring separate presentation of financial assets and financial liabilities by measurement category and form of
financial asset (i.e., securities or loans and receivables) on the balance sheet or the accompanying notes to the
financial statements;
eliminating the requirement for public business entities to disclose the method(s) and significant assumptions used
to estimate the fair value that is required to be disclosed for financial instruments measured at amortized cost on
the balance sheet; and
requiring a reporting organization to present separately in other comprehensive income the portion of the total
change in the fair value of a liability resulting from a change in the instrument-specific credit risk (also referred to
as “own credit”) when the organization has elected to measure the liability at fair value in accordance with the
fair value option for financial instruments.
debt prepayment or debt extinguishment costs;
settlement of zero-coupon bonds;
contingent consideration payments made after a business combination;
proceeds from the settlement of insurance claims;
proceeds from the settlement of corporate-owned life insurance policies, including bank-owned life insurance
policies;
distributions received from equity method investees;
beneficial interests in securitization transactions; and
separately identifiable cash flows and application of the predominance principle.

We will adopt ASU 2016-15 on January 1, 2018. We will be required to apply this ASU using a retrospective
transition method to each period presented other than for issues where application would be impracticable in which
case we will be permitted to apply the amendments for those issues prospectively as of the earliest date practicable.
We do not expect any material impact from the adoption of ASU 2016-15 on our consolidated financial statements.
ASU 2016-16, Income Taxes (Topic 740): Intra-Entity Transfers of Assets Other Than Inventory, aims to improve the
accounting for the income tax consequences of intra-entity transfers of assets other than inventory. This amendment
requires an entity to recognize the income tax consequences of an intra-entity transfer of an asset other than
inventory when the transfer occurs. The amendments in this update should be applied on a modified retrospective
basis through a cumulative-effect adjustment directly to retained earnings as of the beginning of the period of
adoption. We will adopt ASU 2016-16 on January 1, 2018 without material impact.
ASU 2016-18, Statement of Cash Flows (Topic 320): Restricted Cash, requires entities to show the changes in the
total of cash, cash equivalents, restricted cash and restricted cash equivalents in the statement of cash flows. As a
result, entities will no longer present transfers between cash and cash equivalents and restricted cash and restricted
cash equivalents in the statement of cash flows. The amendments in this update should be applied using a
retrospective transition method to each period presented. This update is effective for us on January 1, 2018. There is
no impact from the adoption of ASU 2016-18 on our consolidated financial statements other than the effect of a
retrospective adjustment for the $6.3 million restricted cash balance held as of January 1, 2016 in the comparative
Consolidated Statements of Cash Flows.
ASU 2017-01, Business Combinations (Topic 805): Clarifying the Definition of a Business, clarifies and provides a
more robust framework to use in determining when a set of assets and activities is a business. The amendments in this
update should be applied prospectively on or after the effective date. We adopted this update beginning January 1,
2018.
ASU 2017-09, Compensation-Stock Compensation (Topic 718): Scope of Modification Accounting, clarifies when to
account for a change to the terms or conditions of a share-based payment award as a modification. Under the new
guidance, modification accounting is required only if the fair value, the vesting conditions, or the classification of the
award (as equity or liability) changes as a result of the change in terms or conditions. The guidance is effective for us
prospectively for annual periods beginning on January 1, 2018.
First Quarter of 2019ASU 2016-02, Leases (Topic 842) aims to increase transparency and comparability among organizations by
recognizing lease assets and lease liabilities on the balance sheet and disclosing key information about leasing
arrangements. ASU 2016-02 will become effective for us beginning in the first quarter of 2019 and requires
modified retrospective application for leases that exist or are entered into after the beginning of the earliest
comparative period in the financial statements. We do not plan to early adopt this standard and we anticipate that
the adoption of this standard will require changes to our systems and processes. We expect this standard to increase
total assets and total liabilities, however, we are currently evaluating the potential size of the impact that ASU 2016-
02 may have on our consolidated financial statements.
ASU 2017-12, Derivatives and Hedging (Topic 815): Targeted Improvements to Accounting for Hedging Activities,
will make more financial and nonfinancial hedging strategies eligible for hedge accounting. It also amends the
presentation and disclosure requirements and changes how companies assess effectiveness. It is intended to more
closely align hedge accounting with companies’ risk management strategies, simplify the application of hedge
accounting, and increase transparency as to the scope and results of hedging programs. The new guidance will
become effective for us beginning on January 1, 2019 by applying a modified retrospective approach to existing
hedging relationship as of the adoption date. Under the modified retrospective approach, entities with cash flow or
net investment hedges will make (1) a cumulative-effect adjustment to accumulated other comprehensive income so

that the adjusted amount represents the cumulative change in the hedging instruments’ fair value since hedge
inception (less any amounts that should have been recognized in earnings under the new accounting model) and (2)
a corresponding adjustment to opening retained earnings as of the most recent period presented on the date of
adoption. We are currently evaluating the potential impact ASU 2017-12 may have on our consolidated financial
statements.
First Quarter of 2020ASU 2016-13, Financial Instruments-Credit Losses (Topic 326): Measurement of Credit Losses on Financial
Instruments. provides financial statement users with more decision-useful information about the expected credit losses
on financial instruments and other commitments to extend credit held by a reporting entity at each reporting date. To
achieve this objective, the amendments in ASU 2016-13 replace the incurred loss impairment methodology in current
GAAP with a methodology that reflects expected credit losses and requires consideration of a broader range of
reasonable and supportable information to inform credit loss estimates. The new guidance will become effective for
us by applying the standard's provisions as a cumulative-effect adjustment to retained earnings beginning on January
1, 2020. We are currently evaluating the potential impact ASU 2016-13 may have on our consolidated financial
statements.
ASU 2017-04, Intangibles—Goodwill and Other (Topic 350): Simplifying the Test for Goodwill Impairment, removes
Step 2 of the goodwill impairment test. A goodwill impairment will now be the amount by which a reporting unit’s
carrying value exceeds its fair value, not to exceed the carrying amount of goodwill. ASU 2017-04 is effective for us
for annual periods beginning January 1, 2020 and early adoption is permitted. The new guidance is required to be
applied on a prospective basis. We are currently evaluating the impact the adoption of this new standard will have
on our financial position and results of operations.
3. Summary of Significant Accounting Policies and Critical Accounting
Estimates
Principles of ConsolidationThe consolidated financial statements include the accounts of QIAGEN N.V. and its wholly-owned subsidiaries. All
significant intercompany accounts and transactions have been eliminated. Investments in either common stock or in-
substance common stock of companies where we exercise significant influence over the operations but do not have
control, and where we are not the primary beneficiary, are accounted for using the equity method. All other
investments are accounted for under the cost method. When there is a portion of equity in an acquired subsidiary not
attributable, directly or indirectly, to the Company, we record the fair value of the noncontrolling interests at the
acquisition date and classify the amounts attributable to noncontrolling interests separately in equity in the
consolidated financial statements. Any subsequent changes in the Company's ownership interest while the Company
retains its controlling financial interest in its subsidiary are accounted for as equity transactions.
Use of EstimatesThe preparation of financial statements in conformity with accounting principles generally accepted in the United
States requires management to make estimates and assumptions that affect the reported amounts of assets, liabilities
and disclosure of contingencies at the date of the financial statements as well as the reported amounts of revenues
and expenses during the reporting period. Actual results could differ from those estimates.
Concentrations of RiskWe buy materials for products from many suppliers, and are not dependent on any one supplier or group of
suppliers for the business as a whole. However, key components of certain products, including certain
instrumentation components and chemicals, are available only from a single source. If supplies from these vendors

were delayed or interrupted for any reason, we may not be able to obtain these materials timely or in sufficient
quantities in order to produce certain products and sales levels could be negatively affected. Additionally, our
customers include researchers at pharmaceutical and biotechnology companies, academic institutions, and
government and private laboratories. Fluctuations in the research and development budgets of these researchers and
their organizations for applications in which our products are used could have a significant effect on the demand for
our products.
The financial instruments used in managing our foreign currency, equity and interest rate exposures have an element
of risk in that the counterparties may be unable to meet the terms of the agreements. We attempt to minimize this risk
by limiting the counterparties to a diverse group of highly-rated international financial institutions. The carrying values
of our financial instruments incorporate the non-performance risk by using market pricing for credit risk. However, we
have no reason to believe that any counterparties will default on their obligations and therefore do not expect to
record any losses as a result of counterparty default. In order to minimize our exposure with any single counterparty,
we have entered into master agreements which allow us to manage the exposure with the respective counterparty on
a net basis.
Other financial instruments that potentially subject us to concentrations of credit risk are cash and cash equivalents,
short-term investments, and accounts receivable. We attempt to minimize the risks related to cash and cash
equivalents and short-term investments by dealing with highly-rated financial institutions and investing in a broad and
diverse range of financial instruments. We have established guidelines related to credit quality and maturities of
investments intended to maintain safety and liquidity.
Concentration of credit risk with respect to accounts receivable is limited due to a large and diverse customer base,
which is dispersed over different geographic areas. Allowances are maintained for potential credit losses and such
losses have historically been within expected ranges.
Foreign Currency TranslationOur reporting currency is the U.S. dollar and our subsidiaries’ functional currencies are generally the local currency
of the respective countries in which they are headquartered. All amounts in the financial statements of entities whose
functional currency is not the U.S. dollar are translated into U.S. dollar equivalents at exchange rates as follows: (1)
assets and liabilities at period-end rates, (2) income statement accounts at average exchange rates for the period,
and (3) components of equity at historical rates. Translation gains or losses are recorded in equity, and transaction
gains and losses are reflected in net income as a component of other expense, net. Realized gains or losses on the
value of derivative contracts entered into to hedge the exchange rate exposure of receivables and payables are also
included in net income as a component of other expense, net. The net (loss) gain on foreign currency transactions
was $(3.3) million, less than $0.1 million, and $(0.5) million in 2017, 2016 and 2015, respectively, and is
included in other expense, net.
The exchange rates of key currencies were as follows:

Segment InformationWe determined that we operate as one operating segment in accordance with the Financial Accounting Standards
Board (FASB) Accounting Standards Codification (ASC) Topic 280, Segment Reporting. Our chief operating decision
maker (CODM) makes decisions based on the Company as a whole. In addition, we have a common basis of
organization and types of products and services which derive revenues and consistent product margins. Accordingly,
we operate and make decisions as one reporting unit.
Revenue RecognitionOur revenues are reported net of sales and value added taxes, discounts and sales allowances, and are derived
primarily from the sale of consumable and instrumentation products, and to a much lesser extent, from the sale of
services, intellectual property and technology. We recognize revenue when four basic criteria are met: (1)
persuasive evidence of an arrangement exists; (2) delivery has occurred or services have been rendered; (3) the fee
is fixed or determinable; and (4) collectability is reasonably assured.
Consumable and Related Products: In the last three years, revenue from consumable product sales has accounted for
approximately 79%-80% of our net sales and is generally recognized upon transfer of title consistent with the
shipping terms. We maintain a small amount, on average less than $2.0 million in total, of consignment inventory at
certain customer locations. Revenues for the consumable products which are consigned in this manner are
recognized upon consumption. We generally allow returns of consumable products if the product is returned in a
timely manner and in good condition. Allowances for returns are provided for based upon the historical pattern of
returns and management’s evaluation of specific factors that impact the risk of returns.
Revenues from related products include software-as-a-service (SaaS), license fees, intellectual property and patent
sales, royalties and milestone payments and over the last three years has accounted for approximately 7%-8% of our
net sales. Revenue from SaaS arrangements is recognized ratably over the duration of the agreement unless the
terms of the agreement indicate that revenue should be recognized in a different pattern, for example based on
usage. License fees from research collaborations include payments for technology transfer and access rights. Non-
refundable, up-front payments received in connection with collaborative research and development agreements are
generally deferred and recognized on a straight-line basis over the contract period during which there is any
continuing obligation. Revenue from intellectual property and patent sales is recognized when earned, either at the
time of sale, or over the contract period when licensed. Payments for milestones, generally based on the achievement
of substantive and at-risk performance criteria, are recognized in full at such time as the specified milestone has been
achieved according to the terms of the agreement. Royalties from licensees are based on reported sales of licensed
products and revenues are calculated based on contract terms when reported sales are reliably measurable, fees are
fixed or determinable and collectability is reasonably assured.
(US$ equivalent for one)
Closing rate at December 31, Annual average rate
2017 2016 2017 2016 2015
Euro (EUR) 1.1993 1.0541 1.1292 1.1068 1.1100
Pound Sterling (GBP) 1.3517 1.2312 1.2882 1.3560 1.5286
Swiss Franc (CHF) 1.0249 0.9816 1.0156 1.0153 1.0406
Australian Dollar (AUD) 0.7815 0.7222 0.7666 0.7439 0.7522
Canadian Dollar (CAD) 0.7975 0.7430 0.7710 0.7552 0.7836
Japanese Yen (JPY) 0.0089 0.0085 0.0089 0.0092 0.0083
Chinese Yuan (CNY) 0.1537 0.1440 0.1480 0.1506 0.1592

Instrumentation: Revenue from instrumentation includes the instrumentation equipment, installation, training and other
instrumentation services, such as extended warranty services or product maintenance contracts and over the last
three years has accounted for approximately 12%-13% of net sales. Revenue from instrumentation equipment is
recognized when title passes to the customer, upon either shipment or written customer acceptance after satisfying
any installation and training requirements.
We offer our customers access to our instrumentation via reagent rental agreements which place instrumentation with
customers without requiring them to purchase the equipment. Instead, we recover the cost of providing the
instrumentation in the amount charged for consumable products. The instruments placed with customers under a
reagent rental agreement are depreciated and charged to cost of sales on a straight-line basis over the estimated life
of the instrument, typically 3 to 5 years. The costs to maintain these instruments in the field are charged to cost of
sales as incurred. Revenue from these reagent rental agreements is allocated to the elements within the arrangement
(the lease, the sale of consumables and/or services) in accordance with ASC 605-25, Revenue Recognition—
Multiple-Element Arrangements and recognized for each unit of accounting as appropriate.
We have contracts with multiple elements which include instrumentation equipment, either leased under a reagent
rental agreement or sold directly, together with other elements such as installation, training, extended warranty
services or product maintenance contracts or consumable products. These contracts are accounted for under ASC
605-25, Revenue Recognition—Multiple-Element Arrangements. Multiple-element arrangements are assessed to
determine whether there is more than one unit of accounting. In order for a deliverable to qualify as a separate unit
of accounting, both of the following criteria must be met:
Arrangement consideration is allocated at the inception of the arrangement to all deliverables on the basis of their
relative selling price. When applying the relative selling price method, the selling price for each deliverable is
determined using (a) vendor-specific objective evidence (VSOE) of selling price, if it exists; or otherwise (b) third-party
evidence of selling price. If neither VSOE nor third-party evidence of selling price exists for a deliverable, then the
best estimated selling price for the deliverable is used. The arrangement consideration is allocated to the separate
units of accounting based on each unit’s relative fair value. If these criteria are not met, deliverables included in an
arrangement are accounted for as a single unit of accounting and revenues and costs are deferred until the period or
periods in which the final deliverable is provided.
We have evaluated the deliverables in our multiple-element arrangements and concluded that they are separate units
of accounting because the delivered item or items have value to the customer on a standalone basis and for an
arrangement that includes a general right of return relative to the delivered item(s), delivery or performance of the
undelivered item(s) is considered probable and substantially in our control. Revenues from installation and training
are recognized as services are completed, based on VSOE, which is determined by reference to the price customers
pay when the services are sold separately. Revenues from extended warranty services or product maintenance
contracts are recognized on a straight-line basis over the term of the contract, typically one year. VSOE of fair value
of extended warranty services or product maintenance is determined based on the price charged for the
maintenance and support when sold separately. Revenues from the instrumentation equipment and consumable
products are recognized when the products are delivered and there are no further performance obligations. VSOE of
fair value of instrumentation equipment and consumable products is determined based on the price charged for the
instrument and consumables when sold separately. Certain of our reagent rental arrangements include termination
provisions for breach of contract. However, these termination provisions would not impact recognized revenues. Our
other arrangements do not include any provisions for cancellation or refunds.
The delivered items have value to the client on a stand-alone basis;
If the arrangement includes a general right of return relative to the delivered item, delivery or performance of the
undelivered item or items is considered probable and substantially in the control of the Company.

WarrantyWe provide warranties on our products against defects in materials and workmanship for a period of 1 year. A
provision for estimated future warranty costs is recorded in cost of sales at the time product revenue is recognized.
Product warranty obligations are included in accrued and other current liabilities in the accompanying consolidated
balance sheets. The changes in the carrying amount of warranty obligations are as follows:
Research and DevelopmentResearch and product development costs are expensed as incurred. Research and development expenses consist
primarily of salaries and related expenses, facility costs and amounts paid to contract research organizations, and
laboratories for the provision of services and materials as well as costs for internal use or clinical trials.
Government GrantsWe recognize government grants when there is reasonable assurance that all conditions will be complied with and
the grant will be received. Our government grants generally represent subsidies for specified activities and are
therefore recognized when earned as a reduction of the expenses recorded for the activity that the grants are
intended to compensate. Thus, when the grant relates to research and development expense, the grant is recognized
over the same period that the related costs are incurred. Otherwise, amounts received under government grants are
recorded as liabilities in the balance sheet. When the grant relates to an asset, the nominal amount of the grant is
deducted from the carrying amount of the asset and recognized over the same period that the related asset is
depreciated.
Borrowing CostsBorrowing costs directly attributable to the acquisition, construction or production of an asset that takes a substantial
period of time to get ready for its intended use or sale are capitalized as part of the cost of the respective assets
(qualifying asset) when such borrowing costs are significant. All other borrowing costs are expensed in the period
they occur.
Shipping and Handling Income and CostsShipping and handling costs charged to customers are recorded as revenue in the period that the related product
sale revenue is recorded. Associated costs of shipping and handling are included in sales and marketing expenses.
(in thousands) Total
BALANCE AT DECEMBER 31, 2015 $ 2,637
Provision charged to cost of sales 3,562
Usage (2,936)
Adjustments to previously provided warranties, net (424)
Currency translation (60)
BALANCE AT DECEMBER 31, 2016 $ 2,779
Provision charged to cost of sales 3,024
Usage (2,859)
Adjustments to previously provided warranties, net (54)
Currency translation 161
BALANCE AT DECEMBER 31, 2017 $ 3,051

For the years ended December 31, 2017, 2016 and 2015, shipping and handling costs totaled $28.6 million,
$26.5 million and $26.2 million, respectively.
Advertising CostsThe costs of advertising are expensed as incurred and are included as a component of sales and marketing expense.
Advertising costs for the years ended December 31, 2017, 2016 and 2015 were $7.2 million, $8.4 million and
$7.2 million, respectively.
General and Administrative, Restructuring, Integration and OtherGeneral and administrative expenses primarily represent the costs required to support administrative infrastructure. In
addition, we incur indirect acquisition and business integration costs in connection with business combinations. These
costs represent incremental costs that we believe would not have been incurred absent the business combinations.
Major components of these costs include payroll and related costs for employees remaining with the Company on a
transitional basis; public relations, advertising and media costs for re-branding of the combined organization; and,
consulting and related fees incurred to integrate or restructure the acquired operations.
Restructuring costs include personnel costs (principally termination benefits), facility closure and contract termination
costs. Termination benefits are accounted for in accordance with FASB ASC Topic 712, Compensation -
Nonretirement Postemployment Benefits, and are recorded when it is probable that employees will be entitled to
benefits and the amounts can be reasonably estimated. Estimates of termination benefits are based on the frequency
of past termination benefits, the similarity of benefits under the current plan and prior plans, and the existence of
statutory required minimum benefits. Facility closure, some termination benefits and other costs are accounted for in
accordance with FASB ASC Topic 420, Exit or Disposal Cost Obligations and are recorded when the liability is
incurred. The specific restructuring measures and associated estimated costs are based on management's best
business judgment under the existing circumstances at the time the estimates are made. If future events require
changes to these estimates, such adjustments will be reflected in the period of the revised estimate.
Income TaxesWe account for income taxes under the liability method. Under this method, total income tax expense is the amount
of income taxes expected to be payable for the current year plus the change from the beginning of the year for
deferred income tax assets and liabilities established for the expected further tax consequences resulting from
differences in the financial reporting and tax basis of assets and liabilities. Deferred tax assets and/or liabilities are
determined by multiplying the differences between the financial reporting and tax reporting bases for assets and
liabilities by the enacted tax rates expected to be in effect when such differences are recovered or settled. Deferred
tax assets are reduced by a valuation allowance to the amount more likely than not to be realized. The effect on
deferred taxes of a change in tax rates is recognized in income in the period that includes the enactment date.
Tax benefits are initially recognized in the financial statements when it is more likely than not that the position will be
sustained upon examination by the tax authorities. Such tax positions are initially and subsequently measured as the
largest amount of tax benefit that is greater than 50 percent likely of being realized upon settlement with the taxing
authority using the cumulative probability method, assuming the tax authority has full knowledge of the position and
all relevant facts. Our policy is to recognize interest accrued related to unrecognized tax benefits in interest expense
and penalties within the income tax expense.
Derivative InstrumentsWe enter into derivative financial instrument contracts to minimize the variability of cash flows or income statement
impact associated with the anticipated transactions being hedged or to hedge fluctuating interest rates. As changes
in foreign currency or interest rate impact the value of anticipated transactions, the fair value of the forward or swap
contracts also changes, offsetting foreign currency or interest rate fluctuations. Derivative instruments are recorded on
the balance sheet at fair value. Changes in fair value of derivatives are recorded in current earnings or other
comprehensive income, depending on whether a derivative is designated as part of a hedge transaction.
Share-Based PaymentsCompensation cost for all share-based payments is recorded based on the grant date fair value, less an estimate for
pre-vesting forfeitures, recognized in expense over the service period. During 2016 we made a change in
accounting principle to move from a straight-line attribution method for expense recognition to an accelerated
attribution method.
Forfeiture Rate—This is the estimated percentage of grants that are expected to be forfeited or cancelled on an
annual basis before becoming fully vested. We estimated the forfeiture rate based on historical forfeiture experience.
Restricted Stock Units and Performance Stock Units: Restricted stock units and performance stock units represent rights
to receive Common Shares at a future date. The fair market value of restricted and performance stock units is
determined based on the number of stock units granted and the fair market value of our shares on the grant date.
The fair market value at the time of the grant, less an estimate for pre-vesting forfeitures, is recognized in expense
over the vesting period. At each reporting period, the estimated performance achievement of the performance stock
units is assessed and any change in the estimated achievement is recorded on a cumulative basis in the period of
adjustment.
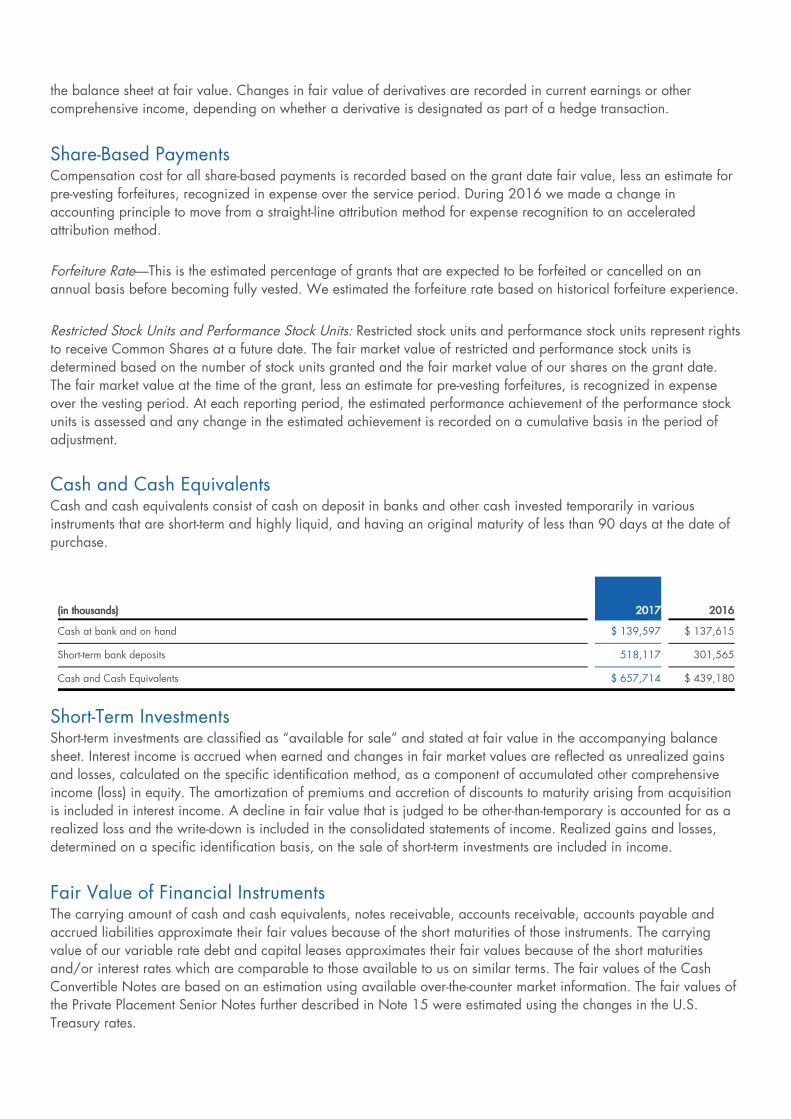
Cash and Cash EquivalentsCash and cash equivalents consist of cash on deposit in banks and other cash invested temporarily in various
instruments that are short-term and highly liquid, and having an original maturity of less than 90 days at the date of
purchase.
Short-Term InvestmentsShort-term investments are classified as “available for sale” and stated at fair value in the accompanying balance
sheet. Interest income is accrued when earned and changes in fair market values are reflected as unrealized gains
and losses, calculated on the specific identification method, as a component of accumulated other comprehensive
income (loss) in equity. The amortization of premiums and accretion of discounts to maturity arising from acquisition
is included in interest income. A decline in fair value that is judged to be other-than-temporary is accounted for as a
realized loss and the write-down is included in the consolidated statements of income. Realized gains and losses,
determined on a specific identification basis, on the sale of short-term investments are included in income.
Fair Value of Financial InstrumentsThe carrying amount of cash and cash equivalents, notes receivable, accounts receivable, accounts payable and
accrued liabilities approximate their fair values because of the short maturities of those instruments. The carrying
value of our variable rate debt and capital leases approximates their fair values because of the short maturities
and/or interest rates which are comparable to those available to us on similar terms. The fair values of the Cash
Convertible Notes are based on an estimation using available over-the-counter market information. The fair values of
the Private Placement Senior Notes further described in Note 15 were estimated using the changes in the U.S.
Treasury rates.
(in thousands) 2017 2016
Cash at bank and on hand $ 139,597 $ 137,615
Short-term bank deposits 518,117 301,565
Cash and Cash Equivalents $ 657,714 $ 439,180

Accounts ReceivableOur accounts receivable are unsecured and we are at risk to the extent such amounts become uncollectible. We
continually monitor accounts receivable balances, and provide for an allowance for doubtful accounts at the time
collection becomes questionable based on payment history or age of the receivable. Amounts determined to be
uncollectible are written off against the reserve. For the years ended December 31, 2017, 2016 and 2015, write-
offs of accounts receivable totaled $3.2 million, $1.6 million and $2.0 million, respectively, while provisions for
doubtful accounts which were charged to expense totaled $3.1 million, $2.1 million and $2.1 million, respectively.
For all years presented, no single customer represented more than ten percent of accounts receivable or consolidated
net sales.
InventoriesInventories are stated at the lower of cost or net realizable value, determined on either a weighted average cost
basis or a standard cost basis which is regularly adjusted to actual. Inventories include material, direct labor and
overhead costs and are reduced for estimated obsolescence. Inventories consisted of the following as of December
31, 2017 and 2016:
Property, Plant and EquipmentProperty, plant and equipment, including equipment acquired under capital lease obligations, are stated at cost less
accumulated amortization. Capitalized internal-use software costs include only those direct costs associated with the
actual development or acquisition of computer software for internal use, including costs associated with the design,
coding, installation and testing of the system. Costs associated with preliminary development, such as the evaluation
and selection of alternatives, as well as training, maintenance and support are expensed as incurred. Costs for
software to be sold, leased or otherwise marketed that are related to the conceptual formulation and design are
expensed as incurred. Costs incurred to produce the product after technological feasibility is established are
capitalized and amortized in accordance with the accounting standards for the costs of software to be sold, leased,
or otherwise marketed. All other depreciation is computed using the straight-line method over the estimated useful
lives of the assets (3 to 40 years). Amortization of leasehold improvements is computed on a straight-line basis over
the lesser of the remaining life of the lease or the estimated useful life of the improvement asset. We have a policy of
capitalizing expenditures that materially increase assets’ useful lives and charging ordinary maintenance and repairs
to operations as incurred. When property or equipment is disposed of, the cost and related accumulated
depreciation and amortization are removed from the accounts and any gain or loss is included in earnings.
Acquired Intangibles and GoodwillAcquired intangibles with alternative future uses are carried at cost less accumulated amortization and consist of
licenses to technology held by third parties and other acquired intangible assets. Amortization is computed over the
estimated useful life of the underlying patents, which has historically ranged from one to twenty years. Purchased
intangible assets acquired in business combinations, other than goodwill, are amortized over their estimated useful
lives unless these lives are determined to be indefinite. Intangibles are assessed for recoverability considering the
contract life and the period of time over which the intangible will contribute to future cash flow. The unamortized cost
of intangible assets, where cash flows are independent and identifiable from other assets, is evaluated periodically
and adjusted, if necessary, if events and circumstances indicate that a decline in value below the carrying amount
(in thousands) 2017 2016
Raw materials $ 23,717 $ 29,402
Work in process 33,153 28,123
Finished goods 99,057 $ 79,027
Total inventories, net $ 155,927 $ 136,552

has occurred. For the years ended December 31, 2016 and 2015, we recorded intangible asset impairments of
$21.4 million and $0.2 million, respectively. Intangible asset impairments recorded during the year ended
December 31, 2016 are further discussed in Note 6 Restructuring.
Amortization expense related to developed technology and patent and license rights which have been acquired in a
business combination is included in cost of sales. Amortization of trademarks, customer base and non-compete
agreements which have been acquired in a business combination is recorded in operating expense under the
caption 'acquisition-related intangible amortization'. Amortization expenses of intangible assets not acquired in a
business combination are recorded within either the cost of sales, research and development or sales and marketing
line items based on the use of the asset.
Goodwill represents the difference between the purchase price and the estimated fair value of the net assets acquired
arising from business combinations. Goodwill is subject to impairment tests annually or earlier if indicators of
potential impairment exist, using a fair-value-based approach. We have elected to perform our annual test for
indications of impairment as of October 1st of each year. Following the annual impairment tests for the years ended
December 31, 2017, 2016 and 2015, goodwill has not been impaired. As discussed in Note 6 Restructuring, in
2016 we recorded a $2.6 million disposal of goodwill associated to the 2016 restructuring initiative.
InvestmentsWe have investments in non-marketable securities issued by privately held companies. These investments are
included in other long-term assets in the accompanying consolidated balance sheets and are accounted for using the
equity or cost method of accounting.
Investments are evaluated periodically, or when impairment indicators are noted, to determine if declines in value
are other-than-temporary. In making that determination, we consider all available evidence relating to the realizable
value of a security. This evidence includes, but is not limited to, the following:
We consider whether the fair values of any of our cost or equity method investments have declined below their
carrying value whenever adverse events or changes in circumstances indicate that recorded values may not be
recoverable. If any such decline is considered to be other than temporary (based on various factors, including
historical financial results, product development activities and the overall health of the affiliate’s industry), then a
write-down of the investment would be recorded in operating expense to its estimated fair value. For the year ended
December 31, 2017 and 2015, we recorded total impairments to cost method investments of $5.1 million and $2.2
million, respectively, in other expense, net. In 2016, we recorded an impairment to an equity method investment of
$8.3 million in other expense, net.
Impairment of Long-Lived AssetsWe review our long-lived assets for impairment whenever events or changes in circumstances indicate that the
carrying amount of an asset or a group of assets may not be recoverable. We consider, amongst other indicators, a
history of operating losses or a change in expected sales levels to be indicators of potential impairment. Assets are
grouped and evaluated for impairment at the lowest level for which there are identifiable cash flows that are largely
independent of the cash flows of other groups of assets. If an asset is determined to be impaired, the loss is
measured as the amount by which the carrying amount of the asset exceeds fair value which is determined by
applicable market prices, when available. When market prices are not available, we generally measure fair value
adverse financial conditions of a specific issuer, segment, industry, region or other variables;
the length of time and the extent to which the fair value has been less than cost; and
the financial condition and near-term prospects of the issuer.
by discounting projected future cash flows of the asset. Considerable judgment is necessary to estimate discounted
future cash flows. Accordingly, actual results could differ from such estimates. During the year ended 2016, in
connection with the restructuring discussed in Note 6, we recorded asset impairment charges of $10.9 million, of
which $10.8 million is recorded in general and administrative, restructuring, integration and other expense and
$0.1 million is recorded in cost of sales. In 2015, we recorded asset impairment charges of $3.1 million in general
and administrative, restructuring, integration and other expenses in the accompanying consolidated statements of
income related to the abandonment of certain software projects following the acquisition of MO BIO.
4. Segment Information
Considering the acquisition made during 2017, we determined that we still operate as one business segment in
accordance with FASB ASC Topic 280, Segment Reporting. As a result of our continued restructuring and
streamlining of the growing organization, our chief operating decision maker (CODM) continues to make decisions
with regards to business operations and resource allocation based on evaluations of QIAGEN as a whole.
Accordingly, we operate as one business segment. Summarized product category and geographic information is
shown in the tables below.
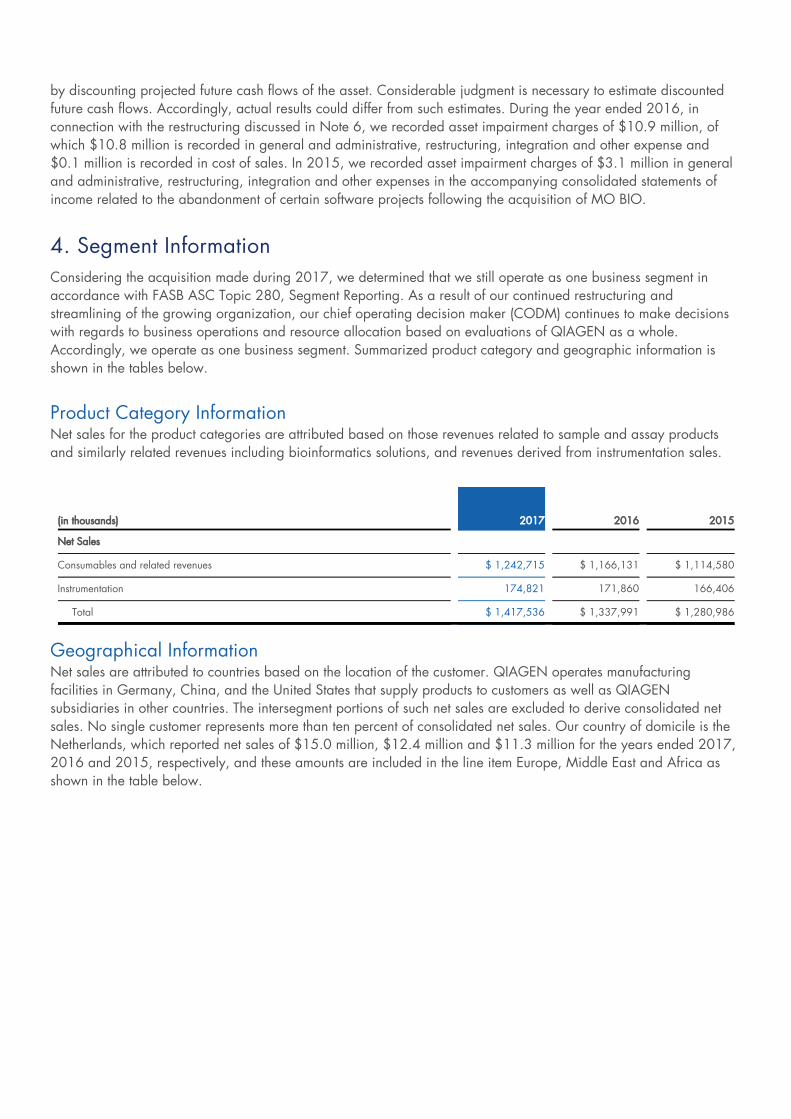
Product Category InformationNet sales for the product categories are attributed based on those revenues related to sample and assay products
and similarly related revenues including bioinformatics solutions, and revenues derived from instrumentation sales.
Geographical InformationNet sales are attributed to countries based on the location of the customer. QIAGEN operates manufacturing
facilities in Germany, China, and the United States that supply products to customers as well as QIAGEN
subsidiaries in other countries. The intersegment portions of such net sales are excluded to derive consolidated net
sales. No single customer represents more than ten percent of consolidated net sales. Our country of domicile is the
Netherlands, which reported net sales of $15.0 million, $12.4 million and $11.3 million for the years ended 2017,
2016 and 2015, respectively, and these amounts are included in the line item Europe, Middle East and Africa as
shown in the table below.
(in thousands) 2017 2016 2015
Net Sales
Consumables and related revenues $ 1,242,715 $ 1,166,131 $ 1,114,580
Instrumentation 174,821 171,860 166,406
Total $ 1,417,536 $ 1,337,991 $ 1,280,986

Long-lived assets include property, plant and equipment. The Netherlands, which is included in the balances for
Europe, reported long-lived assets of $1.7 million and $1.4 million as of December 31, 2017 and 2016,
respectively.
5. Acquisitions
Acquisitions have been accounted for as business combinations, and the acquired companies’ results have been
included in the accompanying consolidated statements of income from their respective dates of acquisition. Our
acquisitions have historically been made at prices above the fair value of the acquired net assets, resulting in
goodwill, due to expectations of synergies of combining the businesses. These synergies include use of our existing
infrastructure, such as sales force, shared service centers, distribution channels and customer relations, to expand
sales of the acquired businesses’ products; use of the infrastructure of the acquired businesses to cost-effectively
expand sales of our products; and elimination of duplicative facilities, functions and staffing.
2017 AcquisitionOn January 6, 2017, we acquired OmicSoft Corporation, a leading provider of omics data management solutions
located in Cary, North Carolina (U.S.). This acquisition was not significant to the overall consolidated financial
statements and as of December 31, 2017, the allocation of the purchase price was final. The acquisition did not
have a material impact to net sales, net income or earnings per share and therefore no pro forma information has
been provided herein.
2016 Acquisitions
(in thousands) 2017 2016 2015
Net Sales
Americas:
United States $ 579,906 $ 555,676 $ 525,532
Other Americas 73,478 71,797 79,578
Total Americas 653,384 627,473 605,110
Europe, Middle East and Africa 462,980 428,055 409,955
Asia Pacific and Rest of World 301,172 282,463 265,921
Total $ 1,417,536 $ 1,337,991 $ 1,280,986
(in thousands) 2017 2016
Long-lived assets
Americas:
United States $ 148,694 $ 145,813
Other Americas 4,488 4,544
Total Americas 153,182 150,357
Germany 286,567 237,190
Other Europe 41,188 37,057
Asia Pacific and Rest of World 13,384 12,051
Total $ 494,321 $ 436,655

During the second quarter of 2016, we acquired a majority shareholding in Exiqon A/S (Exiqon), a publicly traded
Danish company headquartered in Vedbaek, Denmark, which is a leading provider of RNA analysis solutions with a
proprietary Locked Nucleic Acid (LNA) technology. The acquisition expands our leadership position in Sample to
Insight solutions for RNA analysis. On June 28, 2016, we paid DKK 627.4 million ($95.2 million) for approximately
94.52% of the outstanding Exiqon common shares. On the acquisition date, the fair value of the remaining shares
was $5.5 million. The fair value of this noncontrolling share was based on reference to quoted market values of
Exiqon stock. During the year ended December 31, 2016, we acquired the remaining Exiqon shares for $5.5 million
in cash, which is included in other financing activities in the accompanying consolidated statements of cash flows
and as of December 31, 2016 we held 100% of Exiqon's shares. For the year ended December 31, 2016,
acquisition-related costs of $6.3 million are included in general and administrative, restructuring, integration and
other in the accompanying consolidated statements of income.
The final purchase price allocation as of December 31, 2017 did not differ from the preliminary purchase price
allocation as of June 30, 2016 other than a $9.4 million increase in developed technology, a $9.2 million increase
in deferred tax asset on tax loss carry forwards, a $2.8 million decrease in customer relationships, a $1.2 million
increase of long-term deferred tax liability, a $0.4 million increase in prepaid expenses and other current assets and
an additional $0.3 million increase of other opening balance sheet liabilities. The corresponding impact for these
adjustments was a decrease to goodwill of $14.7 million.
(in thousands) Exiqon acquisition
Purchase Price:
Cash consideration $ 95,163
Fair value of remaining shares 5,519
$ 100,682
Final Allocation:
Cash and cash equivalents $ 4,824
Accounts receivable 3,581
Inventory 1,553
Prepaid expenses and other current assets 1,853
Accounts payable (1,289)
Accruals and other current liabilities (11,587)
Debt assumed (6,068)
Other long-term liabilities (197)
Deferred tax asset on tax loss carry forwards 10,016
Fixed and other long-term assets 2,870
Developed technology 18,500
Customer relationships 3,800
Tradenames 1,400
Goodwill 76,807
Deferred tax liability on fair value of identifiable intangible assets acquired (5,381)
$ 100,682

The weighted average amortization period for the intangible assets is 11.1 years. The goodwill acquired is not
deductible for tax purposes.
Revenue and earnings in the reporting periods since the acquisition date have not been significant. No pro forma
financial information has been provided herein as the acquisition of Exiqon did not have a material impact to net
sales, net income or earnings per share on a pro forma basis.
2015 AcquisitionsDuring 2015, we completed three acquisitions, including the acquisition of MO BIO Laboratories, Inc., a privately-
held U.S. company, that is considered a leader in sample technologies for metagenomics and microbiome analysis.
Purchase consideration for these acquisitions totaled $66.9 million in cash, net of cash acquired, and as of
December 31, 2016, the purchase price allocations are final. Each of these acquisitions did not have a material
impact to net sales, net income or earnings per share and therefore no pro forma information has been provided
herein.
6. Restructuring
2017 RestructuringDuring the fourth quarter of 2017, we initiated restructuring initiatives to mitigate the negative impacts stemming from
the U.S. tax legislation as further discussed in Note 16. Total pre-tax costs are expected to be between $22.8 million
and $24.8 million, of which $13.8 million was incurred in 2017. Future pre-tax costs between $9.0 million to
$11.0 million are expected to be incurred in 2018 primarily related to personnel and other costs.
The following table summarizes the cash components of the restructuring activity.
The Personnel Related and Consulting Costs are included within general and administrative, restructuring, integration
and other and an additional $3.0 million of inventory write-offs is included in cost of sales in the accompanying
consolidated statement of income for the year ended December 31, 2017. The liability of $10.8 million is included
in accrued and other current liabilities in the accompanying consolidated balance sheet at December 31, 2017.
2016 RestructuringDuring the fourth quarter of 2016, we initiated a series of targeted actions to support faster sales momentum and
improve efficiency and accountability. The objective with these actions is to ensure that we grow sustainably and
consistently in the coming years. Measures include simplifying our geographic presence with site reductions, focusing
resources to shared service centers, and streamlining selected organizational structures. No additional costs will be
incurred related to this program. Cumulative costs for this program are as follows:
(in thousands) Personnel Related Consulting Costs Total
Costs incurred in 2017 $ 6,174 $ 4,583 $ 10,757
Foreign currency translation adjustment 48 2 50
Liability at December 31, 2017 $ 6,222 $ 4,585 $ 10,807

Personnel Related expenses during 2017 and 2016 includes reductions in costs of $0.7 million and $2.0 million,
respectively, as a result of forfeitures of share-based compensation in connection with terminations. During the year
ended December 31, 2016, Asset Impairments and Disposals include $21.4 million for intangible asset impairments,
$10.9 million for fixed asset abandonments, and $1.1 million primarily in connection with the write-off of prepaid
contract costs. The total $10.9 million of expense included in other expense, net in the accompanying consolidated
statements of income is composed of $8.3 million associated with an impairment of an equity method investment and
a disposal of goodwill of $2.6 million.
The following table summarizes the cash components of the restructuring activity.
At December 31, 2017, $5.6 million of the liability is included in accrued and other current liabilities and $0.8
million is included in other-long term liabilities in the accompanying consolidated balance sheet. At December 31,
2016, $27.6 million of the liability is included in accrued and other current liabilities and $4.7 million is included in
other long-term liabilities in the accompanying consolidated balance sheet.
2014 RestructuringDuring the fourth quarter of 2014, we recorded restructuring charges in connection with the acquisition of
Enzymatics and from the implementation of headcount reductions and facility consolidations to further streamline
(in thousands) Personnel Related Facility Related
Contract and Other
Costs
Asset Impairments &
Disposals Total
Cost of sales $ 1,222 $ 205 $ 43 $ 10,490 $ 11,960
General and administrative, restructuring,
integration and other
17,998 6,960 8,272 22,963 56,193
Other expense, net — — — 10,946 10,946
Total 2016 costs $ 19,220 $ 7,165 $ 8,315 $ 44,399 $ 79,099
Cost of sales $ 1,141 $ — $ 238 $ — $ 1,379
General and administrative, restructuring,
integration and other
$ 8,399 $ 350 $ 9,612 $ — $ 18,361
Total 2017 costs $ 9,540 $ 350 $ 9,850 $ — $ 19,740
Total cumulative costs $ 28,760 $ 7,515 $ 18,165 $ 44,399 $ 98,839
(in thousands) Personnel Related Facility RelatedContract and Other
Costs Total
Costs incurred in 2016 $ 21,252 $ 7,165 $ 8,315 $ 36,732
Payments (2,742) (601) (2,391) (5,734)
Facility deferred rent reclassified to restructuring — 1,326 — 1,326
Foreign currency translation adjustment (30) (8) 19 (19)
Liability at December 31, 2016 $ 18,480 $ 7,882 $ 5,943 $ 32,305
Additional costs in 2017 13,357 1,798 9,883 25,038
Release of excess accrual (3,083) (1,448) (30) (4,561)
Payments (25,586) (7,478) (14,887) (47,951)
Facility deferred rent reclassified to restructuring — 241 — 241
Foreign currency translation adjustment 1,126 57 157 1,340
Liability at December 31, 2017 $ 4,294 $ 1,052 $ 1,066 $ 6,412

operations and various measures as part of a commitment to continuous improvement and related to QIAGEN's
strategic focus on its five growth drivers. No additional costs were incurred subsequent to 2014 related to this
program.
The following table summarizes the components of the restructuring costs.
7. Short-Term Investments
At December 31, 2017 and 2016, we had $359.2 million and $89.3 million, respectively, of loan receivables and
commercial paper due from financial institutions. These loan receivables and commercial paper are non-derivative
financial assets with fixed or determinable payments that are not quoted in an active market and are carried at fair
market value, which is equal to the cost. At December 31, 2017, these loans consist of $308.2 million and €42.5million ($51.0 million as of December 31, 2017) which mature at various dates through December 2018. All
instruments that have an original tenor of more than 12 months include redemption rights on at least a quarterly
basis. Interest income is determined using the effective interest rate method. These loans are classified as current
assets in the accompanying consolidated balance sheets since we may redeem the loans at our discretion.
At December 31, 2016, we had €3.5 million ($3.7 million) in term deposits which matured in August 2017. Thedeposits could be withdrawn at the end of each quarter without penalty and were therefore classified as current
assets in the accompanying consolidated balance sheets.
For the years ended December 31, 2017, 2016 and 2015, proceeds from sales of short term investments totaled
$189.0 million, $533.8 million and $367.7 million, respectively. During the years ended December 31, 2017 and
2016, realized gains totaled $1.1 million and $1.4 million, respectively. During the year ended December 31,
2015, realized losses totaled $6.0 million.
8. Prepaid Expenses and Other Current Assets
Prepaid expenses and other current assets are summarized as follows as of December 31, 2017 and 2016:
(in thousands) Personnel Related Facility Related
Contract and Other
Costs Total
Balance at December 31, 2014 $ 6,341 $ 7,627 $ 652 $ 14,620
Payments (4,789) (4,199) (418) (9,406)
Release of excess accrual (453) — (20) (473)
Foreign currency translation adjustment (630) — — (630)
Balance at December 31, 2015 $ 469 $ 3,428 $ 214 $ 4,111
Payments (143) (3,428) (214) (3,785)
Release of excess accrual (325) — — (325)
Foreign currency translation adjustment (1) — — (1)
Balance at December 31, 2016 $ — $ — $ — $ —

9. Property, Plant and Equipment
Property, plant and equipment, including equipment acquired under capital lease obligations, are summarized as
follows as of December 31, 2017 and 2016:
Amortization of assets acquired under capital lease obligations is included within accumulated depreciation and
amortization above for the years ended December 31, 2017 and 2016, respectively. For the years ended
December 31, 2017, 2016 and 2015 depreciation and amortization expense totaled $82.5 million, $75.1 million
and $59.5 million, respectively. For the years ended December 31, 2017, 2016 and 2015 amortization related to
computer software to be sold, leased or marketed totaled $13.9 million, $9.3 million and $5.1 million, respectively.
In 2016, we recorded asset impairment charges of $10.9 million related to the restructuring charge discussed in
Note 6. Impairments included $7.5 million of computer software to be sold, leased or marketed, $1.7 million in
machinery and equipment, $1.5 million in internal-use software, $0.1 million in furniture and office equipment and
$0.1 million in buildings and improvements. In 2015, we recorded asset impairment charges of $3.1 million, of
which $1.0 million related to computer software to be sold, leased or marketed related to the abandonment of
certain projects following the acquisition of MO BIO.
Repairs and maintenance expense was $12.7 million, $13.0 million and $15.4 million in 2017, 2016 and 2015,
respectively. For the year ended December 31, 2017 and 2016, construction in progress primarily includes amounts
related to ongoing software development projects. For the years ended December 31, 2017, 2016 and 2015,
interest capitalized in connection with construction projects was not significant.
10. Investments
(in thousands) 2017 2016
Prepaid expenses $ 41,775 $ 35,529
Cash collateral 21,907 1,200
Value added tax 17,870 14,985
Other receivables 15,902 9,699
Fair value of derivative instruments 9,033 5,386
Total prepaid expenses and other current assets $ 106,487 $ 66,799
(in thousands) Estimated useful life 2017 2016
Land — $ 18,188 $ 16,327
Buildings and improvements 5-40 328,938 301,092
Machinery and equipment 3-10 299,175 257,349
Computer software 3-7 243,809 176,227
Furniture and office equipment 3-10 103,257 89,560
Construction in progress — 65,542 47,260
1,058,909 887,815
Less: Accumulated depreciation and amortization (564,588) (451,160)
Property, plant and equipment, net $ 494,321 $ 436,655

We have made strategic investments in certain companies that are accounted for using the equity or cost method of
accounting. The method of accounting for an investment depends on the level of influence. We monitor changes in
circumstances that may require a reassessment of the level of influence. We periodically review the carrying value of
these investments for impairment, considering factors such as the most recent stock transactions and book values from
the recent financial statements. The fair value of cost and equity-method investments is estimated when there are
identified events or changes in circumstances that may have an impact on the fair value of the investment.
Additionally, we have investments in marketable equity securities that have readily determinable fair values that are
classified as available-for-sale. These investments are reported at fair value, with unrealized gains and losses
recorded in accumulated other comprehensive income (loss) in equity.
Equity Method InvestmentsA summary of these equity method investments, which are included in other long-term assets in the consolidated
balance sheets, is as follows:
During 2017, we acquired a 40% interest in MAQGEN Biotechnology Co., Ltd. for $4.0 million and a commitment
to contribute an additional $8.0 million in future periods. Also, during 2017, we sold our interest in QIAGEN
(Suzhou) Institute of Translation Research Co., Ltd., which had no book value at the time of sale, for $3.5 million and
recorded a corresponding gain in other expense, net in the accompanying statement of income.
In connection with the 2016 restructuring activities discussed in Note 6, in 2016 we transferred the research and
development activities of our instrumentation business to a new company, Hombrechtikon Systems Engineering AG
(HSE), in which we acquired a 19.0% interest for a total obligation of $9.8 million payable over three years. As of
December 31, 2017 and 2016, $3.1 million and $3.9 million, respectively, were included in accrued and other
current liabilities and $3.1 million and $5.9 million, respectively, were included in other long-term liabilities in the
accompanying consolidated balance sheet. HSE is a variable interest entity and we are not the primary beneficiary
as we do not hold the power to direct the activities that most significantly impact the economic performance of HSE.
Therefore, HSE is not consolidated. In 2016, we recorded an impairment of the investment in HSE of $8.3 million in
other expense, net. As of December 31, 2017 and 2016, the investment had a carrying value of $1.2 million and
$1.5 million, respectively, which is included in other long-term assets in the consolidated balance sheets,
representing our maximum exposure to loss.
We had a 100% interest in QIAGEN Finance (Luxembourg) S.A. (QIAGEN Finance) which was established for the
purpose of issuing convertible debt in 2004. The proceeds of the 2004 Notes were loaned to subsidiaries within the
consolidated QIAGEN N.V. group. QIAGEN N.V. had guaranteed the 2004 Notes, and had agreements with
($ in thousands)OwnershipPercentage
Equity investmentsas of December 31,
Share of income(loss)for the years ended December 31,
2017 2016 2017 2016 2015
PreAnalytiX GmbH 50.00 % $ 7,562 $ 3,519 $ 3,818 $ 3,067 $ 1,878
Biotype Innovation GmbH 24.90 % 3,821 3,339 39 (335) (595)
MAQGEN Biotechnology Co., Ltd 40.00 % 3,285 — (542) — —
Pyrobett 19.00 % 2,639 2,444 195 333 (600)
Hombrechtikon Systems Engineering AG 19.00 % 1,155 1,524 (346) — —
QIAGEN (Suzhou) Institute of Translation
Research Co., Ltd.
0.00 % — — — (244) (107)
QIAGEN Finance 100.00 % — — — — 85
$ 18,462 $ 10,826 $ 3,164 $ 2,821 $ 661

QIAGEN Finance to issue common shares to the investors in the event of conversion of the 2004 Notes. QIAGEN
Finance was a variable interest entity. We did not hold any variable interests in QIAGEN Finance, and we were not
the primary beneficiary, therefore QIAGEN Finance was not consolidated. Accordingly, the 2004 convertible debt
was not included in the consolidated statements of QIAGEN N.V., though QIAGEN N.V. did report the full
obligation of the debt through its liabilities to QIAGEN Finance. QIAGEN N.V. accounted for its investment in
QIAGEN Finance as an equity investment until the first quarter of 2015 and accordingly recorded 100% of the profit
or loss of QIAGEN Finance in the gain or loss from equity method investees. During the first quarter of 2015, we
repaid the $250.9 million loan to QIAGEN Finance and repurchased the warrant agreement with QIAGEN Finance.
Cost Method InvestmentsAt December 31, 2017 and 2016, we had a total of cost-method investments in non-publicly traded companies with
carrying amounts of $33.6 million and $38.2 million, respectively, which are included in other long-term assets in
the consolidated balance sheets. The fair-value of these cost-method investments are not estimated unless there are
identified events or changes in circumstances that may have a significant adverse effect on the fair value of the
investment. During the years ended December 31, 2017, and 2016, we made cost-method investments totaling $0.3
million, and $20.5 million, respectively. In 2017 and 2015, we recorded total impairments to cost method
investments of $5.1 million and $2.2 million, respectively, in other expense, net. In 2016, we converted a $0.6
million short-term loan into additional ownership interest of a cost-method investment.
Marketable Equity SecuritiesDuring 2016, we made an investment in HTG Molecular Diagnostics, Inc. (HTGM), a publicly traded company. At
December 31, 2017, we held 833,333 shares with a cost basis of $2.0 million. As of December 31, 2017 and
2016, the fair market value of these shares was $1.7 million and $1.9 million, respectively. During 2017, we
purchased a convertible loan from HTGM as further discussed in Note 22. Additionally, our former cost-method
investment in Curetis AG was reclassified as a long-term marketable security during 2015 upon the completed IPO of
its Dutch holding company, Curetis N.V. At December 31, 2017, we hold 320,424 shares of Curetis N.V. with a
cost basis of $2.3 million and a fair market value of $1.5 million. We held 320,712 shares with a cost basis of
$2.3 million and a fair value of $2.2 million as of December 31, 2016. These marketable securities are included in
other long-term assets in the accompanying consolidated balance sheets.
11. Goodwill and Intangible Assets
The following sets forth the intangible assets by major asset class as of December 31, 2017 and 2016:
The changes in intangible assets for the years ended December 31, 2017 and 2016 are as follows:
($ in thousands)Weighted
Average Life
2017 2016
Gross CarryingAmount
AccumulatedAmortization
Gross CarryingAmount
AccumulatedAmortization
Amortized Intangible Assets:
Patent and license rights 9.41 $ 407,635 $ (280,434) $ 373,609 $ (233,406)
Developed technology 11.82 771,893 (544,633) 708,825 (469,312)
Customer base, trademarks, and non-competeagreements
10.28 437,213 (292,356) 422,797 (245,354)
10.76 $ 1,616,741 $ (1,117,423) $ 1,505,231 $ (948,072)
Unamortized Intangible Assets:
Goodwill $ 2,012,904 $ 1,925,518

Amortization expense on intangible assets totaled approximately $133.8 million, $137.9 million and $132.0
million, respectively, for the years ended December 31, 2017, 2016 and 2015.
In 2016, we recorded an intangible asset abandonment charge of $21.4 million related to the discontinuation of
existing technologies in connection with the 2016 restructuring discussed more fully in Note 6. Of this abandonment
charge, $10.3 million is included in cost of sales and $11.1 million is included in general and administrative,
restructuring, integration and other in the accompanying consolidated statements of income.
Cash paid for purchases of intangible assets during the year ended December 31, 2017 totaled $34.3 million, of
which $16.5 million is related to current year payments for licenses that were accrued as of December 31, 2016
and $5.8 million is related to prepayments recorded in other long-term assets in the accompanying consolidated
balance sheet. Intangible asset additions of $15.5 million includes $12.0 million of cash paid during the year ended
December 31, 2017, together with $3.5 million of additions which were previously recorded as prepayments. Cash
paid for intangible assets during the year ended December 31, 2016 totaled $19.4 million of which $3.9 million is
related to prepayments recorded in other long-term assets in accompanying consolidated balance sheet. Intangible
asset additions of $70.9 million includes $15.5 million of cash paid during the year ended December 31, 2016,
together with $7.1 million of additions which were previously recorded as prepayments and $48.4 million of
additions which were accrued as of December 31, 2016. Of the accrued additions in 2016, $46.3 million related
to licenses for which fixed payments are expected to occur through the end of the license term in 2024.
The changes in the carrying amount of goodwill during the years ended December 31, 2017 and 2016 resulted
primarily from changes in foreign currency translation together with acquired goodwill from the 2017 acquisition of
OmicSoft and the 2016 acquisition of Exiqon discussed in Note 5. Additionally, $2.6 million of goodwill was
disposed of in connection with the transfer of the research and development activities of our instrumentation business
as part of the 2016 restructuring program discussed in Note 6.
Amortization of intangibles for the next five years is expected to be approximately:
(in thousands) Intangibles Goodwill
BALANCE AT DECEMBER 31, 2015 $ 636,421 $ 1,875,698
Additions 70,937 —
Purchase adjustments (321) 316
Additions from acquisitions 23,700 76,807
Amortization (137,949) —
Disposals (29) (2,650)
Impairment losses (21,423) —
Foreign currency translation adjustments (14,177) (24,653)
BALANCE AT DECEMBER 31, 2016 $ 557,159 $ 1,925,518
Additions 15,527 —
Additions from acquisitions 28,700 26,934
Amortization (133,797) —
Disposals (897) —
Foreign currency translation adjustments 32,626 60,452
BALANCE AT DECEMBER 31, 2017 $ 499,318 $ 2,012,904

12. Accrued and Other Current Liabilities
Accrued and other current liabilities at December 31, 2017 and 2016 consist of the following:
13. Derivatives and Hedging
In the ordinary course of business, we use derivative instruments, including swaps, forwards and/or options, to
manage potential losses from foreign currency exposures and interest bearing assets or liabilities. The principal
objective of such derivative instruments is to minimize the risks and/or costs associated with our global financial and
operating activities. We do not utilize derivative or other financial instruments for trading or other speculative
purposes. We recognize all derivatives as either assets or liabilities on the balance sheet on a gross basis, measure
those instruments at fair value and recognize the change in fair value in earnings in the period of change, unless the
derivative qualifies as an effective hedge that offsets certain exposures. We have agreed with almost all of our
counterparties with whom we had entered into cross-currency swaps, interest rate swaps or foreign exchange
contracts, to enter into bilateral collateralization contracts under which we will receive or provide cash collateral, as
the case may be, for the net position with each of these counterparties. As of December 31, 2017, cash collateral
positions consisted of $3.0 million recorded in accrued and other current liabilities and $21.9 million recorded in
prepaid and other current assets in the accompanying consolidated balance sheet. As of December 31, 2016, we
had a liability position of $7.0 million recorded in accrued and other current liabilities and $1.2 million recorded in
prepaid expenses and other current assets in the accompanying consolidated balance sheet.
(in thousands) Amortization
Years ended December 31:
2018 $ 114,009
2019 $ 92,717
2020 $ 65,503
2021 $ 56,214
2022 $ 40,692
(in thousands) 2017 2016
Accrued expenses and other liabilities $ 85,986 $ 74,245
Payroll and related accruals 63,525 54,772
Deferred revenue 49,357 44,629
Restructuring 14,667 27,590
Accrued contingent consideration and milestone payments 11,539 2,957
Accrued royalties 6,714 7,801
Accrued interest on long-term debt 5,543 4,239
Cash collateral 3,000 6,984
Fair value of derivative instruments 2,424 6,089
Current portion of capital lease obligations 1,359 999
Total accrued and other current liabilities $ 244,114 $ 230,305

In 2017, we entered into a foreign currency non-derivative hedging instrument that is designated and qualifies as net
investment hedge. The objective of the hedge is to protect part of the net investment in foreign operations against
adverse changes in the exchange rate between the Euro and the functional currency of the U.S. dollar. The non-
derivative hedging instrument is the German private corporate bond ("Schuldschein") which was issued in the total
amount of $331.1 million as described in Note 15. Of the $331.1 million, which is held in both U.S. dollars and
Euro, €255.0 million is designated as the hedging instrument against a portion of our Euro net investments in ourforeign operations. The relative changes in both the hedged item and hedging instrument are calculated by applying
the change in spot rate between two assessment dates against the respective notional amount. The effective portion
of the hedge is recorded in the cumulative translation adjustment account within other accumulated comprehensive
income (loss). Based on the spot rate method, the unrealized loss recorded in equity as of December 31, 2017 is
$19.8 million. Since we are using the debt as the hedging instrument, which is also remeasured based on the spot
rate method, there is no hedge ineffectiveness related to the net investment hedge as of December 31, 2017.
As of December 31, 2017 and 2016, we held derivative instruments that are designated and qualify as cash flow
hedges where the effective portion of the gain or loss on the derivative is reported as a component of other
comprehensive income (loss) and reclassified into earnings in the same period or periods during which the hedged
transaction affects earnings. Gains and losses on the derivative representing either hedge ineffectiveness or hedge
components excluded from the assessment of effectiveness are recognized in current earnings. In 2017 and in 2016,
we did not record any hedge ineffectiveness related to any cash-flow hedges in earnings. Based on their valuation as
of December 31, 2017, we expect approximately $10.7 million of derivative losses included in accumulated other
comprehensive loss will be reclassified into income during the next 12 months. The cash flows derived from
derivatives are classified in the consolidated statements of cash flows in the same category as the consolidated
balance sheet account of the underlying item.
As of December 31, 2017 and 2016, we held derivative instruments that qualify for hedge accounting as fair value
hedges. For derivative instruments that are designated and qualify as a fair value hedge, the effective portion of the
gain or loss on the derivative is reflected in earnings. This earnings effect is offset by the change in the fair value of
the hedged item attributable to the risk being hedged that is also recorded in earnings. In 2017 and 2016, we
concluded there was no ineffectiveness. The cash flows derived from derivatives are classified in the consolidated
statements of cash flows in the same category as the consolidated balance sheet account of the underlying item.
Interest Rate DerivativesWe use interest rate derivative contracts to align our portfolio of interest bearing assets and liabilities with our risk
management objectives. During 2015, we entered into five cross currency interest rate swaps through 2025 for a
total notional amount of $180.0 million which qualify for hedge accounting as cash flow hedges. We determined
that no ineffectiveness exists related to these swaps. As of December 31, 2017, the €180.0 million notional swapamount had a fair value of $28.9 million recorded in other-long term liabilities and a related interest receivable of
$1.2 million recorded in prepaid and other current assets, respectively, in the accompanying consolidated balance
sheet. As of December 31, 2016, this swap had a fair value of $1.4 million and accrued and unpaid interest of
$1.7 million which recorded in other long-term assets and prepaid expenses and other current assets, respectively, in
the accompanying consolidated balance sheet.
During 2014, we entered into interest rate swaps, which effectively fixed the fair value of $200.0 million of our fixed
rate private placement debt and qualify for hedge accounting as fair value hedges. We determined that no
ineffectiveness exists related to these swaps. As of December 31, 2017, the $200.0 million notional swap amount
had a fair value of $0.9 million and accrued and unpaid interest of $0.3 million which are recorded in other long-
term assets and prepaid and other current assets, respectively, in the accompanying consolidated balance sheet. As
of December 31, 2016, this swap had a fair value of $3.1 million and accrued and unpaid interest of $0.6 million
which are recorded in other long-term assets and prepaid expenses and other current assets, respectively, in the
accompanying balance sheet.

Call OptionsWe entered into Call Options in 2014 which, along with the sale of the Warrants, represent the Call Spread
Overlay entered in connection with the 2019 and 2021 Cash Convertible Notes, which are more fully described in
Note 15. We used $105.2 million of the proceeds from the issuance of the 2019 and 2021 Cash Convertible Notes
to pay the premium for the Call Options, and simultaneously received $68.9 million (net of issuance costs) from the
sale of the Warrants, for a net cash outlay of $36.3 million for the Call Spread Overlay.
During 2017, we used $73.6 million of the proceeds from the from the issuance of the 2023 Cash Convertible
Notes to pay for the premium for the Call Option, and simultaneously received $45.4 million from the sale of
Warrants, for a net cash outlay of $28.3 million for the Call Spread Overlay. Issuance costs incurred in connection
with the Warrant and the Call Option were $0.3 million and $0.1 million respectively, which $0.1 million was
accrued as of December 31, 2017.
In both transactions, the Call Options are intended to address the equity price risk inherent in the cash conversion
feature of each instrument by offsetting cash payments in excess of the principal amount due upon any conversion of
the Cash Convertible Notes.
Aside from the initial payment of a premium of $105.2 million (2019 and 2021 Notes) and $73.6 million (2023
notes) for the Call Options, we will not be required to make any cash payments under the Call Options. We will,
however, be entitled to receive under the terms of the Call Options an amount of cash generally equal to the amount
by which the market price per share of our common stock exceeds the exercise price of the Call Options during the
relevant valuation period. The exercise price under the Call Options is equal to the conversion price of the Cash
Convertible Notes.
The Call Options, for which our common stock is the underlying security, are a derivative asset that requires mark-to-
market accounting treatment due to the cash settlement features until the Call Options settle or expire. The Call
Options are measured and reported at fair value on a recurring basis, within Level 2 of the fair value hierarchy. For
further discussion of the inputs used to determine the fair value of the Call Options, refer to Note 14. The fair value of
the Call Options at December 31, 2017 and 2016 was approximately $223.2 million and $185.8 million,
respectively which is recorded in other long-term assets in the accompanying consolidated balance sheet.
The Call Options do not qualify for hedge accounting treatment. Therefore, the change in fair value of these
instruments is recognized immediately in our consolidated statements of income in other expense, net. For the years
ended December 31, 2017 and 2016, the changes in the fair value of the Call Options resulted in gains of $37.4
million and $16.7 million, respectively. Because the terms of the Call Options are substantially similar to those of the
Cash Convertible Notes' embedded cash conversion option, discussed below, we expect the effect on earnings from
those two derivative instruments to mostly offset each other.
Cash Convertible Notes Embedded Cash Conversion OptionThe embedded cash conversion option within the Cash Convertible Notes is required to be separated from the Cash
Convertible Notes and accounted for separately as a derivative liability, with changes in fair value reported in our
consolidated statements of income in other expense, net until the cash conversion option settles or expires. For further
discussion of the Cash Convertible Notes, refer to Note 15. The initial fair value liability of the embedded cash
conversion option for the 2019 and 2021 Notes was $105.2 million and for the 2023 Notes was $74.5 million,
which simultaneously reduced the carrying value of the Cash Convertible Notes (effectively an original issuance
discount). The embedded cash conversion option is measured and reported at fair value on a recurring basis, within
Level 2 of the fair value hierarchy. For further discussion of the inputs used to determine the fair value of the
embedded cash conversion options, refer to Note 14. The fair value of the embedded cash conversion options at
December 31, 2017 and 2016 was approximately $224.3 million and $187.5 million, respectively, which is
recorded in other long-term liabilities in the accompanying balance sheet. For the years ended December 31, 2017

and 2016 the change in the fair value of the embedded cash conversion options resulted in losses of $36.7 million
and $16.6 million, respectively, recognized in our consolidated statements of income in other expense, net.
Foreign Currency DerivativesAs a globally active enterprise, we are subject to risks associated with fluctuations in foreign currencies in our
ordinary operations. This includes foreign currency-denominated receivables, payables, debt, and other balance
sheet positions including intercompany items. We manage balance sheet exposure on a group-wide basis using
foreign exchange forward contracts, foreign exchange options and cross-currency swaps.
Undesignated Derivative InstrumentsWe are party to various foreign exchange forward, option and swap arrangements which had, at December 31,
2017, an aggregate notional value of $587.3 million and fair values of $7.5 million and $2.4 million included in
prepaid and other current assets and accrued and other current liabilities, respectively, which expire at various dates
through March 2018. We were party to various foreign exchange forward and swap arrangements which had, at
December 31, 2016, an aggregate notional value of $347.6 million and fair values of $3.2 million and $6.1
million included in prepaid and other current assets and accrued and other current liabilities, respectively, which
expired at various dates through December 2017. The transactions have been entered into to offset the effects from
short-term balance sheet exposure to foreign currency exchange risk. Changes in the fair value of these arrangements
have been recognized in other expense, net.
Fair Values of Derivative InstrumentsThe following table summarizes the fair value amounts of derivative instruments reported in the consolidated balance
sheets as of December 31, 2017 and 2016:
The following tables summarize the classification and gains and losses on derivative instruments for the years ended
December 31, 2017, 2016 and 2015:
($ in thousands) Derivatives in Asset Positions Fair value Derivatives in Liability Positions Fair value
2017 2016 2017 2016
Derivative instruments designated as hedges
Interest rate contracts $ 2,409 $ 6,655 $ (28,942) $ —
Total derivative instruments designated as hedges $ 2,409 $ 6,655 $ (28,942) $ —
Undesignated derivative instruments
Call spread overlay $ 223,164 $ 185,750 $ (224,286) $ (187,546)
Foreign exchange contracts 7,480 3,154 (2,424) (6,089)
Total derivative instruments $ 230,644 $ 188,904 $ (226,710) $ (193,635)

Year-Ended December 31, 2017 (in thousands)
Gain/(loss)
recognized in
AOCI
Location of (gain) loss
in income statement
(Gain) loss reclassified
from AOCI into income
Gain (loss)
recognized in
income
Non-derivative instruments
Net investment hedge $ (19,757) Other expense, net $ — n/a
Cash flow hedges
Interest rate contracts $ (30,310) Other expense, net $ 26,136 n/a
Fair value hedges
Interest rate contracts $ — Other expense, net $ — $ (2,199)
Undesignated derivative instruments
Call spread overlay n/a Other expense, net n/a $ 1,573
Foreign exchange contracts n/a Other expense, net n/a 11,813
$ 13,386
Year-Ended December 31, 2016 (in thousands)
Gain/(loss)
recognized in
AOCI
Location of (gain) loss
in income statement
(Gain) loss reclassified
from AOCI into income
Gain (loss)
recognized in
income
Cash flow hedges
Interest rate contracts $ (3,969) Other expense, net $ (6,228) n/a
Fair value hedges
Interest rate contracts $ — Other expense, net $ — $ (1,930)
Undesignated derivative instruments
Call spread overlay n/a Other expense, net n/a $ 118
Foreign exchange contracts n/a Other expense, net n/a (6,072)
$ (5,954)
Year-Ended December 31, 2015 (in thousands)
Gain/(loss)
recognized in
AOCI
Location of (gain) loss
in income statement
(Gain) loss reclassified
from AOCI into income
Gain (loss)
recognized in
income
Cash flow hedges
Interest rate contracts $ 5,337 Other expense, net $ (5,273) n/a
Fair value hedges
Interest rate contracts $ — Other expense, net $ — $ 1,691
Undesignated derivative instruments
Call spread overlay n/a Other expense, net n/a $ (171)
Foreign exchange contracts n/a Other expense, net n/a $ 21,434
$ 21,263

The amounts noted in the table above for accumulated other comprehensive income (AOCI) do not include any
adjustment for the impact of deferred income taxes.
14. Fair Value Measurements
Assets and liabilities are measured at fair value according to a three-tier fair value hierarchy which prioritizes the
inputs used in measuring fair value as follows:
Level 1. Observable inputs, such as quoted prices in active markets;
Level 2. Inputs, other than the quoted price in active markets, that are observable either directly or indirectly; and
Level 3. Unobservable inputs in which there is little or no market data, which require the reporting entity to develop
its own assumptions.
Our assets and liabilities measured at fair value on a recurring basis consist of short-term investments, which are
classified in Level 1 and Level 2 of the fair value hierarchy, marketable securities discussed in Note 10, which are
classified in Level 1, derivative contracts used to hedge currency and interest rate risk and derivative financial
instruments entered into in connection with the Cash Convertible Notes discussed in Note 15, which are classified in
Level 2 of the fair value hierarchy, and contingent consideration accruals which are classified in Level 3 of the fair
value hierarchy, and are shown in the tables below. There have been no transfers between levels.
In determining fair value for Level 2 instruments, we apply a market approach, using quoted active market prices
relevant to the particular instrument under valuation, giving consideration to the credit risk of both the respective
counterparty to the contract and the Company. To determine our credit risk, we estimated our credit rating by
benchmarking the price of outstanding debt to publicly-available comparable data from rated companies. Using the
estimated rating, our credit risk was quantified by reference to publicly-traded debt with a corresponding rating. The
Level 2 derivative financial instruments include the Call Options asset and the embedded conversion option liability.
See Note 15, "Lines of Credit and Debt", and Note 13, "Derivatives and Hedging", for further information. The
derivatives are not actively traded and are valued based on an option pricing model that uses observable market
data for inputs. Significant market data inputs used to determine fair values included our common stock price, the
risk-free interest rate, and the implied volatility of our common stock. The Call Options asset and the embedded cash
conversion option liability were designed with the intent that changes in their fair values would substantially offset,
with limited net impact to our earnings. Therefore, the sensitivity of changes in the unobservable inputs to the option
pricing model for such instruments is substantially mitigated.
Our Level 3 instruments include contingent consideration liabilities. We value contingent consideration liabilities
using unobservable inputs, applying the income approach, such as the discounted cash flow technique, or the
probability-weighted scenario method. Contingent consideration arrangements obligate us to pay the sellers of an
acquired entity if specified future events occur or conditions are met such as the achievement of technological or
revenue milestones. We use various key assumptions, such as the probability of achievement of the milestones (0% to
100%) and the discount rate (between 2.2% and 7.7%), to represent the non-performing risk factors and time value
when applying the income approach. We regularly review the fair value of the contingent consideration, and reflect
any change in the accrual in the consolidated statements of income in the line items commensurate with the
underlying nature of milestone arrangements.
The following table presents our fair value hierarchy for our financial assets and liabilities measured at fair value on
a recurring basis:

For liabilities with Level 3 inputs, the following table summarizes the activity for the years ended December 31, 2017
and 2016:
For the year ended December 31, 2017, the total $11.5 million accrued for contingent consideration is accrued and
other current liabilities. During 2017 and 2016, gains for the reduction in the fair value of contingent consideration
related to unmet milestones of $3.3 million and $6.5 million were recognized in general and administrative,
restructuring, integration and other in the accompanying consolidated statements of income.
The carrying values of financial instruments, including cash and cash equivalents, accounts receivable, accounts
payable and other accrued liabilities, approximate their fair values due to their short-term maturities. The estimated
fair value of long-term debt as disclosed in Note 15 was based on current interest rates for similar types of
borrowings. The estimated fair values may not represent actual values of the financial instruments that could be
(in thousands)
As of December 31, 2017 As of December 31, 2016
Level 1 Level 2 Level 3 Total Level 1 Level 2 Level 3 Total
Assets:
Short-term investments $ — $ 359,198 $ — $ 359,198 $ 3,699 $ 89,300 $ — $ 92,999
Marketable securities 3,208 — — 3,208 4,064 — — 4,064
Call option — 223,164 — 223,164 — 185,750 — 185,750
Foreign exchange — 7,480 — 7,480 — 3,154 — 3,154
Interest rate contracts — 2,409 — 2,409 — 6,655 — 6,655
$ 3,208 $ 592,251 $ — $ 595,459 $ 7,763 $ 284,859 $ — $ 292,622
Liabilities:
Foreign exchange $ — $ (2,424) $ — $ (2,424) $ — $ (6,089) $ — $ (6,089)
Interest rate contracts — (28,942) — (28,942) — — — —
Cash conversion option — (224,286) — (224,286) — (187,546) — (187,546)
Contingent consideration — — (11,539) (11,539) — — (8,754) (8,754)
$ — $ (255,652) $ (11,539) $ (267,191) — $ (193,635) $ (8,754) $ (202,389)
(in thousands) Contingent Consideration
BALANCE AT DECEMBER 31, 2015 $ (17,678)
Additions from acquisitions (692)
Payments 3,120
Gain included in earnings 6,501
Foreign currency translation adjustments (5)
BALANCE AT DECEMBER 31, 2016 $ (8,754)
Additions (10,954)
Payments 4,900
Gain included in earnings 3,269
BALANCE AT DECEMBER 31, 2017 $ (11,539)

realized as of the balance sheet date or that will be realized in the future. There were no fair value differences in the
years ended December 31, 2017 and 2016 for nonfinancial assets or liabilities required to be measured at fair
value on a nonrecurring basis other than the impairment of cost-method investments as discussed in Note 10.
15. Lines of Credit and Debt
Our credit facilities available and undrawn at December 31, 2017 total €426.6 million (approximately $511.6million). This includes a €400.0 million syndicated multi-currency revolving credit facility expiring December 2021 ofwhich no amounts were utilized at December 31, 2017 or at December 31, 2016, and four other lines of credit
amounting to €26.6 million with no expiration date, none of which were utilized as of December 31, 2017 or as ofDecember 31, 2016. The €400.0 million facility can be utilized in Euro, British pounds sterling, Swiss franc or U.S.dollar and bears interest of 0.4% to 1.2% above three months EURIBOR, or LIBOR in relation to any loan not in euro,
and is offered with interest periods of one, two, three or six months. The commitment fee is calculated based on 35%
of the applicable margin. In 2017 and 2016, $0.9 million and $1.0 million of commitment fees were paid,
respectively. The revolving facility agreement contains certain financial and non-financial covenants, including but
not limited to, restrictions on the encumbrance of assets and the maintenance of certain financial ratios. We were in
compliance with these covenants at December 31, 2017. The credit facilities are for general corporate purposes.
At December 31, 2017 and December 31, 2016, total long-term debt, net of debt issuance costs of $12.4 million
and $8.1 million, respectively, consists of the following:
The notes are all unsecured obligations that rank pari passu. Interest expense on long-term debt was $43.6 million,
$35.8 million and $34.5 million for the years ended December 31, 2017, 2016 and 2015, respectively.
Future maturities (stated at the carrying values) of long-term debt as of December 31, 2017 are as follows:
(in thousands)
2017 2016
0.375% Senior Unsecured Cash Convertible Notes due
2019
$ 414,843 $ 402,806
0.875% Senior Unsecured Cash Convertible Notes due
2021
270,762 262,371
0.500% Senior Unsecured Cash Convertible Notes due
2023
322,902 —
3.19% Series A Senior Notes due October 16, 2019 72,742 73,408
3.75% Series B Senior Notes due October 16, 2022 300,276 301,601
3.90% Series C Senior Notes due October 16, 2024 26,921 26,910
Schuldschein Private Placement 349,812 —
Total long-term debt $ 1,758,258 $ 1,067,096

Cash Convertible Notes due 2019, 2021 and 2023On March 19, 2014, we issued $730.0 million aggregate principal amount of Cash Convertible Senior Notes of
which $430.0 million is due in 2019 (2019 Notes) and $300.0 million is due in 2021 (2021 Notes). The
aggregate net proceeds of the 2019 and 2021 Convertible Notes were $680.7 million, after payment of the net
cost of the Call Spread Overlay described below and transaction costs. Additionally, we used $372.5 million of the
net proceeds to repay other debt.
On September 13, 2017, we issued $400.0 million aggregate principal amount of Cash Convertible Senior Notes
which is due in 2023 (2023 Notes). The net proceeds of the 2023 Notes were $365.9 million, after payment of the
net cost of the Call Spread Overlay described below and transaction costs paid through December 31, 2017.
We refer to the 2019 Notes, 2021 Notes and 2023 Notes, collectively as the “Cash Convertible Notes”. Interest on
the Cash Convertible Notes is payable semi-annually in arrears on March 19 and September 19 of each year, at
rates of 0.375%, 0.875% and 0.500% per annum for the 2019 Notes, 2021 Notes and 2023 Notes respectively,
commencing on September 19, 2014 for the 2019 Notes and 2021 Notes and March 13, 2018 for the 2023
Notes. The 2019 Notes will mature on March 19, 2019, the 2021 Notes will mature on March 19, 2021 and the
2023 Notes will mature on September 13, 2023 unless repurchased or converted in accordance with their terms
prior to such date.
The Cash Convertible Notes are solely convertible into cash in whole, but not in part, at the option of noteholders in
the following circumstances: (a) from April 29, 2014 through September 18, 2018 for the 2019 Notes, and
September 18, 2020 for the 2021 Notes and from October 24, 2017 through March 13, 2023 for the 2023 Notes
(Contingent Conversion Period), under any of the Contingent Conversion Conditions and (b) at any time following
the Contingent Conversion Period through the fifth business day immediately preceding the applicable maturity Date.
Upon conversion, noteholders will receive an amount in cash equal to the Cash Settlement Amount, calculated as
described below. The Cash Convertible Notes are not convertible into shares of our common stock or any other
securities.
Noteholders may convert their 2019 and 2021 Cash Convertible Notes into cash at their option at any time during
the Contingent Conversion Period only under the following circumstances (Contingent Conversion Conditions):
Year ending December 31, (in thousands)
2018 $ —
2019 487,585
2020 —
2021 311,743
2022 479,070
thereafter 479,860
$ 1,758,258
during any calendar quarter commencing after the calendar quarter ending on March 31, 2014 (and only during
such calendar quarter), if the last reported sale price of our common stock for at least 20 trading days (whether or
not consecutive) during a period of 30 consecutive trading days ending on the last trading day of the immediately
preceding calendar quarter is greater than or equal to 130% of the conversion price on each applicable trading
day;
if we undergo certain fundamental changes as defined in the agreement;

Noteholders may convert their 2023 Notes into cash at their option at any time during the Contingent Conversion
Period only under the following circumstances (Contingent Conversion Conditions)
The Contingent Conversion Conditions in the 2019, 2021 and 2023 Notes noted above have been analyzed under
ASC 815, Derivatives and Hedging, and, based on our analysis, we determined that each of the embedded features
listed above are clearly and closely related to the 2019, 2021 and 2023 Notes (i.e., the host contract). As a result,
pursuant to the accounting provisions of ASC 815, Derivatives and Hedging, these features noted above are not
required to be bifurcated as separate instruments. As of December 31, 2017, no contingent conversion condition
was triggered.
during the 5 business day period immediately after any 10 consecutive trading day period in which the quoted
price for the 2019 Notes or the 2021 Notes for each trading day of the measurement period was less than 98%
of the product of the last reported sale price of our common stock and the conversion rate on each such trading
day;
if we elect to distribute assets or property to all or substantially all of the holders of our common stock and those
assets or other property have a value of more than 25% of the average daily volume-weighted average trading
price of our common stock for the prior 20 consecutive trading days;
if we elect to redeem the Cash Convertible Notes; or
if we experience certain customary events of default, including defaults under certain other indebtedness.
during any fiscal quarter ending after September 30, 2017, if the arithmetic mean of the last reported sale prices
of the Common Stock during a period of 20 consecutive trading days selected from the 30 consecutive trading
days ending on and including the final trading day of the immediately preceding quarter is equal to or more than
130% of the conversion price (i.e., USD 200,000 minimum denomination divided by the applicable Conversion
Ratio) applicable on the last day of such preceding quarter;
in the event of early redemption at the option of the Issuer of all the outstanding Notes, where the conversion date
falls in the period from (and including) the date on which the notice of redemption is published up to the 10th
calendar day preceding the date of such early redemption;
in the event of a planned distribution by the Issuer of cash, assets, securities or other property, which has a per
share value greater than 25% of the arithmetic mean of the volume weighted average price (VWAP) of the
Common Stock during the 20 consecutive trading day period immediately preceding the date on which the
planned distribution is announced by the Issuer, at any time following such notice, which shall be at least 20
scheduled trading days prior to the ex-dividend date for such distribution, until the earlier of (i) the fifth business
day immediately preceding the ex-dividend date for such distribution and (ii) the Issuer's announcement that such
planned distribution will not take place;
in the event of certain Fundamental Changes or Make-Whole Fundamental Changes (each as described below),
where the conversion date falls in the period from the 60th scheduled trading day prior to the anticipated effective
date of such Fundamental Change or Make-Whole Fundamental Change (or, if later, public announcement of the
same by the Issuer), until (i) the fifth business day immediately preceding the related Fundamental Change
Repurchase Date, or (ii) in the case of a Make-Whole Fundamental Change that does not constitute a Fundamental
Change, the 60th trading day immediately following such effective date (or, if later in either case, the 60th
calendar day following the notification of such Fundamental Change or Make-Whole Fundamental Change);
at any time from and after the occurrence of an event of default, until such event of default has been cured or
waived or the principal amount of the Notes shall have been accelerated; or
if a Parity Event or a Trading Price Unavailability Event, as the case may be, occurs, the period of 10 Business
Days from and including the first Business Day following the relevant Trading Price Notification Date.

For the 2023 Notes, the initial conversion rate is 4,829.7279 shares of our common stock per $200,000 principal
amount of the 2023 Notes (reflecting an initial conversion price of approximately $41.4102 per share of common
stock). As adjusted by the synthetic share repurchase discussed in Note 17, the conversion rate for the 2019 Notes
and 2021 Notes is 7,063.1647 shares of our common stock per $200,000 principal amount of Cash Convertible
Notes (reflecting an adjusted conversion price of approximately $28.32 per share of common stock). Upon
conversion, holders are entitled to a cash payment (Cash Settlement Amount) equal to the average of the conversion
rate multiplied by the daily volume-weighted average trading price for our common stock over a 50-day period. The
conversion rate is subject to adjustment in certain instances but will not be adjusted for any accrued and unpaid
interest. In addition, following the occurrence of certain corporate events that may occur prior to the applicable
maturity date, we may be required to pay a cash make-whole premium by increasing the conversion rate for any
holder who elects to convert Cash Convertible Notes in connection with the occurrence of such a corporate event,
but in no event will the Conversion Ratio exceed 6,728.6463 per $200,000 principal amount of Notes.
We may redeem the 2019, 2021 or 2023 Notes in their entirety at a price equal to 100% of the principal amount
of the applicable Cash Convertible Notes plus accrued interest at any time when 20% or less of the aggregate
principal amount of the applicable Cash Convertible Notes originally issued remain outstanding.
Because the Cash Convertible Notes contain an embedded cash conversion option, we have determined that the
embedded cash conversion option is a derivative financial instrument, which is required to be separated from the
Cash Convertible Notes and accounted for separately as a derivative liability, with changes in fair value reported in
our consolidated statements of income until the cash conversion option transaction settles or expires. The initial fair
value liability of the embedded cash conversion option was $105.2 million and for the 2023 Notes was $74.5
million, which simultaneously reduced the carrying value of the Cash Convertible Notes (effectively an original
issuance discount). For further discussion of the derivative financial instruments relating to the Cash Convertible
Notes, refer to Note 13.
As noted above, the reduced carrying value on the Cash Convertible Notes resulted in a debt discount that is
amortized to the principal amount through the recognition of non-cash interest expense using the effective interest
method over the expected life of the debt, which is five, seven and six years for the 2019 Notes, 2021 Notes and
2023 Notes, respectively. This resulted in our recognition of interest expense on the Cash Convertible Notes at an
effective rate approximating what we would have incurred had nonconvertible debt with otherwise similar terms
been issued. The effective interest rate of the 2019 Notes, 2021 Notes and 2023 Notes is 2.937%, 3.809% and
3.997%, respectively, which is imputed based on the amortization of the fair value of the embedded cash conversion
option over the remaining term of the Cash Convertible Notes. As of December 31, 2017, we expect the 2019
Notes, 2021 Notes and 2023 Notes to be outstanding until their respective maturity dates. Based on an estimation
using available over-the-counter market information on the Cash Convertible Notes, the Level 2 fair value of the 2019
Notes, 2021 Notes and 2023 Notes was $498.8 million, $366.0 million and $404.8 million at December 31,
2017. Based on an estimation using available over-the-counter market information on the Cash Convertible Notes,
the Level 2 fair value of the 2019 Notes and 2021 Notes was $485.9 million and $346.6 million, at December 31,
2016.
In connection with the issuance of the 2019 and 2021 Cash Convertible Notes, we incurred approximately $13.1
million in transaction costs. We incurred approximately $6.2 million in transaction costs for the 2023 Cash
Convertible Notes of which $0.6 million was accrued as of December 31, 2017. Such costs have been allocated to
the Cash Convertible Notes and deferred as a long-term asset and are being amortized to interest expense over the
terms of the Cash Convertible Notes using the effective interest method.
Interest expense related to the Cash Convertible Notes was comprised of the following:

Cash Convertible Notes Call Spread OverlayConcurrent with the issuance of the Cash Convertible Notes, we entered into privately negotiated hedge transactions
(Call Options) with, and issued warrants to purchase shares of our common stock (Warrants) to, certain financial
institutions. We refer to the Call Options and Warrants collectively as the “Call Spread Overlay”. The Call Options
are intended to offset any cash payments payable by us in excess of the principal amount due upon any conversion
of the Cash Convertible Notes. During 2014, we used $105.2 million of the proceeds from the issuance of the 2019
and 2021 Cash Convertible Notes to pay for the Call Options, and simultaneously received $69.4 million from the
sale of the Warrants, for a net cash outlay of $35.8 million for the Call Spread Overlay.
During 2017, we used $73.6 million of the proceeds from the from the issuance of the 2023 Cash Convertible
Notes to pay for the premium for the Call Option, and simultaneously received $45.4 million from the sale of
Warrants, for a net cash outlay of $28.3 million for the Call Spread Overlay. Issuance costs incurred in connection
with the Warrant and the Call Option were $0.3 million and $0.1 million respectively, which $0.1 million was
accrued as of December 31, 2017.
The Call Options are derivative financial instruments and are discussed further in Note 13. The Warrants are equity
instruments and are further discussed in Note 17.
Aside from the initial payment of a premium of $105.2 million (2019 and 2021 Notes) and $73.6 million (2023
Notes) for the Call Option, we will not be required to make any cash payments under the Call Options, and will be
entitled to receive an amount of cash, generally equal to the amount by which the market price per share of our
common stock exceeds the exercise price of the Call Options during the relevant valuation period. The exercise price
under the Call Options is initially equal to the conversion price of the Cash Convertible Notes.
The Warrants cover an aggregate of 25.8 million shares in connection with the 2019 and 2021 Notes of our
common stock (subject to anti-dilution adjustments under certain circumstances) and have an initial exercise price of
$32.085 per share, subject to customary adjustments. The Warrants expire as follows: Warrants to purchase 15.2
million shares expire over a period of 50 trading days beginning on December 27, 2018 and Warrants to purchase
10.6 million shares expire over a period of 50 trading days beginning on December 29, 2020. The Warrants are
European-style (exercisable only upon expiration).
Concurrent with the 2023 Notes, we issued Warrants which cover 9.7 million shares of our common stock (subject
to anti-dilution adjustments under certain circumstances) and have an initial exercise price of $50.9664 per share,
subject to customary adjustments. The Warrants expire as follows: Warrants to purchase 9.7 million shares expire
over a period of 50 trading days beginning on June 26, 2023. The Warrants are European-style (exercisable only
upon expiration).
The Warrants that were issued with our Cash Convertible Notes discussed above, could have a dilutive effect to the
extent that the price of our common stock exceeds the applicable strike price of the Warrants. For each Warrant that
(in thousands)
Year-Ended December 31
2017 2016
Coupon interest $ 4,832 $ 4,238
Amortization of original issuance discount 21,377 17,503
Amortization of debt issuance costs 2,615 2,279
Total interest expense related to the Cash Convertible Notes $ 28,824 $ 24,020

is exercised, we will deliver to the holder a number of shares of our common stock equal to the amount by which the
settlement price exceeds the exercise price, plus cash in lieu of any fractional shares. We will not receive any
proceeds if the Warrants are exercised.
Private PlacementIn October 2012, we completed a private placement through the issuance of new senior unsecured notes at a total
amount of $400 million with a weighted average interest rate of 3.66% (settled on October 16, 2012). The notes
were issued in three series: (1) $73 million 7-year term due in 2019 (3.19%); (2) $300 million 10-year term due in
2022 (3.75%); and (3) $27 million 12-year term due in 2024 (3.90%). We paid $2.1 million in debt issue costs
which will be amortized through interest expense using the effective interest method over the lifetime of the notes. The
note purchase agreement contains certain financial and non-financial covenants, including but not limited to,
restrictions on priority indebtedness and the maintenance of certain financial ratios. We were in compliance with
these covenants at December 31, 2017. Based on an estimation using the changes in the U.S. Treasury rates, the
Level 2 fair value of these senior notes as of December 31, 2017 and December 31, 2016 was approximately
$394.7 million and $397.1 million, respectively. During 2014, we entered into interest rate swaps, which effectively
fixed the fair value of $200.0 million of this debt and qualify for hedge accounting as fair value hedges as
described in Note 13.
German Private Placement (Schuldschein)In 2017, we completed a German private placement bond ("Schuldschein") which was issued in several tranches
totaling $331.1 million due in various periods through 2027. The Schuldschein consists of U.S. dollar and Euro
denominated tranches. The Euro tranches are designated as a foreign currency non-derivative hedging instrument
that qualifies as a net investment hedge as described in Note 13 "Derivatives and Hedging". Based on the spot rate
method, the change in the carrying value of the Euro denominated tranches attributed to the net investment hedge as
of December 31, 2017 totaled $19.8 million of unrealized loss and is recorded in equity. We paid $1.2 million in
debt issuance costs which are being amortized through interest expense over the lifetime of the notes. A summary of
the tranches as of December 31, 2017 is as follows:
2004 NotesIn August 2004, we completed the sale of $150 million of 1.5% Senior Convertible Notes due in 2024 (2004
Notes), through our unconsolidated subsidiary QIAGEN Finance. The net proceeds of the 2004 Notes were loaned
by QIAGEN Finance to consolidated subsidiaries with an effective interest rate of 1.8% were due in February 2024.
Interest was payable semi-annually in February and August. The 2004 Notes were issued at 100% of principal
value, and were convertible into 11.5 million common shares at the option of the holders upon the occurrence of
Currency Notional Amount Interest Rate Maturity Carrying Value as of December 31, 2017 (in thousands)
EUR €11.5 million Fixed 0.4% March 2021 $ 13,660
EUR €23.0 million Floating EURIBOR + 0.4% March 2021 27,320
EUR €21.5 million Fixed 0.68% October 2022 25,535
EUR €64.5 million Floating EURIBOR + 0.5% October 2022 76,605
USD $45.0 million Floating LIBOR + 1.2% October 2022 44,862
EUR €25.0 million Floating EURIBOR + 0.5% October 2022 31,792
EUR €64.0 million Fixed 1.09% June 2024 76,005
EUR €31.0 million Floating EURIBOR + 0.7% June 2024 36,815
EUR €14.5 million Fixed 1.61% June 2027 17,218
$ 349,812

certain events at a price of $12.6449 per share, subject to adjustment. QIAGEN N.V. had an agreement with
QIAGEN Finance to issue shares to the investors in the event of conversion. The subscription right, along with the
related receivable, was recorded at fair value in the equity of QIAGEN N.V. as paid-in capital. In 2014, 1.2 million
common shares were issued in connection with the conversions. During 2015, we repaid the loan to QIAGEN
Finance and repurchased the warrant agreement with QIAGEN Finance for $250.9 million and recognized a loss of
$7.6 million in other expense, net. The repayment amount was allocated to the loan and warrants on a relative fair
value basis with $113.0 million recorded against additional paid in capital for the redemption of the warrant
subscription receivable. Subsequent to these transactions QIAGEN Finance was liquidated.
16. Income Taxes
On December 22, 2017, President Trump signed into law the Tax Cuts and Jobs Act (H.R.1) (the “2017 Tax Act”).
The 2017 Tax Act includes a number of changes to existing U.S. tax laws that impact us, most notably a reduction of
the U.S. corporate income tax rate from 35% to 21% effective as of January 1, 2018 and a new net interest expense
deduction limitation, which limits the deduction of net interest expense to 30% of the taxpayer’s adjusted taxable
income (ATI). The 2017 Tax Act also provides the acceleration of depreciation for certain assets placed into service
after September 27, 2017 as well as prospective changes including repeal of the domestic manufacturing deduction
beginning in 2018 and capitalization of research and development expenditures beginning in 2022.
In December 2017, the SEC staff issued Staff Accounting Bulletin No. 118, Income Tax Accounting Implications of
the Tax Cuts and Jobs Act (“SAB 118”), which allows us to record provisional amounts during a measurement period
not to extend beyond one year of the enactment date. For those specific income tax effects of the 2017 Tax Act for
which the accounting under ASC Topic 740 is incomplete, a reasonable estimate was determined. We have
recognized the provisional tax impacts related to the interest expense deduction limitation and the revaluation of
deferred tax assets and liabilities and included these amounts in our consolidated financial statements for the year
ended December 31, 2017. The ultimate impact may differ from these provisional amounts due to additional
analysis, changes in interpretations and assumptions that we have made, additional regulatory guidance that may
be issued, and actions we may take because of the 2017 Tax Act. We did not identify items for which the income
tax effects of the 2017 Tax Act have not been completed and a reasonable estimate could not be determined as of
December 31, 2017. We expect to complete our analysis within the measurement period in accordance with
SAB118.
Income before income taxes for the years ended December 31, 2017, 2016 and 2015 consisted of:
Income taxes for the years ended December 31, 2017, 2016 and 2015 are as follows:
(in thousands) 2017 2016 2015
Pretax income in The Netherlands $ 42,220 $ 20,695 $ 1,310
Pretax income from foreign operations 72,155 36,213 134,993
$ 114,375 $ 56,908 $ 136,303

The Netherlands statutory income tax rate was 25% for the years ended December 31, 2017, 2016 and 2015.
Income from foreign subsidiaries is generally taxed at the statutory income tax rates applicable in the respective
countries of domicile. The principal items comprising the differences between income taxes computed at The
Netherlands statutory rate and our reported income taxes and effective tax rate for the years ended December 31,
2017, 2016 and 2015 are as follows:
(1) Our effective tax rate reflects the benefit of our global operations where certain income or loss is taxed at rates higher orlower than The Netherlands’ statutory rate of 25% as well as the benefit of some income being partially exempt from incometaxes due to various intercompany operating and financing activities. The most significant tax benefits from these foreignoperations and financing activities are attributable to subsidiaries in Germany, Singapore, Switzerland, Ireland andLuxembourg. These foreign tax benefits are due to a combination of favorable tax laws, regulations, rulings, and exemptionsin these jurisdictions. Additionally in 2016, in certain foreign jurisdictions (primarily Germany and the U.S.), we recordedacquisition related and impairment charges which reduced pretax income in these higher tax jurisdictions.
(2) During 2017, we increased accruals for tax contingencies, primarily related to ongoing income tax audits.
(3) During 2017, we revalued our U.S. deferred tax assets and liabilities to reflect the corporate income tax rate change from35% to 21% as a result of U.S. tax reform. Additionally, we recorded a full valuation allowance of $60.8 million againstdeferred tax assets related to U.S. interest carry forwards. Based on the current debt level in the U.S., along with the newrestrictive interest limitation enacted with the new U.S. tax reform, it is highly unlikely that the historic U.S. interest carryforward will ever be utilized. We also recorded full valuation allowances against other deferred tax assets on tax losses dueto unlikely future profits in other jurisdictions.
(4) h b f f h b d fl d d f h
(in thousands) 2017 2016 2015
Current—The Netherlands $ 3,430 $ 6,043 $ 973
—Foreign 10,375 34,543 37,708
13,805 40,586 38,681
Deferred—The Netherlands 151 188 250
—Foreign 60,025 (64,169) (32,530)
60,176 (63,981) (32,280)
Total income tax expense (benefit) $ 73,981 $ (23,395) $ 6,401
(in thousands)
2017 2016 2015
Amount Percent Amount Percent Amount Percent
Income taxes at The Netherlands statutory $ 28,594 25.0 % $ 14,227 25.0 % $ 34,076 25.0 %
Taxation of foreign operations, net(1) (38,635) (33.8) (43,265) (76.0) (36,407) (26.7)
Tax impact from permanent items (1,586) (1.4) 5,938 10.4 14,219 10.4
Tax impact from tax-exempt income (1,558) (1.4) (3,331) (5.9) (5,810) (4.3)
Tax contingencies, net(2) 23,189 20.3 1,761 3.1 1,163 0.9
Taxes due to changes in tax rates(3) 12,958 11.3 399 0.7 (836) (0.6)
Stock Compensation(4) (5,237) (4.6) — — — —
Government incentives and other (4,949) (4.3) (2,543) (4.5) (2,754) (2.0)
Prior year taxes (2,319) (2.0) 1,411 2.5 (1,201) (0.9)
Valuation allowance(3) 62,644 54.8 1,521 2.7 3,450 2.5
Other items, net 880 0.8 487 0.9 501 0.4
Total income tax expense (benefit) $ 73,981 64.7 % $ (23,395) (41.1)% $ 6,401 4.7 %

(4) Beginning in 2017, the excess tax benefits from share-based compensation activity are reflected as a reduction of theprovision for income taxes, whereas previously they were recognized in equity.
(5) Government incentives include favorable tax regulations in the U.S. and the U.K. and relating to research anddevelopment expense as well as the U.S. Internal Revenue Code Section 199 domestic production activities deduction.
We conduct business globally and, as a result, file numerous consolidated and separate income tax returns in The
Netherlands, Germany, Switzerland and the U.S. federal jurisdiction, as well as in various other state and foreign
jurisdictions. In the normal course of business, we are subject to examination by taxing authorities throughout the
world. Tax years in The Netherlands are open since 2005 for income tax examinations by tax authorities. Our
subsidiaries, with few exceptions, are no longer subject to income tax examinations by tax authorities for years
before 2013. The U.S. consolidated group is subject to federal and most state income tax examinations by tax
authorities beginning with the year ending December 31, 2014 through the current period.
Starting in February 2014, the U.S. tax authorities (Internal Revenue Service) have been auditing our U.S. federal tax
returns for 2011 and 2012. The audit was closed in 2016 without any tax adjustments. As a result, we released
$6.6 million of unrecognized tax benefit due to closure of the tax audit. Additionally, in February 2016 German tax
authorities began the audit of the German tax returns for the 2010-2013 tax years. This audit is currently in process
and we expect the audit to close during 2018.
Changes in the amount of unrecognized tax benefits are as follows:
At December 31, 2017 and 2016, our net unrecognized tax benefits totaled approximately $44.0 million and
$18.3 million, respectively, of which $44.0 million and $18.3 million in benefits, if recognized, would favorably
affect our effective tax rate in any future period. It is reasonably possible that approximately $11.6 million of the
unrecognized tax benefits may be released during the next 12 months due to lapse of statute of limitations or
settlements with tax authorities; however, various events could cause our current expectations to change in the future.
The above unrecognized tax benefits, if ever recognized in the financial statements, would be recorded in the
statement of income as part of the income tax expense.
Our policy is to recognize interest accrued related to unrecognized tax benefits in interest expense and penalties
within income tax expense. For the years ended December 31, 2017, 2016 and 2015, we have net interest
(income) expense and penalties of $1.5 million, $0.1 million and $0.3 million, respectively. At December 31, 2017
and 2016, we have accrued interest of $3.0 million and $1.4 million, respectively, which are not included in the
table above.
(in thousands) Unrecognized Tax Benefits
BALANCE AT DECEMBER 31, 2015 $ 16,735
Additions based on tax positions related to the current year 4,218
Additions for tax positions of prior years 5,162
Decrease for tax position of prior years (6,796)
Reductions due to lapse of statute of limitations (288)
Decrease from currency translation (737)
BALANCE AT DECEMBER 31, 2016 $ 18,294
Additions based on tax positions related to the current year 12,212
Additions for tax positions of prior years 9,933
Increase from currency translation 3,594
BALANCE AT DECEMBER 31, 2017 $ 44,033

We have recorded net deferred tax liabilities of $37.4 million and deferred tax assets of $27.8 million at December
31, 2017 and 2016, respectively. The components of the net deferred tax asset and liability at December 31, 2017
and 2016 are as follows:
At December 31, 2017 and 2016, we had $432.7 million and $380.7 million in total foreign net operating loss
(NOL) carryforwards. Included in these amounts at December 31, 2017 and 2016, were $108.5 million and
$109.2 million of U.S. federal (NOL) carryforwards. At December 31, 2017, the entire NOL in the U.S. is subject to
limitations under Section 382 of the U.S. Internal Revenue Code. The NOLs in the U.S. will expire beginning
December 31, 2023 through December 31, 2033. Also included in the above amount as of December 31, 2017
and 2016, were other foreign NOL carryforwards totaling approximately $324.1 million and $271.5 million,
respectively, with $41.5 million added due to German trade tax loss generated in 2017. As of December 31, 2017,
we had NOL carryforwards in Germany of $225.0 million predominantly trade tax NOLs. Of the total $324.1
million foreign NOL carryforwards, $253.8 million does not expire with the balance expiring beginning December
2018 through 2032. The valuation allowance amounts related to net operating losses as of the years ended
December 31, 2017 and December 31, 2016 are $7.1 million and $5.5 million. In 2017, we recorded a valuation
allowance of $60.8 million related to U.S. interest carryforwards. Based on the current debt level in the U.S., along
with the new restrictive interest limitation enacted with the new U.S. tax reform, it is highly unlikely that the historic
U.S. interest carry forward will ever be utilized. We believe it is more likely than not that the deferred tax assets, net
of the valuation allowances, as shown above will be realized.
As of December 31, 2017, a deferred tax liability has not been recognized for residual income taxes in The
Netherlands on the undistributed earnings of the majority of our foreign subsidiaries as these earnings are
(in thousands)
2017 2016
Deferred Deferred Deferred Deferred
Net operating loss carryforwards $ 30,966 $ — $ 46,627 $ —
Accrued and other current liabilities 15,748 — 24,663 —
Inventories 4,163 (778) 2,919 (1,567)
Allowance for bad debts 739 (475) 1,060 (451)
Currency revaluation 4,095 (167) 3,474 (73)
Property, plant and equipment 1,103 (23,649) 2,096 (19,733)
Capital lease 531 — 830 —
Tax credit carryforwards 1,563 — 915 —
Unremitted profits and earnings — (998) — (923)
Intangible assets 1,289 (93,771) 586 (137,682)
Share-based compensation 18,143 — 20,282 —
Deferred interest deductions 60,790 — 76,793 —
Convertible debt 10,865 — 12,313 —
Other 2,632 (2,315) 2,652 (1,507)
152,627 (122,153) 195,210 (161,936)
Valuation allowance (67,849) — (5,511) —
$ 84,778 $ (122,153) $ 189,699 $ (161,936)
Net deferred tax assets (liabilities) $ (37,375) $ 27,763

considered to be either indefinitely reinvested or can be repatriated tax free under the Dutch participation exemption.
The indefinitely reinvested earnings retained by subsidiaries amounted to $381.9 million at December 31, 2017.
Estimating the amount of the unrecognized deferred tax liability on indefinitely reinvested foreign earnings is not
practicable. Should the earnings be remitted as dividends, we may be subject to taxes including withholding tax.
We have $22.9 million of undistributed earnings that we do not consider indefinitely reinvested and have recorded
deferred taxes or withholding taxes at December 31, 2017 and December 31, 2016, of $1.0 million and $0.9
million, respectively.
17. Equity
Issuance of WarrantsIn March 2014, in connection with the issuance of our Cash Convertible Notes, we issued Warrants (as described in
Note 15) for approximately 25.8 million shares of our common stock (subject to antidilution adjustments under
certain circumstances) with an exercise price of $32.085 per share, subject to customary adjustments. Following the
synthetic share repurchase discussed below, the adjusted exercise price is $32.056. The proceeds, net of issuance
costs, from the sale of the Warrants of approximately $68.9 million are included as additional paid in capital in the
accompanying consolidated balance sheets. The Warrants expire as follows: Warrants to purchase 15.2 million
shares expire over a period of 50 trading days beginning on December 27, 2018 and Warrants to purchase 10.6
million shares expire over a period of 50 trading days beginning on December 29, 2020.
In September 2017, concurrent with the issuance of our 2023 Cash Convertible Notes, we issued Warrants (as
described in Note 15) for approximately 9.7 million shares of our common stock (subject to anti-dilution adjustments
under certain circumstances) with an exercise price of $50.9664 per share, subject to customary adjustments. The
proceeds from the sale of the Warrants, net of issuance costs, of approximately $45.3 million are included as
additional paid in capital in the accompanying consolidated balance sheets. The warrants to purchase
approximately 9.7 million shares expire over a period of 50 trading days beginning on June 26, 2023.
The Warrants are exercisable only upon expiration. For each Warrant that is exercised, we will deliver to the holder
a number of shares of our common stock equal to the amount by which the settlement price exceeds the exercise
price, divided by the settlement price, plus cash in lieu of any fractional shares. The Warrants could separately have
a dilutive effect on shares of our common stock to the extent that the market value per share of our common stock
exceeds the applicable exercise price of the Warrants (as measured under the terms of the Warrants).
Share Repurchase ProgramsIn July 2014, we announced the launch of our third share repurchase program to purchase up to another $100
million of our common shares (excluding transaction costs). In 2014, 2.1 million QIAGEN shares were repurchased
for $49.1 million (excluding transaction costs) and in 2015, 0.8 million QIAGEN shares were repurchased for
$20.8 million.
On April 27, 2016, we announced the launch of our fourth $100 million share repurchase program which was
expected to be completed by the end of 2017. During the third quarter of 2017, 1.9 million QIAGEN shares were
repurchased for $61.0 million (including transaction costs).
On January 31, 2018, we announced our fifth share repurchase program of up to $200 million of our common
shares.
The cost of repurchased shares is included in treasury stock and reported as a reduction in total equity when a
repurchase occurs. Repurchased shares will be held in treasury in order to satisfy various obligations, which include
exchangeable debt instruments, warrants and employee share-based remuneration plans.
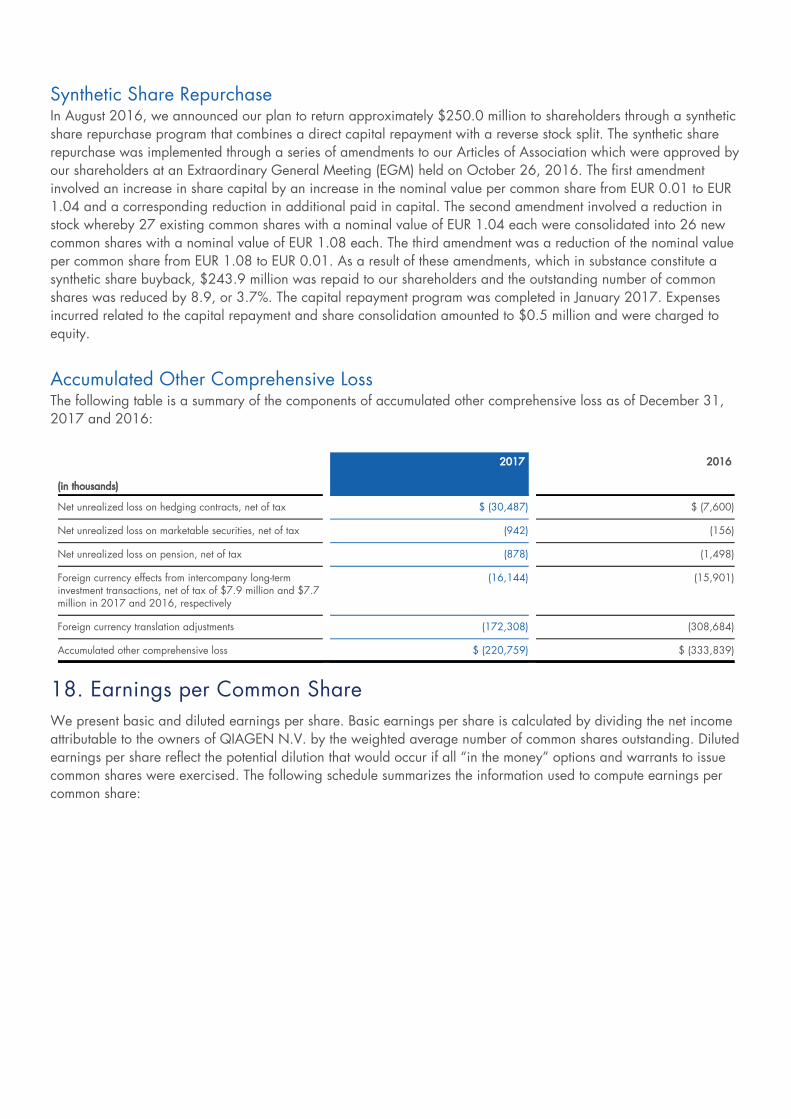
Synthetic Share RepurchaseIn August 2016, we announced our plan to return approximately $250.0 million to shareholders through a synthetic
share repurchase program that combines a direct capital repayment with a reverse stock split. The synthetic share
repurchase was implemented through a series of amendments to our Articles of Association which were approved by
our shareholders at an Extraordinary General Meeting (EGM) held on October 26, 2016. The first amendment
involved an increase in share capital by an increase in the nominal value per common share from EUR 0.01 to EUR
1.04 and a corresponding reduction in additional paid in capital. The second amendment involved a reduction in
stock whereby 27 existing common shares with a nominal value of EUR 1.04 each were consolidated into 26 new
common shares with a nominal value of EUR 1.08 each. The third amendment was a reduction of the nominal value
per common share from EUR 1.08 to EUR 0.01. As a result of these amendments, which in substance constitute a
synthetic share buyback, $243.9 million was repaid to our shareholders and the outstanding number of common
shares was reduced by 8.9, or 3.7%. The capital repayment program was completed in January 2017. Expenses
incurred related to the capital repayment and share consolidation amounted to $0.5 million and were charged to
equity.
Accumulated Other Comprehensive LossThe following table is a summary of the components of accumulated other comprehensive loss as of December 31,
2017 and 2016:
18. Earnings per Common Share
We present basic and diluted earnings per share. Basic earnings per share is calculated by dividing the net income
attributable to the owners of QIAGEN N.V. by the weighted average number of common shares outstanding. Diluted
earnings per share reflect the potential dilution that would occur if all “in the money” options and warrants to issue
common shares were exercised. The following schedule summarizes the information used to compute earnings per
common share:
(in thousands)
2017 2016
Net unrealized loss on hedging contracts, net of tax $ (30,487) $ (7,600)
Net unrealized loss on marketable securities, net of tax (942) (156)
Net unrealized loss on pension, net of tax (878) (1,498)
Foreign currency effects from intercompany long-term
investment transactions, net of tax of $7.9 million and $7.7million in 2017 and 2016, respectively
(16,144) (15,901)
Foreign currency translation adjustments (172,308) (308,684)
Accumulated other comprehensive loss $ (220,759) $ (333,839)

19. Commitments and Contingencies
Lease CommitmentsWe lease facilities and equipment under operating lease arrangements expiring in various years through 2024.
Certain rental commitments provide for escalating rental payments or have renewal options extending through
various years. Certain facility and equipment leases constitute capital leases expiring in various years through 2020.
The accompanying consolidated balance sheets include the assets and liabilities arising from these capital lease
obligations. Rent expense under operating lease agreements not including facility related costs accrued in
association with the restructuring activities discussed in Note 6 was $24.5 million, $22.4 million and $23.2 million
for the years ended December 31, 2017, 2016 and 2015, respectively.
Minimum future obligations under capital and operating leases at December 31, 2017 are as follows:
(in thousands, except per share data)
Years ended December 31,
2017 2016 2015
Net income attributable to the owners of QIAGEN N.V. $ 40,394 $ 80,404 $ 130,148
Weighted average number of common shares used to compute basic netincome per common share
228,074 234,800 233,483
Dilutive effect of stock options and restrictive stock units 4,760 4,193 5,028
Dilutive effect of outstanding warrants 175 — 136
Weighted average number of common shares used to compute diluted net
income per common share
233,009 238,993 238,647
Outstanding options and awards having no dilutive effect, not included inabove calculation
52 210 37
Outstanding warrants having no dilutive effect, not included in abovecalculation
30,434 25,800 26,071
Basic earnings per common share attributable to the owners of QIAGEN
N.V.
$ 0.18 $ 0.34 $ 0.56
Diluted earnings per common share attributable to the owners of QIAGEN
N.V.
$ 0.17 $ 0.34 $ 0.55
(in thousands)
Capital Leases Operating Leases
2018 $ 1,411 $ 18,483
2019 45 16,011
2020 14 11,762
2021 — 8,457
2022 — 6,126
Thereafter — 4,038
1,470 $ 64,877
Less: Amount representing interest (54)
1,416
Less: Current portion (1,359)
Long-term portion $ 57

Licensing and Purchase CommitmentsWe have licensing agreements with companies, universities and individuals, some of which require certain up-front
payments. Royalty payments are required on net product sales ranging from 0.45 percent to 20 percent of covered
products or based on quantities sold. Several of these agreements have minimum royalty requirements. The
accompanying consolidated balance sheets include accrued royalties relating to these agreements in the amount of
$6.7 million and $7.8 million at December 31, 2017 and 2016, respectively. Royalty expense relating to these
agreements amounted to $16.8 million, $35.9 million, and $43.2 million for the years ended December 31, 2017,
2016 and 2015, respectively. Royalty expense is primarily recorded in cost of sales, with a small portion recorded
as research and development expense depending on the use of the technology under license. Some of these
agreements also have minimum raw material purchase requirements and requirements to perform specific types of
research.
At December 31, 2017, we had commitments to purchase goods or services, and for future license and royalty
payments. They are as follows:
As of December 31, 2017, future license payments of $11.8 million and $35.3 million are included in accrued and
other current liabilities and other long-term liabilities, respectively.
Contingent Consideration CommitmentsPursuant to the purchase agreements for certain acquisitions we could be required to make additional contingent
cash payments totaling up to $18.5 million based on the achievement of certain revenue and operating results
milestones as follows: $11.5 million in 2018 and $7.0 million, payable in any 12-month period from now until
2029 based on the accomplishment of certain revenue targets. Of the $18.5 million total contingent obligation, we
have assessed the fair value at December 31, 2017, to be $11.5 million which is included in accrued liabilities in
the accompanying consolidated balance sheet.
Employment AgreementsCertain of our employment contracts contain provisions which guarantee the payments of certain amounts in the
event of a change in control, as defined in the agreements, or if the executive is terminated for reasons other than
cause, as defined in the agreements. At December 31, 2017, the commitment under these agreements totaled $16.8
million. The employment agreements with the Managing Directors and the German affiliate include a clause,
whereby the affiliate will compensate the Managing Directors for potential deductions under Dutch law which, since
2014, has introduced a duty to deduct from a Managing Director’s remuneration any increase in the value of shares
or options that were part of his pay to the extent that such increase is based on a public offer, merger or other
identity changing transaction.
(in thousands)
Purchase Commitments License & Royalty Commitments
2018 $ 65,073 $ 12,907
2019 22,556 11,858
2020 10,472 11,558
2021 943 8,860
2022 11 6,161
Thereafter 434 3,748
$ 99,489 $ 55,092

ContingenciesIn the ordinary course of business, we provide a warranty to customers that our products are free of defects and will
conform to published specifications. Generally, the applicable product warranty period is one year from the date of
delivery of the product to the customer or of site acceptance, if required. Additionally, we typically provide limited
warranties with respect to our services. From time to time, we also make other warranties to customers, including
warranties that our products are manufactured in accordance with applicable laws and not in violation of third-party
rights. We provide for estimated warranty costs at the time of the product sale. We believe our warranty reserves as
of December 31, 2017 and 2016 appropriately reflect the estimated cost of such warranty obligations.
Preacquisition ContingenciesIn connection with certain acquisitions, amounts were paid into escrow accounts to cover preacquisition
contingencies assumed in the acquisition. The escrow amounts that are certain to be claimed by QIAGEN are
recorded in prepaid expenses and other current assets and total $2.5 million as of December 31, 2017. As of
December 31, 2016, $2.5 million was recorded in other long-term assets in the accompanying consolidated
balance sheets.
LitigationFrom time to time, we may be party to legal proceedings incidental to our business. For the year ended December
31, 2017, we had settlement amounts related to various acquisition-related litigation matters totaling $49.2 million,
primarily related to PCR-based biomarker disputes and patent litigation, which were settled during 2017 of which
$45.3 million was recorded to general and administrative, restructuring, integration and other expense and $3.9
million was recorded as a license right. $44.8 million of the settlement amounts were paid during 2017 and as of
December 31, 2017, $4.4 million was accrued in accrued and other current liabilities.
As of December 31, 2017, certain claims, suits or legal proceedings arising out of the normal course of business
have been filed or were pending against QIAGEN or its subsidiaries. These matters have arisen in the ordinary
course and conduct of business, as well as through acquisition. Although it is not possible to predict the outcome of
such litigation, we assess the degree of probability and evaluate the reasonably possible losses that we could incur
as a result of these matters. We accrue for any estimated loss when it is probable that a liability has been incurred
and that the amount of the probable loss can be estimated. Based on the facts known to QIAGEN and after
consultation with legal counsel, management believes that such litigation will not have a material adverse effect on
QIAGEN’s financial position or results of operations.
20. Share-Based Compensation
We adopted the QIAGEN N.V. Amended and Restated 2005 Stock Plan (the 2005 Plan) in 2005 and the QIAGEN
N.V. 2014 Stock Plan (the 2014 Plan) in 2014. The 2005 Plan expired by its terms in April 2015 and no further
awards will be granted under the 2005 Plan. The plans allow for the granting of stock rights and incentive stock
options, as well as non-qualified options, stock grants and stock-based awards, generally with terms of up to 10
years, subject to earlier termination in certain situations. Generally, options vest over a 3-year period. The vesting
and exercisability of certain stock rights will be accelerated in the event of a Change of Control, as defined in the
plans. To date, all option grants have been at the market value on the grant date or at a premium above the closing
market price on the grant date. We issue Treasury Shares to satisfy option exercises and award releases and had
approximately 22 million Common Shares reserved and available for issuance under the 2005 and 2014 Plans at
December 31, 2017.
Stock OptionsWe have not granted stock options since 2013. A summary of the status of employee stock options as of December
31, 2017 and changes during the year then ended is presented below:

The total intrinsic value of options exercised during the years ended December 31, 2017, 2016 and 2015 was
$3.3 million, $3.2 million and $7.0 million, respectively. At December 31, 2017, there was no unrecognized share-
based compensation expense related to employee stock option awards.
At December 31, 2017, 2016 and 2015, 1.1 million, 1.4 million and 1.7 million options were exercisable at a
weighted average price of $19.54, $19.84 and $19.27 per share, respectively. The options outstanding at
December 31, 2017 expire in various years through 2023.
Stock UnitsStock units represent rights to receive Common Shares at a future date and include restricted stock units which are
subject to time-vesting only and performance stock units which include performance conditions in addition to time-
vesting. The final number of performance stock units earned is based on the performance achievement which for
some grants can reach up to 120% of the granted shares. There is no exercise price and the fair market value at the
time of the grant is recognized over the requisite vesting period, generally 3 to 5 years, and in certain grants 10
years. The fair market value is determined based on the number of stock units granted and the market value of our
shares on the grant date. Pre-vesting forfeitures were estimated to be approximately 7.0%. At December 31, 2017,
there was $67.5 million remaining in unrecognized compensation cost including estimated forfeitures related to these
awards, which is expected to be recognized over a weighted average period of 2.35 years. The weighted average
grant date fair value of stock units granted during the years ended December 31, 2017, 2016 and 2015 was
$31.12, $23.81 and $24.91, respectively. The total fair value of stock units that vested during the years ended
December 31, 2017, 2016 and 2015 was $69.2 million, $27.4 million and $28.7 million, respectively.
A summary of stock units as of December 31, 2017 and changes during the year are presented below:
Compensation ExpenseShare-based compensation expense before taxes for the years ended December 31, 2017, 2016 and 2015 totaled
approximately $34.4 million, $28.3 million and $23.8 million, respectively, as shown in the table below.
All Employee OptionsNumber of Shares
(in thousands)Weighted Average
Exercise Price
Weighted Average
Contractual Term (inyears)
Aggregate IntrinsicValue (in thousands)
Outstanding at January 1, 2017 1,439 $ 19.84
Exercised (287) $ 21.08
Expired (3) $ 18.63
Outstanding at December 31, 2017 1,149 19.54 3.32 13,088
Vested at December 31, 2017 1,149 19.54 3.32 13,088
Vested and expected to vest at December 31, 2017 1,149 19.54 3.32 13,088
Stock Units
Stock Units (inthousands)
Weighted Average ContractualTerm (in years)
Aggregate Intrinsic Value (inthousands)
Outstanding at January 1, 2017 10,198
Granted 1,976
Vested (2,306)
Forfeited (1,766)
Outstanding at December 31, 2017 8,102 2.30 $ 250,603
Vested and expected to vest at December 31, 2017 6,914 2.15 $ 213,861

(1)
Does not include the excess tax benefit realized for the tax deductions of the share-based payment arrangements totaled$5.2 million, $0.8 million and $3.3 million, respectively, for the years ended December 31, 2017, 2016 and 2015.
Following the 2016 restructuring program discussed in Note 6, share-based compensation expense in 2017 and
2016 includes forfeitures of $0.7 million and $2.0 million, respectively, in connection with the restructuring
terminations. Total share-based compensation expense in 2015 was lower following a reassessment on stock units
with performance criteria. No share-based compensation cost was capitalized in inventory in December 31, 2017,
2016 or 2015 as the amounts were not material.
21. Employee Benefits
We maintain various benefit plans, including defined contribution and defined benefit plans. Our U.S. defined
contribution plan is qualified under Section 401(k) of the Internal Revenue Code, and covers substantially all U.S.
employees. Participants may contribute a portion of their compensation not exceeding a limit set annually by the
Internal Revenue Service. This plan includes a provision for us to match a portion of employee contributions. Total
expense under the 401(k) plans, including the plans acquired via business acquisitions, was $3.6 million, $2.5
million and $2.4 million for the years ended December 31, 2017, 2016 and 2015, respectively. We also have a
defined contribution plan which covers certain executives. We make matching contributions up to an established
maximum. Matching contributions made to the plan, and expensed, totaled approximately $0.3 million in each year
ended December 31, 2017, 2016 and 2015.
We have five defined benefit, non-contributory retirement or termination plans that cover certain employees in
Germany, France, Japan, Italy and the United Arab Emirates. These defined benefit plans provide benefits to
covered individuals satisfying certain age and/or service requirements. For certain plans, we calculate the vested
benefits to which employees are entitled if they separate immediately. The benefits accrued on a pro-rata basis
during the employees’ employment period are based on the individuals’ salaries, adjusted for inflation. The liability
under the defined benefit plans was $8.0 million at December 31, 2017 and $6.7 million at December 31, 2016,
and is included as a component of other long-term liabilities on the accompanying consolidated balance sheets.
22. Related Party Transactions
From time to time, we have transactions with other companies in which we hold an interest all of which are
individually and in the aggregate immaterial, as summarized in the table below.
Compensation Expense (in thousands)
2017 2016 2015
Cost of sales $ 2,641 $ 2,553 $ 2,177
Research and development 5,367 4,735 5,686
Sales and marketing 6,820 4,824 4,815
General and administrative 19,614 16,176 11,083
Share-based compensation expense 34,442 28,288 23,761
Less: income tax benefit (1) 7,407 6,223 5,751
Net share-based compensation expense $ 27,035 $ 22,065 $ 18,010

During 2017, we purchased a convertible note for $3.0 million from a publicly listed company considered a related
party. The note is due in October 2020 and bears interest of 3.0%. As of December 31, 2017, the principal and
accrued interest of this note totals $2.7 million while the remaining $0.2 million is attributable to the embedded
derivative, that is bifurcated and measured at fair value, associated to a convertible feature of this note. Also in
2017, we granted a loan to a member of management totaling €0.6 million ($0.7 million as of December 31,2017) bearing interest at 2.0% annually. Repayment is forgiven with continued employment at the rate of €0.1million plus accrued interest annually. These are included in other long-term assets in the accompanying consolidated
balance sheet.
Additionally, we have two loan receivables due from related parties granted prior to 2017. The first loan, with a
balance of $11.3 million including accrued interest at December 31, 2017, was originally granted in 2015 and
subsequently increased during 2016. This loan is due in January 2020 and bears interest of 6%. The second loan,
also granted in 2015, has a principal of €2.0 million and is due in June 2019. This loan bears interest of 7% andas of December 31, 2017 carries a balance of $2.9 million including accrued interest. The loans were made for
general business purposes and no amounts have been repaid. These loans are included in other long-term assets in
the accompanying consolidated balance sheet as of December 31, 2017.
As discussed in Note 10, during 2016 we acquired a 19.0% interest in Hombrechtikon Systems Engineering AG
(HSE) for a total obligation of $9.8 million payable over three years. As of December 31, 2017, the total remaining
obligation was $6.2 million, of which $3.1 million was included in accrued and other current liabilities and $3.1
million was included in other long-term liabilities in the accompanying consolidated balance sheet. HSE is a variable
interest entity and we are not the primary beneficiary, therefore HSE is not consolidated.
23. Subsequent Events
On January 31, 2018, we announced our fifth share repurchase program of up to $200 million of our common
shares beginning in 2018 as well as the acquisition of STAT-Dx for approximately $147 million in cash and
additional payments of up to approximately $44 million based on the achievement of regulatory and commercial
milestones. The acquisition is expected to be completed in 2018 and funded from existing cash reserves.
In January 2018, a partnership became effective with a Chinese company that has taken over R&D, commercial
distribution, and the related QIAGEN employees and infrastructure of the HPV test franchise in China.
(in thousands)
As of December 31, For the years ended December 31,
2017 2016 2017 2016 2015
Net sales — — $ 3,852 $ 1,360 $ 418
Reimbursements against research and development — — — — $ 2,032
Accounts receivable $ 3,802 $ 1,302 — — —
Other long-term assets $ 17,713 $ 13,067 — — —
Accounts payable $ 1,921 $ 391 — — —
Accrued and other current liabilities $ 9,028 $ 3,926 — — —
Other long-term liabilities $ 3,075 $ 5,889 — — —