noteholder presentation q4 2014 - vue international · this presentation contains...
TRANSCRIPT

25 March 2015
Noteholder presentation
Q4 2014
2 2
IMPORTANT: You must read the following before continuing
PRESENTATION OF FINANCIAL DATA
This presentation should be read in conjunction with the Vougeot Bidco plc (“Bidco”) Quarterly Report (the “Report”) to Noteholders for the period ended 27 November 2014 (“Q4 2014”), released on Wednesday 25 March 2015. This report is available on our website at http://corporate.myvue.com/home/investor-relations. This presentation refers to market information obtained from third party sources. “Market Admissions” for UK and Italy are a measure of paid and unpaid box office admissions and are sourced from the Cinema Advertising Association (“CAA”) and Cinetel respectively. Market Admissions for Germany and Poland includes only paid admissions and the sources are Rentrak through www.IBOE.com and www.boxoffice.pl respectively. Gross Box Office Revenue (“GBOR”) measures box office revenue including local sales taxes by film and in aggregate. Market GBOR refers to total GBOR for markets referred to. “Major Territories” and “Vue Major Territories” specifically refer to UK, Germany, Poland and Italy being the major markets in which Bidco operates. Major Territories Total Market GBOR and Vue Major Territories GBOR are aggregated measures of GBOR for the total market and for Bidco. “Market Share” is Vue Major Territories GBOR as a proportion of Major Territories Total Market GBOR. Market and Vue GBOR information for UK & Ireland and Germany is sourced from Rentrak through www.IBOE.com, Poland from www.boxoffice.pl and Italy from Cinetel. Bidco was incorporated on 2 May 2013 and began trading following its acquisition of Vue Entertainment International Ltd (VEIL) on 8 August 2013. Comparative data for the 16 week trading period from 8 August 2013 to 28 November 2013 is reflected in information presented on an “As Acquired” basis, being the unaudited consolidated profit and loss account (page 12 of the report) and the unaudited interim condensed consolidated accounts (in addition to the report). A reconciliation between the Bidco As Acquired profit and loss account and the unaudited interim condensed consolidated accounts is provided on page 13 of the report. Pro Forma Bidco financial and operating data (“Pro Forma”) has been included to provide a more meaningful view of the recent trading of the business and to enable comparison of the quarter and year to date to the prior year. The Pro Forma financial information presented in this report has been derived from the consolidated financial statements of Bidco, VEIL, the pre-acquisition consolidated financial information of Multikino S.A. (“Multikino”) and the pre-acquisition consolidated financial information of Capitolosette S.r.l. and its subsidiaries which includes The Space Entertainment S.p.A. (together “TSC”), adjusted to give pro forma effect to (i) IFRS and Polish GAAP to UK GAAP differences, (ii) the VEIL acquisition, (iii) the Financing (as defined in the Offering Memorandum), and the application of the proceeds there from. The transactions are deemed to have occurred on November 29, 2012 for the purposes of the income statement. The Pro Forma financial information also includes the Pro Forma savings resulting from the strategic decision made by the board of directors of the Company has made the strategic decision to purchase certain contractual digital equipment related to the projection of 3D Films. This decision will result in significant savings in costs and an associated increase in consolidated EBITDA. The Company currently has license arrangements on rolling 5 year terms and where such licenses have terminated or will terminate within the next 24 months the Company has added back the associated cost savings in arriving at Consolidated EBITDA. At 27 November 2014 the increase in Consolidated EBITDA resulting from this reduction in administration expenses is £3.0m, an increase in Q4 2014 of £0.1m from the £2.9m Consolidated EBITDA benefit recognised at 28 August 2014. As a consequence of this strategic decision we estimate that we will incur capital expenditure of £2.9m in respect of the licenses which expire over the next 24 months. Such capital equipment might result in maintenance costs but this is considered to be immaterial.
DISCLAIMER This presentation is for information purposes only and does not constitute an offer to sell or the solicitation of an offer to buy securities. This presentation does not contain all of the information that is material to an investor. Forward-Looking Statements This presentation contains “forward-looking statements” as that term is defined by the U.S. federal securities laws and within the meaning of the securities laws of certain other jurisdictions. These forward-looking statements include, without limitation, those regarding our intentions, beliefs or current expectations concerning our future financial condition and performance, results of operations and liquidity; our strategy, plans, objectives, prospects, growth, goals and targets; future developments in the markets in which we participate or are seeking to participate; and anticipated regulatory changes in the industry in which we operate. These statements often include words such as “anticipate,” “believe,” “could,” “estimates,” “expect,” “forecast,” “intend,” “may,” “plan,” “projects,” “should,” “suggests,” “targets,” “would,” “will,” and other similar expressions. These statements are not guarantees of performance or results. Many factors could affect our actual financial results or results of operations and could cause actual results to differ materially from those expressed in the forward-looking statements and projections. We undertake no obligation to review or confirm analysts’ expectations or estimates or to release publicly any revisions to any forward-looking statements to reflect events or circumstances after the date of this presentation.
Important information

Contents
4. Today’s Speakers
5. Vue At A Glance
6. Results Highlights
7. Market Performance – Admissions and GBOR
8. Market Performance – GBOR Monthly Phasing
9. Market Performance – Slate
13. Market Share
14. Financial Information – Turnover
15. Financial Information – Margin and Costs
16. Financial Information – Cash flow
17. Financial Information – Capital Structure and Leverage
18. Highlights and Recent Developments
19. Current Trading
20. Film slate – Q1 2015
21. Q&A
22. Financial calendar
3

Tim Richards CEO
Alan McNair Deputy CEO (Apologies)
Steve Knibbs COO
Today’s Speakers
Alison Cornwell CFO
4

UK & Ireland Footprint Germany & Denmark Footprint Poland Footprint
5
Notes: 1. Poland & Baltics includes Latvia and Lithuania. 2. Other includes Taiwan only. The Portuguese site was closed on 7 July 2014. 3. Multiplex cinema site defined as a site with five or more screens, calculated as a percentage of the total number of sites in the region.
Vue At A Glance As Of 27 November 2014
Aarhus
Odense Copenhagen
Berlin
Magdeburg
Halle
Dresden
Regensburg
Augsburg
Munich
Kiel
Wolfsburg
Hamburg Oldenburg
Bremen
Mulheim Essen
Krefeld Wuppertal
Trier Offenbach
Stuttgart
Heilbronn
Sindelfingen
Freiburg
Germany
Denmark
Gottingen
Wurzburg
Hannover Bielefeld
Italy Footprint
Sites 83 33 34 36 1 187
Multiplex % (3) 98.8% 97.0% 94.1% 100.0% 100.0% 97.9%
Screens 797 285 277 362 16 1737
% of screens with 100% stadium seating 96.0% 99.6% 100.0% 99.4% 100.0% 98.0%
GroupItalyPoland &
Baltics (1) Other
(2)As at 27 November 2014 UK & IrelandGermany &
Denmark
Elbląg Gdańsk
Sopot Gdynia
Rumia Słupsk
Koszalin
Szczecìn
Bydgoszcz
Poznań Poland
Wloclawek
Lódź Radom
Warsaw
Kielce
Rzeszów Kraków
Rybnik
Zabrze
Wrocław
Zgorzelec
Tychy
Czechowice
Lublin
Katowice
Olsztyn
Cagliari
Cagliari Sestu
Catania
Catanzaro Lamezia
Surbo
Bari
Salerno Nola
Napoli
Montesilvano
Magliana Moderno
Guidonia
Terni Perugia
Novoli
Bologna
Grosseto
Livorno
Parma Parma Campus
Genova
Beinasco
Rozzano Torino
Cerro Vimercate
Odeon
Trieste
Udine Treviso
Padova
Vicenza Verona
Montabello
Dublin
Inverness
Aberdeen
Glasgow Edinburgh
London
Cardiff
Birmingham
Manchester
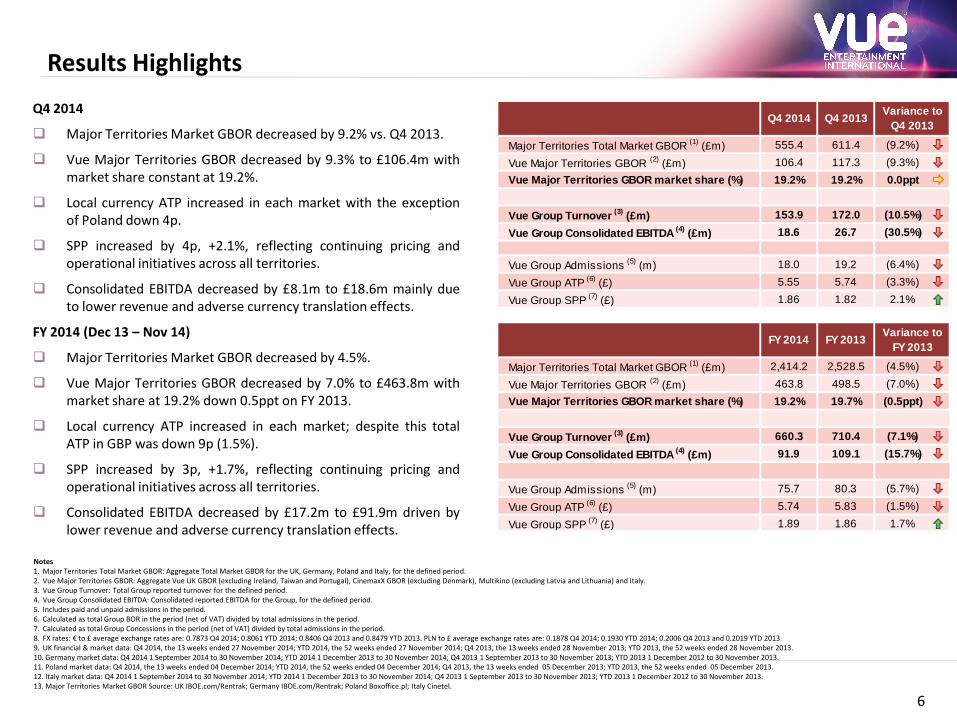
Q4 2014
Major Territories Market GBOR decreased by 9.2% vs. Q4 2013.
Vue Major Territories GBOR decreased by 9.3% to £106.4m with market share constant at 19.2%.
Local currency ATP increased in each market with the exception of Poland down 4p.
SPP increased by 4p, +2.1%, reflecting continuing pricing and operational initiatives across all territories.
Consolidated EBITDA decreased by £8.1m to £18.6m mainly due to lower revenue and adverse currency translation effects.
FY 2014 (Dec 13 – Nov 14)
Major Territories Market GBOR decreased by 4.5%.
Vue Major Territories GBOR decreased by 7.0% to £463.8m with market share at 19.2% down 0.5ppt on FY 2013.
Local currency ATP increased in each market; despite this total ATP in GBP was down 9p (1.5%).
SPP increased by 3p, +1.7%, reflecting continuing pricing and operational initiatives across all territories.
Consolidated EBITDA decreased by £17.2m to £91.9m driven by lower revenue and adverse currency translation effects.
Results Highlights
Notes 1. Major Territories Total Market GBOR: Aggregate Total Market GBOR for the UK, Germany, Poland and Italy, for the defined period. 2. Vue Major Territories GBOR: Aggregate Vue UK GBOR (excluding Ireland, Taiwan and Portugal), CinemaxX GBOR (excluding Denmark), Multikino (excluding Latvia and Lithuania) and Italy. 3. Vue Group Turnover: Total Group reported turnover for the defined period. 4. Vue Group Consolidated EBITDA: Consolidated reported EBITDA for the Group, for the defined period. 5. Includes paid and unpaid admissions in the period. 6. Calculated as total Group BOR in the period (net of VAT) divided by total admissions in the period. 7. Calculated as total Group Concessions in the period (net of VAT) divided by total admissions in the period. 8. FX rates: € to £ average exchange rates are: 0.7873 Q4 2014; 0.8061 YTD 2014; 0.8406 Q4 2013 and 0.8479 YTD 2013. PLN to £ average exchange rates are: 0.1878 Q4 2014; 0.1930 YTD 2014; 0.2006 Q4 2013 and 0.2019 YTD 2013. 9. UK financial & market data: Q4 2014, the 13 weeks ended 27 November 2014; YTD 2014, the 52 weeks ended 27 November 2014; Q4 2013, the 13 weeks ended 28 November 2013; YTD 2013, the 52 weeks ended 28 November 2013. 10. Germany market data: Q4 2014 1 September 2014 to 30 November 2014; YTD 2014 1 December 2013 to 30 November 2014; Q4 2013 1 September 2013 to 30 November 2013; YTD 2013 1 December 2012 to 30 November 2013. 11. Poland market data: Q4 2014, the 13 weeks ended 04 December 2014; YTD 2014, the 52 weeks ended 04 December 2014; Q4 2013, the 13 weeks ended 05 December 2013; YTD 2013, the 52 weeks ended 05 December 2013. 12. Italy market data: Q4 2014 1 September 2014 to 30 November 2014; YTD 2014 1 December 2013 to 30 November 2014; Q4 2013 1 September 2013 to 30 November 2013; YTD 2013 1 December 2012 to 30 November 2013. 13. Major Territories Market GBOR Source: UK IBOE.com/Rentrak; Germany IBOE.com/Rentrak; Poland Boxoffice.pl; Italy Cinetel.
6
Major Territories Total Market GBOR
(1) (£m) 555.4 611.4 (9.2%)
Vue Major Territories GBOR (2)
(£m) 106.4 117.3 (9.3%)
Vue Major Territories GBOR market share (%) 19.2% 19.2% 0.0ppt
Vue Group Turnover (3)
(£m) 153.9 172.0 (10.5%)
Vue Group Consolidated EBITDA (4)
(£m) 18.6 26.7 (30.5%)
Vue Group Admissions (5)
(m) 18.0 19.2 (6.4%)
Vue Group ATP (6)
(£) 5.55 5.74 (3.3%)
Vue Group SPP (7)
(£) 1.86 1.82 2.1%
Major Territories Total Market GBOR
(1) (£m) 2,414.2 2,528.5 (4.5%)
Vue Major Territories GBOR (2)
(£m) 463.8 498.5 (7.0%)
Vue Major Territories GBOR market share (%) 19.2% 19.7% (0.5ppt)
Vue Group Turnover (3)
(£m) 660.3 710.4 (7.1%)
Vue Group Consolidated EBITDA (4)
(£m) 91.9 109.1 (15.7%)
Vue Group Admissions (5)
(m) 75.7 80.3 (5.7%)
Vue Group ATP (6)
(£) 5.74 5.83 (1.5%)
Vue Group SPP (7)
(£) 1.89 1.86 1.7%
FY 2014 FY 2013Variance to
FY 2013
Q4 2014 Q4 2013Variance to
Q4 2013

232.9 228.7 1,074.3
1,049.6
0
200
400
600
800
1,000
1,200
0
50
100
150
200
250
Q4 2013
Q4 2014
FY 2013
FY 2014
£m£m
228.1 215.0
951.8 933.3
0
100
200
300
400
500
600
700
800
900
1,000
0
50
100
150
200
250
Q4 2013
Q4 2014
FY 2013
FY 2014
€m€m
159.2
197.2 653.7721.3
0
100
200
300
400
500
600
700
800
0
50
100
150
200
250
Q4 2013
Q4 2014
FY 2013
FY 2014
Zł m
Zł m
184.9
152.5
612.1580.3
0
100
200
300
400
500
600
700
0
20
40
60
80
100
120
140
160
180
200
Q4 2013
Q4 2014
FY 2013
FY 2014
€m€m
35.534.2 163.9 155.5
0
20
40
60
80
100
120
140
160
180
0
5
10
15
20
25
30
35
40
Q4 2013
Q4 2014
FY 2013
FY 2014
Mill
ion
Mill
ion
8.7
11.4
35.640.1
0
5
10
15
20
25
30
35
40
45
0
2
4
6
8
10
12
Q4 2013
Q4 2014
FY 2013
FY 2014
Mill
ion
Mill
ion
29.5
27.1
119.1 114.5
0
20
40
60
80
100
120
140
0
5
10
15
20
25
30
35
Q4 2013
Q4 2014
FY 2013
FY 2014
Mill
ion
Mill
ion
28.7
24.2
96.0 92.3
0
20
40
60
80
100
120
0
5
10
15
20
25
30
35
Q4 2013
Q4 2014
FY 2013
FY 2014
Mill
ion
Mill
ion
7
Market Performance – Admissions and GBOR
Notes 1. Includes paid and unpaid admissions in the period. 2. Includes paid admissions only in the period.
UK Admissions (m) (1) Germany Admissions (m) (2)
UK GBOR (£m) Germany GBOR (€m)
Poland Admissions (m) (2)
Poland GBOR (złm)
(13.1)m (5.7)%
(18.6)m (1.9)%
(4.2)m (1.8)%
(24.7)m (2.3)%
38.1m 23.9%
67.6m 10.3%
Italy Admissions (m) (1)
(2.4)m (8.1)%
(4.6)m (3.9)%
(1.3)m (3.6)%
(8.4)m (5.1)%
4.5m 12.6%
(3.7)m (3.8)%
2.6m 30.0%
(4.5)m (15.7)%
Italy GBOR (€m)
(32.4)m (17.5)%
(31.7)m (5.2)%
Source: CAA (DCM & P&D) Source: IBOE.com / Rentrak Source: Boxoffice.pl Source: Cinetel
Source: IBOE.com / Rentrak Source: IBOE.com / Rentrak Source: Boxoffice.pl Source: Cinetel

8
Market Performance – Q4 2014 GBOR Monthly Phasing UK Q4 2014
September
- UK: 2014 film slate broadly in line with 2013 although prior year bolstered by release of the event cinema title One Direction: This Is Us (£6.4m)
- Germany: stronger slate including Guardians Of The Galaxy (€11.4m) in 2014 compared with White House Down (€7.4m) in 2013
- Poland: stronger slate in 2014 with local title Miasto 44 (zł14.0m) outperforming 2013 titles Riddick (zł3.5m) and Turbo (zł2.8m) despite the impact on admissions of the FIVB Volleyball World Championship which the Polish national team hosted and won (most viewed TV sporting event ever in Poland)
- Italy: weaker slate in 2014 with The Fault In Our Stars (€5.0m) and The Expendables 3 (€3.2m) compared to The Smurfs 2 (€4.4m) and Rush (€4.1m) in 2013
October
- UK: 2014 film slate including Gone Girl (£17.8m) and Teenage Mutant Ninja Turtles (£10.3m) outperformed Captain Phillips (£9.8m) in 2013
- Germany: stronger slate overall but with no stand out titles in 2014, despite Gravity (€10.3m) performing relatively well in 2013
- Poland: stronger slate with local titles Bogowie (zł23.0m) and continuation of Miasto 44 (zł10.5m) compared to Walesa (zł12.7m) in 2013
- Italy: weaker slate in 2014 with no stand out titles compared to Despicable Me 2 (€13.2m) and Gravity (€5.9m) in 2013
November
- UK: weaker slate in 2014 with Interstellar (£16.8m) and The Hunger Games: Mockingjay Part 1 (£16.3m) compared with Gravity (£21.0m), The Hunger Games: Catching Fire (£16.2m) and Thor: The Dark World (£16.0m)
- Germany: weaker slate in 2014 with The Hunger Games - Mockingjay: Part 1 (€18.1m) and Interstellar (€12.0) compared to Fack ju Göhte (€27.8m), The Hunger Games: Catching Fire (€16.6m) and Thor - The Dark Kingdom (€13.3m) in 2013
- Poland: continuing strong slate in 2014 with Bogowie remaining as top grossing title for the second month (zł12.8m), Dzien Dobry, Kocham Cie! (zł9.8m) and The Hunger Games: Mockingjay - Part 1 (zł9.4m) outperforming Thor: The Dark World (zł8.9m) in 2013
- Italy: 2013 dominated by record breaking local title Sole A Catinelle (€47.1m) compared with Interstellar (€9.4m), local title Andiamo A Quel Paese (€7.4m) and The Hunger Games: Mockingjay Part 1 (€7.2m) in 2014
Germany Q4 2014 Poland Q4 2014 Italy Q4 2014
Source: IBOE.com / Rentrak Source: IBOE.com / Rentrak Source: Boxoffice.pl Source: Cinetel
73.168.5
91.3
67.8
80.5 80.4
0
10
20
30
40
50
60
70
80
90
100
September October November
£m
Q4 2013 Q4 2014
53.1
70.4
104.7
65.5
74.5 75.0
0
20
40
60
80
100
120
September October November
€m
Q4 2013 Q4 2014
35.1
53.4
70.8
39.2
72.6
85.4
0
10
20
30
40
50
60
70
80
90
September October November
Zł m
Q4 2013 Q4 2014
41.0
54.3
89.5
37.3
44.6
70.6
0
10
20
30
40
50
60
70
80
90
100
September October November
€m
Q4 2013 Q4 2014

9
UK & Ireland Market (1) Performance – Slate Q4 2014 versus Q4 2013
Total Market GBOR decreased 2.6% from £252.0m in Q4 2013 to £245.5m in Q4 2014
Top five titles in Q4 2014 generated £77.8m Market GBOR, which was £5.5m (6.6%) less than the prior year period
The top five proportion of the total market in Q4 2014 was 31.7% and slightly down compared to Q4 2013 at 33.1%
The number of 3D titles in the top five fell from three titles in Q4 2013 to one title in Q4 2014
Outside the top five films the awards films, The Imitation Game, Mr. Turner and Nightcrawler all opened to good levels which helped alleviate the market fall to only 2.6% vs. 6.6% for the top five films
Notes 1. Market data above includes both the UK & Ireland as per IBOE.com Rentrak. This data therefore does not reconcile to UK market data listed on slide 7, the difference being Ireland. 2. UK & Ireland market data: Q4 2014, the 13 weeks ended 27 November 2014; Q4 2013, the 13 weeks ended 28 November 2013
Gravity 21.0 Yes No
Thor: The Dark World 19.1 Yes No
The Hunger Games: Catching Fire 16.2 No No
Captain Phillips 15.4 No No
Cloudy with a Chance of Meatballs 2 11.6 Yes No
Total Top 5 83.3 3 0
Total Market (1) 252.0
Top 5 as a % of total market (1) 33.1%
Q4 2013 - UK & IrelandGBOR
(£m)3D Local
Gone Girl 22.1 No No
Interstellar 16.8 No No
Hunger Games: Mockingjay, Part 1, The 16.3 No No
Teenage Mutant Ninja Turtles 13.8 Yes No
Maze Runner, The 8.8 No No
Total Top 5 77.8 1 0
Total Market (1) 245.5
Top 5 as a % of total market (1) 31.7%
Q4 2014 - UK & IrelandGBOR
(£m)3D Local

10
Germany Market Performance – Slate Q4 2014 versus Q4 2013
Total Market GBOR decreased 5.7% from €228.1m in Q4 2013 to €215.0m in Q4 2014
Top five titles in Q4 2014 generated €65.4m Market GBOR, 18.9% less than the prior year period when local title Fack ju Göhte performed particularly strongly
The top five proportion of the total market in Q4 2014 was 30.4%, below the top five proportion of 35.3% in Q4 2013
The number of 3D titles in the top five fell from two titles in Q4 2013 to one title in Q4 2014
There was one local content title in the top five in Q4 2014 and one in Q4 2013
Notes 1. Germany market data: Q4 2014 1 September 2014 to 30 November 2014; Q4 2013 1 September 2013 to 30 November 2013
The Hunger Games - Mockingjay : Part 1 18.1 No No
Guardians of the Galaxy 13.5 Yes No
Interstellar 12.0 No No
Qu'est-ce qu'on a fait au Bon Dieu? 12.0 No Yes
Gone Girl 9.8 No No
Total Top 5 65.4 1 1
Total Market 215.0
Top 5 as a % of total market 30.4%
Q4 2014 - GermanyGBOR
(€m)3D Local
Fack ju Göhte 27.8 No Yes
The Hunger Games: Catching Fire 16.6 No No
Thor - The Dark Kingdom 14.5 Yes No
Gravity 12.4 Yes No
White House Down 9.4 No No
Total Top 5 80.6 2 1
Total Market 228.1
Top 5 as a % of total market 35.3%
Q4 2013 - GermanyGBOR
(€m)3D Local

11
Poland Market Performance – Slate Q4 2014 versus Q4 2013
Total Market GBOR increased 23.9% from zł159.2m in Q4 2013 to zł197.2m in Q4 2014
Top five titles in Q4 2014 generated zł89.7m Market GBOR, 77.8% up on the prior year period driven by the strong performance of local titles Bogowie and Miasto 44
The top five proportion of the total market in Q4 2014 was 45.5%, well above the top five proportion of 31.7% in Q4 2013
There were four local content titles in the top five in Q4 2014 compared to one in Q4 2013
Notes 1. Poland market data: Q4 2014, the 13 weeks ended 04 December 2014; Q4 2013, the 13 weeks ended 05 December 2013
Bogowie 35.8 No Yes
Miasto 44 25.8 No Yes
Dzien Dobry, Kocham Cie! 9.8 No Yes
The Hunger Games: Mockingjay - Part 1 9.4 No No
Sluzby Specjalne 8.9 No Yes
Total Top 5 89.7 0 4
Total Market 197.2
Top 5 as a % of total market 45.5%
Q4 2014 - PolandGBOR
(złm)3D Local
Walesa 15.0 No Yes
Gravity 11.6 Yes No
Thor: The Dark World 8.9 Yes No
The Hunger Games: Catching Fire 8.0 No No
Turbo 6.9 Yes No
Total Top 5 50.5 3 1
Total Market 159.2
Top 5 as a % of total market 31.7%
Q4 2013 - PolandGBOR
(złm)3D Local

12
Italy Market Performance – Slate Q4 2014 versus Q4 2013
Total Market GBOR decreased 17.5% from €184.9m in Q4 2013 to €152.5m in Q4 2014
Top five titles in Q4 2014 generated €37.3m Market GBOR, 56.0% less than the prior year period when local title Sole A Catinelle performed exceptionally strongly, combined with good performance from Despicable Me 2. Sole A Catinelle holds the record for the highest number of admissions in Italy (both in its first week at 3.6m and for the full run at 8.0m). In terms of GBOR Sole A Catinelle (at €51.9m) is second only to Avatar (€65.5m) which benefitted from a higher ATP due to its release in 3D
In Q4 2014 none of the top five titles were released in 3D compared to three in Q4 2013, and two local language titles in the top five in Q4 2014 compared to one in Q4 2013
The top five proportion of the total market in Q4 2014 was 24.5%, well below the top 5 proportion of 45.8% in Q4 2013 which was driven by Sole A Catinelle
Interstellar 9.4 No No
Andiamo A Quel Paese 7.4 No Yes
Lucy 7.3 No No
The Hunger Games - Mockingjay : Part 1 7.2 No No
Il Giovane Favoloso 6.0 No Yes
Total Top 5 37.3 0 2
Total Market 152.5
Top 5 as a % of total market 24.5%
Q4 2014 - ItalyGBOR
(€m)3D Local
Sole A Catinelle 49.5 No Yes
Despicable Me 2 15.9 Yes No
The Smurfs 2 6.6 Yes No
Rush 6.5 No No
Thor: The Dark World 6.3 Yes No
Total Top 5 84.7 3 1
Total Market 184.9
Top 5 as a % of total market 45.8%
Q4 2013 - ItalyGBOR
(€m)3D Local
Notes 1. Italy market data: Q4 2014 1 September 2014 to 30 November 2014; Q4 2013 1 September 2013 to 30 November 2013

Market Share
Notes 1. Vue Major Territories GBOR: Aggregate Vue UK GBOR (excluding Ireland), CinemaxX GBOR (excluding Denmark) and Multikino (excluding Latvia and Lithuania) and Italy. 2. FX rates: € to £ average exchange rates are: 0.7873 Q4 2014; 0.8061 YTD 2014; 0.8406 Q4 2013 and 0.8479 YTD 2013. PLN to £ average exchange rates are: 0.1878 Q4 2014; 0.1930 YTD 2014; 0.2006 Q4 2013 and 0.2019 YTD 2013. 3. UK financial & market data: Q4 2014, the 13 weeks ended 27 November 2014; YTD 2014, the 52 weeks ended 27 November 2014; Q4 2013, the 13 weeks ended 28 November 2013; YTD 2013, the 52 weeks ended 28 November 2013. 4. Germany market data: Q4 2014 1 September 2014 to 30 November 2014; YTD 2014 1 December 2013 to 30 November 2014; Q4 2013 1 September 2013 to 30 November 2013; YTD 2013 1 December 2012 to 30 November 2013. 5. Poland market data: Q4 2014, the 13 weeks ended 04 December 2014; YTD 2014, the 52 weeks ended 04 December 2014; Q4 2013, the 13 weeks ended 05 December 2013; YTD 2013, the 52 weeks ended 05 December 2013. 6. Italy market data: Q4 2014 1 September 2014 to 30 November 2014; YTD 2014 1 December 2013 to 30 November 2014; Q4 2013 1 September 2013 to 30 November 2013; YTD 2013 1 December 2012 to 30 November 2013. 7. Major Territories Market GBOR Source: UK IBOE.com/Rentrak; Germany IBOE.com/Rentrak; Poland Boxoffice.pl; Italy Cinetel.
13
Vue Market Share of Major Territories GBOR was 19.2% in Q4 2014, in line with Q4 2013, with both Total Market GBOR and Vue GBOR decreasing by just over 9%.
On a full year basis, Major Territories Total Market GBOR decreased 4.5% to £2,414.2m, compared to Vue Major Territories GBOR decrease of 7.0% to £463.8m resulting in a Market Share decrease of 0.5ppt to 19.2%.
Vue’s GBOR Market Share decrease over the full year was influenced by:
- A weaker film slate compared to the prior year with fewer “Blockbuster” titles released where Vue typically generates a higher market share
- Competitor openings in Poland and to a lesser extent within the UK
- Strong performance from local content in Poland which is usually distributed more widely than international titles
UK Market GBOR (£m) (3) 228.7 232.9 (1.8%) 1,049.6 1,074.3 (2.3%)
Germany Market GBOR (£m) (2, 4) 169.4 191.5 (11.5%) 754.9 805.6 (6.3%)
Poland Market GBOR (£m) (2, 5) 37.1 31.9 16.3% 139.3 132.1 5.5%
Italy Market GBOR (£m) (2, 7) 120.2 155.1 (22.5%) 470.4 516.6 (8.9%)
Major Territories Total Market GBOR (1)
(£m) 555.4 611.4 (9.2%) 2,414.2 2,528.5 (4.5%)
Vue Major Territories GBOR (2)
(£m) 106.4 117.3 (9.3%) 463.8 498.5 (7.0%)
Vue Major Territories GBOR Market Share (%) 19.2% 19.2% 0.0ppt 19.2% 19.7% (0.5ppt)
FY 2013Q4 2014 Q4 2013Variance to
Q4 2013FY 2014
Variance to
FY 2013

Financial Information – Turnover
Notes 1. FX rates: € to £ and zł to £ exchange rates are month end reported exchange rate as per Agresso reporting system. 2. Includes paid and unpaid admissions in the period. 3. Calculated as total BOR in the period (net of VAT), divided by total admissions in the period. 4. Calculated as total concession revenue for the period (net of VAT) divided by total admissions in the period. 5. Calculated as total turnover for the period (net of VAT) divided by total admissions in the period.
Group Turnover decreased by 10.5% to £153.9m in Q4 2014 primarily as a result of lower admissions compared to Q4 2013 and adverse impacts of FX due to the weakening of the Euro and Polish Zloty against Sterling. In constant currency, the reduction in revenue was 7.1% and excluding the pro forma results of TSC the reduction in revenue was only 4.3%.
Although ATP increased in local currency in all territories with the exception of Poland (which decreased by 4p) overall ATP was down 19p in Q4 2014 at £5.55 due to adverse FX movements. SPP increased by 4p to £1.86 in the quarter despite the adverse FX movements and delivered a healthy overall growth of 6% in constant currency.
On a full year basis, Group Turnover decreased by 7.1% to £660.3m due to lower admissions by 5.7% and adverse FX rates. In constant currency, the reduction in revenue was 4.6% and excluding the pro forma results of TSC the reduction in revenue was only 4.1%.
ATP increased in local currency in every territory on a full year basis but adverse FX rates resulted in overall GBP ATP being lower by 9p at £5.74 (1.5%). SPP increased by 3p to £1.89 on a full year basis reflecting the continuing pricing and operational initiatives across all territories.
The reduction in screen advertising and other revenue is attributable to lower admissions and adverse FX rates. In addition, screen advertising was lower in Italy in 2014 following the expiry of a minimum guarantee contract at the end of 2013.
14
BOR (£m) (1) 99.7 110.2 (9.5%) 434.4 467.8 (7.1%)
Concessions revenue (£m) (1) 33.4 34.9 (4.4%) 143.0 149.2 (4.2%)
Screen advertising and other revenue (£m) (1) 20.8 26.9 (22.7%) 82.9 93.5 (11.3%)
Group Turnover (£m) (1) 153.9 172.0 (10.5%) 660.3 710.4 (7.1%)
Admissions (m) (2) 18.0 19.2 (6.4%) 75.7 80.3 (5.7%)
ATP (£) (3) 5.55 5.74 (3.3%) 5.74 5.83 (1.5%)
SPP (£) (4) 1.86 1.82 2.1% 1.89 1.86 1.7%
Total revenue per person (£) (5) 8.56 8.96 (4.4%) 8.72 8.85 (1.4%)
Variance to
Q4 2013Q4 2013Q4 2014 FY 2014 FY 2013
Variance to
FY 2013

Financial Information – Margin and Costs
Despite the reduction in revenue of £18.1m to £153.9m in Q4 2014 the Gross Profit % increased by 1.4ppt to 64.2% delivering £98.8m of gross profit which was only £9.2m below that delivered in Q4 2013. The improvement in gross profit was due mainly to lower film rental costs.
Administrative expenses and rent costs were lower in absolute terms by £0.6m and £0.5m respectively resulting in Consolidated EBITDA for Q4 2014 of £18.6m which was £8.1m lower than Q4 2013.
The trend is similar on a full year basis with the admissions driven reduction in revenue of 7.1%, or £50.1m, being offset by lower direct costs and an improved gross profit percentage by 0.6ppt. This delivered a gross profit of £413.0m, £27.3m lower than the prior year. Focus on cost control and other initiatives resulted in lower administrative expenses and lower rent costs of £8.1m and £2.1m respectively resulting in full year consolidated EBITDA of £91.9m.
Notes 1. FX rates: € to £ and zł to £ exchange rates are month end reported exchange rate as per Agresso reporting system.
15
Turnover (£m) 153.9 172.0 (10.5%) 660.3 710.4 (7.1%)
Gross profit (£m) 98.8 108.0 (8.6%) 413.0 440.3 (6.2%)
Gross profit % 64.2% 62.8% 1.4ppt 62.5% 62.0% 0.6ppt
Administrative expenses (£m) (2) (49.1) (49.7) 1.1% (194.6) (202.7) 4.0%
Administrative expenses as % of revenue 31.9% 28.9% (3.0ppt) 29.5% 28.5% (0.9ppt)
Rent (£m) (31.1) (31.6) 1.7% (126.4) (128.5) 1.7%
Rent as % of revenue 20.2% 18.4% (1.8ppt) 19.1% 18.1% (1.1ppt)
Consolidated EBITDA (£m) 18.6 26.7 (30.5%) 91.9 109.1 (15.7%)
Consolidated EBITDA % 12.1% 15.5% (3.5ppt) 13.9% 15.4% (1.4ppt)
Q4 2014 Q4 2013Variance to
Q4 2013FY 2014 FY 2013
Variance to
FY 2013

Q4 Cash flow
The increase in capital expenditure in Q4 2014 compared to Q4 2013 is mainly due to increased expenditure on EBITDA enhancing projects, such as the refurbishment of Doncaster and new screens in Stratford and Copenhagen, as well as the installation of VIP seating in Italy.
During the quarter, one site opened in Olsztyn, compared to two openings in Q4.
The non cash adjustments in Q4 2014 includes the utilisation of onerous lease provisions and the release of landlord contributions.
Financial Information – Cash flow (inc TSC pro forma)
Notes 1. Pro forma trading working capital.
YTD Cash flow
The change in working capital cash flow primarily driven by performance (2013 included a large decrease in trade payables relating to film rental on Skyfall at the start of the year) and also improved working capital management.
The reduction in capital expenditure in 2014 relates mainly to fewer new sites (ie 2013 includes Glasgow Fort, Bicester, Cramlington, Lublin and Czechowice Dziedzice; 2014 includes Gateshead, Farnborough and Olsztyn).
The non cash adjustments in 2014 includes the utilisation of onerous lease provisions, the release of landlord contributions and the impact of the Real D pro forma savings originally booked in Q2 2014.
Tax of £2.7m was paid in 2014.
16
Consolidated EBITDA 18.6 26.7 (30.5%)
Working capital (1) 0.2 (0.2) (200.0%)
Capital expenditure (8.3) (5.3) 56.6%
Tax and other (including non-cash adjustments) (2.7) (1.0) 170.0%
Operating cash flow 7.8 20.2 (61.6%)
EBITDA to operating cash flow conversion % 41.8% 75.7% (33.8ppt)
Q4 2014 Q4 2013Variance to
Q4 2013
Consolidated EBITDA 91.9 109.1 (15.7%)
Working capital (1) 15.0 (11.8) (227.1%)
Capital expenditure (29.1) (34.4) (15.4%)
Tax and other (including non-cash adjustments) (16.9) (2.1) 704.8%
Operating cash flow 60.9 60.8 0.2%
EBITDA to operating cash flow conversion % 66.3% 55.7% 10.5ppt
Variance to
FY 2013FY 2014 FY 2013
Financial Information – Capital Structure and Leverage
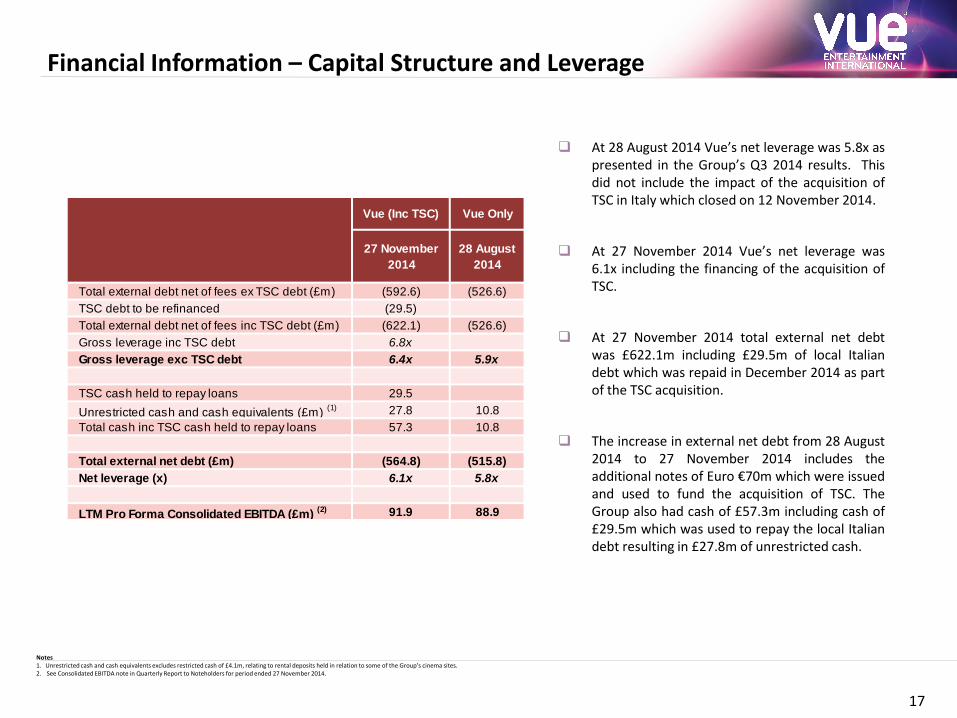
Notes 1. Unrestricted cash and cash equivalents excludes restricted cash of £4.1m, relating to rental deposits held in relation to some of the Group’s cinema sites. 2. See Consolidated EBITDA note in Quarterly Report to Noteholders for period ended 27 November 2014.
At 28 August 2014 Vue’s net leverage was 5.8x as presented in the Group’s Q3 2014 results. This did not include the impact of the acquisition of TSC in Italy which closed on 12 November 2014.
At 27 November 2014 Vue’s net leverage was 6.1x including the financing of the acquisition of TSC.
At 27 November 2014 total external net debt was £622.1m including £29.5m of local Italian debt which was repaid in December 2014 as part of the TSC acquisition.
The increase in external net debt from 28 August 2014 to 27 November 2014 includes the additional notes of Euro €70m which were issued and used to fund the acquisition of TSC. The Group also had cash of £57.3m including cash of £29.5m which was used to repay the local Italian debt resulting in £27.8m of unrestricted cash.
17
Vue (Inc TSC) Vue Only
Total external debt net of fees ex TSC debt (£m) (592.6) (526.6)
TSC debt to be refinanced (29.5)
Total external debt net of fees inc TSC debt (£m) (622.1) (526.6)
Gross leverage inc TSC debt 6.8x
Gross leverage exc TSC debt 6.4x 5.9x
TSC cash held to repay loans 29.5
Unrestricted cash and cash equivalents (£m) (1) 27.8 10.8
Total cash inc TSC cash held to repay loans 57.3 10.8
Total external net debt (£m) (564.8) (515.8)
Net leverage (x) 6.1x 5.8x
LTM Pro Forma Consolidated EBITDA (£m) (2) 91.9 88.9
27 November
2014
28 August
2014

The Space
- Vue completed the acquisition of Capitolosette S.r.l. and its subsidiaries which includes The Space Entertainment S.p.A. (together “TSC”), the leading cinema chain in Italy with 36 state-of-the-art multiplex cinemas across the country, on 12th November 2014.
- Initiated integration and development workstreams including pricing, screen advertising, procurement and other operational efficiencies.
New Sites
- Multikino opened Olsztyn (in the NE of Poland) on September 5th 2014, adding 9 screens with 1,251 seats including VIP seating.
Redevelopment of Existing Sites
- Vue UK & Ireland – Doncaster was redeveloped from an old 7-screen sloped floor cinema into an 11 screen modern, state-of-the-art stadium seated multiplex and re-opened in November 2014; The highly successful Stratford City site, adjacent to the London Olympic Park, opened three additional screens in November 2014.
- CinemaxX Denmark - Copenhagen opened four new screens in December 2014.
Managing Director, CinemaxX
- Carsten Horn has been appointed as Managing Director of CinemaxX. Carsten joins CinemaxX after a highly successful career working as Managing Director of Tchibo’s 700 coffee and retail stores across Germany and the 210 stores owned and operated by flower retailer Blume 2000. Previously Carsten was a Regional Sales Director at Max Bahr.
Vue to open UK’s first ever eSports arena
- Vue and Gfinity have announced the opening of the UK’s first ever eSports arena at Vue Cinema Fulham Broadway, London. Vue and Gfinity will work together to promote 2015 eSports events as well as explore the opportunity to roll-out the concept to other Vue locations in the future. The Gfinity Arena opened in March for the start of the 2015 Gfinity Championships which will comprise 25 events culminating in the final to be held in September 2015. Live tournaments will be hosted every weekend and on selected weekday evenings.
Effective Mobile Marketing Award
- Vue won the prestigious Effective Mobile Marketing Award for its tablet app on 27th November 2014. The Awards, now in its fifth year, is the world’s longest-running Awards Programme celebrating excellence in mobile marketing. Vue beat strong competition from brands including De Beers, Mothercare, Hotels.com and iRiS Software Systems to win the in the ‘Most Effective Tablet App’ category.
Highlights and Recent Developments
18

The market performance during Q1 2015 has been strong with admissions growth in all major territories driven by titles including The Hobbit: The Battle Of The Five Armies and Fifty Shades Of Grey.
UK & Ireland Market
- Market admissions in Q1 2015 were 5.0% higher than prior year despite the Top Five films performing similarly in both periods.
- The top grossing titles in Q1 2015 were The Hobbit: The Battle Of The Five Armies (£41.3m), Paddington (£37.0m) and Fifty Shades Of Grey (£28.1m)
German Market
- Market admissions in Q1 2015 were 10.7% higher than prior year with strong performance from local title Honig im Kopf which delivered €49.5m GBOR in Q1 following its release on 25 December 2014
- The Hobbit: The Battle Of The Five Armies delivered €63.8m in Q1 2015, slightly higher than the €63.4m from The Hobbit: The Desolation of Smaug in Q1 2014
Poland Market
- Market admissions in Q1 2015 are estimated to be 17.8% higher than prior year. This is largely driven by the success of Fifty Shades Of Grey and The Penguins Of Madagascar together with The Hobbit: The Battle Of The Five Armies zł46.3m which outperformed The Hobbit: The Desolation of Smaug zł39.4m in Q1 2014
Italian Market
- Market admissions in Q1 2015 were 0.9% higher than prior year with a weaker December compared to prior year (-6.9%) which enjoyed the benefit of local title Sole A Catinelle being offset by a stronger January (+7.3%) and February (+2.2%)
- The top grossing titles for the period were American Sniper €18.9m, Fifty Shades Of Grey €17.9m and local title Si Accettano Miracoli €15.4m
Upcoming releases
- Highly anticipated titles during Q2 include Furious 7 and Avengers : Age Of Ultron
Leverage is expected to have reduced from 6.1x at Q4 2014 to approximately 5.5x at Q1 2015.
Current Trading
19

20
Film Slate – Q1 2015
Dec-14 The Hunger Games: Mockingjay, Part 1 Dec-13 The Hobbit: The Desolation Of Smaug Y
Paddington Frozen Y
The Hobbit: Battle Of The Five Armies Y The Hunger Games: Catching Fire
Penguins of Madagascar Y Anchorman 2: The Legend Continues
Night at The Museum 3 Y
Jan-15 Kingsman: Secret Service Jan-14 The Wolf Of Wall Street
Taken 3 12 Years A Slave
American Sniper American Hustle
Feb-15 Big Hero 6 Y Feb-14 Lego Movie, The Y
Fifty Shades of Grey
Jan-15 The Theory of Everything
Dec-14 Honig Im Kopf Dec-13 Fack Ju Göhte
Dec-14 Bibi Und Tina Dec-13 The Physician
Feb-15 Traumfrauen Feb-14 Fünf Freunde 3
Jan-15 Wkreceni 2 Jan-14 Pod Mocnym Aniolem
Jan-15 Carte Blanche Jan-14 Wkreceni
Feb-14 Jack Strong
Feb-14 Facet (nie) potrzebny od zaraz
Dec-14 Il Ricco, Il Povero E Il Maggiordomo Dec-13 Colpi Di Fortuna
Dec-14 Un Natale Stupefacente Dec-13 Un Fantastico Via Vai
Jan-15 Si Accettano Miracoli Jan-14 Un Boss In Salotto
Feb-14 Sotto Una Buona Stella
UK UK
ItalyItaly
Germany Germany
Poland Poland
Q1 2015 - Key International Titles 3D Q1 2014 - Key International Titles 3D
Q1 2015 - Key Local Content Titles 3D Q1 2014 - Key Local Content Titles 3D

21
Q&A

25 March 2015 Q4 2014 Bondholder Report released and Investor Call (2pm – see Quarterly Report for dial-in details)
15 April 2015 Q1 2015 Bondholder Report released and Investor Call (2pm – see Quarterly Report for dial-in details)
22
Confirmed Dates
Financial Calendar
January
M T W T F S S
1 2 3 4
5 6 7 8 9 10 11
12 13 14 15 16 17 18
19 20 21 22 23 24 25
26 27 28 29 30 31
February
M T W T F S S
1
2 3 4 5 6 7 8
9 10 11 12 13 14 15
16 17 18 19 20 21 22
23 24 25 26 27 28
Provisional Dates
March
M T W T F S S
1
2 3 4 5 6 7 8
9 10 11 12 13 14 15
16 17 18 19 20 21 22
23 24 25 26 27 28 29
30 31
June
M T W T F S S
1 2 3 4 5 6 7
8 9 10 11 12 13 14
15 16 17 18 19 20 21
22 23 24 25 26 27 28
29 30 31
April
M T W T F S S
1 2 3 4 5
6 7 8 9 10 11 12
13 14 15 16 17 18 19
20 21 22 23 24 25 26
27 28 29 30 31
May
M T W T F S S
1 2
3 4 5 6 7 8 9
10 11 12 13 14 15 16
17 18 19 20 21 22 23
24 25 26 27 28 29 30