nota lavoro - qut · nota di lavoro 72.2010 the causes of corruption: evidence from china by bin...
TRANSCRIPT
NOTA DILAVORO72.2010
The Causes of Corruption: Evidence from China
By Bin Dong, The School of Economics and Finance, Queensland University of Technology Benno Torgler, The School of Economics and Finance, Queensland University of Technology, CREMA – Center for Research in Economics, Management and the Arts and CESifo

The opinions expressed in this paper do not necessarily reflect the position of Fondazione Eni Enrico Mattei
Corso Magenta, 63, 20123 Milano (I), web site: www.feem.it, e-mail: [email protected]
INSTITUTIONS AND MARKETS Series Editor: Fausto Panunzi The Causes of Corruption: Evidence from China By Bin Dong, The School of Economics and Finance, Queensland University of Technology Benno Torgler, The School of Economics and Finance, Queensland University of Technology, CREMA – Center for Research in Economics, Management and the Arts and CESifo Summary In this study we explore in detail the causes of corruption in China using two different sets of data at the regional level (provinces and cities). We observe that regions with more anti-corruption efforts, histories of British rule, higher openness, more access to media and relatively higher wages of government employees are markedly less corrupt; while social heterogeneity, regulation, abundance of resource and state-owned enterprises substantially breed regional corruption. Moreover, fiscal decentralization is discovered to depress corruption significantly, while administrative decentralization fosters local corruption. We also find that there is currently a positive relationship between corruption and economic development in China that is mainly driven by the transition to a market economy. Keywords: Corruption, China, Government, Decentralization, Deterrence, Social Heterogeneity JEL Classification: D730, H110, K420
Address for correspondence: Benno Torgler School of Economics and Finance Queensland University of Technology GPO Box 2434 Brisbane QLD 4001 Australia Phone: +6173138 2517 Fax: +6173138 1500 E-mail: [email protected]

1
The Causes of Corruption: Evidences from China
Bin Dong a and Benno Torgler a,b,c
a The School of Economics and Finance, Queensland University of Technology, GPO Box 2434,
Brisbane, QLD 4001, Australia
b CREMA – Center for Research in Economics, Management and the Arts, Gellertstrasse 18, CH-
4052 Basel, Switzerland
c CESifo, Poschingerstrasse 5, D-81679 Munich, Germany
ABSTRACT
In this study we explore in detail the causes of corruption in China using two different sets of data at
the regional level (provinces and cities). We observe that regions with more anti-corruption efforts,
histories of British rule, higher openness, more access to media and relatively higher wages of
government employees are markedly less corrupt; while social heterogeneity, regulation, abundance
of resource and state-owned enterprises substantially breed regional corruption. Moreover, fiscal
decentralization is discovered to depress corruption significantly, while administrative
decentralization fosters local corruption. We also find that there is currently a positive relationship
between corruption and economic development in China that is mainly driven by the transition to a
market economy.
JEL classification: D730; H110; K420
Keywords: Corruption; China; Government; Decentralization; Deterrence; Social Heterogenity

2
I. INTRODUCTION
Corruption has caused vexation to the nation’s leadership since the People’s Republic of
China was established in 1949. For example, two senior officials, Qingshan Liu and Zishan
Zhang, were executed in 1952 due to corruption. Chinese leadership has tried to control
corruption mainly by mass movements before 1978. Since economic reform was launched in
1978, corruption has become more and more widespread in China. Lui (1983) reports that
corruption exists at every level of the political system in China. It has, for example, been
reported that in 1989 the market price of coal was 674 percent of the subsidized price in
China. Similarly, other producer goods were substantially higher than prices fixed by the
state. As a consequence, payoffs to get supplies at state prices were very common (Rose-
Ackerman, 1999). Industrial and commercial enterprises in China require government
authorization to operate which promotes corruption in the area of enterprise licensing through
bribery done by applicants to obtain the licenses (Manion, 1996). Lui (1983, p. 603)
differentiates between three types of corruption: “the first group comprises corrupt acts such
as embezzlement and bribes, which are common place among nations having a political
system to speak of; the second group, such as appropriation of public goods, illegal trade, and
housing irregularity, results from a breakdown in the central allocation system and is
commonplace among socialist nations… But the third group of corrupt acts is rather
peculiarly Chinese Communist, e.g., illegitimate feasting, feudal rites, false models, and
illegal imprisonment and torture”. The Chinese government has admitted that corruption “is
now worse than during any other period since New China was founded in 1949. It has spread
into the Party, into Government administration and into every part of society, including
politics, economy, ideology and culture” (Guoqing Liang, 1994, p. 122). Two members of the
Politburo, Xitong Chen and Liangyu Chen, have been successively accused of taking huge
bribes in recent years. This provides anecdotal evidence of the increasing seriousness of
corruption in China. Some Chinese observers have even remarked that there are no Chinese
officials beyond corruption.
Rampant corruption is a distinct feature of current China, the biggest transitional and
developing country. Many papers have emerged about corruption in China, most of which are
written by sociologists and political scientists (for example, White, 1996; Wedeman, 2004;
and Gong, 2006). As to economic studies, Yao (2002) argued that corruption in China is
generated by the Chinese political system, which grants and protects privileges. Cai, Fang
and Xu (2009) investigated the institutional causes of corruption among Chinese firms with a

3
firm-level data set. Still, there is a lack of more comprehensive economic analysis with an
empirical focus about the causes of corruption in China.
There are numerous studies on the causes of corruption. Most of these are cross-national
studies using subjective survey data. For instance, Treisman (2000) carried out a
comprehensive cross-country study investigating the causes of corruption with several
indexes of perceived corruption. This kind of study, although fruitful, cannot circumvent two
problems. Firstly, subjective survey data experience some biases. Treisman (2007) pointed
out that corruption perception data actually reflect impressions of intensity of corruption
instead of the corruption phenomenon itself. The data consequently are correlated to the
beliefs of the survey respondents and to many other social and economic conditions and
hence could be biased (see also Knack, 2006). According to Bertrand and Mullainathan
(2001), subjective data cannot be convincingly used as explained variables since their
measurement error is associated with many other background characteristics affected by
explanatory variables. Secondly, it is hard for cross-country analysis to solve omitted variable
bias. Substantial unobservable or unmeasurable differences in institutions and cultures
between countries make cross-country results problematic. Some researchers attempted to
bypass the bias with fixed effect regressions in cross-country studies. However, according to
Treisman (2007) and Knack (2006), the appropriateness of using the subjective corruption
indices in the longitudinal analysis is rather questionable.
Disadvantages in cross-national research can certainly be mitigated when we use a
within-country objective data set. Firstly, using objective within-country data can of course
avoid biases from subjective data. Secondly, there is a higher level of homogeneity within a
country though some differences still exist at a regional level. The omitted variable bias
troubling cross-country analysis hence can be moderated in within-country studies. In this
respect, studies of China have a unique advantage. On the one hand, China is a centralized
country with unified legal and administrative systems. Furthermore the Chinese society is
fairly homogenous due to the fact that the Han nationality with Confucian values is in the
absolute majority in most regions. The high degree of legal and social homogeneity within
China hence will help us to efficiently mitigate the omitted variable bias in an empirical
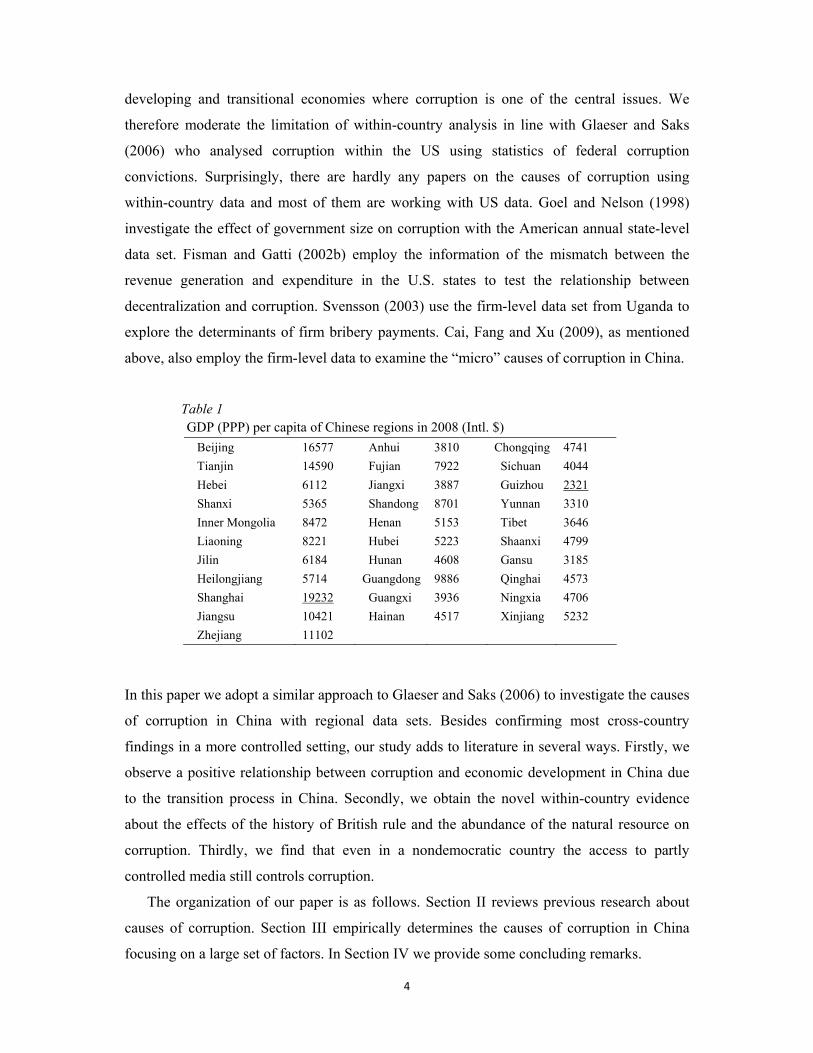
analysis. On the other hand, as shown in Table 1, there are great economic differences
between the rich eastern and the poor western provinces in China. In 2008 the GDP (PPP) per
capita of Shanghai, which approximates that of Hungary, was about nine times as high as the
GDP (PPP) per capita of Guizhou province, which is at the same level of that of Cameroon.
Thus, a study of China is extremely helpful to understand the causes of corruption in
4
developing and transitional economies where corruption is one of the central issues. We
therefore moderate the limitation of within-country analysis in line with Glaeser and Saks
(2006) who analysed corruption within the US using statistics of federal corruption
convictions. Surprisingly, there are hardly any papers on the causes of corruption using
within-country data and most of them are working with US data. Goel and Nelson (1998)
investigate the effect of government size on corruption with the American annual state-level
data set. Fisman and Gatti (2002b) employ the information of the mismatch between the
revenue generation and expenditure in the U.S. states to test the relationship between
decentralization and corruption. Svensson (2003) use the firm-level data set from Uganda to
explore the determinants of firm bribery payments. Cai, Fang and Xu (2009), as mentioned
above, also employ the firm-level data to examine the “micro” causes of corruption in China.
Table 1 GDP (PPP) per capita of Chinese regions in 2008 (Intl. $)
Beijing 16577 Anhui 3810 Chongqing 4741 Tianjin 14590 Fujian 7922 Sichuan 4044 Hebei 6112 Jiangxi 3887 Guizhou 2321 Shanxi 5365 Shandong 8701 Yunnan 3310 Inner Mongolia 8472 Henan 5153 Tibet 3646 Liaoning 8221 Hubei 5223 Shaanxi 4799 Jilin 6184 Hunan 4608 Gansu 3185 Heilongjiang 5714 Guangdong 9886 Qinghai 4573 Shanghai 19232 Guangxi 3936 Ningxia 4706 Jiangsu 10421 Hainan 4517 Xinjiang 5232 Zhejiang 11102
In this paper we adopt a similar approach to Glaeser and Saks (2006) to investigate the causes
of corruption in China with regional data sets. Besides confirming most cross-country
findings in a more controlled setting, our study adds to literature in several ways. Firstly, we
observe a positive relationship between corruption and economic development in China due
to the transition process in China. Secondly, we obtain the novel within-country evidence
about the effects of the history of British rule and the abundance of the natural resource on
corruption. Thirdly, we find that even in a nondemocratic country the access to partly
controlled media still controls corruption.
The organization of our paper is as follows. Section II reviews previous research about
causes of corruption. Section III empirically determines the causes of corruption in China
focusing on a large set of factors. In Section IV we provide some concluding remarks.

5
II. DETERMINANTS OF CORRUPTION
We first review the possible causes of corruption implied in previous research. Since political
institutions, the judicial system and cultural environment are homogenous among Chinese
regions, we will focus here on other determinants of corruption. According to Jain (2001),
there are three prerequisites necessary for incidences of corruption. First, that bureaucrats
have discretionary power. Second, that this power is associated with economic rents. Finally,
that the deterrence to corruption, as a function of the probability of being caught and penalty
for corrupt act, is adequately low. The first two preconditions determine the benefit of
corruption, while the last precondition influences the cost of corruption. Therefore the
regional characteristics that affect these preconditions, according to Becker (1968), will
determine the local incidence of corruption.
The bureaucrat’s discretion over the allocation of resources is important to the existence
of corruption. According to Rose-Ackerman (1978), discretionary power is mainly related to
regulations. Bureaucrats can always obtain discretion to distribute resources when setting and
implementing regulations. More regulations will bring in more discretionary power and
therefore will also promote incidences of corruption. In contrast, levels of corruption are
expected to decrease if controlled economies become more marketized.
Increasing government size enhances the discretionary power of government by enlarging
the social resource that it controls. LaPalombara (1994) used a sample of countries excluding
Scandinavian countries to show that the size of the government budget relative to GDP is
positively correlated with levels of corruption. La Porta et al. (1999) also found empirically a
positive relationship between the government transfers and subsidies and corruption.
However, using the index of state interference from the World Competitiveness Report,
Treisman (2000) could not find any solid evidence that greater state intervention is related to
higher corruption.
Decentralization can influence the discretionary power of government. There is a debate
upon the relationship between decentralization and corruption. According to Brennan and
Buchanan (1980) and Weingast (1995), decentralization introduces competition between
local governments reducing therefore the profits that bureaucrats can get being corrupt. The
mechanism of entry and exit in federal states provides a strong incentive to produce public
services in accordance to individuals’ preferences (Hirschman, 1970). For example, exit
threats of firms (higher mobility) can be a method of government control (Rose-Ackerman,
1999). Moreover federalism and local autonomy is combined with innovation. Federalism

6
serves as a laboratory for effective policy inventions (Oates, 1999). On the other hand,
Shleifer and Vishny (1993) argue that since decentralization causes the dispersion of the
government’s power, bureaucrats without coordination will over extract rents from firms.
Smallness and intimacy of local jurisdictions with patronage-ridden governments can
promote corrupt relationships (Rose-Ackerman 1999). Treisman (2000), using a dummy
variable reflecting whether a state is federal, finds that federal states are perceived to be more
corrupt. However, Fisman and Gatti (2002a) report cross-country evidence that fiscal
decentralization in government expenditure is significantly correlated with lower corruption.
Using American data, Fisman and Gatti (2002b) also find a positive relationship between the
proportion of a state’s expenditure derived from federal transfers and corruption.
It is obvious that rational individuals will pay bribes only if they can get a higher
marginal benefit from it. Economic rents related to discretionary powers are the necessary
condition of the incidence of corruption. Discretionary powers without related rents will
hardly lead to corruption. Ades and Di Tella (1999) show that countries where firms have
higher rents tend to be more corrupt. Natural resource exploitation is an activity of
particularly high rents that are concentrated and easily expropriable (Sachs and Warner
2001). Leite and Weidmann (1999) hence find in their empirical analysis that the incidence of
corruption depends significantly on natural resource abundance. However, Treisman (2000)
did not provide strong evidence that fuel and mineral exports are positively correlated with
the level of corruption.
Another source of economic rent is the lack of competition. Economic rents will decrease
with intensive competition in economic activities. Ades and Di Tella (1996, 1999) employ a
country’s openness to indicate the external competition firms face and find that the economic
openness of a country, measured by the share of imports in GDP, is negatively correlated
with the level of corruption in the country. Treisman (2000) also provided evidence that the
share of imports in GDP is negatively associated with the corruption level. Recently, Gerring
and Thacker (2005) find a similar relationship between trade openness and corruption.
The deterrence of corruption is a joint function of the possibility of being detected and
punishment once caught. There are several factors affecting the probability of detection.
Higher level of income accelerates the spread of education and democratic institutions and
therefore enhances individuals’ political involvement. It consequently enables private
individuals to better identify corrupt behaviour and to punish the malfeasance of officials . As
a result, regions with richer and more educated citizens are assumed to be less corrupt.
According to Treisman (2007), the negative relationship between the incidence of corruption

7
and the income level is the strongest and most consistent finding of the empirical studies on
corruption (see, e.g., La Porta et al., 1999; Ades and Di Tella, 1999 and Treisman, 2000). The
probability of getting caught also depends on the effectiveness of the country’s legal system.
La Porta et al. (1999) argued that the common law systems in Britain and its former colonies
are more effective in protecting property rights and enforcement, than the civil law systems.
Probabilities of corruption being exposed therefore are higher in common law countries.
Treisman (2000) indeed showed that Britain and its former colonies have a significantly
lower level of corruption than other countries, while Pellegrini and Gerlagh (2008) do not
find such a linkage.
Social and economic heterogeneity may also be an indirect determinant of the probability
of detection. You and Khagram (2005, p. 136) argued that “the poor are more vulnerable to
extortion and less able to monitor and hold the rich and powerful accountable as income
inequality increases”. It enables the latter to abuse their power for private gain. Income
inequality therefore promotes higher levels of corruption. They then confirmed their
argument with a cross-country analysis. However, Husted (1999) did not find any evidence of
the relationship between income inequality and corruption. Ethnical fractionalization is also
believed to promote corruption because the corrupt officials may be protected by their own
ethnic groups due to political reason. Treisman (2000) and Pellegrini and Gerlagh (2007)
failed to find strong evidence of this, while Glaester and Saks (2006) results support the fact
that racial division is positively correlated with corruption levels in US states.
In addition, press freedom plays an important role in detecting corruption as independent
journalists have incentives to investigate whether there is corruption. As a particular
mechanism of external control, press freedom appears to reduce corruption. Firms and
individuals can reveal the corrupt behaviour to a journalist and the possibility of a media
report increases the costs for bureaucrats to be corrupt (The probability of being detected
increases). In other words, the media can be seen as a platform for voicing complaints
(Brunetti and Weder 2003). Adsera, Boix and Payne (2003, p. 455) point out that the “free
circulation of daily newspaper” (the interaction term of a democratic measure and newspaper
circulation) is negatively correlated with corruption. Brunetti and Weder (2003) find
empirically that a high level of press freedom is associated with a low incidence of
corruption, while Chowdhury (2004) emphasizes that press freedom controls corruption via
the channel of democracy. Freille, Haque and Kneller (2007) performed a modified extreme
bounds analysis to identify that the greater the press freedom the lower the level of
corruption.
8
It is difficult to directly test the effect of punishment on corruption levels because it is
difficult to compare punishment across different countries. However, higher wages imply
higher opportunity costs when officials are ousted due to corruption. Van Rijkeghem and
Weder (2001) find that in developing countries a higher ratio of civil service wages to
manufacturing wages is significantly correlated to a lower level of corruption. However
Treisman (2000) cannot provide clear evidence that higher government wages depress
corruption. It is also interesting to note that in Ancient Egypt, the pharaohs searched for
ways to reduce the corruption of their tax collectors (called scribes). The scribes were paid
high salaries to reduce the incentives to enrich themselves by cheating taxpayers.
Furthermore, scribes working in the field were controlled by a group of special scribes from
the head office (see Adams, 1993). Rose-Ackerman (1999) stresses: “Pay increases may
indeed be necessary for good performance, but only if the increases are tied to productivity
and are accompanied by a reduction in the overall level of public sector employment” (p. 87).
III. EMPIRICAL ANALYSIS
The administrative division of China listed are provincial region, prefectural region and
county or district. In this paper we will use two different regional data sets to explore the
causes of corruption in China. The first one is a province-level data set which consists of data
from all 31 provincial areas during the period 1998 to 2007 in mainland of China: 22
provinces, 5 autonomous regions and 4 municipalities. We do not include data from
Hongkong, Macao and Taiwan in it because of the substantial differences in the political and
legal systems between them and other parts of China.
Corruption measure in the first data set we use is derived from the China Procuratorial
Yearbooks. We collect the number of annual registered cases on corruption in the
procurator’s office by region. We then divide these registered cases by regional population to
get our corruption measure: regional registered cases on corruption per 100,000 people each
yeara. The definition of corruption-related crimes in Chinese Criminal Law keeps evolving
until the new Criminal Law was passed by the Fifth Session of the Eighth National People's
Congress of China in 1997. The Chapter VIII: Crimes of Embezzlement and Bribery in the
a We also performed our provincial analysis with an alternative corruption measure: the provincial number of officials investigated in registered cases on corruption per 100,000 population. Since this corruption measure is only available in the period from 2003 to 2007, we do not report here the estimation results with it, but one should note that the results are quite similar.
9
new Criminal Law includes all corruption-related crimes and basically remains unchanged
since then. In order to ensure the comparability of the corruption data, we therefore choose
the corruption data from 1998 to 2007 to investigate the causes of corruption in China.
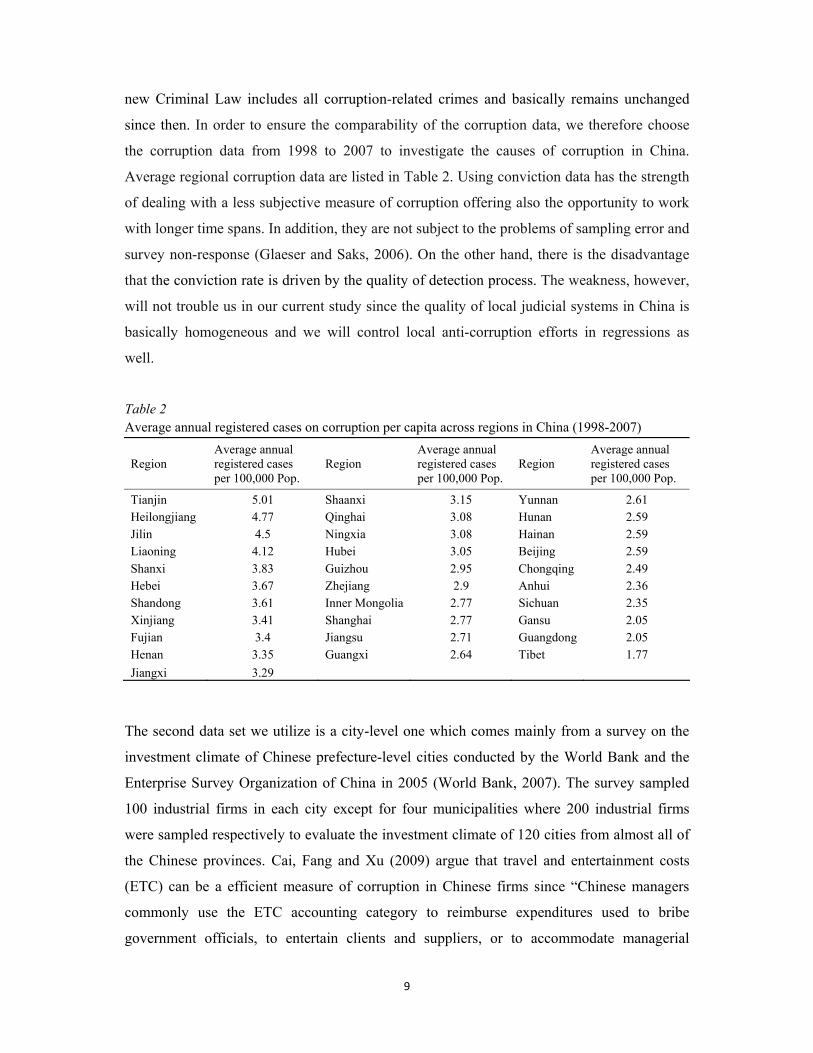
Average regional corruption data are listed in Table 2. Using conviction data has the strength
of dealing with a less subjective measure of corruption offering also the opportunity to work
with longer time spans. In addition, they are not subject to the problems of sampling error and
survey non-response (Glaeser and Saks, 2006). On the other hand, there is the disadvantage
that the conviction rate is driven by the quality of detection process. The weakness, however,
will not trouble us in our current study since the quality of local judicial systems in China is
basically homogeneous and we will control local anti-corruption efforts in regressions as
well.
Table 2 Average annual registered cases on corruption per capita across regions in China (1998-2007)
Region Average annual registered cases per 100,000 Pop.
Region Average annual registered cases per 100,000 Pop.
Region Average annual registered cases per 100,000 Pop.
Tianjin 5.01 Shaanxi 3.15 Yunnan 2.61 Heilongjiang 4.77 Qinghai 3.08 Hunan 2.59 Jilin 4.5 Ningxia 3.08 Hainan 2.59 Liaoning 4.12 Hubei 3.05 Beijing 2.59 Shanxi 3.83 Guizhou 2.95 Chongqing 2.49 Hebei 3.67 Zhejiang 2.9 Anhui 2.36 Shandong 3.61 Inner Mongolia 2.77 Sichuan 2.35 Xinjiang 3.41 Shanghai 2.77 Gansu 2.05 Fujian 3.4 Jiangsu 2.71 Guangdong 2.05 Henan 3.35 Guangxi 2.64 Tibet 1.77 Jiangxi 3.29
The second data set we utilize is a city-level one which comes mainly from a survey on the
investment climate of Chinese prefecture-level cities conducted by the World Bank and the
Enterprise Survey Organization of China in 2005 (World Bank, 2007). The survey sampled
100 industrial firms in each city except for four municipalities where 200 industrial firms
were sampled respectively to evaluate the investment climate of 120 cities from almost all of
the Chinese provinces. Cai, Fang and Xu (2009) argue that travel and entertainment costs
(ETC) can be a efficient measure of corruption in Chinese firms since “Chinese managers
commonly use the ETC accounting category to reimburse expenditures used to bribe
government officials, to entertain clients and suppliers, or to accommodate managerial

10
excess” (p. 2). And they provide strong evidence that “firm’s ETC consists of a mix that
includes expenditures on government officials both as ‘grease money’ and ‘protection
money’, implicit CEO pay, and managerial excesses” (p. 22). Therefore we plausibly employ
the average travel and entertainment costs relative to the sales of investigated firms in a city
(AETC, henceforth) as a proxy for the corruption level of the city as AETC derived from
representative firms in Chinese industrialized cites can indirectly reflect the overall levels of
corruption there. Statistic details of this variable can be found in World Bank (2007). The
detailed description of other variables utilized in the current analysis is given in the
Appendix.
3.1 Province-level Analysis
To compare corruption in China, the largest developing country, to that in America, the
largest developed country, our basic specification to investigate the causes of corruption is
similar to that of Glaeser and Saks (2006):
Registered Cases on Corruption = α + γ•Income + δ•Education + η•Anti-corruption
+ β • Other regional characteristics + Error term
We measure the regional income level using the logarithm of real Gross Regional Product per
capita and the level education with the proportion of the regional population over 6 that have
completed a college degree. This is consistent with Glaeser and Saks (2006) who also
included the regional income and education level in their specifications. We also try to get a
measure of regional anti-corruption efforts among the control variables. Since the law
systems in different Chinese regions are the same, the difference in the anti-corruption efforts
of the various regions lies in the individual regional legal enforcements against corruption.
We hence use, similar to Goel and Nelson (1998), the real per capita expenditure on police,
procuratorate, court and judiciary by local government as a proxy for the regional anti-
corruption effort. Controlling for anti-corruption efforts is insofar useful as provincial
registered cases on corruption may also reflect the effort that local governments have made to
fight against corruption (Treisman, 2007). We also add in our cross-sectional analysis a
geographic dummy that is equal 1 for the provinces in North China. The dummy variable
takes into account that there are cultural differences between North and South China. These
cultural differences may be driven by individualism, one of Hofstede's five cultural
dimensions (Hofstede and Hofstede, 2005). People in North China are more collectivistic

11
than people in South China (Eberhard, 1965). Interestingly, Banfield (1958) and Hooper
(1995) have confirmed a link between the propensity to favour in group members
(collectivism) and official corruption in Spain and Italy respectively. Thus, we may predict
that a higher level of collectivism might lead to more frequent incidences of corruption in
North China.
We first run cross-sectional regressions with a 10-year average of corruption variable to
mitigate the data noise problem, which was similar to the one that Glaeser and Saks (2006)
confronted. To deal with the potential reverse causality between the income level and the
incidence of corruption which Treisman (2000) and Glaeser and Saks (2006) pointed out, we,
according to Hall and Jones (1999) and Rappaport and Sachs (2003), use geographic
characteristics (latitudes of provincial capitals and a dummy variable indicating provincial
proximities to oceans) as instruments for the provincial levels of income. Our selection of
instrumental variables is mainly based on the long-standing fact that there exists both an
economic fault line between North China and South China since the Song dynasty, and also a
great income gap between coastal and inland provinces in China since the opening of the
treaty ports in the late Qing dynasty (Li, 2001). Our selected geographic instruments are
highly correlated with these regional disparities and hence also with regional economic
development. Furthermore we cannot image that the instrumental variables affect corruption
directly or through channels other than economic development. We therefore have reason to
believe that our instruments are valid. Due to the lack of valid instruments, we adopt the
lagged value (data from the 1990 Census) of the education variable in regressions to address
the similar endogeneity problem of the variable education.
Our cross-sectional analysis using the IV approach, though addressing the problems of
endogeneity and data noise, has the problem of small sample size. We therefore then operate
a panel analysis using fixed effects regressions with a large panel sample. The panel analysis
controls the endogeneity problem and the data noise by regional fixed effects and time fixed
effects. However, it is obvious that time fixed effects can only control part of the data noise.
Moreover, fixed effects regressions cannot correct the bias caused by the time-varying
omitted variables. The causes of corruption in China therefore can be better explained by the
combination of both IV and fixed effects results.
3.1.1 Deterrence and Corruption
In this section, we will empirically test the relationship between deterrence and corruption.
We first examine the correlation between corruption and income, education and anti-

12
corruption effort. Our approach is similar to the one conducted by Glaeser and Saks (2006).
This has the advantage that we are better able to compare the results between the biggest
developed market economy (US) and the largest developing and transitional economy. The
results are presented in Table 3. It can be seen that income is positively correlated with
corruption in China. In estimations the coefficient is statistically significant. This relationship
seems at first glance puzzling since it contradicts the previous literature. However, such a
result might be driven by the transitional nature of Chinese society. It is worth noting that
countries making the transition to a market economy often experience unprecedented
corruption during their transition (Levin and Satarov, 2000 and Paldam and Svendsen, 2000).
According to the World Bank (2000, p.vii), “the simultaneous processes of developing a
market economy, designing new political and social institutions and redistributing social
assets have created fertile ground for corruption” in transitional countries. The increase in
corruption in these countries seemed therefore to be a consequence of the transition.
Specifically, China started its transitional process with economic reform loosening up the
economy while political reform lagged behind. Government hence continues to play an
extensive role in the economic environment in the absence of institutional and legal
constraints. One of the consequences is unavoidably corruption. Furthermore, this kind of
corruption will be more pervasive if government power is widened through increased
economic activities. Thus, regions with a higher level of income might therefore be more
corrupt.
In order to determine the direction of the causality between income and corruption, we as
discussed previously adopted the instruments for income, namely latitudes and proximities to
oceans in our regressions. These instruments have proven to be suitable for income level and
passed the identification test and the weak identification test in our case (Table 3). Similar to
Gundlach and Paldam (2009), the main direction in the circular relationship between income
and corruption in China is from income to corruption since the Hausman tests show that the
IV estimates do not differ systematically from the corresponding OLS estimates in all the
cross-section regressions reported in Table 3, which means there is not significant upward
bias caused by reverse causality. This result, which is robust when including more control
variables, supports our explanation about the positive relationship between income and
corruption.

13
Table 3 Relationship between annual corruption rate and levels of income, education and anti-corruption efforts
Average Annual Cases (1998-2007) Annual Cases (1998-2007) OLS IV Pooled-OLS Fixed effects
(1) (2) (3) (4) (5) (6) Income 0.95*** 0.89** 1.16*** 1.15*** 0.61*** 0.56** (0.30) (0.34) (0.33) (0.33) (0.11) (0.22) Education 0.090 0.063 0.045*** 0.029 (0.13) (0.12) (0.018) (0.020) Anti-corruption -0.0055*** -0.0070*** -0.0061*** -0.0074** -0.0070*** -0.0053*** (0.0015) (0.0025) (0.0016) (0.0031) (0.00073) (0.00081) North 0.81*** 0.73*** 0.74*** 0.71*** 0.72*** (0.20) (0.20) (0.19) (0.19) (0.097) Constant -4.94* -4.36 -6.64** -6.54** -2.30** -2.17 (2.47) (2.79) (2.71) (2.72) (0.98) (1.94) 1st stage F
51.17 [0.00]
128.69 [0.000]
OverID test
2.22 [0.14]
2.13 [0.15]
Weak ID test
20.34 {19.93}
20.34 {19.93}
Hausman test
1.38 [0.71]
3.25 [0.52]
Time fixed effects Yes Region fixed effects Yes Observations 31 31 31 31 310 310 R-squared 0.52 0.53 0.51 0.52 0.33 0.56 Notes: a. Robust standard errors in parentheses, p-values in brackets, critical values in braces, *** p<0.01, **
p<0.05, * p<0.1. b. Unless noted otherwise, we hereafter use the value in 1990 of the education variable, the average value
during 1997-2006 of the anti-corruption efforts variable and the values in 1997 of the other explanatory variables in the cross-section regressions. And we utilize the one-year lagged values of explanatory variables henceforth in the panel regressions.
We then perform fixed-effects regressions with the panel data from 1998 to 2007. We use
lagged values of levels of income and education in the regressions since registered cases on
corruption in one year actually reflect the number of corrupt acts done previously but
detected in the year. We consider time fixed effects in our panel estimation to control anti-
corruption campaigns the Chinese government launched in some years within our
investigation period. The panel results shown in Table 3 are generally in line with our cross-
sectional findings. The coefficient for income is in both cases statistically significant. We
also observe a positive relationship between education and corruption. However, the
coefficient is mostly not statistically significant. On the other hand, we observe that the anti-

14
corruption efforts significantly depress corruption in China. Last but not least, we find in
Table 3 that in line with our prediction, northern provinces have significantly higher levels of
corruption than southern provinces in China.
We now explore whether the negative relationship between income and corruption in
literature will emerge in China. Basu and Li (2000) predicted theoretically that corruption
levels in transitional countries will decrease after these countries establish or improve
institutions, effectively checking the abuse of public office as the transition processes move
on. The depressing influence of income level on corruption will then dominate. This
prediction has been confirmed in several Eastern European countries (World Bank, 2006).
Primary evidence of this trend in China is shown in Table 4, where the size of the positive
effect of income on corruption during 2003-2007 is 30% lower than that during 1998-2002,
which implies that the positive effects of income on corruption levels in China do decrease as
reforms continue.
Table 4 The Effect of income on corruption rate in 1998-2002 and 2003-2007
Average Annual Cases (1998-2002) Average Annual Cases (2003-2007) (1) (2) (3) (4) Income 1.33*** 1.30*** 0.97*** 0.96*** (0.39) (0.39) (0.30) (0.30) Education 0.044 0.062 (0.14) (0.10) Anti-corruption -0.0088*** -0.010** -0.0042*** -0.0051*** (0.0030) (0.0049) (0.0010) (0.0016) North 0.79*** 0.78*** 0.70*** 0.66*** (0.23) (0.22) (0.17) (0.18) Constant -7.90** -7.69** -5.17** -5.06** (3.24) (3.21) (2.52) (2.51) Observations 31 31 31 31 R-squared 0.48 0.49 0.49 0.50
Notes: a. Robust standard errors in parentheses, *** p<0.01, ** p<0.05, * p<0.1. b. We here adopt the average values during the periods of 1998-2002 and 2002-2007 of the Anti-corruption
effort variable in the first two columns and the others respectively.
Further evidence about the tendency of the relationship between income and corruption is
provided in Table 5. We measure the change in corruption by the difference between the
provincial average corruption rates over the 5-year periods 1998–2002 and 2003–2007, and
then regress the change on the initial levels of income, education and corruption (averages in
the period 1998-2002). The strong negative coefficients on the initial corruption level in the
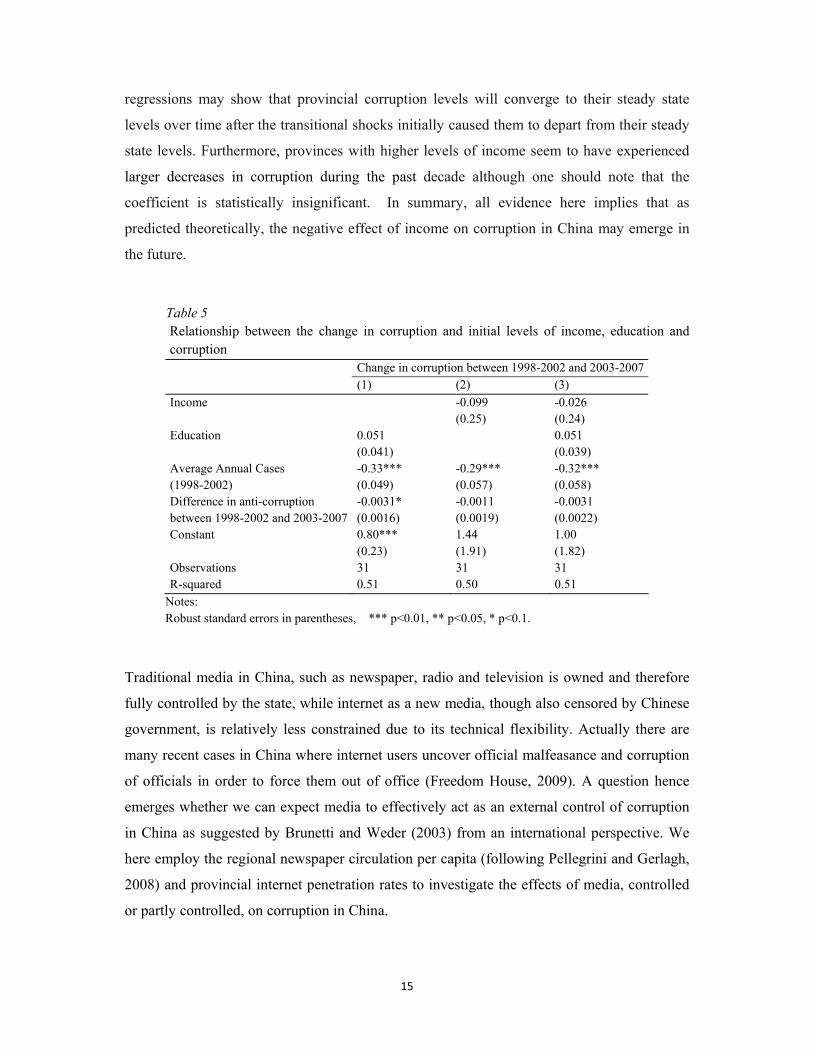
15
regressions may show that provincial corruption levels will converge to their steady state
levels over time after the transitional shocks initially caused them to depart from their steady
state levels. Furthermore, provinces with higher levels of income seem to have experienced
larger decreases in corruption during the past decade although one should note that the
coefficient is statistically insignificant. In summary, all evidence here implies that as
predicted theoretically, the negative effect of income on corruption in China may emerge in
the future.
Table 5 Relationship between the change in corruption and initial levels of income, education and corruption Change in corruption between 1998-2002 and 2003-2007 (1) (2) (3) Income -0.099 -0.026 (0.25) (0.24) Education 0.051 0.051 (0.041) (0.039) Average Annual Cases -0.33*** -0.29*** -0.32*** (1998-2002) (0.049) (0.057) (0.058)
-0.0031* -0.0011 -0.0031 Difference in anti-corruption between 1998-2002 and 2003-2007 (0.0016) (0.0019) (0.0022) Constant 0.80*** 1.44 1.00 (0.23) (1.91) (1.82) Observations 31 31 31 R-squared 0.51 0.50 0.51
Notes: Robust standard errors in parentheses, *** p<0.01, ** p<0.05, * p<0.1.
Traditional media in China, such as newspaper, radio and television is owned and therefore
fully controlled by the state, while internet as a new media, though also censored by Chinese
government, is relatively less constrained due to its technical flexibility. Actually there are
many recent cases in China where internet users uncover official malfeasance and corruption
of officials in order to force them out of office (Freedom House, 2009). A question hence
emerges whether we can expect media to effectively act as an external control of corruption
in China as suggested by Brunetti and Weder (2003) from an international perspective. We
here employ the regional newspaper circulation per capita (following Pellegrini and Gerlagh,
2008) and provincial internet penetration rates to investigate the effects of media, controlled
or partly controlled, on corruption in China.

16
Table 6 Relationship between corruption rate and media
Average Annual Cases (1998-2007) Annual Cases (1998-2007) IV Fixed effects (1) (2) (3) (4) (5) (6) Newspaper 0.0029 -0.029** -0.0048*** -0.0049*** (0.0062) (0.011) (0.00063) (0.00064) Internet -0.61** -1.25*** -0.0063 -0.013 (0.25) (0.30) (0.022) (0.016) Income 1.09*** 0.86*** 1.21*** 0.55*** 0.56** 0.56*** (0.35) (0.25) (0.31) (0.20) (0.22) (0.20) Education 0.053 0.31** 0.65*** 0.10*** 0.032 0.11*** (0.13) (0.14) (0.16) (0.017) (0.023) (0.019) Anti-corruption -0.0076** -0.0069*** -0.0040** -0.0044*** -0.0051*** -0.0040*** (0.0032) (0.0024) (0.0018) (0.00061) (0.00091) (0.00075) North 0.73*** 0.66*** 0.37* (0.21) (0.18) (0.22) Constant -5.99** -4.30** -7.35*** -2.62 -2.19 -2.67 (2.94) (2.03) (2.66) (1.79) (1.94) (1.79) Observations 31 31 308 310 308 R-squared 0.52 0.62 0.62 0.56 0.62 Time fixed effects Yes Yes Yes Region fixed effects Yes Yes Yes
Notes: a. Robust standard errors in parentheses. *** p<0.01, ** p<0.05, * p<0.1. b. We here use the value of internet penetration rates in 1998 in the cross-section regressions.
Evidence in Table 6 seems to be moderate. Controlling levels of income, education and anti-
corruption efforts, we find in cross-sectional regressions (the first three columns) that the
internet media play an important role in disclosing bureaucratic corruption in China while the
role of traditional media here seems to be weaker (statistically significant with a negative sign
in specification (3)). However, the panel estimation results in the last three columns show that
the traditional media newspapers significantly depress corruption in China while internet
media do not. Nevertheless, the overall tendency suggest that both traditional and internet
media in China do exert negative effects on corruption even if they are (partly) controlled by
the Chinese government. Anti-corruption, as long as it is held within limits, can also be in the
interest of nondemocratic governments.
Now we briefly review the modern history of China before we explore the impact of the
common law system on corruption in China. During the last period of Qing Dynasty (1840-
1911), China was beaten in a sequence of wars against foreign colonial powers. As a result,
foreign powers including Britain carved spheres of influence out of China through a series of

17
unequal treaties. They, according to their own values, influenced or even reconstructed the
local administration systems including the legal system, infrastructure and education within
the domains they controlled. These influences may persist to cause some regional differences
in current China. We hence introduce a dummy indicating whether a province was in the
influence sphere of Britain in the late Qing Dynasty, to capture the influence of the common
law system on current Chinese provinces.
Table 7 Influence of the common law system on corruption rate
Average Annual Cases (1998-2007) Annual Cases (1998-2007) IV Fixed effects (1) (2) (3) (4) (5) (6) British -0.18 -0.11 -0.21** -0.18* (0.15) (0.21) (0.088) (0.093) Church university -0.46*** -0.45*** -0.21*** -0.20*** (0.17) (0.17) (0.078) (0.077) income 1.11*** 1.70*** 1.66*** 0.58** 0.69*** 0.70*** (0.31) (0.37) (0.37) (0.22) (0.24) (0.24) education 0.090 0.060 0.077 0.026 0.029 0.027 (0.12) (0.13) (0.12) (0.020) (0.019) (0.020) Anti-corruption -0.0079*** -0.0086** -0.0088*** -0.0052*** -0.0056*** -0.0055*** (0.0026) (0.0034) (0.0031) (0.00081) (0.00080) (0.00080) North 0.54*** 0.35 0.25 (0.15) (0.23) (0.24) Constant -6.01** -10.75*** -10.28*** -2.35 -3.36 -3.47 (2.57) (2.95) (2.97) (2.00) (2.10) (2.15) Observations 31 31 31 310 310 310 R-squared 0.53 0.57 0.57 0.56 0.57 0.57 Time fixed effects Yes Yes Yes Region fixed effects Yes Yes Yes
Notes: Robust standard errors in parentheses. *** p<0.01, ** p<0.05, * p<0.1.
Specifically, education founded by Britain and the US in China, might be the key point to the
historical influence of the common law system. F.L. Hawks Pott, the president of Saint
John’s University founded by the American Episcopal Church, said in 1890: “in our school,
we trained China's future teachers and propagators, making them the leaders and comperes in
the future and casting the greatest influences on the future China”(Yang and Ye, 1993, p.
289). Soochow University founded by the American Methodist Missionaries in 1900 was
very famous for its education on Anglo-American law in China. We therefore also use the
numbers of church universities founded by Britain and the US in each province till 1922 to
proxy for the historical influence of the common law system. Results in Table 7 show the
18
tendency that provinces affected by the British common law system historically have a lower
level of corruption than the other provinces in China, which is consistent with Treisman’s
(2000) cross-country finding.
In Table 8 we turn to the role of social heterogeneity. Firstly, in line with the cross-
country finding, we observe that higher income inequality measured by Gini coefficients
(Meng, Gregory and Wang, 2007) significantly raises the incidence of corruption in China.
Secondly, we test the relationship between racial fractionalization and corruption in China.
As discussed before, ethnic fractionalization may have a positive effect on corruption since
corrupt officials may be still supported by their own ethnic groups due to political reason. In
China the Han nationality is the major nationality, which accounts for, according to the
national census in 2000, 91.6% of the total population of China although there are altogether
56 nationalities in China2. In provinces such as Jiangsu and Shanxi where almost all (more
than 99.6%) residents belong to the Han people, the influence of ethnic diversity is probably
not perceived since ethnic minorities there might be too small to protect the corrupt officials.
We therefore need to control the regional population share of Han nationality when we
investigate the effect of ethnic fractionalization on corruption. We measure the ethnic
fractionalization in China with the dissimilarity index. It is calculated as one minus a
Herfindahl concentration index, 1-∑si2, where si is the population share of nationality i, from
the national census in 2000. We use the values derived from the 2000 national census to
depict the ethnic fractionalization in Chinese provinces in the investigation period because
the provincial nationality compositions of population in China are relatively stable during a
decade. However, it prevents us from running fixed effects regressions in our panel analysis.
We instead perform the Pooled OLS regressions controlling time fixed effects in the panel
section. The empirical findings support our analysis: the population share of Han nationality
is negatively correlated with corruption. Controlling regional population shares of Han
nationality, we further find that the dissimilarity index is negatively associated with the local
corruption level (see Table 8). Given that the Han nationality dominates in most Chinese
provinces, a small regional dissimilarity index may imply that there is at least one ethnic
minority in the province that is populous enough to shelter its corruption officials. The
2 There are 56 ethnic groups in China. Except the Han nationality, other 55 ethnic groups in China are customarily referred to as ethnic minorities. According to the national census in 2000, 37 ethnic minorities have a population of less than one million. Among them, there are 20 ethnic groups with a population of below 100,000. The smallest ethnic group, Lhoba, only has the population of 2,965. Like the Han people, ethnic minorities also can be found throughout the country.

19
negative relationship between the dissimilarity index and corruption actually means that
ethnic fractionalization promotes local corruption in Chinese provinces. Combining the above
findings, we then conclude that ethnic fractionalization increases corruption in China.
Table 8 Relationship between corruption rate and social heterogeneity
Average Annual Cases (1998-2007) Annual Cases (1998-2007) IV FE Pooled OLS (1) (2) (3) (5) (6) (7) Gini 9.42** 7.12** (4.78) (3.58) Han -0.013* -0.021** -0.0045** -0.0054* (0.0075) (0.0093) (0.0023) (0.0031) Dissimilarity -1.17* -0.33 (0.63) (0.27) Income 1.61*** 1.53*** 1.10** 0.68* 0.89*** 0.24 (0.41) (0.43) (0.45) (0.35) (0.15) (0.17) Education 0.43*** 0.21* 0.098 -0.062 0.10*** 0.017 (0.16) (0.12) (0.14) (0.057) (0.022) (0.031) Anti-corruption -0.018*** -0.012*** -0.014*** -0.0011 -0.0095*** -0.0093*** (0.0048) (0.0037) (0.0040) (0.0047) (0.0011) (0.0013) North 0.51** 0.56*** 0.40** (0.22) (0.20) (0.19) Constant -12.24*** -8.37*** -4.25 -4.51 -4.55*** 0.80 (3.72) (3.01) (2.91) (2.94) (1.28) (1.41) Observations 30 31 31 120 310 310 R-squared 0.56 0.54 0.66 0.60 0.32 0.41 Time fixed effects Yes Yes Yes Region fixed effects Yes No No
Notes: a. Robust standard errors in parentheses *** p<0.01, ** p<0.05, * p<0.1. b. We do not have the Gini Coefficients of Tibet. c. We also control provincial shares of urban population in specifications (3) and (7) as people from the
same ethnic group often gather together in rural area hence exert stronger effect on corruption than those in urban area.
Finally we explore the effect of the public sector’s relative wage, which can be seen as a
proxy for the public officials’ opportunity cost to behave corrupt. Consistent with the cross-
country evidence reported by Treisman (2000), our results in Table 9 strongly support
previous theoretical prediction that the relative wage is negatively correlated with the
incidence of corruption.
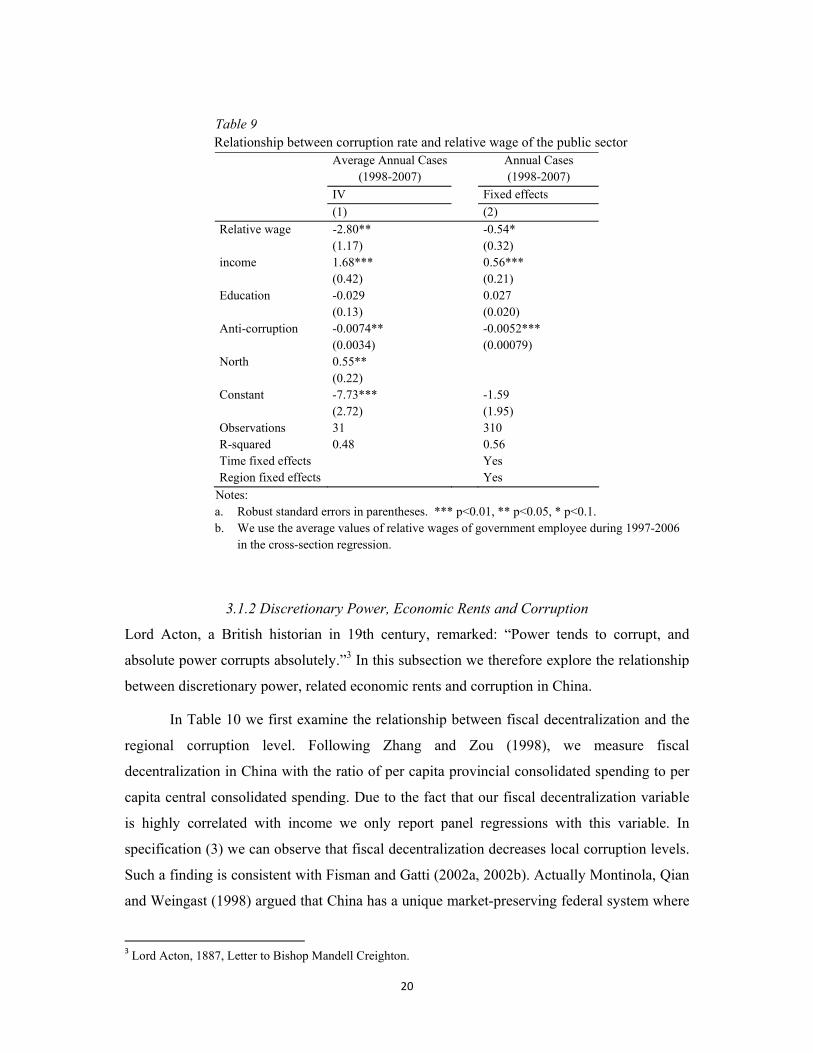
20
Table 9 Relationship between corruption rate and relative wage of the public sector
Average Annual Cases
(1998-2007) Annual Cases
(1998-2007) IV Fixed effects (1) (2) Relative wage -2.80** -0.54* (1.17) (0.32) income 1.68*** 0.56*** (0.42) (0.21) Education -0.029 0.027 (0.13) (0.020) Anti-corruption -0.0074** -0.0052*** (0.0034) (0.00079) North 0.55** (0.22) Constant -7.73*** -1.59 (2.72) (1.95) Observations 31 310 R-squared 0.48 0.56 Time fixed effects Yes Region fixed effects Yes
Notes: a. Robust standard errors in parentheses. *** p<0.01, ** p<0.05, * p<0.1. b. We use the average values of relative wages of government employee during 1997-2006
in the cross-section regression.
3.1.2 Discretionary Power, Economic Rents and Corruption
Lord Acton, a British historian in 19th century, remarked: “Power tends to corrupt, and
absolute power corrupts absolutely.”3 In this subsection we therefore explore the relationship
between discretionary power, related economic rents and corruption in China.
In Table 10 we first examine the relationship between fiscal decentralization and the
regional corruption level. Following Zhang and Zou (1998), we measure fiscal
decentralization in China with the ratio of per capita provincial consolidated spending to per
capita central consolidated spending. Due to the fact that our fiscal decentralization variable
is highly correlated with income we only report panel regressions with this variable. In
specification (3) we can observe that fiscal decentralization decreases local corruption levels.
Such a finding is consistent with Fisman and Gatti (2002a, 2002b). Actually Montinola, Qian
and Weingast (1998) argued that China has a unique market-preserving federal system where
3 Lord Acton, 1887, Letter to Bishop Mandell Creighton.

21
local governments have strong fiscal incentives to support local business development and
hence restrict their own predation on local enterprises. The view of Shleifer and Vishny
(1993) that decentralization results in “excess” rent extraction due to the lack of coordination
among officials therefore may not apply in China.
Table 10 Relationship between corruption rate and discretionary power of the local government
Average Annual Cases (1998-2007) Annual Cases (1998-2007) IV Fixed effects (1) (2) (3) (4) (5) Fiscal decentralization -0.019*** (0.0059) Government size 0.079 0.052* (0.053) (0.028) Marketilization -0.20*** -0.22** (0.076) (0.086) Income 1.27*** 2.19*** 0.60*** 0.58*** 1.63*** (0.32) (0.53) (0.22) (0.21) (0.56) Education -0.055 0.32*** 0.029 0.0041 0.018 (0.14) (0.094) (0.020) (0.022) (0.031) Anti-corruption -0.0061* -0.018*** -0.0049*** -0.0052*** -0.0089*** (0.0033) (0.0038) (0.00081) (0.00079) (0.0015) North 0.79*** 0.32 (0.20) (0.25) Constant -8.36*** -13.65*** -2.51 -2.72 -9.89** (2.83) (4.023) (1.95) (1.92) (4.52) Observations 31 30 310 310 155 R-squared 0.51 0.55 0.56 0.56 0.60 Time fixed effects Yes Yes Yes Region fixed effects Yes Yes Yes
Notes: a. Robust standard errors in parentheses. *** p<0.01, ** p<0.05, * p<0.1. b. We use the marketization index in 1997 in the cross-sectional analysis and those from 2001to 2005 in
our panel analysis.
We then turn to the linkage between the provincial government size and local corruption
rates. Similar to LaPalombara (1994), we utilize the ratio of regional consolidated revenue to
Gross Regional Product to measure the provincial government size. We find that the
provincial corruption rate appears to increase with the provincial government size, which is
consistent with previous studies such as Goel and Nelson (1998). The Chinese market-
preserving federal system, which to some extent limits local governments’ expropriation,
might account for the weak effect of local government size here. We finally investigate the
effect of government regulation on local corruption level. Here we use the provincial

22
marketization index of China from Fan, Wang, and Zhu (2001, 2006) to measure the
provincial government regulation. With 19 indicators, the index covers five main aspects of
the Chinese marketization: the relationship between the market and the government, the
growth of the non-state economy, the development of the product market, the development of
the factor market, and the market environment including intermediaries and institutional and
jurisdictional arrangements. Thus, this index is negatively related to the degree of regulation
since marketization is connected with the deregulation of government. Unlike Treisman
(2000) and Glaeser and Saks (2006), our regressions including the provincial marketization
index, strongly confirm that government regulations promote while deregulation depresses
corruption in China.
We now focus on the role of economic rents. In this instance we are going to test the
associations between the corruption level and several other factors influencing the scale of
economic rents in China. We first find in Table 11 that regional trade openness, measured by
the regional share of imports in Gross Regional Product, significantly lowers the provincial
level of corruption in China. The fixed effects approach in our estimation addresses the
potential simultaneity bias suggested by Treisman (2000). The abundance of natural
resources is hypothesized to be an inducement to corruption because of the associated
economic rents. Since the export share of natural resources, proposed by Ades and Di Tella
(1999), is not suitable to measure the regional abundance of natural resource in within-
country analysis, we, following Xu and Wang (2006), use the fraction of employment in the
mining and quarrying sector as a proxy for the provincial abundance of natural resources in
China. The results in Table 11 indicate that the abundance of natural resources is significantly
correlated with higher level of corruption.
We further investigate the relationship between the size of the state-owned enterprise
sector and corruption. The state-owned enterprise sector plays an important role in Chinese
economy. Due to the soft budget constraints and the lack of monitoring, managers and
officials who have rights over the state-owned enterprises they administrate can easily extract
economic rents from the state-owned enterprises. Abundant economic rents in the state-
owned enterprises are within easy reach of them. Therefore the corruption level might be
positively correlated with the size of the state-owned enterprise sector. Using the share of
employment of the state-owned enterprise sector as a proxy for its size, we provide clear
evidence that the state-owned enterprise sector is one of the sources of corruption in China.

23
Table 11 Relationship between corruption rate and economic rents
Average Annual Cases (1998-2007) Annual Cases (1998-2007) IV Fixed effects (1) (2) (3) (4) (5) (6) Openness -0.017*** -0.020*** (0.0060) (0.0037) Resource 0.057** 0.054*** (0.026) (0.013) State-owned 3.32* 3.32** (2.06) (1.41) Income 1.22*** 1.26*** 1.04*** 0.73*** 0.59*** 0.43* (0.32) (0.32) (0.32) (0.22) (0.21) (0.24) Education 0.11 0.049 -0.045 0.065*** 0.023 -0.0045 (0.088) (0.12) (0.13) (0.019) (0.019) (0.028) Anti-corruption -0.0055** -0.0065** -0.0072*** -0.0029*** -0.0043*** -0.0051*** (0.0027) (0.0031) (0.0027) (0.00097) (0.00081) (0.00088) North 0.66*** 0.48** 0.54*** (0.19) (0.24) (0.20) Constant -7.24*** -7.79*** -5.73** -4.34** -2.92 -1.12 (2.71) (2.65) (2.60) (2.01) (1.89) (2.14) Observations 31 31 31 310 310 248 R-squared 0.56 0.55 0.56 0.58 0.58 0.60 Time fixed effects Yes Yes Yes Region fixed effects Yes Yes Yes
Notes: Robust standard errors in parentheses. *** p<0.01, ** p<0.05, * p<0.1.
3.1.3 Panel Data Evidences
We now perform a panel data analysis with full specification using a panel of 31 Chinese
provincial regions over a period of ten years to test the robustness of our previous results. The
main explanatory variables in the previous regressions are all included in our current
specifications. We successively adopt pooled-OLS, FGLS and fixed effects approaches to re-
examine the above results. We use the feasible generalized least squares method here in order
to allow estimation in the presence of autocorrelation within panels and heteroskedasticity
across panels. Our panel results are presented in Table 12. Results in columns of Table 12 are
similar in general, which shows the robustness of the obtained findings. More importantly,
panel estimates here are consistent with previous estimates though the correlations between
some independent variables make their estimation less precise, especially when the sample
size decreases. It therefore shows that our empirical findings about the determinants of the
provincial corruption rate in China are robust to the different specifications and econometric
methods. To compare the relative strength of determinants of corruption in China, we also list

24
their standardized (beta) coefficients in specifications (5) and (6) in Table 12. The last
question that remains to be examined in our current study therefore is whether our findings
are still robust when applying them to a different data set. To answer this question we will, in
the next subsection, explore the city-level data set instead of the current province-level data.
Table 12 Relationship between corruption rate and its determinants: panel data analysis
Annual Cases (1998-2007) Pooled-OLS FGLS Fixed effects (1) (2) (3) (4) (5) (6) Income 1.47*** 2.81*** 1.08*** 2.72*** 0.83*** [0.54] 2.39*** [1.29] (0.18) (0.46) (0.19) (0.37) (0.20) (0.57) Education 0.095*** 0.059* 0.058*** 0.031 0.11*** [0.46] 0.065** [0.25] (0.021) (0.036) (0.020) (0.027) (0.018) (0.031) Anti-corruption -0.0046*** -0.00072 -0.0039*** -0.0015 -0.0037*** [-0.35] -0.0022 [-0.17] (0.0011) (0.0031) (0.0013) (0.0021) (0.0010) (0.0031) Newspaper -0.0027*** -0.0033*** -0.0016* -0.0019* -0.0037*** [-0.35] -0.0046*** [-0.38] (0.00059) (0.0011) (0.00082) (0.0011) (0.00073) (0.0012) University -0.33*** -0.42*** -0.19*** -0.26*** -0.10 [-0.083] -0.30** [-0.22] (0.072) (0.12) (0.066) (0.096) (0.074) (0.13) Han -0.0027 0.0038 -0.0013 -0.00016 -0.0066** [-0.15] 0.0027 [0.057] (0.0023) (0.0054) (0.0030) (0.0043) (0.0027) (0.0054) Relative wage -0.43 -1.09* -0.36 -1.25*** -0.64** [-0.084] -1.13* [-0.12] (0.31) (0.59) (0.32) (0.48) (0.31) (0.66) Decentralization -0.034*** -0.28*** -0.016** -0.27*** -0.021*** [-0.087] -0.20** [-0.47] (0.0058) (0.088) (0.0065) (0.069) (0.0038) (0.096) Openness -0.0079* -0.0049 -0.0060 -0.0057 -0.0071* [-0.17] 0.0012 [0.027] (0.0041) (0.0069) (0.0041) (0.0061) (0.0044) (0.0073) Resource 0.070*** 0.038 0.058*** 0.039* 0.047*** [0.19] 0.038** [0.13] (0.014) (0.024) (0.015) (0.020) (0.014) (0.019) Marketilization -0.30*** -0.25*** -0.39*** [-0.75] (0.090) (0.070) (0.12) Constant -10.48*** -18.43*** -6.90*** -18.45*** -4.41** -14.96*** (1.51) (3.53) (1.64) (2.89) (1.80) (4.49) Observations 308 154 308 154 308 154 R-squared 0.55 0.58 0.65 0.68 Time fixed effects
Yes Yes Yes Yes Yes Yes
Region fixed effects No No No No Yes Yes
Notes: a. Robust standard errors in parentheses. *** p<0.01, ** p<0.05, * p<0.1. Beta coefficients in Brackets. b. Since we only have the Gini Coefficient data during 1997-2000, we do not introduce it into our panel
regressions here in order not to worsen the multicollinearity problem due to the sharp decrease in sample size.

25
3.2 City-level Analysis
Using an alternative data set at the city-level gives us the chance to check the robustness of
the above findings. Specifically we will use a different corruption measure (AETC) to
replicate the above analysis. As discussed before, AETC is the average travel and
entertainment costs relative to the sales of investigated firms in Chinese cities in the survey
conducted by World Bank in 2005. Prior literature (World Bank, 2007, Cai, Fang, and Xu,
2009) has proved that the travel and entertainment costs relative to the sales of firms are the
eligible indirect measure for corruption in Chinese cities. However, one should note that less
data is available at the city level. For example, we are not able to explore the effect of social
heterogeneity on corruption in Chinese cities.
Similar to province-level analysis, our baseline specification here is
AETC = α + γ•log (Industrial output per worker) + δ•Education + η•Anti-corruption
+ β•Other city characteristics + Error term
Since corruption indicators here are drawn from industrial firms, we accordingly use the
industrial output per worker in 2003 to reflect local economic development, which is
plausible since China is undergoing industrialization. We also employ fractions of workers
with college completed in 1991 to represent the education levels of cities (lagged values).
The average confidence in the courts of local firms investigated is utilized as a proxy for local
anti-corruption efforts since impartial and efficient courts can prevent expropriation and
hence can significantly promote anti-corruption. We will not adopt the same dummy as in the
province-level analysis to proxy cultural difference. Cities in our data set are the most
developed areas in China and attract people from different parts of the country. The culture in
these cities is hence mixed and difficult to identify. We instead generate a dummy “big city”
to control the difference of the administration authority between cities. It indicates whether a
city belongs to a group of cities with more autonomy rights both in lawmaking and
administration and which contains municipalities, capitals of provinces. These cities are
specifically designated in the state plan and special economic zones in China. This dummy
actually reflects the different degrees of administrative decentralization among Chinese cities
(Cai and Treisman, 2006). We will discuss this political decentralization dummy together
with the fiscal decentralization variable later.
26
To deal with the endogeneity problem of the economic development discussed
previously, we similarly use geographic characteristics, namely the longitudes of cities and a
dummy variable indicating whether a city is in the coastal areas, as instruments for economic
development. Unlike previously implemented, we use here the number of colleges and
universities in each city in 1948 (before the establishment of the People’s Republic of China)
as an instrumental variable for the education level of the city to deal with the potential reverse
causality between education and corruption.
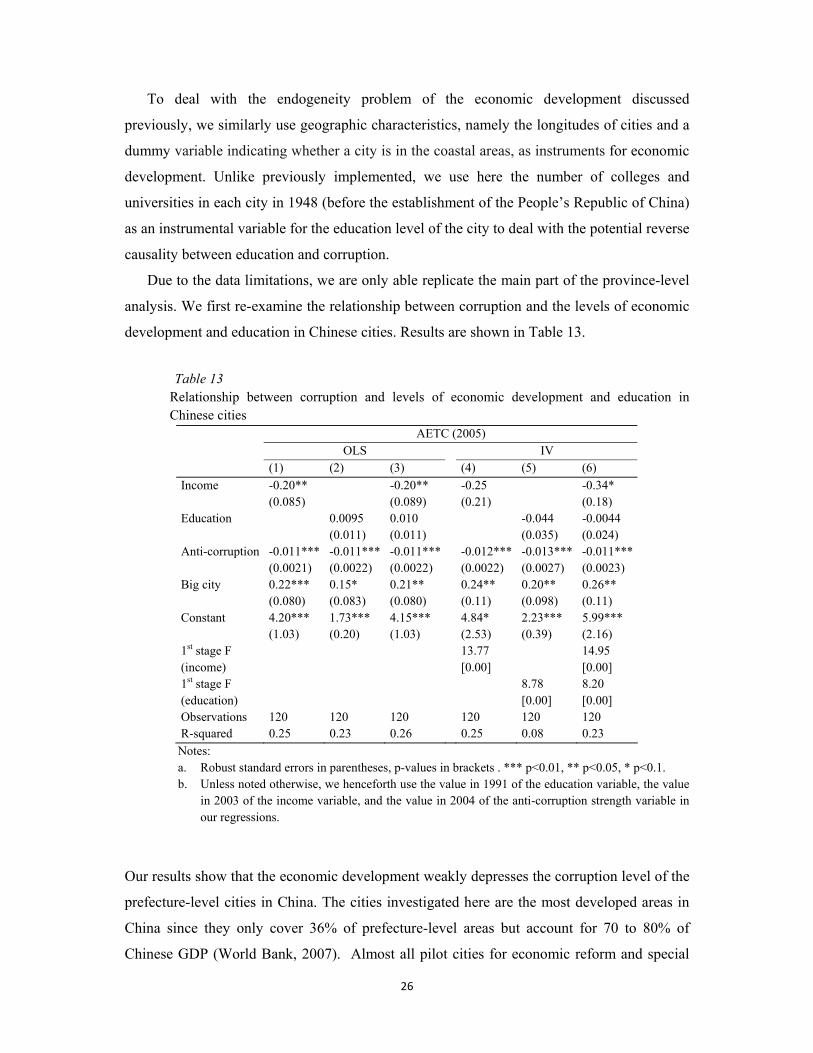
Due to the data limitations, we are only able replicate the main part of the province-level
analysis. We first re-examine the relationship between corruption and the levels of economic
development and education in Chinese cities. Results are shown in Table 13.
Table 13 Relationship between corruption and levels of economic development and education in Chinese cities
AETC (2005) OLS IV (1) (2) (3) (4) (5) (6) Income -0.20** -0.20** -0.25 -0.34* (0.085) (0.089) (0.21) (0.18) Education 0.0095 0.010 -0.044 -0.0044 (0.011) (0.011) (0.035) (0.024) Anti-corruption -0.011*** -0.011*** -0.011*** -0.012*** -0.013*** -0.011*** (0.0021) (0.0022) (0.0022) (0.0022) (0.0027) (0.0023) Big city 0.22*** 0.15* 0.21** 0.24** 0.20** 0.26** (0.080) (0.083) (0.080) (0.11) (0.098) (0.11) Constant 4.20*** 1.73*** 4.15*** 4.84* 2.23*** 5.99*** (1.03) (0.20) (1.03) (2.53) (0.39) (2.16) 1st stage F 13.77 14.95 (income) [0.00] [0.00] 1st stage F 8.78 8.20 (education) [0.00] [0.00] Observations 120 120 120 120 120 120 R-squared 0.25 0.23 0.26 0.25 0.08 0.23 Notes: a. Robust standard errors in parentheses, p-values in brackets . *** p<0.01, ** p<0.05, * p<0.1. b. Unless noted otherwise, we henceforth use the value in 1991 of the education variable, the value
in 2003 of the income variable, and the value in 2004 of the anti-corruption strength variable in our regressions.
Our results show that the economic development weakly depresses the corruption level of the
prefecture-level cities in China. The cities investigated here are the most developed areas in
China since they only cover 36% of prefecture-level areas but account for 70 to 80% of
Chinese GDP (World Bank, 2007). Almost all pilot cities for economic reform and special
27
economic zones in China are included in our data set. It is therefore natural that the negative
effect of economic development on corruption emerges first in these cities since reforms
started earlier there compared to other areas in China and hence also generated more progress
during the transitional process.
Even with an efficient instrument we still cannot find solid evidence of the effect of
education on local corruption in China. Nonetheless, the negative sign of the education
variable in the IV regressions could gives a clue to our previous conjuncture that, similar to
that of economic development, the negative effect of education on corruption may emerge as
the transition process advances in China. In line with previous findings we also observe that
anti-corruption strength is found to strongly deter local corruption in Chinese cities.
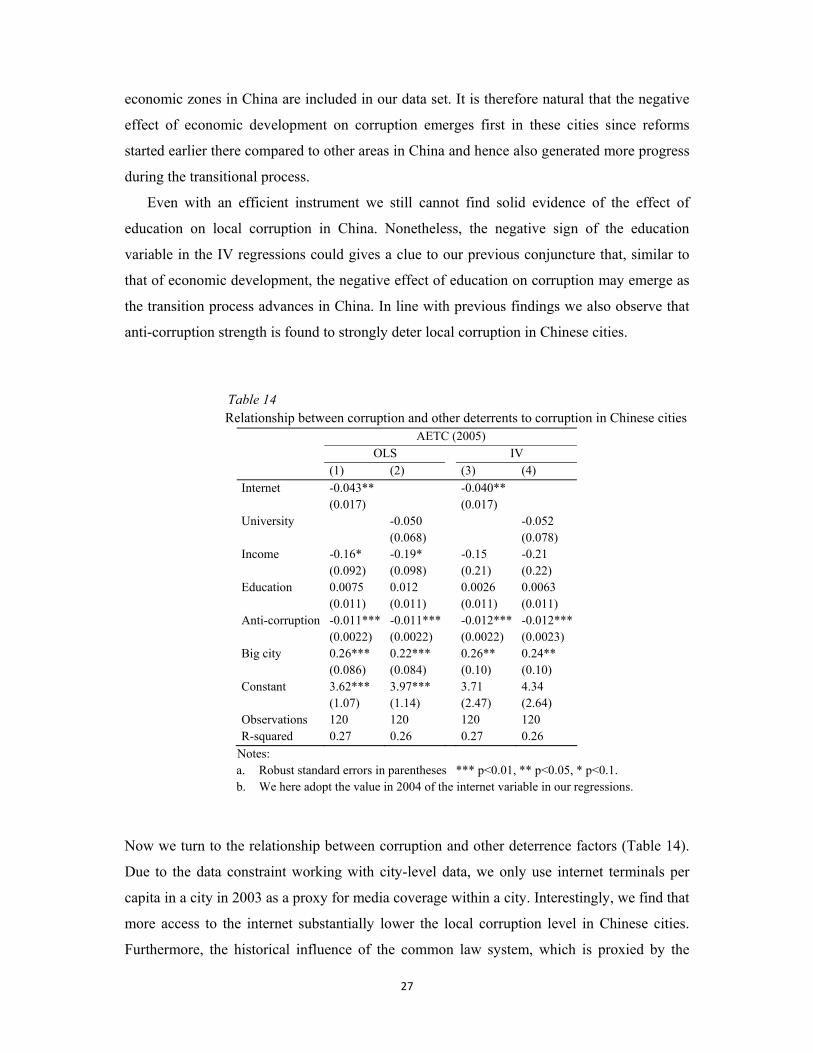
Table 14
Relationship between corruption and other deterrents to corruption in Chinese cities AETC (2005) OLS IV (1) (2) (3) (4) Internet -0.043** -0.040** (0.017) (0.017) University -0.050 -0.052 (0.068) (0.078) Income -0.16* -0.19* -0.15 -0.21 (0.092) (0.098) (0.21) (0.22) Education 0.0075 0.012 0.0026 0.0063 (0.011) (0.011) (0.011) (0.011) Anti-corruption -0.011*** -0.011*** -0.012*** -0.012*** (0.0022) (0.0022) (0.0022) (0.0023) Big city 0.26*** 0.22*** 0.26** 0.24** (0.086) (0.084) (0.10) (0.10) Constant 3.62*** 3.97*** 3.71 4.34 (1.07) (1.14) (2.47) (2.64) Observations 120 120 120 120 R-squared 0.27 0.26 0.27 0.26
Notes: a. Robust standard errors in parentheses *** p<0.01, ** p<0.05, * p<0.1. b. We here adopt the value in 2004 of the internet variable in our regressions.
Now we turn to the relationship between corruption and other deterrence factors (Table 14).
Due to the data constraint working with city-level data, we only use internet terminals per
capita in a city in 2003 as a proxy for media coverage within a city. Interestingly, we find that
more access to the internet substantially lower the local corruption level in Chinese cities.
Furthermore, the historical influence of the common law system, which is proxied by the
28
numbers of church universities founded in cities by Britain and the US before 1922, is also
found to exert a negative, though insignificant effect, on local corruption. According to Lenin
(1916), China was a semi-colony of western countries headed by Britain in the past. The
British influence in China is therefore not as strong as that of the former British colonies. It is
therefore plausible that the effect of the common law system on corruption is weaker in
China.
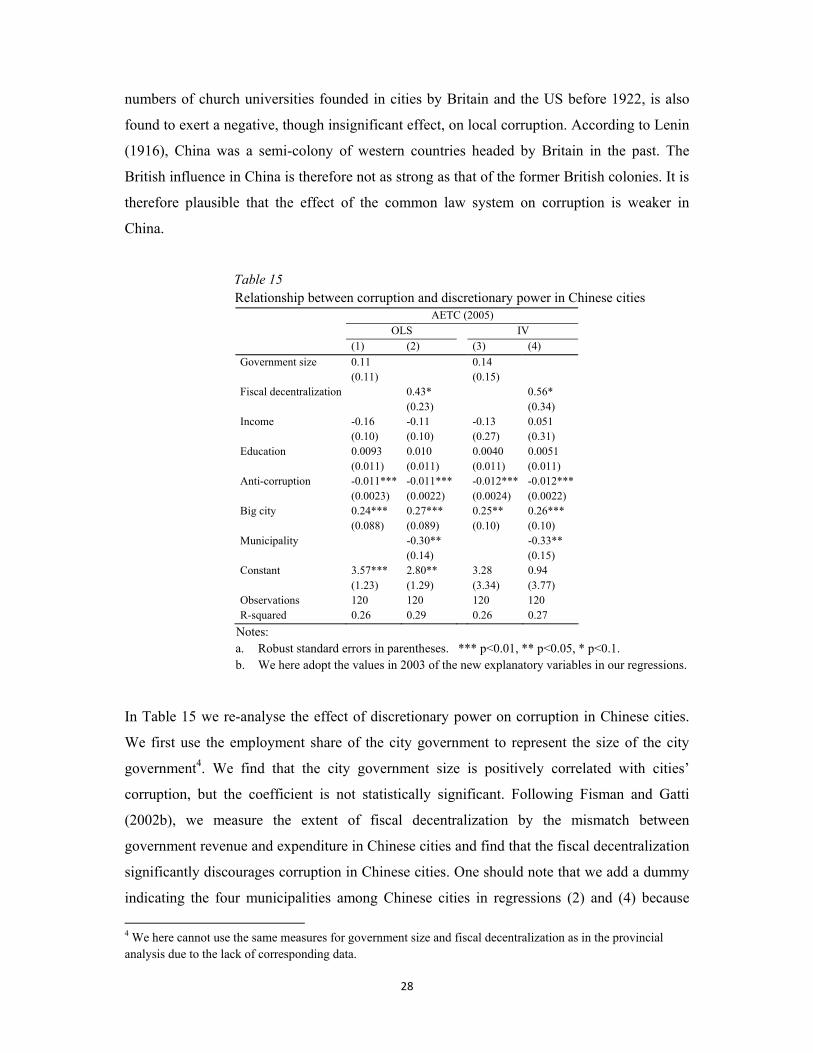
Table 15 Relationship between corruption and discretionary power in Chinese cities
AETC (2005) OLS IV (1) (2) (3) (4) Government size 0.11 0.14 (0.11) (0.15) Fiscal decentralization 0.43* 0.56* (0.23) (0.34) Income -0.16 -0.11 -0.13 0.051 (0.10) (0.10) (0.27) (0.31) Education 0.0093 0.010 0.0040 0.0051 (0.011) (0.011) (0.011) (0.011) Anti-corruption -0.011*** -0.011*** -0.012*** -0.012*** (0.0023) (0.0022) (0.0024) (0.0022) Big city 0.24*** 0.27*** 0.25** 0.26*** (0.088) (0.089) (0.10) (0.10) Municipality -0.30** -0.33** (0.14) (0.15) Constant 3.57*** 2.80** 3.28 0.94 (1.23) (1.29) (3.34) (3.77) Observations 120 120 120 120 R-squared 0.26 0.29 0.26 0.27
Notes: a. Robust standard errors in parentheses. *** p<0.01, ** p<0.05, * p<0.1. b. We here adopt the values in 2003 of the new explanatory variables in our regressions.
In Table 15 we re-analyse the effect of discretionary power on corruption in Chinese cities.
We first use the employment share of the city government to represent the size of the city
government4. We find that the city government size is positively correlated with cities’
corruption, but the coefficient is not statistically significant. Following Fisman and Gatti
(2002b), we measure the extent of fiscal decentralization by the mismatch between
government revenue and expenditure in Chinese cities and find that the fiscal decentralization
significantly discourages corruption in Chinese cities. One should note that we add a dummy
indicating the four municipalities among Chinese cities in regressions (2) and (4) because 4 We here cannot use the same measures for government size and fiscal decentralization as in the provincial analysis due to the lack of corresponding data.

29
they are indeed provincial cities and governments there have greater powers over local public
finance than those of other cities5.
As Cai and Treisman (2006) pointed out, there are three types of government
decentralization: political decentralization, administrative decentralization and fiscal
decentralization. According to the principal-agent framework, the effect of government
decentralization on government corruption depends on two key mechanisms:
interjurisdictional competition and local democracy (Bardhan and Mookherjee, 2006). Fiscal
decentralization always induces the interjurisdictional competition and hence diminishes
local bureaucrats’ ability to extract rents in their delivery of services (Brennan and Buchanan,
1980). Political and administrative decentralizations, however, check government corruption
mainly through democratic pressure for re-election. It is difficult for us to empirically
determine the effect of political decentralization on corruption in China because there is a
steadily high political centralization where leaders of local governments are all appointed
instead of being elected. The fiscal decentralization is shown to significantly depress local
corruption on both a provincial level and in a city level analyses, which supports the
argument of Brennan and Buchanan (1980). With the “big city” dummy we further find that
the administrative decentralization substantially fosters corruption (statistically significant in
all estimations) even when we control the fiscal decentralization. This surprising finding
actually is in line with above analysis. The obvious lack of local democracy prevents the
administrative decentralization from controlling the corruption of local government in China.
Furthermore, according to Gong (2006), without the check of local democracy, an increase in
the discretionary power of local governments due to the administrative decentralization often
leads to more corruption of local governments.
We finally retest the association between the corruption level and the economic rents in
Table 16. Similar to the previous analysis, the trade openness is found to strongly reduce
corruption levels in Chinese cities. We then use the fraction of private enterprises among the
firms investigated in a city to represent the extent of marketization in the city, since in China
the private enterprises sector always increases with marketization. Marketization is also
observed to significantly reduce corruption level in Chinese cities, which is in line with the
previous results obtained at the province-level.
5 The “Municipality” dummy equals to 1 if a city belongs to the four municipalities, 0 otherwise.

30
Overall, the evidence generated using city-level data supports and extends the
findings obtained with province-level data providing. We therefore draw a comprehensive
picture about the causes of corruption in China.
Table 16 Relationship between corruption and economic rents in Chinese cities
AETC (2005) OLS IV (1) (2) (3) (4) Openness -0.0029** -0.0033** (0.0014) (0.0017) Marketization -0.0061* -0.0060* (0.0036) (0.0036) Income -0.10 -0.17* -0.015 -0.19 (0.10) (0.092) (0.24) (0.20) Education 0.0062 0.0079 0.0020 0.0030 (0.010) (0.011) (0.010) (0.011) Anti-corruption -0.011*** -0.0096*** -0.012*** -0.011*** (0.0021) (0.0023) (0.0021) (0.0023) Big city 0.25*** 0.18** 0.24** 0.21** (0.083) (0.079) (0.099) (0.11) Constant 2.97** 4.20*** 2.01 4.48** (1.18) (1.03) (2.89) (2.24) Observations 120 120 120 120 R-squared 0.30 0.27 0.29 0.27
Notes: a. Robust standard errors in parentheses. *** p<0.01, ** p<0.05, * p<0.1. b. We here adopt the values in 2004 of the new explanatory variables in our regressions.
IV. CONCLUING REMARKS
Cross-country analyses on corruption with subjective survey data are suffering from a
number of biases. A comprehensive case study of a representative country might however
prove to be a helpful supplement to these studies. In this paper, we investigated in detail the
causes of corruption using two different sets of objective data across various regions in
China. There are hardly any studies in existence on the causes of corruption that use within-
country data and most of those that do exist employ US data. Thus, our study complements
previous cross-country studies by isolating possible cultural and institutional differences
within each country. We have also complement US studies such as the one conducted by
Glaeser and Saks (2006) using panel data and dealing therefore in a better manner with

31
omitted variable biases and exploring a larger set of independent factors. Furthermore, the
use of two different data sets and different measures of corruption allows a robust
investigation of the causes of corruption.
Figure 1 Determinants of corruption in China
As shown in Figure 1, we found that with the exception of the positive relationship between
income and corruption, cross-country patterns of corruption were generally maintained within
China. We nevertheless found evidence that in China the negative effect of income on
corruption that is frequently suggested by literature may be only temporarily overwhelmed
and may still be in a transitional process. Furthermore in line with Treisman (2007) and
Paldam and Gundlach (2009), our results show that the long-run causation between income
and corruption is mainly from income to corruption. We, however, do not have enough
evidence about the nexus of educational attainment and corruption in China though it seems
that this connection follows the same pattern of the pattern between economic development
and corruption. As a robust result we observe that anti-corruption efforts significantly depress
corruption, while we similarly find strong evidence that North China seemed to be more
corrupt than South China probably due to the fact that people in North China are more
collectivistic than the people in South China. As a novel result we also find relatively strong
Income
Education
Anti-corruption
Collectivistic culture
Common Law
Social heterogeneity
Relative wage
Fiscal decentralization
Government size
Regulations
Openness
Resource abundance
Cost Corruption
Media
Administrative decentralization
Stated-owned enterprises
Benefit
+
+
+
+
+
+
+
—
—
—
—
—
+
—
+
32
evidence that even media that is under specific control of the government does indeed act as a
control instrument for corruption in China. In addition, we now also provide within-country
evidence which complements cross-country results that the British common law system does
indeed adversely affect corruption. Moreover, our findings support the hypothesis that
various social heterogeneities breed corrupt practices. Our results also support the theory that
relatively high relative wages within the public sector prevent officials from corruption.
In addition, we have provided concrete evidence that regions with higher degrees of
regulation appear to be more corrupt. On the other hand, fiscal decentralization tends to
discourage local corruption, which is consistent with Fisman and Gatti (2002a, b), while
administrative decentralization seems to encourage local corruption. Finally, clear evidence
has been given that openness substantially suppresses the incidence of corruption while an
abundance of resources and state-owned enterprises are shown to be the breeding ground for
corruption.

33
APPENDIX: Data Description Variable Description Source
Cases Provincial registered cases on corruption in procurator’s office per 100,000 population
China Procuratorial Yearbooks (1998-2008)
AETC Average travel and entertainment costs relative to sales of industrial firms investigated in a city
World Bank (2007)
Officials Provincial number of officials investigated in registered cases on corruption per 100,000 population
China Procuratorial Yearbooks (2004-2008)
Anti-corruption Regional expenditure on police, procuratorate, court and judiciary per capita Confidence in courts of firms investigated in a city
China Finance Yearbooks ( 1998-2008) World Bank (2007)
Income Logarithm of per capita real gross provincial product China Statistical Yearbooks (1998-2008) Industrial output per worker of the city China City Statistical Yearbook (2004) Education Regional fraction of the population over 6 with college
completed China Population Statistics Yearbooks (1998-2008), China City Statistical Yearbook (2004)
Relative wage Provincial ratio of average government employee’ wage to the average wage
China Statistical Yearbooks (1998-2008)
Openness Regional ratio of import to gross regional product Provincial Statistical Yearbooks (1998-2008), China City Statistical Yearbook (2004)
Newspaper Provincial newspapers circulation in a year Collection of Statistics for Journalism and Publication in China (1998)
Internet Regional internet penetration rate China Internet Network Information Centre, China City Statistical Yearbook (2005)
Dissimilarity Provincial dissimilarity index Calculated basing the Fifth National Census of China (2000)
Gini Provincial Gini coefficients Meng, X., Gregory R. and Wang Y., 2007. Poverty, inequality, and growth in urban China, 1986–2000. Journal of Comparative Economics 33, 710-729.
State-owned the share of employment of the state-owned enterprise sector
China Statistical Yearbooks (1998-2008)
Resource Employment share of the mining and quarrying sector China Statistical Yearbooks (1998-2008) Han Provincial population share of Han nationality the Fifth National Census of China (2000) Church university Regional number of church universities founded by
Britain and America till 1922 China Continuation Committee (2007), Christian Occupation of China. Beijing, China: Chinese Social Science Press.
British Dummy which equals 1 when a region was in influence sphere of Britain during the late Qing Dynasty, 0 otherwise
Yang, Z. and Ye, F., 1993. Studies on Semi-colonization of Qing Dynasty. Beijing, China: Higher Education Press.
Government size The ratio of regional consolidated revenue to Gross Regional Product
China Finance Yearbooks ( 1998-2008) China Statistical Yearbooks (1998-2008)
The employment share of the public sector China City Statistical Yearbook (2004) Fiscal decentralization
The ratio of per capita provincial consolidated spending to per capita central consolidated spending
China Statistical Yearbooks (1998-2008)
(government expenditure – government revenue ) / Government expenditure
China Finance Yearbooks ( 1998-2008), China City Statistical Yearbook (2004)
Marketilization The marketization index Fan, G., Wang, X. and Zhu, H., 2001, 2003, 2006. Reports on the Relative Progress of Marketization in Different Regions in China, China: Economic Science Publishing House.
Fraction of private firms sampled in a city World Bank (2007) Resource The fraction of employment in the mining and
quarrying sector China Statistical Yearbooks (1998-2008)
North Dummy which equals 1 when a province is in North China, 0 otherwise
Provincial Statistical Yearbooks 1998
Coast Dummy which equals 1 when a region is coastal, 0 otherwise
Provincial Statistical Yearbooks 1998
Latitude & Longitude
Latitudes and longitudes of regional capitals or cities Shanghai Astronomical Observatory Online (http://www.astron.sh.cn/)
Big city Dummy which equals 1 when a city is municipalities, provincial capitals , cities specifically designated in the state plan and special economic zones, 0 otherwise
China City Statistical Yearbook (2004)

34
REFERENCES
Adams, C. 1993. For Good and Evil. The Impact of Taxes on the Course of Civilization. Madison Books,
London.
Ades, A., Di Tella, R., 1999. Rents, Competition and Corruption. American Economic Review 89, 982-993.
Ades, A., Di Tella, R., 1996. The Causes and Consequences of Corruption. IDS Bulletin 27 (2), 6–10.
Adsera, A., Boix, C. and Payne, M., 2003. Are You Being Served? Political Accountability and Quality of
Government. Journal of Law, Economics and Organization 19, 445-490.
Banfield, E.C., 1958. The Moral Basis of a Backward Society. New York: Free Press.
Bardhan, P. and Mookherjee, D., 2006. Decentralization, Corruption and Government Accountability. In: Rose-
Ackerman, S. (Eds.), International Handbook on the Economics of Corruption. Cheltenham: Edward Elgar.
pp. 161-188.
Basu, S. and Li, D., 2000. A Theory of the Reform of Bureaucratic Institutions. Econometric Society World
Congress 2000 Contributed Papers no. 1271.
Becker, G.S., 1968. Crime and Punishment: An Economic Approach. Journal of Political Economy 76, 169-217.
Brennan, G. and Buchanan, J.M., 1980. The Power to Tax: Analytical Foundations of a fiscal constitution.
Cambridge: Cambridge University Press.
Brunetti, A. and Weder, B., 2003. A Free Press is Bad News for Corruption. Journal of Public Economics 87,
1801-1824.
Cai, H., Fang, H. and Xu, C.L., 2009. Eat, Drink, Firms and Government: An Investigation of Corruption from
Entertainment and Travel Costs of Chinese Firms. Journal of Law and Economics, forthcoming.
Cai, H., and Treisman, D., 2006. Did Government Decentralization Cause China’s Economic Miracle? World
Politics 58, 505-535.
Chowdhury, S., 2004. The Effect of Democracy and Press Freedom on Corruption: An Empirical Test.
Economics Letters 85, 93-101.
Eberhard, W., 1965. Chinese Regional Stereotypes. Asian Survey 5, 596-608.
Fan, G., Wang, X. and Zhu, H., 2001, 2006. Reports on the Relative Progress of Marketization in Different
Regions in China. Beijing: Economic Science Publishing House.
Fisman, R. and Gatti, R., 2002a. Decentralization and Corruption: Evidence across Countries. Journal of Public
Economics 83, 325-345.
Fisman, R. and Gatti, R., 2002b. Decentralization and Corruption: Evidence from U.S. Federal Transfer
Programs. Public Choice 113, 25–35.
Freedom House, 2009. Freedom on the Net: A Global Assessment of Internet and Digital Media.
Freille, S., Haque, M.E. and Kneller, R., 2007. A Contribution to the Empirics of Press Freedom and
Corruption. European Journal of Political Economy 23, 838-862.
Gerring, J. and Thacker, S.C., 2005. Do Neoliberal Policies Deter Political Corruption? International
Organization 59, 233-254.
Glaeser, E.L. and Saks, R.E., 2006. Corruption in America. Journal of Public Economics 90, 1053-1072.
Goel, R.K. and Nelson, M.A., 1998. Corruption and Government Size: A Disaggregated Analysis. Public
Choice 97, 107-120.

35
Gong, T., 2006. Corruption and Local Governance: the Double Identity of Chinese Local Governments in
Market Reform. The Pacific Review 19, 85-102.
Gundlach, E. and Paldam, M., 2009. The Transition of Corruption: From Poverty to Honesty. Economics Letters
103, 146-148.
Hall, R.E., and Jones, C.I., 1999. Why do Some Countries Produce so Much More Output per Worker than
Others? Quarterly Journal of Economics 114, 83-116.
Hirschman, A. O. 1970. Exit, Voice, and Loyalty. Cambridge (Mass.): Harvard University Press.
Hooper, J., 1995. The New Spaniards. London: Penguin Books.
Hofstede, G. and Hofstede, G.J., 2005. Cultures and Organizations: Software of the Mind. New York: McGraw
Hill.
Jain, A.K., 2001. Corruption: A Review. Journal of Economic Surveys 15, 71-121.
Lambsdorff, J.G., 2005. Consequences and Causes of Corruption – What do We Know from a Cross-Section of
Countries? Discussion Papers no. V-34-05. Department of Economics, University of Passau.
LaPalombara, J., 1994. Structural and Institutional Aspects of Corruption. Social Research 61, 325-50.
La Porta, R., Lopez-De-Silanes, F., Shleifer, A. and Vishny, R.W., 1999. The Quality of Government. The
Journal of Law, Economics and Organization 15, 222-279.
Leite, C. and Weidmann, J., 1999. Does Mother Nature Corrupt? Natural Resources, Corruption and Economic
Growth. IMF Working Paper no. 99/85.
Lenin, V.I., 1916. The Socialist Revolution and the Right of Nations to Self-Determination. Vorbote 2.
Levin, M. and Satarov, G., 2000. Corruption and institutions in Russia. European Journal of Political Economy
16, 113-132.
Li, S.-M., 2001. Regional Development in China: States, Globalization and Inequality. China Review
International 8, 572-578.
Liang, G., 1994. The Practical Encyclopaedia of Anti-Corruption in China and Foreign Countries. Beijing:
Xinhua Press.
Liu, A. P. L., 1996. The Politics of Corruption in the People’s Republic of China. American Political Science
Review 77, 602-623.
Manion, M., 1996. Corruption by Design: Bribery in Chinese Enterprise Licensing. Journal of Law, Economics,
& Organization 12, 167-195.
Meng, X., Gregory R. and Wang Y., 2007. Poverty, inequality, and growth in urban China, 1986–2000. Journal
of Comparative Economics 33, 710-729.
Montinola, G. Qian, Y. and Weingast, B.R., 1995. Federalism, Chinese Style: The Political Basis for Economic
Success in China. World Politics 48, 50-81.
Oates, W. E. 1999. An Essay on Fiscal Federalism. Journal of Economic Literature 37, 1120-1149.
Paldam, M. and Svendsen, G.T., 2000. Missing Social Capital and the Transition in Eastern Europe. Working
Papers 00-5, Aarhus School of Business, Department of Economics.
Pellegrini, L. and Gerlagh, R., 2008. Causes of Corruption: A Survey of Cross-Country Analyses and Extended
Results. Economics of Governance 9, 245–263.
Rappaport, J. and Sachs, J., 2003. The United States as a Coastal Nation. Journal of Economic Growth 8, 5 –46.
Rose-Ackerman, S., 1978. Corruption: A Study in Political Economy. New York: Academic Press.

36
Rose-Ackerman, S., 1999. Corruption and Government: Causes, Consequences, and Reform. Cambridge:
Cambridge University Press.
Sachs, J.D. and Warner, A.M., 2001. The Curse of Natural Resources. European Economic Review 45, 827-838.
Shleifer, A., Vishny, R.W., 1993. Corruption. Quarterly Journal of Economics 108, 599–617.
Svensson, J., 2003. Who Must Pay Bribes and How Much? Evidence from a Cross Section of Firms. Quarterly
Journal of Economics 118, 207-230.
Treisman, D., 2000. The Causes of Corruption: A Cross-National Study. Journal of Public Economics 76, 399-
457.
Treisman, D., 2007. What Have We Learned About the Causes of Corruption From Ten Years of Cross-
National Empirical Research? Annual Review of Political Science 10, 211–244.
van Rijckeghem, C. and Weder, B., 2001. Bureaucratic Corruption and the Rate of Temptation: Do Wages in the
Civil Service affect Corruption, and by How Much? Journal of Development Economics 65, 307-331.
Wedeman, A., 2004. The Intensification of Corruption in China. The China Quarterly 180, 895-921.
Weingast, B., 1995. The Economic Role of Political Institutions: Market-Preserving Federalism and Economic
Development. Journal of Law, Economics, and Organization 11, 1-31.
White, G., 1996. Corruption and the Transition from Socialism in China. Journal of Law and society 23, 149-
169
World Bank, 2000. Anticorruption in Transition: A Contribution to the Policy Debate. World Bank Publication.
Washington D.C.: World Bank.
World Bank, 2006. Anticorruption in Transition 3: Who Is Succeeding . . . and Why? World Bank Publication.
Washington D.C.: World Bank.
World Bank, 2007. Governance, Investment Climate and Harmonious Society. Washington D.C.: World Bank.
Xu, K.-N. and Wang, J., 2006. An Empirical Study of a Linkage between Natural Resource Abundance and
Economic Development. Economic Research Journal (Chinese) 2006(1), 78-89.
Yang, Z. and Ye, F., 1993. Studies on Semi-colonization of Qing Dynasty. Beijing: Higher Education Press.
Yao, S., 2002. Privilege and Corruption: The Problems of China's Socialist Market Economy. American Journal
of Economics and Sociology 61, 279-299.
You, J.-S. and Khagram, S., 2005. Inequality and Corruption. American Sociological Review 70, 136-157.
Zhang, T. and Zou, H.-F., 1998. Fiscal Decentralization, Public Spending, and Economic Growth in China.
Journal of Public Economics 67, 221-240.

NOTE DI LAVORO DELLA FONDAZIONE ENI ENRICO MATTEI
Fondazione Eni Enrico Mattei Working Paper Series
Our Note di Lavoro are available on the Internet at the following addresses: http://www.feem.it/getpage.aspx?id=73&sez=Publications&padre=20&tab=1
http://papers.ssrn.com/sol3/JELJOUR_Results.cfm?form_name=journalbrowse&journal_id=266659 http://ideas.repec.org/s/fem/femwpa.html
http://www.econis.eu/LNG=EN/FAM?PPN=505954494 http://ageconsearch.umn.edu/handle/35978
http://www.bepress.com/feem/
NOTE DI LAVORO PUBLISHED IN 2010 GC 1.2010 Cristina Cattaneo: Migrants’ International Transfers and Educational Expenditure: Empirical Evidence
from Albania SD 2.2010 Fabio Antoniou, Panos Hatzipanayotou and Phoebe Koundouri: Tradable Permits vs Ecological Dumping SD 3.2010 Fabio Antoniou, Panos Hatzipanayotou and Phoebe Koundouri: Second Best Environmental Policies
under Uncertainty SD 4.2010 Carlo Carraro, Enrica De Cian and Lea Nicita: Modeling Biased Technical Change. Implications for
Climate Policy IM 5.2010 Luca Di Corato: Profit Sharing under the threat of Nationalization SD 6.2010 Masako Ikefuji, Jun-ichi Itaya and Makoto Okamura: Optimal Emission Tax with Endogenous Location
Choice of Duopolistic Firms SD 7.2010 Michela Catenacci and Carlo Giupponi: Potentials and Limits of Bayesian Networks to Deal with
Uncertainty in the Assessment of Climate Change Adaptation Policies GC 8.2010 Paul Sarfo-Mensah and William Oduro: Changes in Beliefs and Perceptions about the Natural
Environment in the Forest-Savanna Transitional Zone of Ghana: The Influence of Religion IM 9.2010 Andrea Boitani, Marcella Nicolini and Carlo Scarpa: Do Competition and Ownership Matter? Evidence
from Local Public Transport in Europe SD 10.2010 Helen Ding and Paulo A.L.D. Nunes and Sonja Teelucksingh: European Forests and Carbon Sequestration
Services : An Economic Assessment of Climate Change Impacts GC 11.2010 Enrico Bertacchini, Walter Santagata and Giovanni Signorello: Loving Cultural Heritage Private Individual
Giving and Prosocial Behavior SD 12.2010 Antoine Dechezleprêtre, Matthieu Glachant and Yann Ménière: What Drives the International Transfer of
Climate Change Mitigation Technologies? Empirical Evidence from Patent Data SD 13.2010 Andrea Bastianin, Alice Favero and Emanuele Massetti: Investments and Financial Flows Induced by
Climate Mitigation Policies SD 14.2010 Reyer Gerlagh: Too Much Oil IM 15.2010 Chiara Fumagalli and Massimo Motta: A Simple Theory of Predation GC 16.2010 Rinaldo Brau, Adriana Di Liberto and Francesco Pigliaru: Tourism and Development: A Recent
Phenomenon Built on Old (Institutional) Roots? SD 17.2010 Lucia Vergano, Georg Umgiesser and Paulo A.L.D. Nunes: An Economic Assessment of the Impacts of the
MOSE Barriers on Venice Port Activities SD 18.2010 ZhongXiang Zhang: Climate Change Meets Trade in Promoting Green Growth: Potential Conflicts and
Synergies SD 19.2010 Elisa Lanzi and Ian Sue Wing: Capital Malleability and the Macroeconomic Costs of Climate Policy IM 20.2010 Alberto Petrucci: Second-Best Optimal Taxation of Oil and Capital in a Small Open Economy SD 21.2010 Enrica De Cian and Alice Favero: Fairness, Credibility and Effectiveness in the Copenhagen Accord: An
Economic Assessment SD 22.2010 Francesco Bosello: Adaptation, Mitigation and “Green” R&D to Combat Global Climate Change. Insights
From an Empirical Integrated Assessment Exercise IM 23.2010 Jean Tirole and Roland Bénabou: Individual and Corporate Social Responsibility IM 24.2010 Cesare Dosi and Michele Moretto: Licences, "Use or Lose" Provisions and the Time of Investment GC 25.2010 Andrés Rodríguez-Pose and Vassilis Tselios (lxxxvi): Returns to Migration, Education, and Externalities in
the European Union GC 26.2010 Klaus Desmet and Esteban Rossi-Hansberg (lxxxvi): Spatial Development SD 27.2010 Massimiliano Mazzanti, Anna Montini and Francesco Nicolli: Waste Generation and Landfill Diversion
Dynamics: Decentralised Management and Spatial Effects SD 28.2010 Lucia Ceccato, Valentina Giannini and Carlo Gipponi: A Participatory Approach to Assess the
Effectiveness of Responses to Cope with Flood Risk SD 29.2010 Valentina Bosetti and David G. Victor: Politics and Economics of Second-Best Regulation of Greenhouse
Gases: The Importance of Regulatory Credibility IM 30.2010 Francesca Cornelli, Zbigniew Kominek and Alexander Ljungqvist: Monitoring Managers: Does it Matter? GC 31.2010 Francesco D’Amuri and Juri Marcucci: “Google it!” Forecasting the US Unemployment Rate with a Google
Job Search index SD 32.2010 Francesco Bosello, Carlo Carraro and Enrica De Cian: Climate Policy and the Optimal Balance between
Mitigation, Adaptation and Unavoided Damage
SD 33.2010 Enrica De Cian and Massimo Tavoni: The Role of International Carbon Offsets in a Second-best Climate Policy: A Numerical Evaluation
SD 34.2010 ZhongXiang Zhang: The U.S. Proposed Carbon Tariffs, WTO Scrutiny and China’s Responses IM 35.2010 Vincenzo Denicolò and Piercarlo Zanchettin: Leadership Cycles SD 36.2010 Stéphanie Monjon and Philippe Quirion: How to Design a Border Adjustment for the European Union
Emissions Trading System? SD 37.2010 Meriem Hamdi-Cherif, Céline Guivarch and Philippe Quirion: Sectoral Targets for Developing Countries:
Combining "Common but Differentiated Responsibilities" with "Meaningful participation" IM 38.2010 G. Andrew Karolyi and Rose C. Liao: What is Different about Government-Controlled Acquirers in Cross-
Border Acquisitions? GC 39.2010 Kjetil Bjorvatn and Alireza Naghavi: Rent Seekers in Rentier States: When Greed Brings Peace GC 40.2010 Andrea Mantovani and Alireza Naghavi: Parallel Imports and Innovation in an Emerging Economy SD 41.2010 Luke Brander, Andrea Ghermandi, Onno Kuik, Anil Markandya, Paulo A.L.D. Nunes, Marije Schaafsma
and Alfred Wagtendonk: Scaling up Ecosystem Services Values: Methodology, Applicability and a Case Study
SD 42.2010 Valentina Bosetti, Carlo Carraro, Romain Duval and Massimo Tavoni: What Should We Expect from Innovation? A Model-Based Assessment of the Environmental and Mitigation Cost Implications of Climate-Related R&D
SD 43.2010 Frank Vöhringer, Alain Haurie, Dabo Guan,Maryse Labriet, Richard Loulou, Valentina Bosetti, Pryadarshi R. Shukla and Philippe Thalmann: Reinforcing the EU Dialogue with Developing Countries on Climate Change Mitigation
GC 44.2010 Angelo Antoci, Pier Luigi Sacco and Mauro Sodini: Public Security vs. Private Self-Protection: Optimal Taxation and the Social Dynamics of Fear
IM 45.2010 Luca Enriques: European Takeover Law: The Case for a Neutral Approach SD 46.2010 Maureen L. Cropper, Yi Jiang, Anna Alberini and Patrick Baur: Getting Cars Off the Road: The Cost-
Effectiveness of an Episodic Pollution Control Program IM 47.2010 Thomas Hellman and Enrico Perotti: The Circulation of Ideas in Firms and Markets IM 48.2010 James Dow and Enrico Perotti: Resistance to Change SD 49.2010 Jaromir Kovarik, Friederike Mengel and José Gabriel Romero: (Anti-) Coordination in Networks SD 50.2010 Helen Ding, Silvia Silvestri, Aline Chiabai and Paulo A.L.D. Nunes: A Hybrid Approach to the Valuation of
Climate Change Effects on Ecosystem Services: Evidence from the European Forests GC 51.2010 Pauline Grosjean (lxxxvii): A History of Violence: Testing the ‘Culture of Honor’ in the US South GC 52.2010 Paolo Buonanno and Matteo M. Galizzi (lxxxvii): Advocatus, et non latro? Testing the Supplier-Induced-
Demand Hypothesis for Italian Courts of Justice GC 53.2010 Gilat Levy and Ronny Razin (lxxxvii): Religious Organizations GC 54.2010 Matteo Cervellati and Paolo Vanin (lxxxvii): ”Thou shalt not covet ...”: Prohibitions, Temptation and
Moral Values GC 55.2010 Sebastian Galiani, Martín A. Rossi and Ernesto Schargrodsky (lxxxvii): Conscription and Crime: Evidence
from the Argentine Draft Lottery GC 56.2010 Alberto Alesina, Yann Algan, Pierre Cahuc and Paola Giuliano (lxxxvii): Family Values and the Regulation
of Labor GC 57.2010 Raquel Fernández (lxxxvii): Women’s Rights and Development GC 58.2010 Tommaso Nannicini, Andrea Stella, Guido Tabellini, Ugo Troiano (lxxxvii): Social Capital and Political
Accountability GC 59.2010 Eleonora Patacchini and Yves Zenou (lxxxvii): Juvenile Delinquency and Conformism GC 60.2010 Gani Aldashev, Imane Chaara, Jean-Philippe Platteau and Zaki Wahhaj (lxxxvii): Using the Law to Change
the Custom GC 61.2010 Jeffrey Butler, Paola Giuliano and Luigi Guiso (lxxxvii): The Right Amount of Trust SD 62.2010 Valentina Bosetti, Carlo Carraio and Massimo Tavoni: Alternative Paths toward a Low Carbon World SD 63.2010 Kelly C. de Bruin, Rob B. Dellink and Richard S.J. Tol: International Cooperation on Climate Change
Adaptation from an Economic Perspective IM 64.2010 Andrea Bigano, Ramon Arigoni Ortiz, Anil Markandya, Emanuela Menichetti and Roberta Pierfederici:
The Linkages between Energy Efficiency and Security of Energy Supply in Europe SD 65.2010 Anil Markandya and Wan-Jung Chou: Eastern Europe and the former Soviet Union since the fall of the
Berlin Wall: Review of the Changes in the Environment and Natural Resources SD 66.2010 Anna Alberini and Milan Ščasný: Context and the VSL: Evidence from a Stated Preference Study in Italy
and the Czech Republic SD 67.2010 Francesco Bosello, Ramiro Parrado and Renato Rosa: The Economic and Environmental Effects of an EU
Ban on Illegal Logging Imports. Insights from a CGE Assessment IM 68.2010 Alessandro Fedele, Paolo M. Panteghini and Sergio Vergalli: Optimal Investment and Financial Strategies
under Tax Rate Uncertainty IM 69.2010 Carlo Cambini, Laura Rondi: Regulatory Independence and Political Interference: Evidence from EU
Mixed-Ownership Utilities’ Investment and Debt SD 70.2010 Xavier Pautrel: Environmental Policy, Education and Growth with Finite Lifetime: the Role of Abatement
Technology SD 71.2010 Antoine Leblois and Philippe Quirion: Agricultural Insurances Based on Meteorological Indices:
Realizations, Methods and Research Agenda IM 72.2010 Bin Dong and Benno Torgler: The Causes of Corruption: Evidence from China

(lxxxvi) This paper was presented at the Conference on "Urban and Regional Economics" organised by the Centre for Economic Policy Research (CEPR) and FEEM, held in Milan on 12-13 October 2009.
(lxxxvii) This paper was presented at the Conference on “Economics of Culture, Institutions and Crime” organised by SUS.DIV, FEEM, University of Padua and CEPR, held in Milan on January 20-22 2010.