not your father’s transportation system. background 1.driving 2.cars 3.neighborhoods 4.human...
TRANSCRIPT

not your father’s transportation system

background1. driving2. cars3. neighborhoods4. human infrastructure5. money

tactics1. networks2. parking 3. system integration

1. driving
vmt, per capita vmt, truck tsunami

U.S. population & vmt
pop vmt
1955 2005
millions trillions
166
0.6100
200
0.5
1.0
296
3.0
1.5
2.0
2.5
300
400
500500%178%
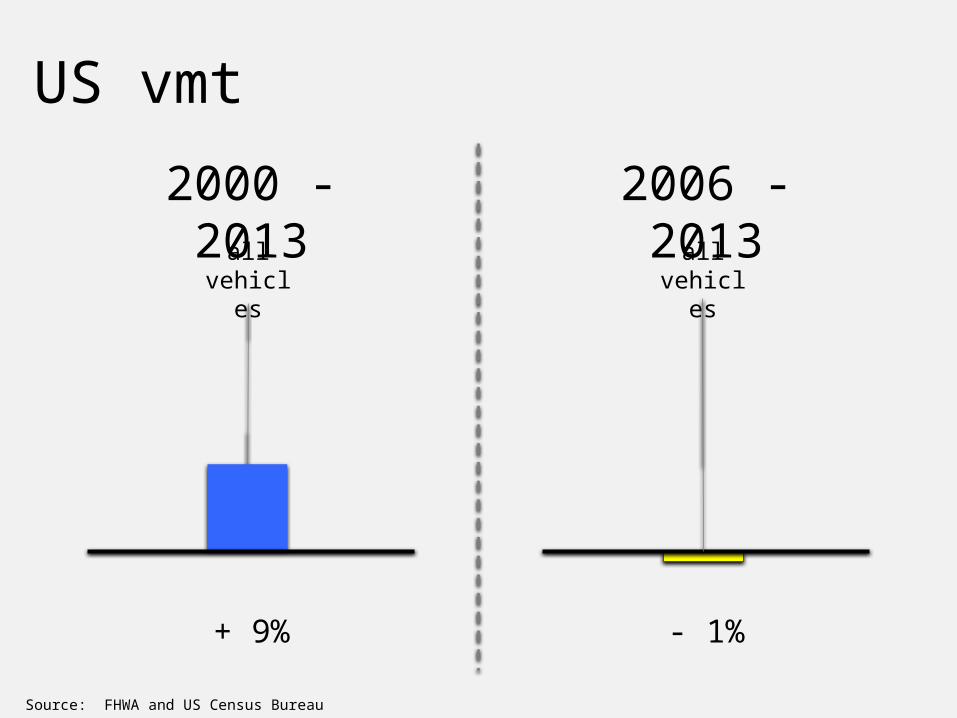
+ 9%
2000 - 2013all
vehicles
2006 - 2013
- 1%
allvehicles
Source: FHWA and US Census Bureau
US vmt

- 3%
2000 - 2013 2006 - 2013all
vehicles
- 6%
allvehicles
Source: FHWA and US Census Bureau
US vmt per capita
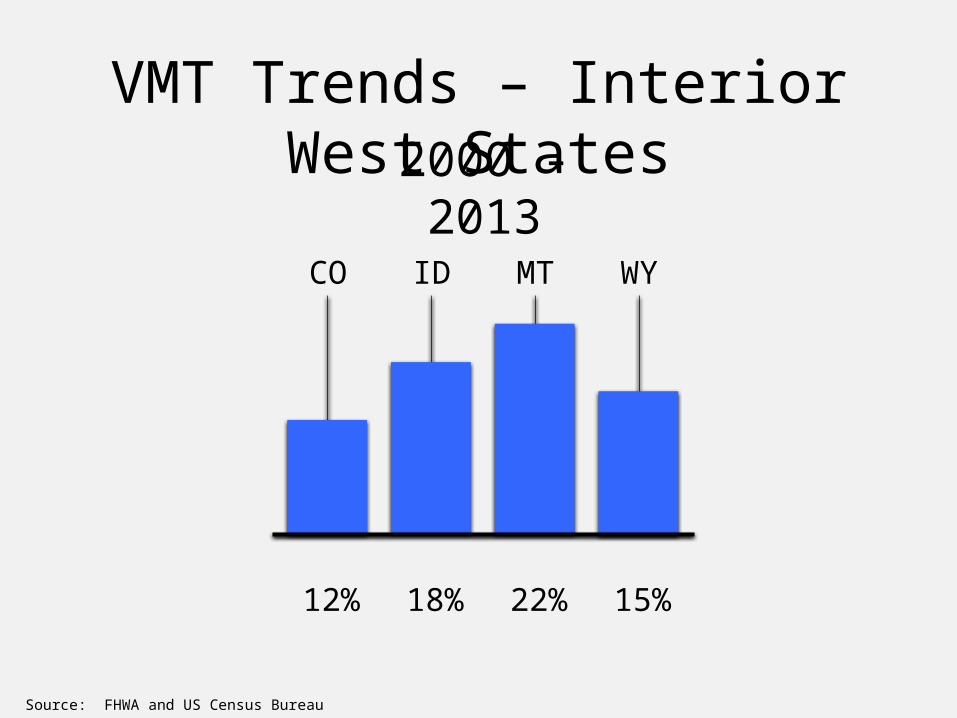
12% 18%
2000 - 2013
CO ID
22% 15%
MT WY
Source: FHWA and US Census Bureau
VMT Trends – Interior West States

- 8% - 5%
2000 - 2013
CO ID
8% - 3%
MT WY
Source: FHWA and US Census Bureau
Per Capita VMT – Interior West States

+ 9%
2000 - 2013all
vehicles
+ 6% + 34%
personalvehicles trucks
2006 - 2013
- 1%Source: FHWA
US vmt
allvehicles
- 3% + 22%
personalvehicles trucks

- 3%
2000 - 2013 2006 - 2013
- 6%
Source: FHWA and US Census Bureau
US vmt per capita
allvehicles
- 9% + 15%
personalvehicles trucks
allvehicles
- 5% + 19%
personalvehicles trucks

the truck tsunami

truck traffic in the west:economic growth + oil shipments


US – barrels/day
2009
21,000
2014
1,100,000
Source: FRA and AAR
oil by rail


not just millennials17
Source: United States Energy Information Agency

what drives vmt?demographics & economics traffic enablers
labor force participation rate
household income
driver license rate
vehicle ownership
population
miles of roadways
energy subsidy
road subsidy
sprawl
auto dependency

gas price($$/gallon)
(2014 dollars)
1984
Source: Census Bureau and BLS
US gas prices & personal income
2000 2014 1984 2000 2014
2.55
2.09
2.99
22.1
30.328.4
per capita money income($ thousands)
- 18 %
+ 43 %
+ 37 %
- 6 %
+ 17 % + 28 %

gas prices

3.2 %
October2013 - 2014
source: FHWA monthly Traffic Trends
traffic growth – month to monthwestern states
2.2 %
November2013 - 2014
3.3 %
December2013 - 2014
2.2 %
January2014 - 2015
6.6 %
February2014 - 2015

beware -short term vs. long term trends
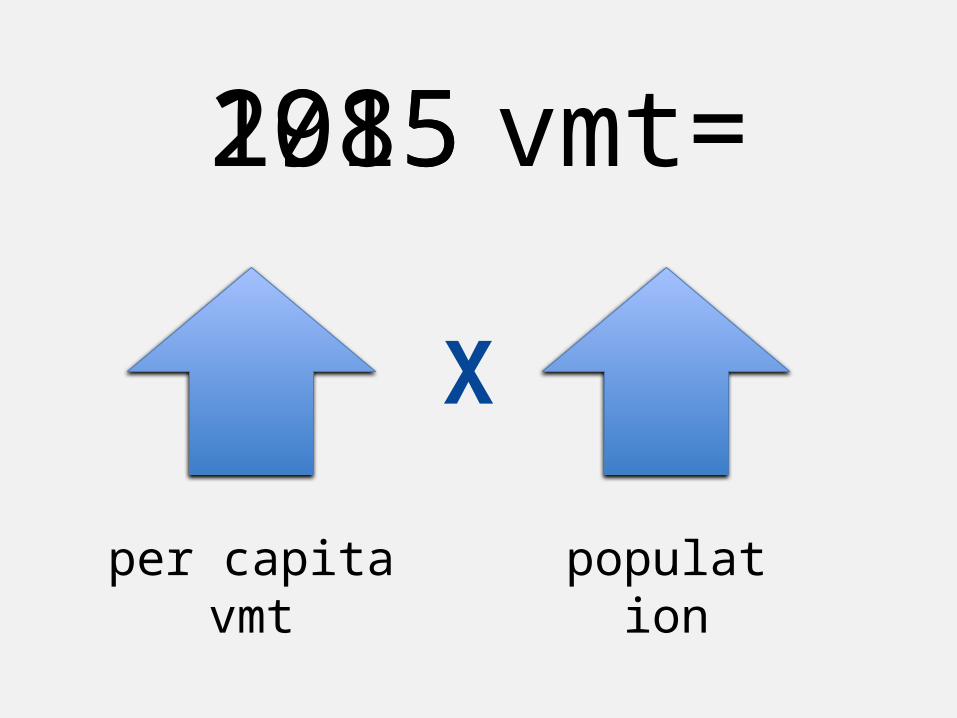
vmt=
populationper capita vmt
X
19852015

US 2000 – 2013
+ 9%
vmt
+ 13%
transit ridership
source: FHWA and APTA
travel demand

2. cars
autonomous vehicles, sharing economy, on-demand services

autonomous vehicles
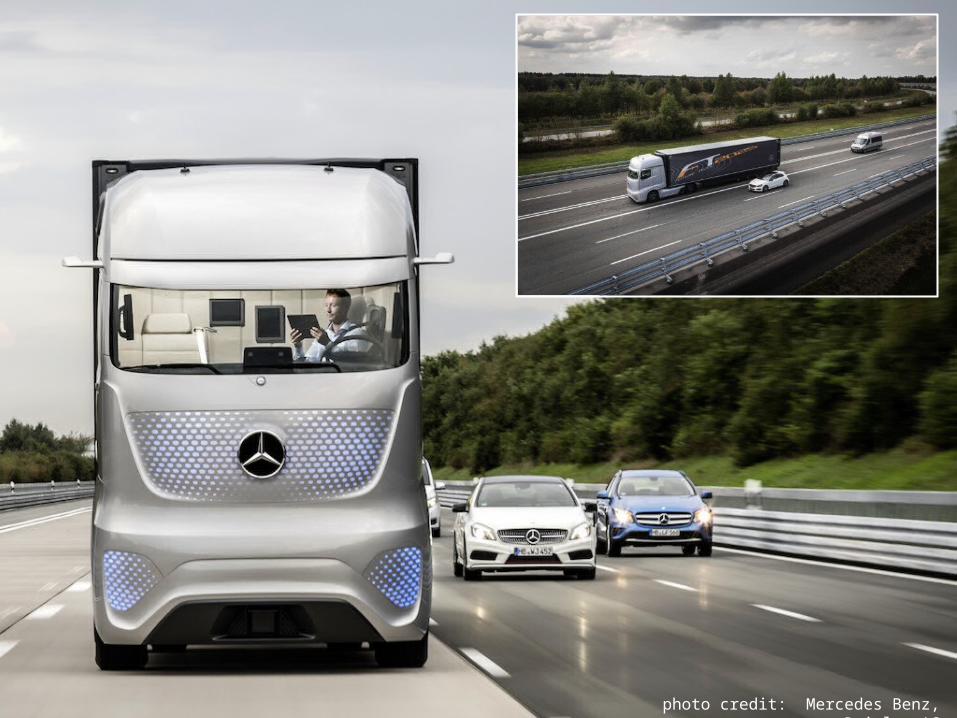
photo credit: Mercedes Benz, Daimler AG

impact of autonomous vehicles on freeway capacity: + 40%

autonomous vehicles roll-out
2015 2020 2025 2030
partially autonomous
vehicles enter market
fully autonomous
vehicles enter market
autonomous vehicles
dominate market

the sharing economy
photo credit: Charlier Associates, Inc.

Google Map – screen capture 2/25/15
bikeshare cities

car share companiesBuffalo CarShareCar2GoeGo CarShareFlexcarGetaroundJustShareItRelayRidesZipcar +WeCar by Enterprise Rent-A-CarUhaul Car Share owned by U-HaulAvis On Location by Avis
photo credit: Mariordo (Mario Roberto Durán Ortiz) - This file was derived from: 20120922_Volt-Chicago.JPG

car share arithmetic
(US Jan 1, 2013)
data source: The University of California, Berkeley's Transportation Sustainability Research Center
vehicles
15,603
members
1,033,564
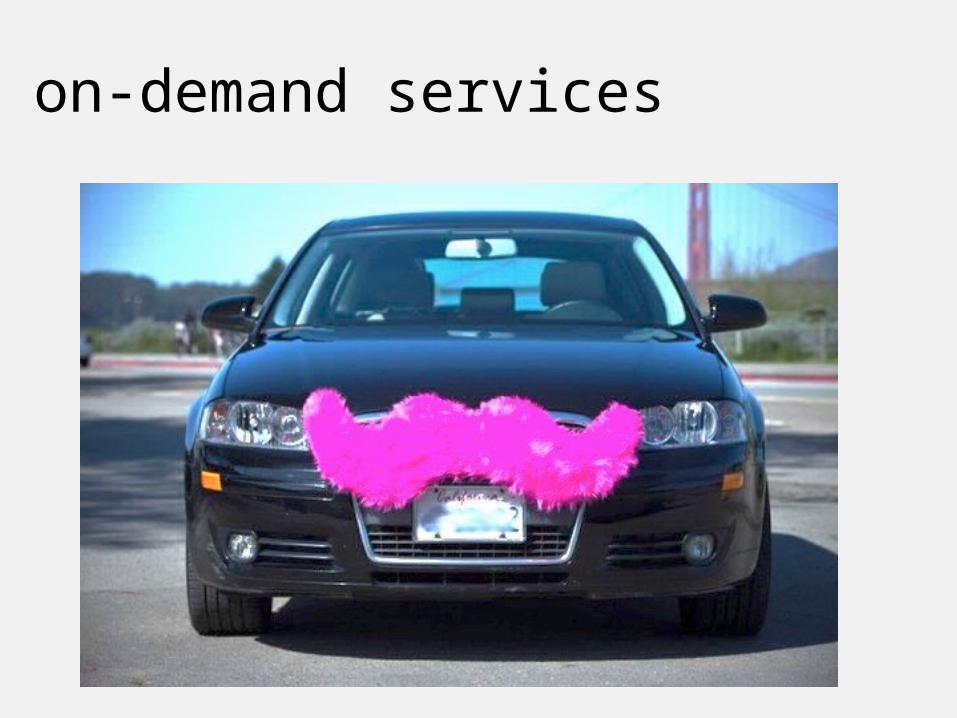
on-demand services

on-demand services
Medicast
Handy
Uber Lyft
InstacartHomejoy
Washio
BloomThat
FancyHands
Shyp
SpoonRocket
Sidecar
TopCoder Elanceo-Desk

the vmt trend is cultural.we will drive less andwill own fewer vehicles

3. neighborhoods
complete + connected

1800 - 1900rural cities
1900 - 2000cities suburbs
2000 -suburbs neighborhoods
development patterns in US history

employment opportunity
+
quality of life

jobs & quality of life - 1900
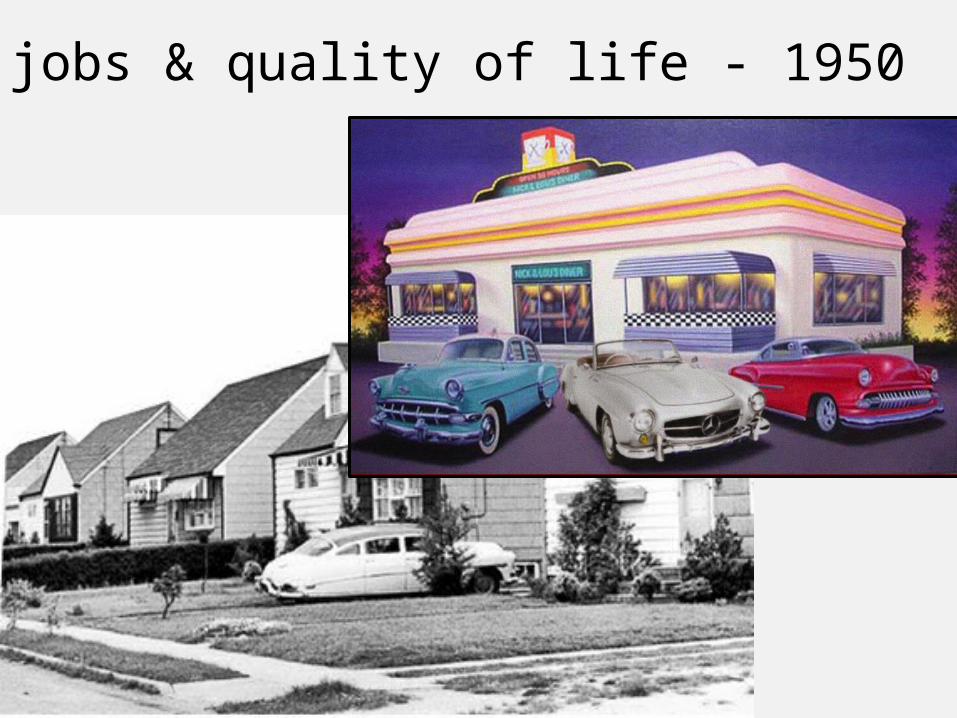
jobs & quality of life - 1950
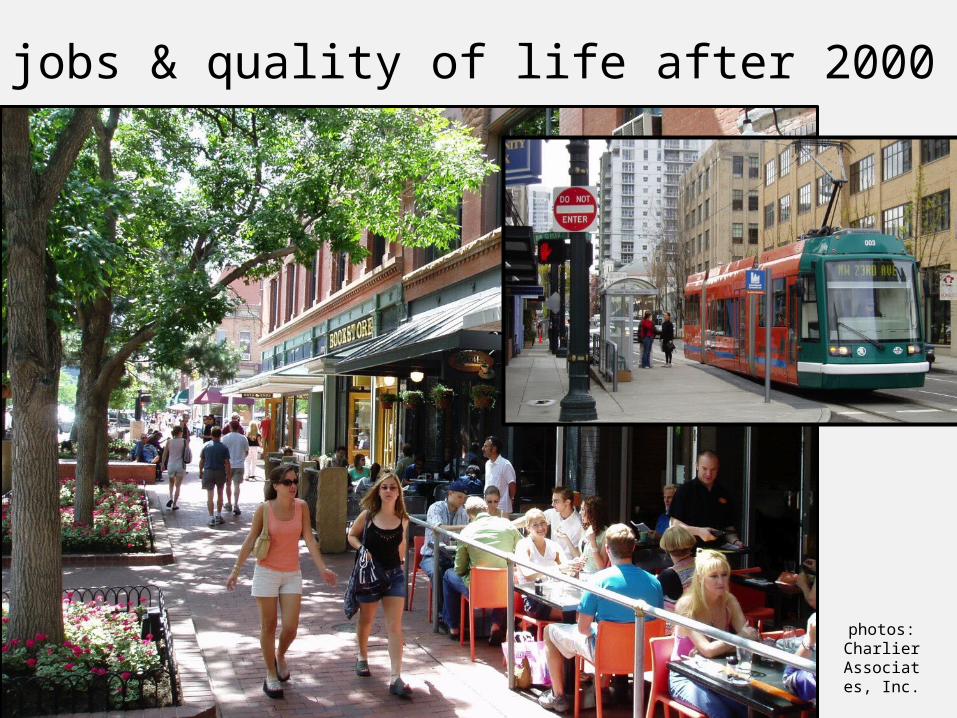
jobs & quality of life after 2000
photos: Charlier
Associates, Inc.

21st century emerging market =
access to good jobs+
walkable, complete, transit-served, neighborhoods

grocery-
coffee-
liquor-
home-
pharmacy-
school-
daycare-
church
------
home-------
gas station
complete incomplete
½mile
neighborhoods

4. human infrastructure
building for active transportation

“bicycles are vehicles”
photo credit: "BicyclePlymouth" by Chris 73 at en.wikipedia

human infrastructure
photos: Charlier Associates, Inc.

bicycling and scale
garage
condo garage
work
school
retail
park
1 mi1 mi 2 – 4 mi
primary corridor


photos: Charlier Associates, Inc.

5. money
the future of transportation funding

surface transportation
2002
81 73
2012Source: PEW Charitable Trust
public sector expenditures
10589
6256
$ 248 B$ 218 B
local
state
federal
- 12 %

options
fuel taxes
sales taxes
mileage fees
ppp
borrowing
economists’ choice, tech issues,privacy issues
illogical, regressive, politically popular
dwindling source, wrong incentives
requires fees or tolls and borrowing
slippery slope(see Boston MBTA)

near term options
fuel taxes
sales taxes
mileage fees
ppp
borrowing

the future
fuel taxes
sales taxes
mileage fees
ppp
borrowing

background1. driving2. cars3. neighborhoods4. human infrastructure5. money

tactics1. networks2. parking 3. system integration
1. networks
not facilities, not corridors

“network of networks”
region

multimodal grid
streets
local: 330’
collector: 1,320’
arterial: 5,280’
pedestrians330’
transit1,320’
bicyclesecondary corridor: 330’primary corridor: 1,320’
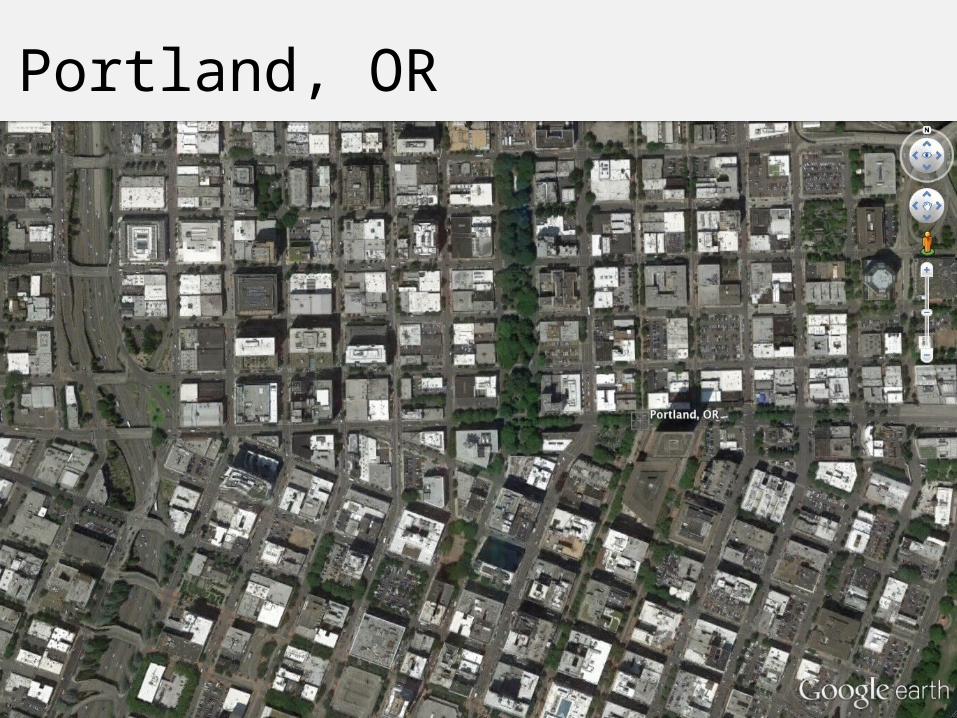
Portland, OR

networks
walkability public health safety service redundancy
market appeal resiliency efficiency capacity for
growth
pay huge dividends

doenact connectivity standardsbreak-up superblocksrepair key missing links
don’tallow more loops & lollipopspermit street closures for developmentlose your grid

2. parking
the goldilocks problem

• excess land in parking
• low business synergy
• bad for community character
• high capital costs
• discourages walking
too much
• discourages infill & redevelopment
• limits pedestrian presence
• reduces retail sales
• causes overflow conflicts
not enough
the goldilocks problem
the right
amount

integrated, strategic
enforcementmanagement
demand
supply

strategic approach

parking accumulation - traditional
6 am noon 6 pm
residential + office

residential
max
min
+ office
6 am noon 6 pm
parking accumulation - shared

strategic approach
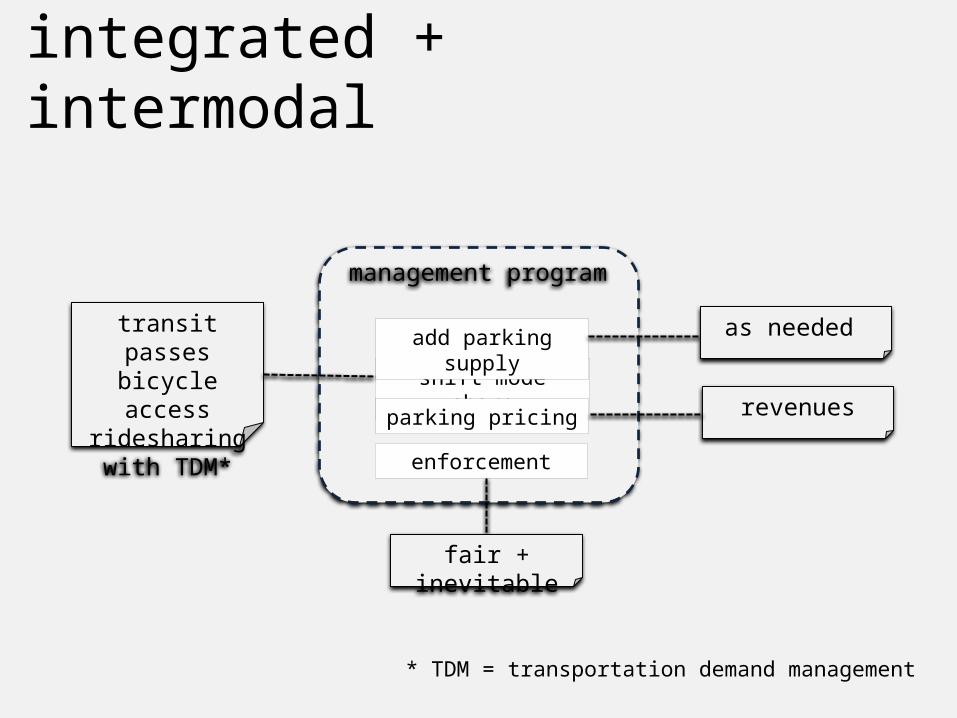
integrated + intermodal
shift mode share
parking pricing
management program
add parking supply
enforcement
transit passesbicycle access
ridesharingwith TDM*
as needed
revenues
fair + inevitable
* TDM = transportation demand management

3. system integration
breaking down silos

tran
sp
ort
ati
on
$$$h
ou
sin
g$$$
pu
blic h
ealt
h
$$$
en
vir
on
men
t
$$$
en
erg
y
$$$
single purpose spending

Redmond WA


new street connection

transit center + housing

one-way pair conversion
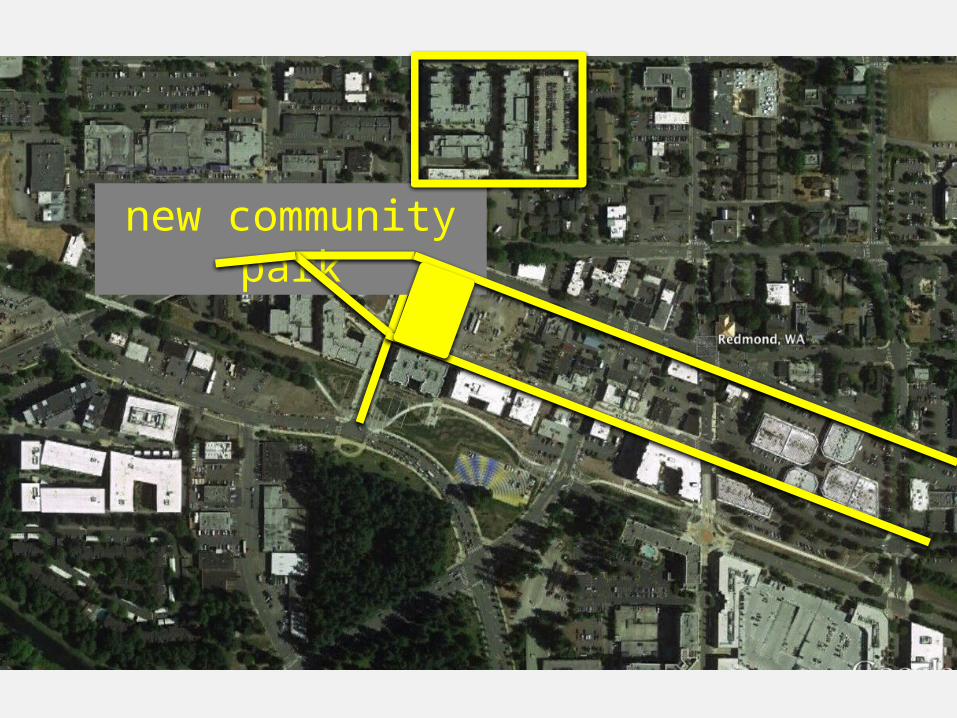
new community park

new linear park + rail corridor trail
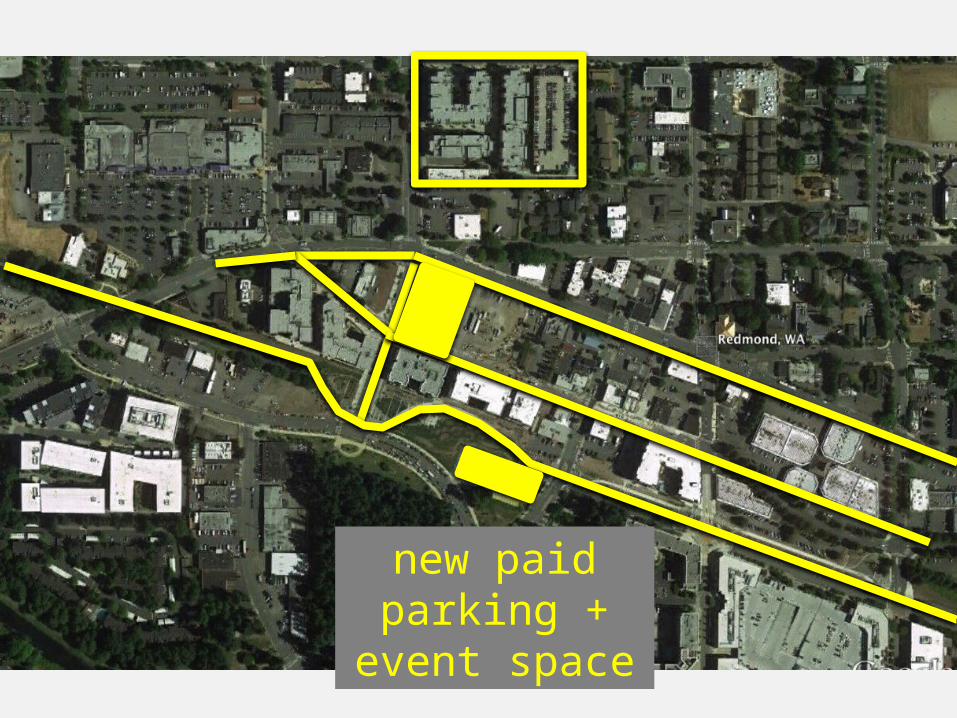
new paid parking + event space

wildlife preservation


streetstransit
parks & recreationarts
utilitieshousing
City of RedmondKing County, King County Metro
Sound TransitPuget Sound Regional Council
Washington State DOT
smart growthsustainability
complete streetstransit-oriented development
instead of conflict, synergy
tactics1. networks2. parking 3. system integration

example
transit-oriented development

networks
streets
local: 330’
collector: 1,320’
arterial: 5,280’
pedestriansresidential: 330’commercial: 660’
transit1,320’
bicyclesecondary corridor: 330’primary corridor: 1,320’

parking

streetstransit
parks & recreationarts
utilitieshousing
CityCounty
Transit AgencyMPO/Regional Council
State DOT
system integration

discussion
the future of urban transportation