not for distribution or publication embargoed … · ncc coal policy committee chair - holly...
TRANSCRIPT

NOT FOR DISTRIBUTION OR PUBLICATION – EMBARGOED PENDING NCC MEMBER APPROVAL

Advancing U.S. Coal Exports
An Assessment of Opportunities to Enhance Exports of U.S. Coal
National Coal Council Leadership NCC Chair – Deck Slone, Arch Coal
NCC Vice Chair – Danny Gray, Charah Solutions NCC CEO – Janet Gellici, National Coal Council
Coal Exports Report Co-Chairs Justin Burk, Peabody
David Lawson, Norfolk Southern Corporation
Report Chapter Leads Dan Byers, Global Energy Institute, U.S. Chamber of Commerce
Justin Burk, Peabody Hans Daniels & Andrew Blumenfeld, Doyle Trading Consultants
David Lawson, Norfolk Southern Corporation Emily Medine, Energy Ventures Analysis
Andy Roberts, Wood Mackenzie
Principal Contributing Authors Roger Bezdek, MISI
Dan Byers, Global Energy Institute, U.S. Chamber of Commerce Justin Burk, Peabody
Andrew Blumenfeld, Doyle Trading Consultants Daniel Connell, Consol Energy, Inc.
Hans Daniels, Doyle Trading Consultants George Duggan, BNSF Railway
James (Leggett) Kitchins, Norfolk Southern Corporation David Lawson, Norfolk Southern Corporation
Heath Lovell, Alliance Coal Emily Medine, Energy Ventures Analysis
Andy Roberts, Wood Mackenzie Garrett Urban, Norfolk Southern Corporation
Principal Editors Janet Gellici, National Coal Council
Emily Medine, Energy Ventures Analysis
Library of Congress Catalog 2018912055

Report Subcommittee Members Barbara Altizer, Virginia Coal & Energy Association
Duane Ankney, Montana State Senator Roger Bezdek, MISI
Andy Blumenfeld, Doyle Trading Consultants Justin Burk, Peabody
Dan Byers, Global Energy Institute, U.S. Chamber of Commerce Daniel Connell, Consol Energy, Inc.
Hans Daniels, Doyle Trading Consultants George Duggan, BNSF Railway
Ellen Ewart, Coronado Coal Mike Ferguson, Metro Ports
Chris Hamilton, West Virginia Coal Association Casey Kaptur, RungePincockMinarco Global
Holly Krutka, Peabody David Lawson, Norfolk Southern
Heath Lovell, Alliance Coal Rob McCune, Crounse Corporation
Emily Medine, Energy Ventures Analysis Betsy Monseu, American Coal Council
Clark Moseley, Navajo Transitional Energy Fred Palmer, The Heartland Institute
Richard Reavey, Cloud Peak Energy Matt Ricketts, Crounse Corporation
Andy Roberts, Wood Mackenzie Jennifer Sackson, BNSF Railway Todd Savage, Savage Services
Veronika Shime, National Mining Association Deck Slone, Arch Coal
CJ Stewart, National Tribal Energy Association Kemal Williamson, Peabody
Xiaoliang Yang, World Resources Institute
Reviewers Rick Boyd, Dominion Energy Lisa Bradley, Haley & Aldrich
Mike Durham, Soap Creek Energy
NCC Members in Bold

NCC Coal Policy Committee
Chair - Holly Krutka, Peabody
Vice Chair - F. William Brownell, Hunton Andrews Kurth LLP
Tom Alley, EPRI
Shannon Angielski
Carbon Utilization Research Council (CURC)
Duane Ankney, State Senator – Montana
Randall Atkins, Ramaco Coal, LLC
Richard Bajura, West Virginia University
Shannon Banaga, TECO Energy Inc.
Rick Boyd, Dominion Energy
Lisa Bradley, Haley & Aldrich
Brenda Brickhouse, TVA
John Cassady, NRECA
Joe Craft, Alliance Coal, LLC
Kipp Coddington, University of Wyoming
Brad Crabtree, Great Plains Institute
David Denton, Susteon, Inc.
Katherine Dombrowski, Trimeric Corporation
John Duddy, Axens North America
George Duggan, BNSF Railway
Michael Durham, Soap Creek Energy
Ron Eller, Tinuum Group LLC
David Flannery, Steptoe & Johnson, PPLC
Danny Gray, Charah Solutions
Matthew Greek, Basin Electric Power Coop.
Mike Holmes, Lignite Energy Council
Susan Jackson, Santee Cooper
Dennis James, North American Coal Corp
Kim Johnson, Gen2 LLC
Michael Karmis, Virginia Tech
David Lawson, Norfolk Southern Corporation
John Long, Connemara Ltd.
Heath Lovell, Alliance Coal, LLC
Len Marsico, McGuireWoods, LLP
Emily Medine, Energy Ventures Analysis
Charles McConnell, Rice University
Betsy Monseu, American Coal Council
Karen Obenshain, Edison Electric Institute
Jerry Oliver, YCI Methanol One, Inc.
Frederick Palmer, The Heartland Institute
Robert Purgert, Energy Industries of Ohio
Todd Savage, Savage Services
John Schultes, New Steel International, Inc.
Connie Senior, ADA-ES, Inc.
Sharon Sjostrom, Advanced Emissions Solutions
Deck Slone, Arch Coal
Michael Sorensen, Tri-State G&T
Scott Stallard, Atonix Digital
Scott Teel, Southern Company Operations
Matt Usher, American Electric Power (AEP)
Kemal Williamson, Peabody
Gregory Workman, Dominion Energy Inc.

NCC Overview - 1984|2018
In the fall of 1984, Secretary of Energy Don Hodel announced the establishment of the National Coal Council (NCC). In creating the NCC, Secretary Hodel noted that “The Reagan Administration believes the time has come to give coal – our most abundant fossil fuel – the same voice within the federal government that has existed for petroleum for nearly four decades.”
The Council was tasked to assist government and industry in determining ways to improve cooperation in areas of coal research, production, transportation, marketing and use. On that day in 1984, the Secretary named 23 individuals to serve on the Council, noting that these initial appointments indicate that “the Department intends to have a diverse spectrum of the highest caliber of individuals who are committed to improving the role coal can lay in both our Nation’s and the world’s energy future.”
Throughout its nearly 35-year history, the NCC has maintained its focus on providing guidance to the Secretary of Energy on various aspects of the coal industry. NCC has retained its original charge to represent a diversity of perspectives through its varied membership and continues to welcome members with extensive experience and expertise related to coal.
In 1985, the NCC was incorporated as a 501c6 non-profit organization in the State of Virginia. Serving as an umbrella organization, NCC, Inc. manages the business aspects of running the Council. The leadership of the NCC serves as officers of NCC Inc. and members of the Council serve as NCC Inc. shareholders. The Executive Director of the Council is NCC Inc.’s Executive Vice President and Chief Operating Officer.
Today, the NCC continues to serve as an advisory group to the Secretary of Energy, chartered under the Federal Advisory Committee Act (FACA). The NCC provides advice and recommendations to the Secretary of Energy on general policy matters relating to coal and the coal industry.
The Council activities include providing the Secretary with advice on:
Federal policy that directly or indirectly affects the production, marketing and use of coal;
Plans, priorities and strategies to address more effectively the technological, regulatory and social impact of issues relating to coal production and use;
The appropriate balance between various elements of Federal coal-related programs;
Scientific and engineering aspects of coal technologies, including emerging coal conversion, utilization or environmental control concepts; and
The progress of coal research and development.
The principal activity of the NCC is to prepare reports for the Secretary of Energy. The NCC’s Coal Policy Committee develops prospective topics for the Secretary’s consideration as potential subjects for NCC studies. During its nearly 35-year history, the NCC has prepared more than 35 studies for the Secretary, at no cost to the Department of Energy. All NCC studies are publicly available on the NCC website.
The NCC is a totally self-sustaining organization; it receives no funds from the Federal government. The activities and operations of the NCC are funded solely from member contributions, the investment of Council reserves and generous sponsors.

October 22, 2018
The Honorable Rick Perry U.S. Secretary of Energy U.S. Department of Energy 1000 Independence Ave., SW Washington, DC 20585
Dear Mr. Secretary:
On behalf of the members of the National Coal Council (NCC), I am pleased to submit to you, pursuant to your letter dated January 7th, 2018, the report “Advancing U.S. Coal Exports: An Assessment of Opportunities to Enhance Exports of U.S. Coal.” Consistent with your request, the report is focused on assessing and prioritizing market, infrastructure and policy measures that can be undertaken to increase export opportunities for U.S. coal. Additionally, the report provides a competitive assessment of U.S. coal export opportunities relative to other supplier nations, as well as an analysis of prospective international markets for U.S. coal.
As domestic demand for coal has softened, coal exports are an increasingly important market sector for U.S. coal producers. U.S. coal exports have been very volatile over the years, ranging from a peak in 2012 of 125 million tons to a low of 39 million tons in 2002. This volatility is attributable to many factors, including fluctuations in market demand, competition from global suppliers and various importing nation constraints, such as policies limiting coal imports and infrastructure restrictions. While many of these variables are outside the control of the U.S. government and industry, there are numerous factors which can be addressed by policymakers and commercial interests to enhance U.S. coal exports. The competitiveness and growth of U.S. coal exports depends primarily on the ability of U.S. producers to mine and ship coal to end-use markets at an overall delivered cost that is economically competitive with other global coal suppliers and other energy resources. The NCC report highlights opportunities and barriers to coal exports in the areas of U.S. coal production, transportation/shipping, international coal plant financing and trade. Coal Production. Development and deployment of advanced coal mining and processing technologies to reduce production costs would enhance the competitiveness of U.S. coals in international markets. Federal and state support mechanisms would facilitate continued operation in traditional supply regions and the development of infrastructure projects in non-traditional coal-producing regions in the U.S.

River Transport. Streamlining of funding for the nation’s inland waterway system of locks and dam infrastructure would facilitate the cost-efficient flow of U.S. coals to international markets via East and Gulf Coast ports. Ports & Terminals. Dredging and channel deepening at East and Gulf Coast ports would allow for the accommodation of larger ships, thereby lowering shipping costs and enhancing the delivered economics of U.S. coals in international markets. The development of West Coast export terminals would be enhanced with improved planning and cooperation between federal and state authorities responsible for environmental review/permitting and through reforms to NEPA and related permitting processes. NCC encourages the further study of opportunities to reduce export constraints through development of export terminals on federal properties. International Coal Plant Financing. Financing of coal facilities overseas is hampered by domestic and international policy barriers at the Export-Import Bank of the U.S. (EXIM), the Overseas Private Investment Corporation (OPIC) and Multilateral Development Banks (MDB) administered by the U.S. Treasury Department. To facilitate these and other recommendations to enhance U.S. coal exports detailed in the NCC report, we advocate for the establishment of a DOE-led, government-wide Coal Exports Task Force (or Energy Exports Task Force) to monitor and coordinate policy developments relevant to advancing U.S. energy exports. Participants should include all agencies engaged in energy development and international relations, including the U.S. Departments of Energy, Interior, State and Treasury, as well as the U.S. Trade and Development Agency (USTDA), OPIC and the EXIM Bank, among others. Advancing U.S. exports is a critical component of the nation’s efforts to achieve U.S. energy dominance, enhance international energy security and support our allies in eliminating global energy poverty. Thank you for the opportunity to prepare this report. The Council stands ready to address any questions you may have regarding its findings and recommendations. Sincerely,
Deck Slone National Coal Council Chair 2018-2019

NCC REPORT ACCEPTANCE LETTER
April 10, 2018
The Honorable Rick Perry, U.S. Secretary of Energy U.S. Department of Energy 1000 Independence Ave., SW Washington, DC 20585
Dear Mr. Secretary:
Thank you for your letter of January 7th, 2018 requesting that the National Coal Council (NCC) prepare a report on U.S. coal exports. While the delay in officially appointing members to serve on the Council has precluded us from responding to your request earlier, we are now able and eager to undertake the assignment.
On behalf of the members of the NCC, I am pleased to accept your request that the NCC develop a white paper assessing opportunities to advance U.S. coal exports. Activity has already begun on preparing the report which will address the following questions:
What market, infrastructure and policy measures could be undertaken to increase export opportunities for U.S. coal?
What global market dynamics present opportunities for increased U.S. coal exports?
How can U.S. coal capitalize on its advantages and become more competitive in international markets?
What institutional and regulatory constraints are limiting the advancement of U.S. coal exports?
Justin Burk, Commercial Director for Peabody and David Lawson, Vice President Coal for Norfolk Southern Railroad will serve as co-chairs for this white paper. We will have the report completed by September 13th, 2018.
Thank you for your support of the National Coal Council. We welcome the opportunity to support your and President Trump’s vision for our nation’s energy future. Sincerely,
Greg Workman National Coal Council Chair 2017-2018
Report Request from Energy Secretary Rick Perry

Advancing U.S. Coal Exports An Assessment of Opportunities to Enhance Exports of U.S. Coal
Table of Contents Executive Summary 1
Introduction 7
Chapter 1. United State Coal Export Landscape 9
Key Findings 9
Coal in the United States 9
Economic Benefits of U.S. Coal Exports 10
U.S. Coal Exports Overview 11
U.S. Coal Export Regions 12
Transportation of U.S. Coal for Export 14
Railroads 15
Inland Waterways 17
Ports 19
Vessel & Shipping Considerations 22
Prime Markets for U.S. Coals 23
Chapter 2. Competitive Assessment 24
Key Findings 24
Global Coal Market Supply & Demand 24
Metallurgical Coal Trade 26
Thermal Coal Trade 28
Competitiveness of U.S. Coal with Global Supply 30
Trends in Export Coal Pricing 33
Exchange Rates & Price Indexes 33
Effects of Policy on Global Coal Trade 35
Chapter 3. Barriers to U.S. Coal Exports 37
Key Findings 37
Supply Considerations 37
Federal Mineral Ownership 38
Mining Regulation 39
Support for Traditional Coal Supply Regions 39
Development of Non-Traditional Coal Supply Regions 40
Transportation & Shipping Considerations 40
U.S. East Coast 40
U.S. Gulf Coast 41
U.S. West Coast 42
Funding 43

Institutional & Regulatory Factors 43
Barriers to Coal Export Terminal Development 43
Review & Permitting Process 44
Greenhouse Gas Emissions Considerations 46
Export Facilities on Federal Lands 47
International Coal Plant Financing:
Multilateral Development Banks 47
International Coal Plant Financing: Domestic Entities 50
Export-Import Bank of the United States 50
Overseas Private Investment Corporation 51
U.S. Agency for International Development 51
U.S. Trade & Development Agency 52
Energy Access, Poverty Elimination and Energy Security 53
Trade Barriers 55
Technological Considerations 56
Technological Improvements in Mining 56
Coal Washing & Upgrading 56
Exports of U.S. Advanced Coal Technologies 57
Chapter 4. Conclusions & Recommendations 58
Coal Production 59
River Transport 60
Ports & Terminals 60
Trade & International Relations 61
Economic Development in International Markets 62
Appendices
A. Coal Statistics 63
B. U.S. Coal Exports by State 67
C. Principal U.S. Coal Export Facilities 69
D. Status of Proposed Coal Export Projects 71
E. Global Coal Market Statistics 73
F. Principal Global Suppliers of Metallurgical Coal
– Country Breakdown 75
G. Principal Global Suppliers of Thermal Coal – Country Breakdown 80
H. Competitive Assessment of U.S. vis-à-vis Global Suppliers 85
I. U.S. Thermal & Metallurgical Coal Exports by Destination 89
J. Coal Financing Policies of Key Lending Institutions 90
Advancing U.S. Coal Exports An Assessment of Opportunities to Enhance Exports of U.S. Coal
FIGURES & TABLES Figures Figure 1. Global Coal Reserves Figure 2. Global Coal Trade Figure 3. 2017 Eastern Basin Production & Reserves Figure 4. 2017 U.S. Coal Exports Departing from the 10 Largest Outlets Figure 5. Overview of North American Rail Network Figure 6. Primary Class 1 Railroad Corridors Figure 7. 2017 Eastern Basin Production & Reserves Figure 8. Major U.S. Ports & Waterways Figure 9. Major Export Ports for Eastern U.S. Coal Figure 10. Major U.S. Coal Trade Flows Figure 11. Metallurgical Coal Imports & Exports Figure 12. Thermal Coal Imports & Exports Figure 13. Prompt Month API2 Thermal Coal Price History Figure 14. Metallurgical Coal Price History Figure 15. Relationship of U.S. Dollar to Australian Dollar, Euro and Chinese RMB Figure 16. Chinese Overseas Coal Power Financing Destinations Tables Table 1. Global Coal Trade – Major Coal Importers & Exporters Table 2. U.S. Eastern & Interior Coal Basin Exports Table 3. U.S. Western Coal Basin Exports Table 4. U.S. Coal Exports by Destination Table 5. Advantages & Challenges of U.S. Metallurgical Coal vs. Competitive Supply Table 6. Advantages & Challenges of U.S. Thermal Coal vs. Competitive Supply Table 7. U.S.-based Entities with a Role in Coal Financing & Export Development

Advancing U.S. Coal Exports An Assessment of Opportunities to Enhance Exports of U.S. Coal
ACRONYMS
The U.S. ton is a short ton - 2000 pounds; the metric tonne is approximately 2,204.6 pounds. In this report, tonnages are not standardized. “Tons” refer to short tons and “tonnes” refers to metric tonnes.
ACCCE American Coalition of Clean Coal Electricity ADB Asian Development Bank ASC Advanced Super Critical AUSC Advanced Ultra-Super Critical BLM Bureau of Land Management BNSF Burlington Northern Santa Fe Railway CAPP Central Appalachia CEQ White House Council on Environmental Quality CIF Costs, Insurance & Freight CSX CSX Transportation DOE U.S. Department of Energy DWT Dead Weight Ton EIA Energy Information Administration EIS Environmental Impact Statement EVA Energy Ventures Analysis EXIM Export-Import Bank FLPMA Federal Land Policy Management Act FMV Fair Market Value FOB/FOBT Free on Board/Free on Board Trimmed GHG Greenhouse Gas HELE High Efficiency Low Emissions HMT Harbor Maintenance Tax IEA International Energy Agency ILB Illinois Basin JUSEP Japan-U.S. Strategic Energy Partnership LBA Lease by Application MDB Multilateral Development Bank MLA Mineral Leasing Act MSHA Mine Safety & Health Administration NAPP Northern Appalachia NCC National Coal Council NEPA National Environmental Policy Act NMA National Mining Association NS Norfolk Southern Corporation OBOT Oakland Bulk Oversized Terminal OECD Organization of Economic Cooperation & Development OPIC Overseas Private Investment Corporation PRB Powder River Basin SAPP Southern Appalachia UNFCCC United Nations Framework Convention on Climate Change UP Union Pacific Railroad USAID U.S. Agency for International Development USTDA U.S. Trade Development Agency

P A G E | 1
Advancing U.S. Coal Exports
An Assessment of Opportunities to Enhance Exports of U.S. Coal Co-Chairs:
Justin Burk, Commercial Director, Peabody
David Lawson, Vice President Coal, Norfolk Southern Corporation
Executive Summary Coal is ubiquitous and can be found in nearly every corner of the globe. Recoverable
amounts of coal are found and commercially mined in over 50 countries and consumed in more
than 70 countries. While significant commercial amounts of coal are exported by many
countries, just 10 countries, including the U.S., accounted for over 95% of exports in 2017.
Coal trade is a large and growing business as developing economies electrify and
industrialize using the lowest cost fuels available to them. The global market for coal is
widespread but currently driven by the large demand in Asia – most notably by China and India.
Key suppliers to the global coal trade have been Australia, Indonesia, Russia, Colombia,
South Africa and the U.S. While the U.S. is a major exporter of metallurgical coal, it is generally
considered a “swing” supplier with respect to thermal coal. The level of U.S. participation in the
global coal trade is a function of its competitiveness with other global suppliers, periodic
shortages in the market, fluctuations in demand and macroeconomic factors such as currency
exchange rates. There is reason to believe that market demand and plateauing supplies from
other sources hold promise for continued growth of U.S. coal exports.
Value of Coal Exports The U.S. exceeds all other nations in proven coal reserves. Our nation’s abundant,
affordable and diverse domestic energy resources underpin our economic prosperity, providing
both domestic and export opportunities. Low-cost electricity in the U.S., driven in large part by
coal generation, has fueled our commercial and manufacturing sectors, providing us with a
competitive advantage in global markets. Our energy abundance has also provided the U.S.
with the opportunity to export energy resources, supporting trading partners and emerging
nations in efforts to modernize their economies and combat energy poverty, while fostering
U.S. economic growth.
Coal exports are an increasingly important market sector for U.S. coal producers. In
2017, coal exports accounted for 12.5% of total U.S. production – the highest level since the
early 1980s. These exports contributed $13 billion to the U.S. Gross Domestic Product (GDP)
and created, directly and indirectly, 100,000 jobs in the U.S.

P A G E | 2
Coal Export Landscape Coal exports are driven by international thermal and metallurgical coal supply and
demand. Thermal coal, also known as steam coal, is used in generating steam to create
electricity as well as to provide energy for industrial processes such as cement production.
Metallurgical coal, often referred to as coking coal, is used in steel making.
In 2017, U.S. coal exports increased 61% year-over-year to 97 million tons, which was
the highest export total since 2014. Non-western ports shipped 87 million tons of coal (89% of
total U.S. exports) in 2017.
Europe and Asia account for the vast majority of all U.S. coal exports. The U.S. has
historically been a key coal supplier to Europe due to the proximity of U.S. East Coast and Gulf
Coast terminals to Europe, longstanding business relationships between the U.S. and Europe,
and desirable coal qualities that are readily consumed in Europe. Asia’s growing demand for
coal represents a significant growth opportunity for U.S. coal exports.
Major direct competitors to U.S. metallurgical coal exporters are Australia, Russia and
Canada. These countries compete with the U.S. for the metallurgical coal trade market,
calculated to be between approximately 300 and 325 million tonnes in 2017. Over time,
Mozambique may develop as a major source. The supply into the export market is fungible and
can shift between sources.
The major competitors for U.S. thermal coal exporters are market-dependent. In
Europe, the primary U.S. competitors are Russia and Colombia. Australia is a major competitor
in the Asian market. South Africa, because of its location, is a swing supplier between the
European and Asian markets. The U.S. would be a major competitor to Indonesia if additional
exports of Powder River Basin coal to Asia were realized given that many customers desire
supply diversity, heightening the U.S.’s position as a stable export supplier.
U.S. coal exports have been very volatile over the years, ranging from a peak in 2012 of
125 million tons to a low of 39 million tons in 2002. This volatility is attributable to many
factors, including fluctuations in market demand, competition from global suppliers and various
importing nation constraints, such as coal-import limiting policies and infrastructure. While
many of these variables are outside the control of the U.S. government and industry, there are
numerous factors which can be addressed by policymakers and commercial interests to
enhance U.S. coal exports.
Supply Considerations There are ample reserves of U.S. coal to allow for an increase in exports. Regional
supply/demand considerations may limit what is immediately available to export versus what
can be developed for long-term export markets. The barriers to the development of U.S. coal
reserves for the export market are generally regional in nature. The most significant are related
to federal mineral ownership, mining regulations, support for traditional coal supply regions
and the development of non-traditional coal supplies.

P A G E | 3
Another important consideration on the supply side is ensuring that the industry is
keeping up with the potential technological improvements in mining and preparation that
would allow U.S. producers to better compete with other producing countries. The industry has
identified areas where it can potentially reduce operating costs with capital investments,
including a move to driverless vehicles, extending advanced technology to continuous miners,
state-of-the-art digital technology, real-time analytics and optimization, advanced control
systems, artificial intelligence and machine learning, and predictive maintenance.
Coal washing and upgrading technologies are designed to reduce the amount of mineral
matter and/or moisture in coal, which can be particularly important for coal slated for export.
Transporting coal with a higher heat content could reduce transportation costs on a quality
adjusted evaluated basis – improving the value proposition for some U.S. coal compared to the
international market.
Some international markets for U.S. coals are restricted or could become restricted due
to coal quality constraints or lack of environmental technologies/controls at end-user facilities.
It would be beneficial to continue U.S. efforts to research, develop and deploy advanced coal
technologies that could be retrofit to existing plants and/or adopted in new plant construction
that would enable other nations to make use of a wider range of U.S. coals.
Transportation & Shipping Considerations While generally robust, the nation’s coal transportation and shipping network would
benefit from various infrastructure improvements.
On the East Coast, channel deepening would improve navigational efficiencies, allow
safe passage of vessels in and out of the harbor, and improve accommodation of the existing
fleet. Dredging and maintaining key shipping channels to accommodate larger, more cost-
effective vessels and maximize navigational efficiencies would help to enhance the
competitiveness of U.S. coal exports.
On the Gulf Coast, the inland waterways system of locks and dams requires constant
maintenance. The lack of regular dredging has significantly restricted movements on the inland
waterways, especially during periods of low water.
On the West Coast, the limited capacity of export terminals has greatly limited the
ability to export western U.S. coals. The environmental review and permitting process to
approve the development of coal export facilities is unnecessarily slow and cumbersome.
Because objections to export facilities are often driven by fundamental and philosophical
opposition to the production and use of coal, as well as the divergent approaches between the
Federal government and state/local entities, policy reforms recommended within this report
may not be sufficient to reduce uncertainties in a manner that enables projects to move
forward. Further study is warranted into the long-term potential to reduce export constraints
through the development of export terminals on Federal properties that would benefit from a
streamlined and simplified review and permitting process.

P A G E | 4
Institutional and Regulatory Considerations With more than 900 gigawatts (GW) of coal capacity placed into service worldwide since
2000, and over 600 GW planned or under construction, the potential for U.S. thermal coal
exports to supply steadily growing international demand is significant. However, the inability
for the U.S. and Multilateral Development Banks (MDB) to support these projects may prevent
this potential from being realized.
In response to the void created by U.S. and MDB funding prohibitions, China, Japan,
Korea and other countries have stepped in to provide financial support for – and outsized
influence over – continued coal development. These circumstances not only place the U.S. at a
disadvantage by limiting the potential for U.S. coals and plant technologies to supply
international markets, in many cases they result in inferior environmental controls.
A number of domestic entities also have a potential role in supporting continued
development of coal-fired power plants overseas. The Export-Import Bank of the United States
(EXIM Bank) is the official export credit agency of the U.S. government. In 2013, the EXIM Bank
adopted guidelines prohibiting support for projects associated with coal mining or electricity
generation except in rare circumstances. The Bank followed this policy by leading a coalition of
international export credit agencies to sign an agreement under the OECD committing to the
same prohibitions.
The Overseas Private Investment Corporation (OPIC) is charged with mobilizing private
capital to help foster economic development in emerging economies, and in doing so, advance
U.S. foreign policy objectives. While OPIC’s mission and focus makes it well-suited for
supporting foreign policy objectives by enhancing opportunities for U.S. coal exports, in 2009, a
legal settlement with non-governmental organizations committed OPIC to a cap on greenhouse
gas emissions from its portfolio of investments that was then codified by Congress in
appropriations legislation later that year. As a practical matter, these restrictions have
effectively barred OPIC from supporting coal-related projects.
Trade Barriers Increasing coal exports has the potential to improve the U.S. balance of trade while also
providing a boost to coal producers facing uncertainty in domestic markets. Escalating trade
tensions are a serious concern that could result in significantly restricted markets for U.S. coal.
In addition to China, a number of other countries have initiated retaliation measures to U.S.-
imposed tariffs on steel and aluminum imports, and at least one – Turkey – has included coal
among the list of targeted U.S. products. Beyond specific barriers such as tariffs, the general
ongoing friction on trade issues threatens to reduce the willingness of U.S. trade partners to
enter into agreements to buy U.S. energy resources.
Meanwhile, a number of key markets have long imposed unfair tariffs on U.S. coal
imports. These artificial costs exacerbate the geographical disadvantage of U.S. coal exports to
Asia and impact the competitiveness of deliveries to the region. U.S. government efforts to
reduce or eliminate these tariffs would facilitate increased coal export opportunities.

P A G E | 5
Ultimately, while the potential for current tensions to negatively impact U.S. coal is high,
heightened attention to global trade issues also presents an opportunity for U.S. negotiators to
expand market access for U.S. coal. Efforts by the DOE, U.S. trade negotiators and diplomatic
officials to actively encourage such purchases and undertake dedicated steps to identify and
pursue bilateral and multilateral opportunities throughout the world would also facilitate
opportunities for expanded U.S. coal exports.
National Coal Council Recommendations The competitiveness and growth of U.S. coal exports depends primarily on the ability of
U.S. producers to mine and ship coal to end-use markets at an overall evaluated delivered cost
that is economically competitive vis-à-vis other global coal suppliers and vis-à-vis other energy
sources. Numerous opportunities exist to enhance the competitiveness of U.S. coal exports at
every link in the coal supply chain and by addressing various trade and regulatory barriers.
NCC’s primary strategic recommendations are as follows; tactics for achieving these
objectives are detailed in Chapter 4 of the report.
Coal Production. Deploy advanced coal mining and processing technologies to reduce
production costs, thus making U.S. coals more competitive in international markets.
Enhance U.S. coal mining operations with the greatest export potential in both traditional
and non-traditional coal supply regions.
River Transport. Streamline the funding to the nation’s inland waterways system of locks
and dam infrastructure to facilitate the cost-efficient flow of U.S. coals to international
markets via U.S. East and Gulf Coast ports.
Ports & Terminals. Enhance coal export port and terminal capacity on the U.S. Atlantic,
Gulf and West coasts.
Trade and International Relations. Eliminate policy and technology barriers to the
deployment of advanced coal facilities in international markets. Additionally, capitalize on
trade opportunities, assessing policies and approaches that inhibit or promote U.S. trade
and U.S. coal exports.
Economic Development in International Markets. Support efforts to advance economic
growth in international markets and the global development of advanced coal technologies,
as well as the elimination of regulatory and institutional barriers to the deployment of coal-
fired facilities worldwide.
Finally, to facilitate execution of the recommendations in this report, NCC recommends
establishing a DOE-led, government-wide Coal Exports Task Force (or Energy Exports
Coordination Task Force) to monitor and coordinate policy developments relevant to advancing
coal exports. Participants should include all agencies engaged in energy development and
international relations, including the U.S. Departments of Energy, Interior, State and Treasury,
as well as USTDA, OPIC and the EXIM Bank, among others.

P A G E | 6

P A G E | 7
Introduction
Coal is ubiquitous and can be found in nearly every corner of the globe. Recoverable
amounts of coal are found and commercially mined in over 50 countries and consumed in more
than 70 countries.i Global coal production totaled 7.73 billion tonnes1 in 2017.ii Coal’s low cost
creates significant demand for its use in both manufacturing and electricity production.
A vibrant global export/import trade flow has developed reaching over 1.3 billion tonnes
in 2017 according to the International Energy Agency (IEA).iii While significant commercial
amounts of coal are exported by many countries, just 10 countries, including the U.S.,
accounted for over 95% of exports in 2017.iv
Thus, the geopolitics of coal is born – the geography of coal sources and consumption
centers, married by the trade flow that enables a coal market to flourish, and influenced by the
complimentary and sometimes competing regulatory and policy impacts of individual
governments. Logistics, coal quality, economics and government policy define that coal trade
flow, the large majority of which is accomplished using seaborne methods.
Coal trade is a large and growing business as developing economies electrify and
industrialize using the lowest cost fuels available to them. The global market for coal is
widespread but currently driven by the large demand in Asia – most notably by China and India
which in recent years have experienced a major coal supply crunch. Both countries have used
imports to bridge the gap between domestic supply and demand, a phenomenon that is likely
to continue.
Key suppliers to the global coal trade have been Australia, Indonesia, Russia, Colombia,
South Africa and the U.S. While the U.S. is a major exporter of metallurgical coal, it is generally
considered a “swing” supplier with respect to thermal coal2. The level of U.S. participation in
the global coal trade is a function of its competitiveness with other global suppliers, periodic
shortages in the market, fluctuations in demand and macroeconomic factors such as currency
exchange rates. There is reason to believe that market demand and plateauing supplies from
other sources hold promise for continued growth of U.S. coal exports.
The National Coal Council’s (NCC) Advancing U.S. Coal Exports report has been
undertaken at Secretary Perry’s request to assess opportunities to advance exports of U.S. coal.
This report examines international markets for both thermal and metallurgical coal, provides a
competitive assessment of U.S. coal export potential vis-à-vis global suppliers, and addresses
key barriers impeding the export of U.S. coal.
1 The U.S. ton is a short ton which is 2000 pounds; the metric tonne is approximately 2,204.6 pounds. In this report, tonnages are not standardized. “Tons” refer to short tons and “tonnes” refers to metric tonnes. 2 Thermal coal, also called steam coal, is used for electricity production. Metallurgical coal is used for coking in steel production.

P A G E | 8
Table 1. Global Coal Tradev
2015 2016 2017p 2015 2016 2017p
Indonesia 368.0 372.9 390.6 PR of China 204.1 255.6 271.1
Australia 392.3 389.3 378.9 India 212.1 193.6 208.3
Russian Federation 155.2 171.1 189.7 Japan 189.3 186.0 187.5
U.S. 67.1 54.7 88.0 Korea 134.0 134.5 148.2
Colombia 72.8 83.3 86.1 Chinese Taipei 64.8 65.6 67.6
South Africa 75.8 69.9 71.0 Germany 54.5 27.8 48.0
Mongolia 14.7 24.1 33.4 Netherlands 57.1 49.5 40.3
Canada 30.5 30.3 31.1 Turkey 34.0 36.2 38.3
Kazakhstan 31.2 26.0 27.1 Malaysia 25.5 27.2 31.5
Netherlands 36.6 34.6 24.4 Russian Federation 24.1 24.0 29.0
Other 60.8 70.7 50.0 Other 305.9 288.3 317.1
OECD Americas 98.4 85.9 119.9 OECD Americas 35.4 35.1 36.1
OECD Asia Oceania 393.7 390.5 380.1 OECD Asia Oceania 334.8 329.7 344.8
OECD Europe 54.9 50.7 36.4 OECD Europe 263.6 237.8 234.0
OECD Total 547.0 527.1 536.4 OECD Total 633.8 602.6 614.9
Africa + Middle East 81.5 80.0 83.5 Africa + Middle East 14.4 15.2 14.2
Other Asia Oceania 414.4 437.4 445.3 Other Asia Oceania 583.7 628.4 674.9
Other Europe + Eurasia 188.2 198.4 218.3 Other Europe + Eurasia 47.3 46.7 56.4
Other Americas 73.7 84.1 86.7 Other Americas 26.2 25.3 26.6
Non- OECD Total 757.8 799.9 833.8 Non- OECD Total 671.6 715.6 772.1
World 1,304.8 1,327.0 1,370.2 World 1,305.4 1,318.2 1,387.0
Source: IEA, 2018 Coal Information Overview
Major Coal Exporters (Million Tonnes) Major Coal Importers (Million Tonnes)

P A G E | 9
Chapter 1. United States Coal Export Landscape
Key Findings – Chapter 1
U.S. coal exports provide significant economic benefits to the nation in terms of direct and
indirect jobs, as well as associated economic activity that enhances the U.S. economy.
U.S. reserves of both thermal and metallurgical coal are vast and can support both U.S.
domestic needs and the expanding international market demand.
While robust in many aspects (rail network, East and Gulf Coast port capacity), U.S. coal
export infrastructure would be enhanced with improvements such as deepening of U.S.
East and Gulf Coast ports to accommodate larger, more economical vessels, regular
dredging and maintenance of inland waterways channels, and the addition of export port
capacity on the U.S. West Coast.
Coal in the United States The United States exceeds all other nations in proven coal reserves. Recoverable
reserves of coal in the U.S. exceed 250 billion tonnes and are estimated to last more than 300
years at current usage rates.vi
Figure 1. Global Coal Reserves
In 2017, 1,200 mines in the U.S. produced 774 million tons of coal, more than 86% of
which was used for domestic power generation.vii In 2017, U.S. coal was mined in 25 states;
60% west of the Mississippi River and 40% in the east.viii (See Appendix A for an overview of
coal production, reserves, consumption, exports, imports and price indicators.)
Country Million Tonnes ShareU.S 258,709 25.0%
Russia 160,364 15.5%
Australia 144,918 14.0%
China 139,919 13.5%
India 97,728 9.4%
Germany 36,100 3.5%
Ukraine 34,375 3.3%
Poland 25,811 2.5%
Kazakhstan 25,605 2.5%
Indonesia 22,598 2.2%
Other 88,885 8.6%
Total 1,035,012 100.0%Source: BP Statistical Review of World Energy, June 2017

P A G E | 10
Economic Benefits of U.S. Coal Exports
Our nation’s abundant, affordable and diverse domestic energy resources underpin our
economic prosperity, providing both domestic and export opportunities in support of the
Trump Administration’s American Energy Dominance objectives.ix Low-cost electricity in the
U.S., driven in large part by coal generation, has fueled our commercial and manufacturing
sectors, providing us with a competitive advantage in global markets. Our energy abundance
has also provided the U.S. with the opportunity to export energy resources, supporting trading
partners and emerging nations in efforts to modernize their economies and combat energy
poverty, while fostering U.S. economic growth.
As domestic demand for coal has softened, coal exports are an increasingly important
market sector for U.S. coal producers. In 2017, coal exports accounted for 12.5% of total U.S.
production – the highest level since the early 1980s. These exports contributed $13 billion to
the U.S. Gross Domestic Product (GDP) and created, directly and indirectly, 100,000 jobs in the
U.S.x The economic contribution of coal exports extends well beyond the activities conducted at
mine sites and includes employment related to downstream transportation that moves coal
from mines to ports, as well as the port services that prepare and load the coal for shipment
abroad, and other businesses throughout the economy that are supported by coal export
activity.
In 2017, workers employed in coal-export related businesses (coal mining,
transportation, ports and shipping) earned an annual average of $101,800 in wages and
benefits, compared to the U.S. average of $68,400. In coal-dependent regions, coal mining jobs
are among the best paying. For example, in Belmont County, Ohio the average weekly wage of
a service job is about $600, whereas coal miners in Belmont County make an average of nearly
$1,700 per week – nearly three times as much.xi
The jobs created by coal exports are highly concentrated in several states, including
West Virginia – 16,730 jobs, Virginia – 13,480 jobs, Pennsylvania – 8,740 jobs, and Alabama –
8,630 jobs.xii While the economic impacts of coal exports in the U.S. are relatively small, for
certain regions they are very significant. For example, in 2017 in West Virginia coal exports
accounted for 3% of state GDP and 2.5% of total employment, and for much higher percentages
in specific West Virginia counties. The 2017 West Virginia unemployment rate was 5.3%.
Absent the jobs created by coal exports, the unemployment rate would have been 7.5% –
nearly 50% higher.xiii
In 2017, Ukraine began purchasing U.S. thermal coal mined in Pennsylvania. This
partnership was formed in response to Ukraine’s desire to diversify its energy supply; the U.S. is
providing Ukraine with a secure and competitive energy source.xiv Pennsylvania coal exports to
Ukraine created 455 coal-related jobs in the state and over 600 jobs in U.S. as a whole.

P A G E | 11
While these jobs are not significant at the state or national level, they are important for
the counties of Luzerne, Northumberland and Schuylkill. For example, the 216 jobs created in
Schuylkill County reduce the number of unemployed in the county by 5.5%, from 3,900 to
3,684, and reduce the unemployment rate from 5.8% to 5.5%. There are 2,377 total coal-
related jobs in Schuylkill County, which represents about 4% of total county employment.
Absent these coal-related jobs, the county unemployment rate would be 9.3% instead of
5.8%.xv
Coal and coal exports are disproportionately significant to specific sectors. For example,
in 2017 coal accounted for 33% of originated tonnage for U.S. Class I railroads, far more than
any other commodity, and comprised 15% of rail revenues.xvi Railroads transport over 70% of
U.S. coal and derive more revenues from coal than from almost any other commodity – more
than 10% of revenues transporting 523 million tons in 2017.xvii Coal exports are also very
important to U.S. railroads, and a large portion of U.S. coal exports travels by rail. In 2017, coal
exports accounted for about $1 billion in railroad revenues.
U.S. Coal Exports Overview Coal exports are driven by international thermal and metallurgical coal supply and
demand. Thermal coal, also known as steam coal, is used in generating steam to create
electricity as well as to provide energy for industrial processes such as cement production.
Metallurgical coal, often referred to as coking coal, is used in steel making.xviii
In 2017, U.S. coal exports increased 61% year-over-year to 97 million tons, which was
the highest export total since 2014. Non-western ports shipped 87 million tons of coal (89% of
total U.S. exports) in 2017. Of these, 64% were metallurgical exports and 36% were thermal.xix
Figure 2. Global Coal Trade
Source: EIA, U.S. Census Bureau, Doyle Trading Consultants
0%
2%
4%
6%
8%
10%
12%
14%
16%
0
20
40
60
80
100
120
140
1950 1960 1970 1980 1990 2000 2010
Sha
re o
f C
oa
l Pro
du
ctio
n
Mil
lio
n T
on
s
Total
Overseas Met
N. American Met
Overseas Therm
N. American Therm
Share of Coal Prod

P A G E | 12
U.S. Coal Export Regions
Coal exports vary by state of origin. In 2017, for example West Virginia had the most
coal exports with 34 million tons. There were six states with at least five million tons of coal
exports in 2016. (See Appendix B for a list of U.S. coal exports by state and the top U.S. coal
exporting companies.)
There are three primary coal regions recognized in the U.S. – Eastern, Interior and
Western. For the purposes of this report, the Interior is grouped into the Eastern region.xx (See
Appendix A for map of U.S. coal production regions.)
Eastern Region. Eastern basin mines are typically characterized by smaller mining complexes.
While a majority of the 940 mines are surface mines, on a volume basis, 67% of production
comes from underground mining. In 2017, 72% of export coal originates from Appalachian
basins, while 13% of export coal originates from the Interior.
The Eastern/Interior basins are comprised of Northern Appalachia (NAPP), Central
Appalachia (CAPP), Southern Appalachia (SAPP), and the Illinois Basin (ILB). Each basin differs in
geography, coal quality, and operating characteristics.
Table 2: U.S. Eastern & Interior Coal Basin Exports
Basin
2017
Production
(million
tons)
Active
Mines
(Dec
2017)
Export
Tons % States Primary Export Markets
NAPP 107.2 318 24% PA, OH, N-WV Both Thermal and Met
CAPP 78.5 431 38% S-WV, TN, E-KY, VA Primarily Met, with Some Thermal
SAPP 12.9 47 10% AL Met
ILB 103.2 124 13% IL, IN, W-KY Thermal
Source: U.S. Mine Safety & Health Administration (MSHA)
Production volume and capacity differs within each of the Eastern/Interior basins.
Access to total reserves in each basin is limited by property rights and are subject to obtaining
mining permits. NAPP and ILB have the highest current production, as well as the greatest
amount of reserves.
P A G E | 13
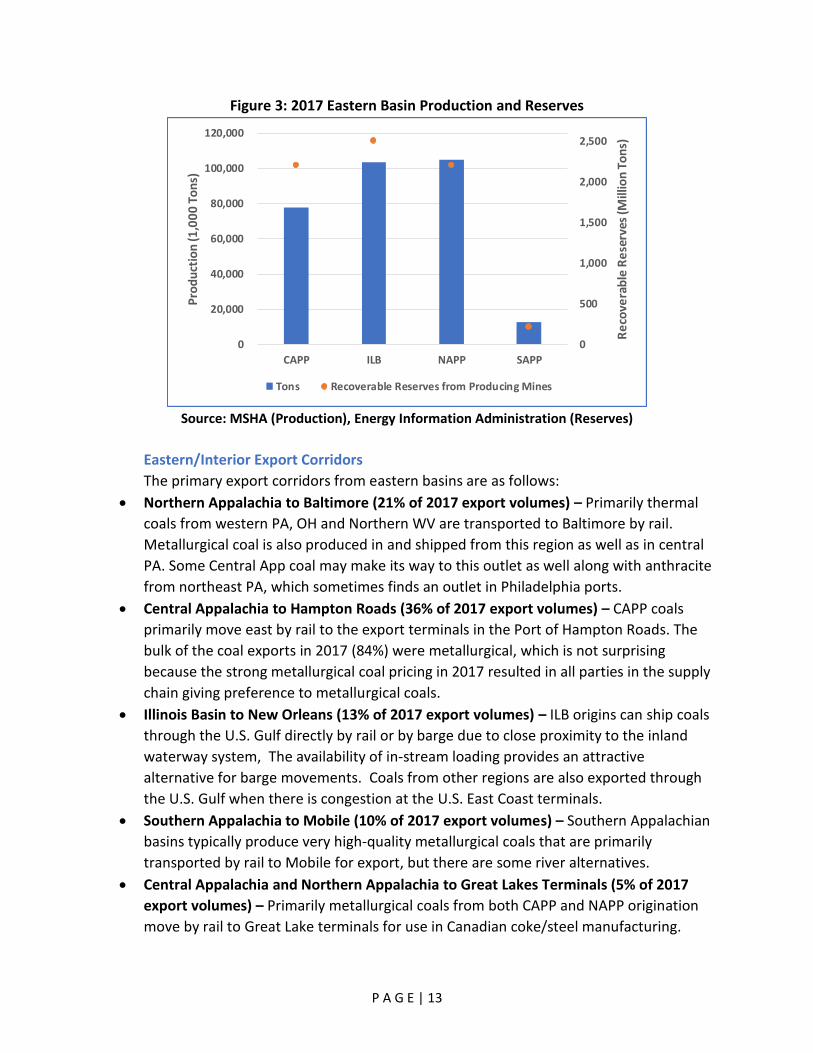
Figure 3: 2017 Eastern Basin Production and Reserves
Source: MSHA (Production), Energy Information Administration (Reserves)
Eastern/Interior Export Corridors
The primary export corridors from eastern basins are as follows:
Northern Appalachia to Baltimore (21% of 2017 export volumes) – Primarily thermal
coals from western PA, OH and Northern WV are transported to Baltimore by rail.
Metallurgical coal is also produced in and shipped from this region as well as in central
PA. Some Central App coal may make its way to this outlet as well along with anthracite
from northeast PA, which sometimes finds an outlet in Philadelphia ports.
Central Appalachia to Hampton Roads (36% of 2017 export volumes) – CAPP coals
primarily move east by rail to the export terminals in the Port of Hampton Roads. The
bulk of the coal exports in 2017 (84%) were metallurgical, which is not surprising
because the strong metallurgical coal pricing in 2017 resulted in all parties in the supply
chain giving preference to metallurgical coals.
Illinois Basin to New Orleans (13% of 2017 export volumes) – ILB origins can ship coals
through the U.S. Gulf directly by rail or by barge due to close proximity to the inland
waterway system, The availability of in-stream loading provides an attractive
alternative for barge movements. Coals from other regions are also exported through
the U.S. Gulf when there is congestion at the U.S. East Coast terminals.
Southern Appalachia to Mobile (10% of 2017 export volumes) – Southern Appalachian
basins typically produce very high-quality metallurgical coals that are primarily
transported by rail to Mobile for export, but there are some river alternatives.
Central Appalachia and Northern Appalachia to Great Lakes Terminals (5% of 2017
export volumes) – Primarily metallurgical coals from both CAPP and NAPP origination
move by rail to Great Lake terminals for use in Canadian coke/steel manufacturing.
0
500
1,000
1,500
2,000
2,500
0
20,000
40,000
60,000
80,000
100,000
120,000
CAPP ILB NAPP SAPP
Re
cove
rab
le R
ese
rves
(Mill
ion
To
ns)
Pro
du
ctio
n (1
,00
0 T
on
s)
Tons Recoverable Reserves from Producing Mines

P A G E | 14
Western Region. There are 65 coal mines in the western basins producing thermal coal. While
this is less than 10% of the total mines in the U.S., they represent 60% of tons produced
because of the large mines in the Powder River Basin (PRB).xxi The two primary basins in the
western U.S. include the PRB, with its large surface mines, and the Rockies, which is a
somewhat diverse set of mines operating in Colorado, Utah and Montana, with a combination
of surface and underground mines.
Table 3. U.S. Western Coal Basins Exports
Basin Export Tons States Primary Export
Markets
PRB 5.1 million MT, WY Thermal
Rocky Mountain 12.8 million CO, UT, MT Thermal
Source: EVA Coal Trade Report, U.S. Department of Commerce
At one time, Alaska exported considerable tonnage from the Usibelli mine to Korea and
elsewhere. The coal moved through the Seward Terminal which was closed in 2016. In 2015,
production started from the Eagle Pass mine in Texas which was developed to supply the
Carbon I and II plants in Mexico. The coal is delivered by rail to the plants which are located
just south of the U.S.-Mexico border. In 2017, the mine produced 2.4 million tons.
Western Export Corridors
The primary export corridors from western basins are as follows:
Powder River Basin and Montana to British Columbia, Canada (Westshore Terminal) –
Thermal coal from the PRB and Montana are transported via rail to Westshore and
other terminal in British Colombia.
Rocky Mountain Basin to California (Richmond, Stockton and Long Beach) – Thermal
coal from mines in Colorado and Utah are transported to U.S. West Coast terminals by
rail.
Rocky Mountain Basin to Sonora, Mexico (Guaymas) – Thermal coal from mines in
Utah have recently begun moving to a terminal facility at Guaymas.
Transportation of U.S. Coal for Export The primary shipping considerations for U.S. export coal are the availability of rail and
barge transport to move coal to the appropriate export terminals and the availability of
terminal capacity to load vessels of the appropriate size. Rail transports primarily to eastern,
western and Great Lakes ports, while barge utilizes inland waterways to U.S. Gulf Coast
terminals. Ten (10) ports account for 98% of U.S. coal export traffic. Additionally, the type of
coal (metallurgical or thermal) exported from specific terminals is dictated by the type of coal
produced in nearby basins.

P A G E | 15
Figure 4: 2017 U.S. Coal Exports Departing from the 10 Largest Outlets
(Bubble Size Represents Tonnage & % of Coal Exported)
Source: U.S. Energy Information Administration, Quarterly Coal Report (Oct.-Dec. 2017)
Seattle, WA and Laredo, TX outlets are port and rail transfer points.
Railroads
Coal and railways have been interlinked since the 1800s, and many of the first U.S.
railways were built specifically for coal. Coal traffic increased and evolved into the primary
source of revenue for railroads, and routes serving the mines became some of the heaviest
built and busiest lines in the country.xxii While rail coal volumes have declined in recent years,
coal remains a crucial commodity for the U.S. rail network.xxiii
Various factors come into play regarding rail capacity and performance as it relates to
handling the variable export market. These include:
Matching railroad owned assets (locomotives, cars, staffing, etc.) with demand, and
accommodating fluctuating coal export market demand with that of rail resources
needed for other industry supply chains,
Physical infrastructure, which affects routing, line capacity and length of haul, and
requires significant investment/maintenance,
Geography and terrain, which determines accessibility, train speed and size, and the
power necessary to move trains that increases naturally with grade, and
Corridor and shared asset restrictions, which may place constraints on train length,
weight and the number of trains that may move over a defined timeframe.
ILB 13%
NAPP 24%
SAPP 10%
CAPP 38%
PRB 8%
CO/UT 7%

P A G E | 16
Figure 5. Overview of North American Rail Network3
Sources: CSXxxiv and Norfolk Southernxxv
Eastern coals move to ports in established rail corridors that have a history of following
export volumes. The primary rail operators in the east are the CSX Corporation (CSX) and
Norfolk Southern Railroad (NS). These two carriers service all of the Appalachian basins,
providing the primary outlet to export markets for eastern coals. The primary rail operators in
the west are Burlington Northern Santa Fe (BNSF) and Union Pacific (UP). The PRB mines as
well as the large Signal Peak mine in Montana that are the predominant sources of western coal
exports move via the BNSF to the Westshore Terminal and other Canadian terminals in British
Columbia. UP transports coal from mines in Colorado and Utah to export facilities in California
and Mexico.
3 Class 1 railroads are designated as such by size criteria as defined by the Surface Transportation Board. There are seven Class I railroads including BNSF, Canadian National, Canadian Pacific, CSX, Kansas City Southern, NS and UP.
P A G E | 17
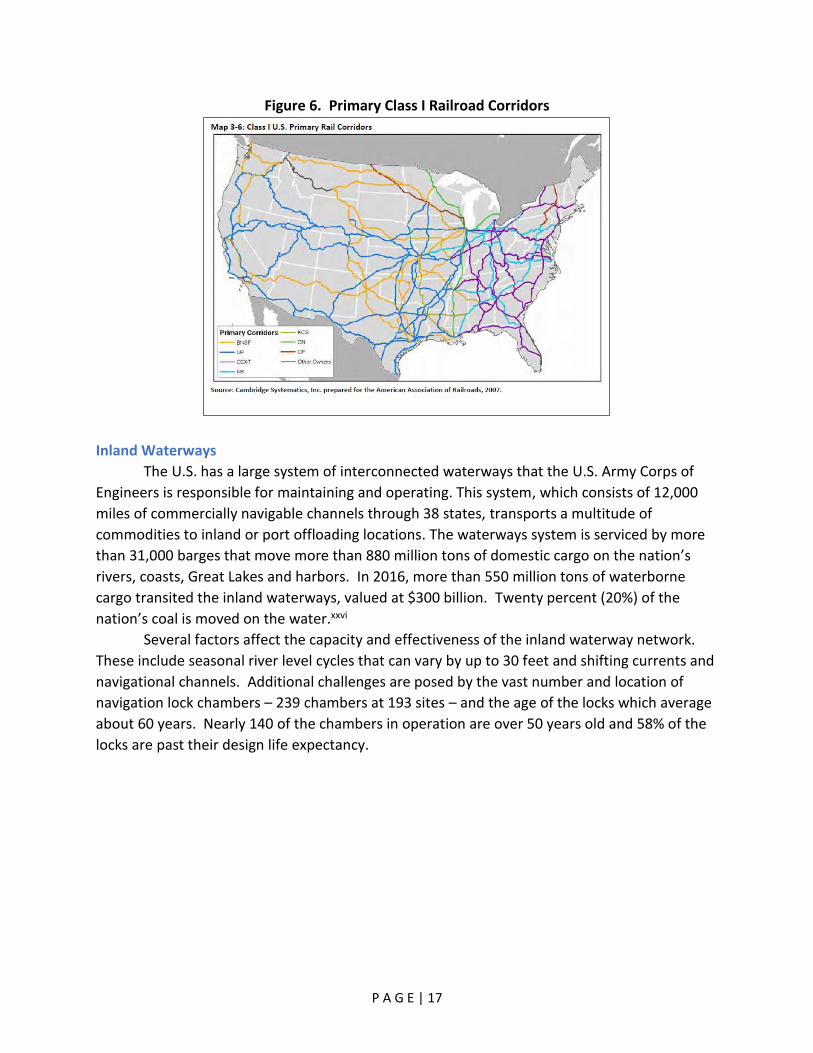
Figure 6. Primary Class I Railroad Corridors
Inland Waterways
The U.S. has a large system of interconnected waterways that the U.S. Army Corps of
Engineers is responsible for maintaining and operating. This system, which consists of 12,000
miles of commercially navigable channels through 38 states, transports a multitude of
commodities to inland or port offloading locations. The waterways system is serviced by more
than 31,000 barges that move more than 880 million tons of domestic cargo on the nation’s
rivers, coasts, Great Lakes and harbors. In 2016, more than 550 million tons of waterborne
cargo transited the inland waterways, valued at $300 billion. Twenty percent (20%) of the
nation’s coal is moved on the water.xxvi
Several factors affect the capacity and effectiveness of the inland waterway network.
These include seasonal river level cycles that can vary by up to 30 feet and shifting currents and
navigational channels. Additional challenges are posed by the vast number and location of
navigation lock chambers – 239 chambers at 193 sites – and the age of the locks which average
about 60 years. Nearly 140 of the chambers in operation are over 50 years old and 58% of the
locks are past their design life expectancy.

P A G E | 18
Figure 7. Overview of North American Inland Waterways Network
Sources: American Society of Civil Engineers and U.S. Army Corps of Engineersxxvii
The North American Inland Waterway Network
Key Stakeholders
U.S. Army Corps of
Engineers U.S. Department of Transportation
Infrastructure and Investment
Includes 239 Lock
Chambers with a
total lift of 6,791 ft
12,000 mile
system of
commercially
active inland and
intra-coastal
waterways
More than 926
coastal, Great
Lakes, and inland
harbors
What it moves
Where it moves
Moved over 550 million
tons of domestic
commodities in 2016
Directly serves 38 states
Made up of 4 large regions: i) Gulf
Coast/Mississippi System ii) Great
Lakes iii) Atlantic Coast iv) Pacific
Coast
Commodities include coal,
chemicals, food products,
raw materials, and
manufactured goods
Coal on the Inland Waterways
Moved 110 million tons of coal on internal waterways in 2016
(12.5% of total domestic traffic)
Second highest commodity movement via domestic waterways after
petroleum products

P A G E | 19
Figure 8: Major U.S. Ports and Waterways
Source: Armor Freight Services
Ports
Eastern producers typically export coals through the terminals on the U.S. East and Gulf
Coasts. U.S. West Coast ports provide better access for western producers by virtue of the
location of western coal basins and the proximity of the West Coast ports to the Pacific
markets. The shortage of terminals on the U.S. West Coast has limited the tonnage of U.S.
western coal that can be exported. While there are alternative outlets for western coals,
namely the terminals in British Columbia (e.g., Westshore and Ridley), in Mexico (e.g.,
Guaymas), on the Great Lakes (e.g., Duluth or Chicago with transloading into ocean vessels in
Quebec), and the U.S. Gulf Coast (e.g., direct rail to Houston and/or rail to barge to New
Orleans), the alternative routes are longer and hence more expensive.4
Eastern Ports. Most of the coal that is exported from producing regions of the eastern U.S.
(including Northern Appalachia, Central Appalachia, Southern Appalachia and the Illinois Basin)
is transloaded onto oceangoing vessels at terminals located on the U.S. East and Gulf Coasts.
The largest of these coal export terminals are located in four primary ports: Baltimore, MD;
Hampton Roads, VA; Mobile, AL; and New Orleans, LA. (Smaller volumes of eastern U.S. coal are
also exported through terminals located on the Great Lakes – primarily to Canada – and
through several additional terminals on the U.S. East and Gulf coasts). Figure 9 shows the
locations of these four major ports, along with their primary export destinations, reported
nameplate capacity and 2017 actual coal export volumes. Combined, these ports exported a
total of 78 million tons of coal in 2017, representing approximately 80% of the total U.S. coal
exported that year.
4 See Appendix C for summary of key statistics for major coal export ports and terminals handling U.S. export coals.

P A G E | 20
Figure 9. Major Export Ports for Eastern U.S. Coal Includes breakdown of metallurgical vs. steam coal shipments
and top five export destinations in 2017
Source: Host, EIA & USA Trade Onlinexxviii
This throughput volume equated to approximately 43% capacity utilization, based on
reported capacities, with Baltimore having the greatest capacity utilization (72%) and New
Orleans the lowest (22%). In fact, the data indicate that there is sufficient terminal capacity
available at these four ports to export ~181 million tons of coal, or nearly 60% of the total coal
produced east of the Mississippi River in 2017. However, experience during Q1 2018 suggests
that the actual working capacity of these terminals is hampered by various logistical and draft
depth constraints, as detailed below. These constraints can result in significant underutilization
of capacity. For example, the three major coal export terminals in the Port of Hampton Roads
have a reported capacity of ~6.5 million tons per month, or ~19.5 tons per quarter, but these
terminals exported only a combined volume of 4.7 million tons in April 2018 and 9.6 million
tons in Q1 2018 with vessels waiting in queue. Constraints on the transportation systems
serving these facilities, such as the availability of equipment and crews, have the potential to
constrain terminal capacity.
Several factors impact the accessibility, economics and effective capacity of each
terminal, including:
Inbound transportation options, that determine which mines can ship directly to the
terminal without having to switch transport modes/carriers, thus reducing the potential
for congestion and delayed shipments,
Unloading and loading rates, which affect the maximum rate at which coal can be
received and loaded onto ships,

P A G E | 21
Draft, which determines the maximum vessel size (weight) that the terminal can
accommodate (with implications for economics and throughput capacity),
Ground storage capacity and reclaim system design, which affects the extent to which
the terminal can accommodate imbalances between inbound and outbound shipment
volumes and the effectiveness with which it can blend multiple coals to meet the quality
specifications required by certain export customers, and
Pier design and number of berths, which again affect the maximum vessel size and
throughput capacity that can be accommodated.
In addition to the logistical constraints that contributed to below-capacity terminal
operation in early 2018, U.S. East and Gulf Coast coal export terminals are generally all
constrained by draft, which prevent them from fully loading the largest cape-size vessels
available for dry bulk transport. This affects the competitiveness of U.S. coals as higher freight
adds to the delivered cost per ton of U.S. coals. A project to dredge the main channel of the
Port of Hampton Roads from 50 ft to 55 ft of water depth has been budgeted by the Virginia
General Assembly and is pending final approval; if completed, this would allow higher-capacity
loading of cape-size vessels and improve the economic competitiveness of certain coal exports
from Hampton Roads.
Western Ports. Western U.S. coal exports are severely constrained by a lack of terminal and terminal
capacity on the U.S. West Coast. Most of western coal exports from the Powder River Basin are
being shipped through Canadian ports (e.g., Westshore) as are coal exports from the Signal
Peak mine in Montana. Coal exports from the Uinta Basin in Colorado and Utah are constrained
by limited ports in California. Some Uinta Basin coals are currently being exported through
Guaymas.
Westshore Terminals Inc. located in the Port of Vancouver, British Columbia (Canada)
has a total throughput capacity of 33 million tonnes in 2018. Approximately 14 million tonnes
are estimated to be under contract with U.S. thermal coal exports and the remaining 19 million
tonnes is for Canadian metallurgical coal exports, although this could change. The terminal,
with on-site storage for approximately 2 million tonnes, can be accessed by BNSF, Canadian
Pacific and Canadian National railways. Primary destinations for U.S. thermal coal out of
Westshore include Japan, South Korea, Chile and Taiwan. Capacity is expected to increase by
approximately 3 million tonnes in 2019. The Ridley and Neptune terminals in British Columbia
also handle coal but have a transportation disadvantage vis-à-vis U.S. coals due to their greater
distance from western coal basins.
The Metropolitan Bulk Terminal located in Stockton, CA has the capacity to load one
Panamax vessel per week at 50,000 tonnes, equating to an annual capacity of 2.6 million tonnes
per year. The terminal has storage capacity of approximately 100,000 tonnes of coal.
P A G E | 22
The Port of Richmond, CA has the capacity to load one Panamax vessel per week at
50,000 tonnes, equating to an annual capacity of 2.6 million tonnes per year and storage
capacity of approximately 80,000 tonnes. The primary coal exported through Richmond is
bituminous coal mined in the Uinta Basin in Utah. The port can be accessed by BNSF and UP
railroads. Maximum vessel size at berth is 55,000 tonnes.
The Oakland Bulk and Oversized Terminal (OBOT) in Oakland, CA is a redevelopment
proposal for the former Oakland Army Base on San Francisco Bay. The project is a
public/private partnership designed to revitalize the old site into a new bulk transloading
facility. The primary advantage is the port has a 50-foot (15.25 meters) depth at low tide which
allows it to take larger cape-sized vessels. This site is also served by both BNSF and UP
railroads, but 104 railcar unit-trains will need to be processed in 26-car segments. The facility
has capacity to top off two Panamax vessels per week (from Stockton/Richmond) to 85,000
tonnes equaling an annual capacity of 3.3 million tonnes per year.
The Port of Long Beach, CA is accessed by both the BNSF and UP, has storage capacity of
approximately 175,000 tonnes and can accommodate a maximum vessel size of 130,000
deadweight tonnes (DWT).
The Port of Guaymas in the Mexican state of Sonora is being used to export U.S. coal.
This is a multi-commodity port that is not explicitly designed for coal and it uses portable
(mobile) equipment to unload trains and load ocean-going vessels. Coal exports in 2018 are
estimated to be between 2.0 and 2.5 million tonnes. Coal is transported by the UP Railroad
from Utah to Nogales, Mexico at the Arizona border. From there, Ferromex rail delivers the
coal to Guaymas.
As detailed in Chapter 3 and Appendix D, numerous coal export terminals have been
proposed for development in the Pacific Northwest. To date, none have successfully advanced
and only one is still under consideration – the Millennium Bulk Terminals-Longview located on
private property in Longview, Washington with a proposed capacity of 44 million tonnes.
Vessels & Shipping Considerations
Dry bulk cargo vessels have varying load carrying capacities based on their size; larger
load carrying vessels are more cost-effective but require greater drafts and larger/longer piers.
Cape-size vessels have a load carrying capacity of up to 199,000 DWT; Panamax vessels up to
80,000 DWT; Handymax vessels up to 50,000 DWT. (See Appendix C for vessel categories.)
Sail times for eastern U.S. coal to reach northwest Europe (Amsterdam, Rotterdam and
Antwerp – collectively ARA) are approximately 13 days from U.S. East Coast terminals, and 17
days from U.S. Gulf Coast terminals. Sail times to India (via the Cape of Good Hope) are
approximately 42 days from the U.S. East Coast and 44 days from the U.S. Gulf Coast. Sail times
to Japan are approximately 34 and 32 days from the East and Gulf coasts, respectively, if the
coal is routed via the Panama Canal, and approximately 54 and 56 days, respectively, if the coal
is routed via the Cape of Good Hope.
Sail times from the U.S. West Coast to Japan and India are approximately 20 and 27
days, respectively.

P A G E | 23
Prime Markets for U.S. Coals Europe and Asia account for the vast majority of all U.S. coal exports. The U.S. has
historically been a key coal supplier to Europe due to the proximity of U.S. East Coast and Gulf
Coast terminals to Europe, longstanding business relationships between the U.S. and Europe,
and desirable coal qualities that are readily consumed in Europe. Asia’s growing demand for
coal represents a significant growth opportunity for U.S. coal exports.
Table 4: U.S. Coal Exports by Destination (million tons)
Source: EVA Monthly Coal Trade Report, June 2018
-
20
40
60
80
100
120
140
2012 CY 2013 CY 2014 CY 2015 CY 2016 CY 2017 CY 2018 YTD
Europe/Africa Met Coal
Europe/Africa Steam Coal
Other Americas Met Coal
Other Americas SteamCoal
Canada Met Coal
Canada Steam Coal
Asia Met Coal
Asia Steam Coal
ANNUAL U.S. COAL EXPORTS BY DESTINATION REGION
(million tons)
Source: EVA Analysis of U.S. Department of Commerce data; 2018 data through June

P A G E | 24
Chapter 2. Competitive Assessment
Key Findings – Chapter 2
Global coal trade is a robust and growing market; worldwide coal trade has more than
doubled since 2000.
While Europe continues to be a principal market for U.S. eastern metallurgical coals,
burgeoning demand in Asia represents a significant market opportunity for both eastern
and western U.S. thermal coals.
Global seaborne coal trade markets are volatile, influenced by such varied factors as
economic growth/decline cycles, weather disruptions, currency exchange rates, nations’
energy policies, trade regulations/agreements and geopolitics.
Global Coal Market Supply and Demand Coal trade is an increasingly important segment of the global coal market, accounting
for nearly 20% of global coal consumption in 2017. xxix Global trade in 2017 grew by 3% from
2016 levels and is now more than twice the trade volume of 2000.xxx The increase in global coal
trade has benefitted all participants, including producers and traders based in the U.S.
Global coal trade remains robust with total exports in 2017 approaching 1.4 billion
tonnes. xxxi As shown in the figure below, the largest net importers of coal are concentrated
primarily in Asia, while the largest exporters are distributed relatively evenly across the globe in
Indonesia, Australia, Russia, the U.S., Canada, South Africa and Colombia.
Figure 10: Major U.S. Coal Trade Flows (2017)
Source: United Nations, U.S. Census Bureau

P A G E | 25
Asian coal imports have grown dramatically and now comprise nearly three-quarters of
total global imports. xxxii Coal demand is expected to continue its shift toward Asia according to
numerous international agencies, including the International Energy Agency (IEA), BP in its
latest Energy Outlook and the U.S. Energy Information Administration (EIA). China was
traditionally a net coal exporter (i.e., exports exceeded imports) but since 2007 the country has
relied on seaborne markets both to fill voids left by domestic production shortfalls and to meet
specific quality requirements. China’s appetite for coal has grown as its economy has
flourished. China is now one of the leading global economies and is shifting its emphasis from
an industrial to a consumer-based economy. China imports coal primarily from Indonesia,
Australia and Russia; the U.S. has exported relatively little volume to China.5
India has likewise moved to increase access to electricity across the country but societal
and governmental mechanisms make this transition complex and slow. Seaborne coal is
assuming an increasing role in the electric power, steel, and cement and brickmaking sectors, in
part because of the poor domestic coal quality and in part because of the location of demand.
In addition to China and India, other Asian economies are moving toward coal to aid
economic growth, including Indonesia, Vietnam and Malaysia among others. Coal is viewed as
readily available and low-cost, thus ideal for reliable power generation. While South Africa has
long had a significant coal industry, other parts of Africa are also embracing coal to provide
stable low-cost power. Mozambique, in particular, has expanded its coal activities to include
increased production, port facilities and exports.
While demand in Asia and Africa continues to develop, coal consumption in Europe and
the Americas has peaked and is expected to decline because of the growing supply of low-cost
natural gas and renewables. Regulations are limiting the ability of energy consumers to use
coal in these regions, driven in large part by efforts to meet targets set by the United Nations
Framework Convention on Climate Change (UNFCCC). xxxiii However, sovereign energy security
concerns regarding an overreliance on natural gas have arisen in both the U.S. and Europe. If
this trend continues, the remaining coal fleet in both regions could be viewed from a different
lens. In Germany and Poland, for example, coal production and the power generated from this
coal have become crucial to their economic health.
Given the increasing importance of coal in Asia, it is not surprising that coal production
is also centered in Asia. China with its large coal reserves6 accounted for 46% of global
production in 2017.xxxiv Since China’s coal production is largely absorbed by its domestic
market, other exporters have stepped up to meet growing Asian coal demand. Producers in
Australia and Indonesia are geographically advantaged to fill this need, but supply constraints
from these countries, customer buying preferences and specific quality requirements
5 See Appendix E for data on international coal markets. 6 Coal reserves can be calculated in various ways as a fraction of the total coal resource. In this report, coal reserves sometimes reflect “total marketable reserves,” that portion of the indicated or measured reserve that is expected to be mined in the future over the life of each identified operating mine and project. Marketable reserve values can change significantly over time as the economics of the coal market change.

P A G E | 26
sometimes require or even favor coal produced in more distant regions, principally in the
Americas and South Africa. This is a trend that is expected to continue, and one for which
competitive advantages can be nurtured and enhanced.
Metallurgical Coal Trade
Global metallurgical coal production has remained relatively stable in recent years with
approximate 2017 production of over one billion tonnes. xxxv China is the world’s largest
metallurgical coal producer regularly accounting for about one-half of total global production. xxxvi Chinese production of metallurgical coal peaked in 2013 at over 650 million tonnes xxxvii but
has been subsiding since then and is now less than 550 million tonnes as China seeks to reduce
industrial overcapacity. Overall, metallurgical coal production is heavily concentrated.
Metallurgical coal production from top producers, China, Australia, Russia and the U.S.
consistently accounts for about 80-85% of total global metallurgical coal production. xxxviii The
U.S. is consistently one of the top five global metallurgical coal producers and exporters.
Metallurgical coal is consumed in many countries around the world. Unsurprisingly,
China is by far the largest global consumer, regularly accounting for two-thirds of global
consumption in recent years. xxxix Other major consumers include India, Russia, Japan, South
Korea and the U.S., the latter of which consumes just 2% of 2015 global metallurgical coal.
Despite their large domestic coal reserve bases, India and China remain large importers
of metallurgical coal seeking quality not available from domestic sources. Japan, South Korea
and Taiwan are large steel producers, but have no indigenous metallurgical coal for coke-
making and therefore import all their needs. Other, non-Asian steel producers in the Americas
and Europe are also significant metallurgical coal importers.
These importers seek defined metallurgical coal qualities at best available prices. The
largest importers are Asian, providing Asian suppliers that can meet quality requirements with a
competitive transportation advantage. Australia and Indonesia profit from this proximity
advantage. From its east coast, Russian suppliers also serve Asian markets, just as they also
serve markets in the European region. U.S. metallurgical coals also serve European and South
American markets, where transportation economics are favorable, and their quality
characteristics (i.e., high fluidity) make them attractive for use in certain metallurgical blends in
Asia, despite its transportation disadvantage.
Australian supply dominates Asian metallurgical coal import markets with additional
supply provided from Canada, Russia, Indonesia and the U.S. Australia and the U.S. share
dominance in European import markets, with additional supply sourced from Russia. In the
Americas, import supply is typically provided by Australia and the U.S., with Canada
contributing lesser amounts. Finally, given the size of its domestic market and reserve base,
domestic metallurgical coal in China must be considered a competitor to all exporters even
though it exports very little metallurgical coal. The need for high-quality, low-ash and high-CSR7
7 CSR – coke strength after reaction – is a metallurgical coal quality.

P A G E | 27
imported coal in China, as well as the policy decisions the country takes, can significantly
influence the import market and alter competitive market dynamics.
Thus, major direct competitors to U.S. metallurgical coal exporters are Australia, Russia
and Canada. These countries compete with the U.S. for the metallurgical coal trade market,
calculated to be between approximately 300 and 325 million tonnes in 2017xl. Over time,
Mozambique may develop as a major source. The supply into the export market is fungible and
can shift between sources. For example, to the extent Chinese import demand increases its
imports of Australian metallurgical coal, the markets for other sources into other countries
increase.
Figure 11: Metallurgical Coal Imports & Exports Share of 2017 global metallurgical coal imports by country/region, %
Share of 2017 global metallurgical coal exports by country/region, %
Note: The large majority of the approximately 300 to 325 million tonnes of imports are received via seaborne methods.
Note: The large majority of the approximately 300 to 325 million tonnes of exports are delivered via seaborne methods. Mongolian and some Russian exports are landborne.
Detailed descriptions of the metallurgical coal industry in countries that compete with
U.S. exporters are provided in Appendix F, which includes a brief description of marketable
reserves,8 general production and export position, coal quality, general infrastructure, and brief
notes on important fiscal and regulatory items for each country.
8 For purposes of this report, “marketable reserves” refers to the sum of production expected from mines into the long-term future. Any reference to actual costs or specific ranges of costs has been purposefully left out of this report.

P A G E | 28
Thermal Coal Trade
Globally, thermal coal production reached a peak in 2013 and has plateaued ever since.
Declining production and consumption in much of the western world is countered by growth in
Southeast Asia and the Indian sub-continent. Today, over 50 countries produce thermal coal,
many in small quantities, but the top seven thermal coal producers routinely account for about
85% of global production.
China is the world’s largest thermal coal producer, and even though its production is
declining somewhat, it still accounts for over 40% of 2017 global thermal coal production. xli
The list of largest thermal coal producers always includes India, the U.S., Indonesia, Australia,
Russia, South Africa and Germany. In 2017, the U.S. accounted for about 11%xlii of global
thermal coal production but its global share is declining rapidly as it cedes domestic energy
consumption market share to natural gas and renewables.
China is by far the largest global consumer of thermal coal, having accounted for well
over one-half of global consumption in 2017. xliii The top seven consuming countries in 2017
accounted for about 80% of total consumption. After China, other top coal thermal coal
consumers include India, the U.S., Germany, South Africa, Russia, Japan and Poland. The U.S.
share of global thermal coal consumption was over 9% in 2017.xliv
Economics and quality considerations encourage a lively import/export market for
thermal coal, which is three to four times the size of the metallurgical coal import/export
market. As is the case with metallurgical coal, India and China remain large importers of
thermal coal for quality and cost reasons. Having no domestic coal resource and being
dependent on imports, Japan, South Korea and Taiwan are also large thermal coal importers. In
2017, Germany and Turkey were the largest importers of thermal coal in the European region.
Combined, these seven countries regularly account for about three-quarters of all coal
imported in the world. The U.S. is a very minor importer of coal.
Thermal coal is available from many global sources with widely varying quality
characteristics. Indonesia (364 million tonnes in 2017) xlv and Australia (200 million tonnes in
2017) xlvi are the largest global thermal coal exporters. Given their proximity to the growing
Asian markets, Australian and Indonesian producers profit from their ability to deliver coal at
low cost. Russia is also a large thermal coal exporter and can deliver coal to Northeast Asia with
very low ocean freight costs, although its landborne transportation costs to port are very high.
Russian thermal coal is also delivered to multiple locations in the European region as well, by
both land and sea.
Colombia and South Africa are also large exporters of thermal coal. While both serve
global markets, Colombian coal is sold largely into Europe while South African coal is sold
largely into Asia. The U.S. always occupies a position in the top ten of thermal coal exporting
countries, although its shipment volumes can be quite variable given that it is often the a
marginal supplier to the global market. U.S. thermal coal exports, which were approximately 37
million tonnes in 2017, principally serve European markets and, when economics warrant,
markets in Asia. Lack of U.S. West Coast port capacity has hampered the ability of U.S. coals to

P A G E | 29
compete economically in Asia. Approximately 10 million tonnes of western U.S. thermal coal
was exported via Canadian ports to Asia in 2017.
Australian, Indonesian and South African suppliers dominate Asian thermal import
markets with additional supply from Russia and, when competitive economics are favorable,
from the Americas. In the European region, the import market is dominated by Colombia,
Russia, the U.S. and South Africa. In the Americas, import supply is typically provided by
producers in the Americas, with small amounts from elsewhere.
The major competitors for U.S. thermal coal exporters are market-dependent. In
Europe, the primary U.S. competitors are Russia and Colombia. Australia is a major competitor
in the Asian market. South Africa, because of its location, is a swing supplier between the
European and Asian markets. South Africa had been a major supplier to Europe until significant
growth in the Asian market made exporting to that market more attractive. The U.S. would be
a major competitor to Indonesia if additional exports of Powder River Basin coal to Asia were
realized given that many customers desire supply diversity, heightening the U.S.’s position as a
stable export supplier.
Figure 12: Thermal Coal Imports & Exports
Share of 2017 global thermal coal imports by
country/region, %
Share of 2017 global thermal coal exports by
country/region, %
Note: The large majority of imports are delivered via
seaborne methods.
Note: Nearly all exports use seaborne methods.
Kazakhstan exports are by land.
China
India
JapanEU-28
South Korea
Taiwan
Turkey
Malaysia
PhilippinesRest of world
Source: sxcoal, Reuters, OECD/IEA Coal Information: Overview(2018 edition), Wood Mackenzie
Indonesia
Australia
Colombia
South Africa
U.S.
KazakhRest of world
Source: OECD/IEA Coal Information: Overview (2018 edition), Wood Mackenzie

P A G E | 30
Descriptions of the thermal coal industry in countries that compete with U.S. exporters
are provided in Appendix G, which includes a brief description of marketable reserves,9 general
production and export position, coal quality, general infrastructure, and brief notes on
important fiscal and regulatory items for each country.
Competitiveness of U.S. Coal with Global Supply Coal purchasing is universally made on an evaluated delivered cost basis. The relative
economics of the alternative coal sources can and do change as a result of numerous factors
such as relative strength of the U.S. dollar, oil prices, unexpected events, geopolitical events
and freight markets. Using key factors, the advantages and challenges of U.S. metallurgical and
thermal coals relative to its major global competitors is summarized in the tables below. (See
Appendix H for a competitive assessment of U.S. coal exports vis-à-vis other coal supplier
nations.)
9 For purposes of this report, “marketable reserves” refers to the sum of production expected from mines into the long-term future. Note also that if general infrastructure and/or fiscal and regulatory items for Australia, Russia and the U.S. were already described in the metallurgical supplier section above. Any reference to actual costs or specific ranges of costs has been purposefully left out of this report.

P A G E | 31
Table 5: Advantages and Challenges of U.S. Metallurgical Coal versus Competitive Supply by Country
METALLURGICAL COAL
vs. Australia vs. Russia vs. Canada vs. Mozambique
Mine cost U.S. mine costs are
higher U.S. mine costs
are higher Mine costs are broadly similar
U.S. mine costs are lower
Quality
U.S. has limited premium low- &
mid-vol
Russia has very low sulfur coal
U.S. has limited premium low- & mid-
vol
U.S. has lower sulfur and ash
U.S. has abundant high fluidity, high-
vol & low ash
Low sulfur/high energy Russian PCI preferred in
Europe
U.S. has abundant high fluidity, high-vol
& low ash
U.S. has some expansion & CSR
issues
U.S. coking coal quality is superior
U.S. has some expansion & CSR
issues
Infrastructure and logistics
U.S. rail costs are higher
U.S. rail costs are lower
Rail costs are broadly similar
U.S. rail costs are lower
Government relations with rail
companies are better in the U.S.
Russia has winter rail disruptions
Port costs are higher in Russia
Ocean freight (OF)
U.S. OF is higher to Asia
U.S. OF is higher to Asia U.S. OF is higher to
Asia U.S. OF is higher to
Europe and Asia U.S. OF is lower in the Atlantic
U.S. OF is lower in the Atlantic
U.S. can't always load large vessels, although metallurgical coal consumers and producers usually favor Panamax vessels; dredging ports could be an equalizer, but at a cost
Security and regularity of supply
U.S. seldom has labor strikes
Russian winter can interrupt coal
delivery
Broadly similar - both high reputable
suppliers
U.S. political structure and infrastructure
dependable
U.S. hurricanes seldom interrupt
shipments
Russia in transition to
market economy U.S. has greater fiscal and regulatory
stability
U.S. has greater fiscal and regulatory
stability U.S. has greater
fiscal and regulatory stability
U.S. has greater fiscal and regulatory
stability
Shipment uniformity Broadly similar U.S. has better
quality control of shipments
Broadly similar - U.S. and Canada both
careful shippers that carefully manage
contracts
U.S. has better quality control of shipments
Note: Green shading indicates a U.S. advantage, red shading a U.S. disadvantage and blue shading a similarity.

P A G E | 32
Table 6: Advantages and Challenges of U.S. Thermal Coal versus Competitive Supply by Country
THERMAL COAL
vs. Australia vs. Indonesia vs. Russia Colombia South Africa
Mine cost U.S. mine costs
are higher PRB mine costs
are lower
U.S. mine costs are
higher
U.S. mine costs are higher
U.S. mine costs are higher
Quality U.S. sulfur levels are higher in the
ILB and NAPP
Broadly similar characteristics
(PRB) Russia has very low
sulfur coal
U.S. has higher energy content
U.S. has higher energy content
U.S. has occasionally high sodium content
(PRB)
Colombia has lower sulfur content, on
average
Infrastructure and logistics
U.S. rail costs are higher
Inland rail costs are higher in the
U.S.
U.S. rail costs are lower
U.S. rail costs are higher
S Africa has rail capacity constraints
Government relations with rail
companies are better in the U.S.
Port costs are higher in the U.S.
Russia has winter rail disruptions
Port costs are higher in
Russia
Ocean freight (OF)
U.S. has higher OF costs to Asian
markets U.S. has higher
OF costs to Asian markets
U.S. OF is higher to Asia
U.S. usually has higher OF costs
U.S. has higher OF costs U.S. has lower OF
costs to Atlantic markets
U.S. OF is lower in the
Atlantic
U.S. can't always load large vessels, although metallurgical coal consumers and producers usually favor Panamax vessels; dredging ports could be an equalizer, but at a cost
Security and regularity of
supply
U.S. seldom has labor strikes
Indonesia has fiscal instability
Russian winter can
interrupt coal delivery
The U.S. has greater fiscal and
regulatory stability
The U.S. has greater fiscal and
regulatory stability; there is a threat of domestic market
obligation in South Africa
U.S. hurricanes seldom interrupt
shipments
Indonesia has domestic market
obligation
Russia in transition to
market economy
U.S. has greater fiscal and
regulatory stability
Indonesia has checkered
delivery history
U.S. has greater fiscal
and regulatory
stability
Shipment uniformity
Broadly similar characteristics
U.S. has better quality control of
shipments
U.S. has better quality
control of shipments
Broadly similar - U.S. and Colombia
both careful shippers that
carefully manage contracts
Broadly similar - U.S. and South
Africa both careful shippers that
carefully manage contracts
Note: Green shading indicates a U.S. advantage, red shading a U.S. disadvantage and blue shading a similarity.

P A G E | 33
Trends in Export Coal Pricing
Seaborne coal markets have experienced numerous cycles over the past 10 years as is
typical for most commodities. The primary reason for the volatility has been the emergence of
Asia as an economic power, especially China and India. Market cycles have taken a toll on
prices and made long-term coal production planning difficult. Additionally, with global climate
initiatives, access to capital for needed investments in coal infrastructure has also become
more restricted.
Just before the Global Financial Crisis in 2008, thermal seaborne coal prices reached
$180 dollars/tonne ($163/ton) FOB vessel but in 2009, prices collapsed to close to $60/tonne
($54/ton). Prices recovered through 2011 but collapsed again to even lower levels through the
first half of 2016. At that time, the combined effects of China reducing production through
some overt policy measures and a multi-year capital diet for coal producers lead to an increase
in seaborne coal demand. Adding to the events were weather-related disruptions in Australia
and regulatory changes in India limiting petcoke10 supply. Prices have recently rebounded to
approximately $100/tonne.
Figure 13: Prompt Month API2 Thermal Coal Price History (2010-2018)
Source: Doyle Trading Consultants
Metallurgical coal has experienced similar market cycles for many of the same reasons,
but the magnitude of the price change has been much more pronounced. Again, policy changes
in China and India as well as less supply growth flexibility on the part of producers have resulted
in metallurgical coal prices that are close to $200/ tonne ($179/ ton) on an FOB vessel
Queensland, Australia basis.
10 Petroleum coke, or coke or petcoke, is a material that derives from oil refining and is one type of the group of fuels referred to as cokes.

P A G E | 34
Figure 14: Metallurgical Coal Price History
Source: Doyle Trading Consultants
In addition to market factors, global seaborne trade is subject to unexpected disruptions
caused by weather and changes in policy or economics. Australia provides a ready example of
the potential impacts of weather. Over the past 10 years, three cyclone events have disrupted
supply, especially for metallurgical coal. The most recent occurred at the end of March 2017
when Cyclone Debbie struck the Queensland coast. This event caused damage to numerous rail
lines serving the ports and cut into Australia’s exports by approximately 15 million tons
compared to calendar year 2016. This event has raised once again the need for supply diversity,
particularly for steel producers in Japan and South Korea.
Other examples include the harsh winter in the U.S. at the beginning of 2018 which
caused production, transportation and ship-loading delays. China has had weather-related
disruptions as cold weather has challenged natural gas availability for residential and
commercial heat which increased demand for coal-based power generation. Temperature
extremes, which can rapidly create a shortage or surplus in demand, also supports the need for
a robust seaborne market.

P A G E | 35
Exchange Rates & Price Indexes
Currency exchange is a significant contributing factor for global coal trade. Given that
global coal trade is U.S. dollar-denominated, valuation differences can have a meaningful
impact on both coal producers and coal consumers. The currency relationship of greatest
importance is that between the U.S. dollar and the Australian dollar because of Australia’s
dominance in both the export metallurgical and steam coal markets. As a result, when the U.S.
dollar is weak relative to the Australian dollar, global coal prices are higher and U.S. coal is more
competitive. Conversely, when the U.S. dollar is strong relative to the Australian dollar, global
prices are lower and U.S. coal becomes less competitive. Additionally, when the U.S. dollar is
strong and the Euro and/or Chinese yuan (RMB) are weak, importing U.S. coal is more
expensive versus domestic coal and power supply.
Also important to note is that exported coal is sold primarily based on U.S.-denominated
indexes and market participants, including producers and traders. Coal is sold both at the point
of origin (commonly known as FOBT, or FOB Terminal) where the customer arranges and pays
for transportation to the destination or on a delivered basis (commonly known as CIF, or Costs,
Insurance and Freight) where the seller arranges and pays for the transportation of coal to the
destination.
Figure 15: Relationship of U.S. Dollar to Australian Dollar, Euro and Chinese RMB
Source: EVA Databasexlvii
Effects of Policy on Global Coal Trade Other factors affecting coal trade patterns include policy directives, trade regulations
and trade agreements among nations. Policies include limitations or tariffs on certain types of
coal, regional rules that require a portion of supply goes to meet domestic needs, rules that
limit the transport of coal at certain hours of the day and rules that prevent development of
new infrastructure that can be used to move coal. Trade agreements, incentives and even
political posturing all influence coal trade.

P A G E | 36
Policy can be explicit, such as in China where directives from the Central Government
have been used to support its domestic coal industry. Directives can include specific limitations
regarding the number of days a miner can work, time of day and methods for coal
transportation, safety directives, environmental regulations and limits on which ports can and
cannot be used for transport of coal.
Similarly, in India, policies covering the mostly state-owned Coal India and its labor
unions and environmental performance have at times influenced coal imports. Recent
regulations to limit the use of high-sulfur petcoke have resulted in increased demand for
imported coal, particularly demand for higher calorific value coals that are closer to the heating
properties of petcoke. As high calorific value U.S. coals have increasingly gained acceptance in
markets traditionally served by petcoke (such as the cement kiln market in India as well as
cement kiln markets in other growing economies such as Africa), petcoke prices have also
become more relevant as a key driver of pricing and demand for U.S. thermal coal exports.
Policies that regulate the price of domestic electric power have also influenced trade in
India which has been advancing new policies to promote domestic supply with the intent to
eliminate imports completely by 2020. However, problems with domestic production and
transportation, and surging power demand have pushed demand for imports higher in 2018.
This has occurred concurrently with China’s increased purchasing and thus increased prices for
thermal coal during the first half of 2018.
National policies in Japan, South Korea and Taiwan have driven decisions to include coal
as part of a diversified energy portfolio. These countries are energy vulnerable, importing 96%
of their energy needs. They are seeking diverse, stable suppliers for energy security purposes
and plan to meet ~25%-30% of their electricity generation with coal.
Japan is investing in high efficiency coal technologies. Two new integrated gasification
combined cycle (IGCC) plants are underway which can be well served by PRB coals that have
chemical properties suited to IGCC technology. The trend for increasing reliance on thermal
coal plants is supported by the Japan’s Strategic Energy Planxlviii, which recognizes coal as “an
important baseload power supply because it involves the lowest geopolitical risk and has the
lowest price per unit of heat energy among fossil fuels.”
Trade policies can also be at issue. On April 26, 2017 British Columbia Premier Christy
Clark sent a letter to the Prime Minister of Canada, Justin Trudeau, requesting that the
Canadian federal government’s port regulator take steps to halt thermal coal exports through
ports in British Columbia. The letter appeared to be initially motivated by an increase in U.S.
tariffs on softwood lumber exports from British Columbia.
Finally, geopolitical influences also play a role. Trade embargos have shifted available
supply and disrupted markets. China’s embargo of coal from North Korea in 2017 is believed to
have shifted imports from North Korea to other supply sources. Tariffs, if imposed, could have
a similar effect.

P A G E | 37
Chapter 3. Barriers to U.S. Coal Exports
Key Findings – Chapter 3
The U.S. has abundant reserves of coal available to meet both domestic and international
market demand. Some existing and prospective Federal mineral ownership and mining
regulations may restrict development of U.S. coal reserves for export. Select government
initiatives at the Federal and state levels could provide support for continued production
in traditional U.S. coal supply regions and aid in expanding production in non-traditional
U.S. regions for coals in high demand overseas.
While U.S. East Coast terminal capacity is generally adequate, coal export economics
would improve with channel deepening to accommodate larger bulk carrier vessels. U.S.
Gulf Coast export terminals would benefit from improved dredging and maintenance of
inland waterways’ locks and dams. The limited capacity of export terminals on the U.S.
West Coast has significantly hindered the ability to export western U.S. coals for which a
market exists.
U.S. and international proscriptions denying or limiting banking and financial community
support for development of coal-fired facilities overseas restricts opportunities for U.S.
coal exports.
Increasing coal exports has the potential to improve the U.S. balance of trade and support
U.S. coal producers facing uncertainty in domestic markets. Trade policies and
agreements have the potential to either expand or restrict markets for U.S. coal exports.
U.S. coal exports have been very volatile over the years, ranging from a peak in 2012 of
125 million tons to a low of 39 million tons in 2002.xlix This volatility is attributable to many
factors, including fluctuations in market demand, competition from global suppliers and various
importing nation constraints, such as coal-import limiting policies and infrastructure.11 While
many of these variables are outside the control of the U.S. government and industry, there are
numerous other factors which can be addressed by policymakers and commercial interests to
enhance U.S. coal exports.
Supply Considerations There are ample reserves of U.S. coal to allow for higher exports. Regional
supply/demand considerations may limit what is immediately available to export versus what
can be developed for long-term export markets. The barriers to the development of U.S. coal
reserves for the export market are generally regional in nature. The most significant are related
to federal mineral ownership, mining regulations, support for traditional coal supply regions
and the development of non-traditional coal supplies.
11 See Appendix I for a graphic representation of U.S. thermal and met coal exports by destination.

P A G E | 38
Federal Mineral Ownership
The Federal government ownership of coal resources is concentrated in the western
U.S.l In 1920, the Mineral Leasing Act (the 1920 MLA) was enacted to establish governance for
coal and other minerals. Thereafter, development of Federal coal required a Federal coal lease.
The Bureau of Land Management (BLM) is responsible for ensuring the Federal government
receives fair market value when the leases are entered into and for administering the leases.
BLM’s authority is through the 1920 MLA as amended, the Mineral Leasing Act of 1947 (the
1947 MLA), as amended, and the Federal Land Policy Management Act of 1976 (FLPMA).
The Federal government receives three payment streams upon the leasing of Federal
coal – bonus payments, rents and royalties. The first two are paid independent of production.
Bonus payments are the amount paid to BLM to win a leasing contract.12 Rents are paid
annually on a per acre basis. Royalties are production taxes that are paid on a per ton sold
basis. The current royalty rates are 12.5% for surface coal and 8% for underground coal.13 As
the royalty rates are standard, it is the bid on bonus payments that determines whether and to
whom a property will be leased. BLM will only enter into leases when it deems the bonus
payment level is appropriate.14
During the prior Administration, a pause on Federal leasing was imposed and alternative
ways to apply royalty rates were under consideration, ranging from the rate applied to a market
price (rather than the actual price) to a rate based upon the delivered price to simply a higher
royalty rate (i.e., greater than 12.5% for surface mined coal and 8% for underground mined
coal). While the pause was withdrawn with the change in Administration and the discussions
on revising the royalty rates were abandoned, not surprisingly the possibility of such changes
could affect the ability and willingness of parties to fund investments in mine development and
expansions related to future exports.
Equally problematic are the challenges to the current practice of leasing Federal coal as
related to the use of logical mining units (LMU)15, the lack of transparency in how the BLM
determines whether a bonus payment is acceptable and the timing of the bonus payments.
In addition, the Federal government may need to revise its expectations for bonus bids –
the upfront payments companies make to acquire leases that allow for the mining of the coal.
These upfront payments – generally made years in advance of the commencement of mining –
represent a significant impediment to continued development of Federal coal reserves.
12 The bonus payment is paid effectively over a four-year period with the first payment upon selection and the remaining four payments on the annual anniversaries. 13 Parties can petition for lower rates for economic reasons. This does not occur often. 14 Producers do not believe there is sufficient transparency in the determination of whether the bonus payment is adequate. 15 A logical mining unit is an area of land in which coal resources can be developed in an efficient, economical and orderly manner as a unit with due regard to conservation of coal reserves and other resources.

P A G E | 39
Each new lease (or “lease-by-application” – LBA) is offered through a public auction in
which the high bidder acquires the right to mine the coal – with the caveat being that the bid
must meet the government’s fair market value (FMV) test for the lease. The BLM has the ability
to take recent market developments into consideration when it conducts its FMV calculation.
However, it is likely that future bonus bids will need to be far lower than historical levels given
the vast changes to domestic coal markets. It would behoove the BLM to consider these
significant changes – as well as the value of preserving ongoing Federal royalty payments, rents,
tax receipts and jobs – when analyzing what constitutes reasonable FMV today.
Moreover, other changes to the LBA system – such as revising the payment terms from
five equal, upfront payments to something more manageable for the coal industry – should be
considered. With permitting times lengthening, many mining companies may not realize
revenue from the lease prior to all five payments being due.
Mining Regulations
Mining regulations, like Federal leasing, can affect the competitiveness of U.S. coal
exports. The industry believed that the Stream Protection Rule would impair the ability to
surface mine in Appalachia and to use longwall mining technology throughout the U.S.; this rule
was repealed early in the Trump Administration under the provisions of the Congressional
Review Act. The specter of future such regulations imparts uncertainty for coal producers and
the investment community, potentially impairing the ability to mine economically.
Support for Traditional Coal Supply Regions
While the Appalachian metallurgical coal fields have been heavily mined for decades,
existing production could be expanded with selected government initiatives. For example, in
Virginia, Governor Northam recently signed into law a tax credit for metallurgical coal
production from thin-seamed underground mines and surface mines. For the underground
mines, the level of the tax varies with seam thickness.
Given the very sizable economic benefits provided by the coal industry in mining
communities and the challenges associated with justifying new investment in a marketplace
that is changing rapidly, states may benefit from offering a range of support mechanisms for
new mining investment. Absent a renewed tranche of investment in new mining capacity,
reserve degradation and depletion are likely to lead to a gradual erosion in U.S. mining activity
over time.
New investment, on the other hand, should enable the U.S. coal industry to continue to
compete on the global stage. This is particularly important given the fact that U.S. coal
producers are competing with international players that may be more proximate to the fastest
growing demand centers in Asia, or may be operating in a less rigorous regulatory
environment. In addition, huge recent investments in mine, rail and port capacity in some of
these countries may be providing a significant operating cost advantage that U.S. producers
must overcome.

P A G E | 40
Incentives could include tax credits or other mechanisms that reduce severance or other
forms of public payments related to new investments. In such a scenario, the state would still
achieve incremental revenues by incenting investment that would not otherwise occur.
Moreover, the state would benefit heavily from the new, high-paying jobs – both direct and
indirect – that would be created, as well as the many other economic benefits that would
result.
Development of Non-Traditional Coal Supply Regions
A significant share of the global demand for coal is metallurgical coal. With a limited
global supply base, the ability for the U.S. to expand its production of metallurgical coals
beyond the traditional supply regions would enhance the ability for U.S. coals to be exported.
By way of example, there are large metallurgical coal reserves in Oklahoma, Arkansas and
Alaska that have not been developed.16 All three states could develop high quality
metallurgical coal projects that would produce coal attractive to the international market if
appropriate infrastructure is concurrently developed.
Transportation & Shipping Considerations The nation’s coal transportation and shipping network would benefit from various
infrastructure improvements. It should be noted that the infrastructure improvements
highlighted in this report would also benefit industries in addition to coal, including agriculture,
manufacturing and other commercial industries dependent on a sound transport network.
U.S. East Coast
Terminal capacity on the U.S. East Coast is generally adequate. Efforts are underway to
deepen the Newport News channel to 55 feet and make other improvementsli which will
improve navigational efficiencies, allow safe passage of vessels in and out of the harbor, and
improve accommodation of the existing fleet. Similar opportunities exist at other eastern U.S.
ports; dredging and maintaining key shipping channels to accommodate large, more cost-
effective vessels and maximize navigational efficiencies would help to enhance the
competitiveness of U.S. coal exports.
Train availability is periodically an issue, particularly if shipments are not somewhat
ratable.17 Further, rail and terminal preference are generally given to higher value shipments,
i.e., metallurgical coals, which means steam coal exports may get short shrift.
16 Farrell-Cooper’s Bull Hill mine in Oklahoma was idled in 2017. 17 Ratable refers to a steady and/or predictable schedule of movements upon which the railroad can plan.

P A G E | 41
U.S. Gulf Coast
Coal exported through the U.S. Gulf Coast is either railed or barged. The railed coal goes
to one of the rail terminals where it is transloaded into ocean-going vessels. The barged coal
goes to one of the barge-served terminals where it is unloaded and then reloaded into ocean-
going vessels or loaded directly into an ocean-going vessel through mid-stream loading.
The rail terminals in the Gulf are adequate for current volumes. In addition, several can
be expanded if market conditions warrant. Train availability is periodically an issue, particularly
if shipments are not somewhat ratable.
The barge terminals combined with the mid-stream loading option is adequate for
current export levels. Mid-stream loading can be expanded to accommodate larger volumes if
market conditions warrant. Barging, or more specifically the maintenance of the inland water
system is more of an issue for coal exports through the Gulf than is terminal capacity.
The inland waterways transportation systems requires consistent maintenance.
Maintenance refers to both maintenance/modernization of the over 170 locks and dams and
maintenance of the channels. In 2014, the National Waterways Foundation released a study
performed by researchers at the Universities of Kentucky and Tennesseelii that analyzed the
economic impacts of preserving the current inland waterways transportation system and
expediting the construction of lock and dam modernization projects so that they would be
completed in 10 years rather than the current estimate of more than 20 years. The study
concluded that there were significant impacts associated with lock outages which could be
minimized by accelerating the modernization efforts.
The remaining major project affecting coal is the Olmstead locks, the last locks on the
Ohio River before it flows into the Mississippi River. Locks 52 and 53, which have consistently
been bottlenecks when water levels are low, are being replaced. Every ton of export coal
originating on the Ohio River which is barged to the U.S. Gulf will pass through this lock. Recent
data on the Olmsted Locks and Dam indicate this project will be completed in 2019.liii
While there are other lock and dam modernization projects that are important to the
inland waterways, for coal destined to the export market through the U.S, the projects of most
importance are those on the Ohio River, including modernization of the Greenup Lock and the
J.T. Myers Lock.
According to the industry, what has become an increasingly large issue for barging is
insufficient maintenance of the river channels. The lack of regular dredging has significantly
restricted movements on the inland waterways, a situation that is exacerbated during periods
of low water.
Dredging is also an issue with respect to the loading of vessels in the U.S. Gulf. The
Mississippi River is the maritime highway from the central portion of the U.S. Exports that
travel to the U.S. Gulf via the Mississippi River include coal, petroleum coke and agricultural
products. The ability to accommodate larger ocean vessels improves the competitiveness of all
of the products. Recent legislative attempts to direct the Secretary of the Army to dredge and
maintain a 50 foot deep navigational channel from Baton Rouge to the Southwest Pass sea
buoyliv have failed.
P A G E | 42
U.S. West Coast
The limited capacity of export terminals on the U.S. West Coast has greatly limited the
ability to export western coals. The non-U.S. West Coast options for western bituminous coals
include the U.S. Gulf (including direct rail to Houston), the Mexican port of Guaymas, and
possibly the Great Lakes (with transloading in Quebec).18 The alternatives have transportation
disadvantages compared to U.S. West Coast terminals in California which can only be overcome
with strong market conditions.
Powder River Basin coal exports are limited to the export terminals in British Columbia,
Canada (e.g., Westshore and Ridley), the Great Lakes (with transloading in Quebec), and the U.S
Gulf. While the market price will occasionally allow for these alternative transportation
options, none are efficient compared to having a coal terminal sited in the Pacific Northwest.
The Los Angeles area was once host to a 10 million ton transloading facility (referred to
as the LAX Terminal or LAXT). LAXT was decommissioned in 2001 when the expected
throughput volume did not materialize. While some nearby terminals have continued to
handle coal, the possibility of a larger terminal took hold when a local developer entered into
an agreement in 2013 to build a new shipping terminal on the old Oakland Army Base called the
Oakland Bulk and Oversized Terminal (OBOT). The agreement contained no prohibition
regarding coal throughput and the developer subsequently proceeded with plans to transload
up to 10 million tons of coal per year. The plan was put on hold when the Oakland City Council
passed a resolution that determined coal shipments were “a substantial danger to the people
of Oakland.” The developer appealed in 2016; a May 2018 ruling in favor of the developer
stated that the ban did not “contain enough evidence to support the conclusion that the
proposed coal operations would pose a substantial danger to people in Oakland.” The City
Council has appealed the decision.
The efforts to build the Millennium Bulk Terminals-Longview LLC (MBT-Longview
Terminal) in the Pacific Northwest have also been challenging throughout its six-year and
counting permitting process.19 The MBT-Longview Terminal is seeking to build a coal
transloading facility with an initial throughput capacity of 25 million tonnes with expansion
potential up to 44 million tonnes.lv As detailed in the following section of this report, despite
major accomplishments the timing to obtain permits remains uncertain. A state environmental
impact statement (EIS) concluded that the terminal met all environmental standards, yet the
State of Washington denied a water certification. The Federal Draft EIS was published in
September 2016 with similar conclusions but has not been finalized by the U.S. Army Corps of
Engineers.
The challenges encountered at Oakland and Millennium demonstrate the mountains
that must be scaled to move forward with new coal terminals that would enable increased
exports of western U.S. coals. 18 Montana bituminous coal is primarily exported through British Columbia. 19 The Millennium Terminal is the most likely terminal to move forward at this time. Permits were submitted in February 2012.

P A G E | 43
Funding
Funding for a number of the identified projects could be available from the Harbor
Maintenance Tax (HMT) which is a fee collected from users of the maritime transportation
system to fund U.S Army Corps of Engineers’ operation and maintenance activities.20 According
to the American Great Lakes Ports Association, about $1.6 billion is collected annually but
disbursement of the funds has been limited by Congress.lvi As of January 1, 2018, there was an
excess balance of about $9 billion in the HMT Fund.
The Water Resources Reform and Development Act of 2014 called for the full use of
HMT revenue and provided spending targets for the period between FY 2015 and FY 2025.lvii,lviii
The spending targets started at 67% of revenues and rose to 100% of revenues. For the first
three years, i.e., FY 2015 through FY 2017, Congress complied with the targets. The spending
targets are a minimum; nothing prevents higher spending targets.
In January 2018, the nation’s ports reached an agreement on the sharing of the annual
distribution. The agreement reportedly requires that 10% of the funds go to each of the six
port regions (North Atlantic, South Atlantic, Great Lakes, Gulf, Pacific Northwest and Pacific
Southwest) and 10% go to emerging harbors. This distribution can be changed.
Institutional & Regulatory Factors Barriers to Coal Export Terminal Development
As noted throughout this report, opportunities for U.S. West Coast coal exports to
supply high growth markets in Asia have been restricted due to a lack of port capacity. This led
to significant interest in the development of new export terminals, and a number of projects
have advanced to the proposal stage (see Appendix D for proposed U.S. West Coast terminals).
Each of these proposals underwent an exhaustive public review process marked by
intense activist opposition, unprecedented review requirements from regulatory and
permitting authorities, and lengthy judicial challenges that in some cases remain ongoing.
These complex and costly processes inject a high degree of risk and uncertainty that limits
capital investment in such projects and serves as a general barrier to development. They
therefore warrant further review to identify policy and process reforms that can reduce project
risks and uncertainties without compromising longstanding environmental protections.
The case of the Millennium Bulk Terminal proposal in Longview, Washington is
instructive in this regard. The nearly $700 million project, first proposed in 2012, would restore
an underutilized industrial facility to export up to 44 million tonnes of Powder River Basin coal
to markets in Asia. Review of the Millennium project centered on development of its
environmental impact statement (EIS). Led by the U.S. Army Corps of Engineers, a three-year
Federal review of the proposal culminated in an exhaustive draft EIS exceeding 3,000 pages in
length and attracting more than 3,000 public comments.lix
20 The U.S. Harbor Maintenance Tax (HMT) was enacted by Congress in 1986. The HMT is an ad valorem tax paid by the owner of the cargo. While the original tax applied to all cargo, in 1998 the Supreme Court struck down the taxation of export cargo as unconstitutional.

P A G E | 44
The Federal EIS studied potential impacts and mitigation measures related to a broad
range of issues – land use, aesthetics, cultural and tribal issues, geologic, hydrologic, and fish
and wildlife impacts, railroad and traffic issues, air quality, greenhouse gas emissions, and
more. Project developers spent more than $15 million on environmental studies supporting the
EIS, and committed to a number of measures to eliminate or mitigate potential adverse
impacts. Ultimately, while the draft Federal EIS was generally favorable toward the project,
because Federal and state authorities could not agree on a joint scope for the EIS, the
Washington Department of Ecology chose to undertake its own 13,500-page EIS for the
proposed project.lx,21
The final state EIS, released in April 2017, showed that the project could meet all
environmental standards. However, it concluded that a coal export terminal at Millennium
would result in “unavoidable and significant adverse impacts” that could not be mitigated in
nine different areas: social and community resources; cultural resources; tribal resources; rail
transportation; rail safety; vehicle transportation; vessel transportation; noise and vibration;
and air quality.lxi In September 2017, the Washington State Department of Ecology then cited
the EIS in denying a key water quality permit under section 401 of the Clean Water Act, in spite
of the fact that the EIS concluded there would be no measurable impact to water quality.lxii
These actions and others triggered a federal lawsuit against the state by project advocates that
remains in litigation.
Other proposed export terminals have faced a similar series of regulatory and
permitting barriers, and at least two – the Gateway Pacific Terminal and the Morrow Pacific
Project – have been cancelled as a result. While these examples illustrate that barriers to such
projects will always be significant, there are a number of ways that the federal government can
help facilitate a smoother review process that ultimately reduces project risks and
uncertainties.
Review and Permitting Process. In particular, the environmental review and permitting
process is unnecessarily slow and cumbersome. This barrier is not unique to coal export
facilities but rather tends to be common with major infrastructure reviews of all kinds. The
Trump Administration has taken positive steps to address these shortcomings, particularly as
they relate to implementation of the National Environmental Policy Act (NEPA). The
Administration has noted that, while NEPA remains a critical tool for ensuring sound
environmental decision-making, in the decades since its creation in 1970, project opponents
have increasingly sought to use review processes under the law to obstruct and block the
development of energy and infrastructure plans.
21 In October 2012, the U.S. Army Corps of Engineers, Washington Department of Ecology, and Cowlitz County agreed to collaborate on a joint National Environmental Policy Act (NEPA)/State Environmental Policy Act (SEPA) document for Millennium. Approximately 3 years later, due to a dispute over consideration of greenhouse gas emissions, state and local authorities chose to undertake their own environmental review.

P A G E | 45
Executive Order 13766 directed the White House Council on Environmental Quality
(CEQ) to begin efforts to address these shortcomings by identifying high priority NEPA projects
for expedited consideration. Follow-up directives such as Executive Order 13807 and a related
12-agency memorandum of understanding aim to reduce the length of federal environmental
reviews to not more than two years through improved coordination and accountability.lxiii,lxiv
Additionally, implementation and legislative codification of a number of policy reforms
detailed in the White House’s February 2018 Legislative Outline for Rebuilding Infrastructure in
America would help to address many of the aforementioned regulatory and permitting barriers
that have hindered development of coal export facilities.22 Specifically, recommendations
described in Parts 3 and 4 of the outline – Infrastructure Permitting Improvement – would
greatly reduce Federal barriers to coal exports. These recommendations include:
- Establish firm deadlines to complete environmental reviews and permits (3.I.A.1.)
- Require a single environmental review document and a single record of decision
coordinated by a lead agency (3.I.B.1.)
- Clarify that alternatives outside the scope of an agency’s authority or applicant’s
capability are not feasible alternatives (3.I.B.2.)
- Issue new CEQ NEPA regulations to increase efficiency, predictability, and transparency
in environmental reviews (3.I.B.3.)23
- Focus the scope of federal agency NEPA analysis on areas of special expertise or
jurisdiction (3.I.B.4.)
- Curtail costs by allowing for advance acquisition and preservation of rail rights-of-way
before NEPA is complete (3.I.B.8.)
- Create incentives for enhanced mitigation (3.I.B.13.)
- Eliminate redundancy, duplication, and inconsistency in the application of clean water
provisions (3.I.C.1.)
- Reduce delays for Clean Water Act Section 401 certification decisions and limit decisions
to be based on water quality (3.I.C.2.)
- Require timelines to be met under the Magnuson-Stevens Act or allow agency to
proceed with action (3.I.D.1.)
- Limit injunctive relief to exceptional circumstances (4.A.)
- Revise statute of limitations for federal infrastructure permits or decisions to 150 days
(4.B.)
22 Pages 36-51 of the outline are available at https://www.whitehouse.gov/wp-content/uploads/2018/02/INFRASTRUCTURE-211.pdf 23 On June 20, 2018, CEQ initiated a preliminary rulemaking seeking comment on potential updates to NEPA regulations. It is available at https://www.federalregister.gov/documents/2018/06/20/2018-13246/implementation-of-procedural-provisions-of-national-environmental-policy-act

P A G E | 46
Greenhouse Gas Emissions Considerations. Another area of significant attention is the
consideration of greenhouse gas (GHG) emissions in the review and permitting of coal export
facilities. Historically, the scope of NEPA reviews has been limited to potential impacts that are
“reasonably foreseeable” and the “proximate cause” of the proposed facility under review.lxv
Because GHGs associated with coal exported for overseas consumption are far removed from
the project under consideration, they have typically been considered to be beyond the scope of
the permitting process.
In recent years, however, a number of efforts to reverse this practice were initiated,
beginning with guidance proposed by the CEQ in 2014 directing agencies to consider mitigation
related to “life-cycle” GHG emissions upstream and downstream from the specific project
under review.lxvi This guidance was accompanied by a number a lawsuits challenging federal
NEPA reviews that did not address such emissions, as well as a similarly expanded approach at
the state level.
Prior to finalization of CEQ’s guidance in August 2016, treatment of indirect GHG
emissions was disparate across individual Federal agencies. In the case of the proposed
Millennium coal export terminal, the U.S. Army Corps of Engineers determined that such
emissions were beyond the scope of its NEPA review. However, the Washington State
Department of Ecology disagreed, instead proposing that project developers develop a GHG
mitigation plan that would offset up to two million tons of GHGs annually.24
In March 2017, President Trump issued an Executive Order rescinding the CEQ
guidance.lxvii However, confusion remains regarding the appropriate application of GHG
considerations in NEPA reviews, and a growing number of lawsuits involving energy
infrastructure projects have challenged the Administration’s position. Efforts to reduce project
risks and uncertainties associated with continued litigation and dissimilar approaches across the
Federal government would benefit from CEQ’s engagement to develop updated regulations or
guidance clarifying how agencies should address GHGs in NEPA scoping processes.
Aside from the question of whether GHG emissions upstream and downstream from
proposed projects warrants NEPA consideration, it is important to note that the impact of
expanded coal exports on GHG emissions remains a matter of open debate. For example, the
technical report accompanying Washington’s final EIS for the proposed Millennium terminal
found that when coal extraction activities are included, total net GHG emissions would
decrease by over three million tons annually.lxviii Moreover, preliminary conclusions of a 2017
analysis by Stanford University found that relaxing constraints of U.S. West Coast coal exports
24 “To address the potential impacts of greenhouse gas emissions attributable to the Proposed Action, the Applicant will prepare a greenhouse gas mitigation plan that mitigates for 100% of the greenhouse gas emissions identified in the 2015 U.S. and International Energy Policy scenario. For operations at maximum capacity this is 1.99 million metric tons CO2e per year from 2028 through 2038...carbon credits could be purchased through existing carbon markets, or through on-site reductions achieved through efficiency measures or changes in technology.” Section 5.8 of SEPA EIS, available at http://www.millenniumbulkeiswa.gov/assets/section_5-8_greenhouse_gas_climate_change2.pdf

P A G E | 47
would reduce global GHG emissions due to substitution effects in U.S. and foreign markets.lxix
The study also projected a reduction in local air emissions in China and India as a result of U.S.
coal displacing higher-sulfur and higher-ash foreign coals.
Export Facilities on Federal Lands. Because objections to export facilities are often driven by
fundamental and philosophical opposition to the production and use of coal, and given prior
examples of divergent approaches between the Federal government and state and local
entities, policy reforms recommended within this report may not be sufficient to reduce
uncertainties in a manner that enables projects to move forward. Further study is warranted
into the long-term potential to reduce export constraints through the development of export
terminals on Federal properties that would benefit from a streamlined and simplified review
and permitting process.
International Coal Plant Financing: Multilateral Development Banks
With more than 900 gigawatts (GW) of coal capacity placed into service worldwide since
2000, and over 600 GW planned or under construction, the potential for U.S. thermal coal
exports to supply steadily growing international demand is significant.lxx However, the inability
for the U.S. and Multilateral Development Banks (MDB) to support these projects may prevent
this potential from being realized.
In June 2013, President Obama announced that the U.S. would no longer provide public
financial support for construction of new coal-fired power plants overseas.lxxi The objective of
the President’s directive – which was announced as part of his Climate Action Plan – was to
limit GHG from coal-fired power plants.
This directive was implemented through Treasury Department guidancelxxii which
effectively directed U.S. representatives of Multilateral Development Banks (MDBs) to vote
against any such projects. Similar restrictions were adopted by the U.S. Export-Import Bank
(EXIM) lxxiii and the World Bank followed suit shortly thereafter, as did other entities such as the
European Bank for Reconstruction and Development and the European Investment Bank.lxxiv In
response to government and activist pressure, a number of commercial banks also adopted a
variety of restrictions.lxxv Similarly, while the Asian Development Bank did not institute an
explicit prohibition, it discontinued pursuit of most coal projects.
While it is difficult to quantify the impacts of these policies, they are likely significant.
Because many developing countries lack robust private capital markets, the importance of
government financing support through MDBs and other entities is particularly important. Even
minimal participation from such entities can help advance projects otherwise too risky for
commercial banks to finance on their own.
In response to the void created by U.S. and MDB funding prohibitions, China, Japan,
Korea and other countries stepped in to provide financial support for – and outsized influence
over – continued coal development. A 2017 IEA report found that China planned to provide up
to $72 billion in investment for new coal-fired power plants in developing countries.lxxvi
Similarly, Japan is investing $14 billion in new Indonesian coal-fired power plants.

P A G E | 48
Figure 16. Chinese Overseas Coal Power Financing Destinations
Source: Climate Policy Initiative, Herve-Mignucci & Wang, 2015
https://climatepolicyinitiative.org/publication/slowing-the-growth-of-coal-power-outside-china-
the-role-of-chinese-finance/
This funding is typically leveraged to influence related aspects of energy development in
recipient countries. For example, IEA reports that “a large proportion of equipment
procurement must come from companies shortlisted as preferred suppliers from the lenders’
country. By offering a one-stop-shop, China, Japan and Korean banks simplify the project
development and can be vital to a country under pressure to develop new generating
capacity.”lxxvii
These circumstances not only place the U.S. at a disadvantage by limiting the potential
for U.S. coals and plant technologies to meet supply international markets, in many cases they
result in inferior environmental controls. For example, between 2008 and 2016, China, Japan,
and Korea combined to supply over 55 gigawatts of less efficient subcritical boiler technology to
developing countries.lxxviii
According to the World Coal Association (WCA), a typical one gigawatt subcritical power
plant in Southeast Asia emits 1.2 million tonnes of additional carbon dioxide (CO2) annually
compared to a supercritical plant of equal size.lxxix By this metric, if the subcritical plants
supplied by China, Japan and Korea had instead used high efficiency, low emissions (HELE)
supercritical and ultra-supercritical boiler technology, annual CO2 emissions from those plants
would be nearly 66 million tonnes lower – an amount nearly equivalent to the total annual coal-
related emissions in countries such as Thailand and Brazil. These statistics illustrate that, to the
extent that U.S.-driven prohibitions on international coal plant financing have led to the
deployment of inferior coal plant technologies in developing countries, CO2 emissions have
increased as a result – precisely the opposite effect intended by their supporters.

P A G E | 49
Reversing these policies and restoring U.S. and MDB support for construction of new
coal power plants, therefore, not only holds promise to expand market opportunities for U.S.
coal exporters, it presents an opportunity to ensure developing countries have an opportunity
to deploy advanced CO2-minimizing HELE technologies, such as the Advanced Ultra Super
Critical power plants developed by the U.S. DOE/industry consortium, that they otherwise may
not be able to afford. In July 2017, the Trump Administration set the foundation for these
changes by rescinding the 2013 Treasury prohibition on financing construction of coal plants
internationally through MDBs, committing instead to “help countries access and use fossil fuels
more cleanly and efficiently.”lxxx
Unfortunately, financing prohibitions at most MDBs remain in place, in part because the
U.S. holds a minority position in those banks, and other leading countries maintaining
significant ownership positions remain opposed to a change in policy. (See Appendix J Coal
Financing Policies of Key International Lending Institutions) Nonetheless, U.S. influence
remains significant. For example, its 16% share of the World Bank constitutes a supermajority in
relation to other countries. Accordingly, the U.S. government could actively encourage MDBs,
both directly and through participating member countries, to resume financing coal plants in
developing countries. One potential opportunity exists at the Asian Development Bank (ADB),
which will soon begin a review of its energy and climate strategy.
Involvement of and guidance from the Trump Administration and Treasury Department
could significantly impact both the implementation of current policy as well as the development
of new policy at the ADB. In addition to Executive Branch actions, Congress maintains an
influential role in MDB policies by virtue of its funding for them through the appropriations
process, and thus could be an instrumental component of any reform effort.
One notable exception to MDB opposition to coal financing is the African Development
Bank, which continues to support all sources of energy as part of its effort to achieve universal
access to electricity in Africa by 2025. In July 2017, the African Development Bank announced
the Japan-Africa Energy Initiative, a partnership in which Japan will provide up to US$6 billion to
support expanded energy access in Africa, including access to clean coal technologies.lxxxi In
light of this supportive approach, the U.S. government could proactively engage with the
African Development Bank and leaders of African countries seeking to expand electricity access
in pursuit of similar partnerships. This effort should include reforms to the Power Africa
Initiative to allow coal-related projects to compete for financing aimed at supporting economic
growth and development throughout Africa.lxxxii
Another model for advancing financing mechanisms could be through bilateral
relationships. In 2017, the U.S. and Japan launched the Japan-United States Strategic Energy
Partnership (JUSEP) under the framework of the Japan-U.S. Economic Dialogue.lxxxiii The core
principles of JUSEP are to ensure energy security and universal access to affordable and reliable
energy in order to eradicate poverty, including through the deployment of HELE coal
technologies. This program, focused on Southeast Asia, South Asia and Sub-Saharan Africa,
holds significant promise. It should continue to be a priority and the U.S. should aim to
incorporate JUSEP’s core principles into similar bilateral efforts.
P A G E | 50
More recently, in November 2017, a group of 36 national and subnational governments
joined to launch the “Powering Past Coal Alliance,” which among other things, committed to
restricting financing for coal-fired power plants.lxxxiv Many of these governments are
shareholders in MDBs, and collectively exert significant influence over coal-related MDB
policies. In response, the Trump Administration is preparing to lead the formation of an alliance
to counter those policies and work to advance energy access and security through responsible
use of advanced fossil fuel technologies. Continued development and operationalization of this
concept may be a means through which to leverage policy changes at MDBs and related
financing entities.
International Coal Plant Financing: Domestic Entities
A number of domestic entities also have a potential role in supporting continued
development of coal-fired power plants overseas. These are discussed below.
Export Import Bank of the United States. The Export-Import Bank of the United States (EXIM Bank) is
the official export credit agency of the U.S. government. Its mission is to support American jobs by
providing working capital to facilitate the export of U.S. goods and services. Historically, energy
resources, including coal exports and overseas coal-fired power plants were an important part of the
bank’s portfolio.25 In 2013, however, the EXIM Bank adopted guidelines prohibiting support for
projects associated with coal mining or electricity generation except in rare circumstances.lxxxv The
Bank followed this policy by leading a coalition of international export credit agencies to sign an
agreement under the OECD committing to the same prohibitions.26
While Congress has acted to block funding for the EXIM Bank’s 2013 prohibition on
support for coal projects, and the Trump Administration has indicated it intends to reverse the
decision administratively, the Bank has remained largely dormant since 2015 due to the lack of
a quorum needed to approve major projects and policy changes. Prioritizing the fulfillment of
the EXIM Bank Board will allow the agency to realign with the Administration’s official Treasury
Department guidance, grant new coal exporters access to the EXIM Bank financing and allow
existing exporters to increase their financing facilities, thus supporting the growth of U.S. coal
exports.
25 Most recently, in 2012, EXIM provided a $90 million loan guarantee to support East Coast coal exports. 26 Participating countries included Australia, Canada, the EU, Korea, Japan, New Zealand, Norway, Switzerland, and the U.S. http://www.oecd.org/newsroom/statement-from-participants-to-the-arrangement-on-officially-supported-export-credits.htm

P A G E | 51
Overseas Private Investment Corporation. The Overseas Private Investment Corporation (OPIC) is
charged with mobilizing private capital to help foster economic development in emerging economies,
and in doing so, advance U.S. foreign policy objectives. While perhaps lesser known, OPIC’s
importance in international finance and economic development is significant. According to the
agency, it has supported more than $200 billion of investment in over 4,000 projects, generated an
estimated $75 billion in U.S. exports and supported more than 277,000 American jobs.
While OPIC’s mission and focus makes it well-suited for supporting foreign policy
objectives by enhancing opportunities for U.S. coal exports, in 2009, a legal settlement with
non-governmental organizations committed OPIC to a cap on greenhouse gas emissions from
its portfolio of investments that was then codified by Congress in appropriations legislation
later that year.lxxxvi According to OPIC’s most recent environmental and social policy guidance
issued in January 2017, the agency has committed to reduce GHGs associated with its portfolio
by 50% over a 15-year period (2008-2023).lxxxvii As a practical matter, these restrictions have
effectively barred OPIC from supporting coal-related projects.
Of note, Congress is currently considering important reforms to OPIC and related
international development assistance programs. The “Better Utilization of Investments Leading
to Development Act of 2018, or “BUILD Act,” would create a new International Development
Finance Corporation to assist developing nations efforts to realize broad-based economic
growth and poverty reduction.lxxxviii This legislation has bipartisan support in Congress and the
White House has signaled its backing as well. Given the central importance of electricity access
to achieving these goals, joint efforts by Congress and the Trump Administration would help
ensure that projects authorized by the BUILD Act explicitly allow development and use of all
energy resources, including coal.
U.S. Agency for International Development. The U.S. Agency for International Development (USAID)
is an independent federal agency charged with furthering America's interests while improving lives in
the developing world. Africa is a major focus area of USAID, and in 2013, President Obama launched
the Power Africa initiative, a public-private effort led by USAID and aimed at increasing electricity
access in sub-Saharan Africa.lxxxix Working with program partners such as EXIM Bank, OPIC and the
Millennium Challenge Corporation, the goal of Power Africa is to establish 60 million new electricity
connections powered by “30,000 megawatts of new and cleaner generation.”xc
To date, Power Africa has helped 90 projects comprising nearly 7,500 megawatts move
forward. While the initiative does not include an explicit prohibition on support for coal-related
projects, an August 2016 report to Congress stated that the program “adheres to the policy
articulated in President Obama’s Climate Action Plan” pertaining to a ban on international
support for coal-fired power plants, and the program’s current Roadmap states its intent to
“prioritize economically viable renewable energy transactions where possible, but also focus on
non-renewable projects with lower carbon emissions, such as natural gas.”xci,xcii

P A G E | 52
The Trump Administration has continued support for the program and its goals, but in
March 2018 launched “Power Africa 2.0,” which expands electricity access targets and commits
to improving distribution and transmission infrastructure as well.xciii Publicly available
information on the modified initiative does not appear to address the eligibility of or emphasis
on coal-related projects.
U.S. Trade and Development Agency. The U.S. Trade and Development Agency (USTDA) is an
independent Federal agency that helps companies create U.S. jobs through the export of U.S. goods
and services for priority development projects in emerging economies. Specifically, USTDA aims to
link U.S. businesses to export opportunities by funding project preparation and partnership building
activities. The energy sector is a priority focus of USTDA. In May 2018, it announced a reverse trade
mission with India, Indonesia and Vietnam focused on coal-fired emissions control technologies.xciv
Foreign delegates participating in such meetings gain an opportunity to build relationships with U.S.
industry representatives that can be developed into longer-term trade partnerships.
Similarly, USTDA is soliciting applications for proposals aimed at facilitating the
development of cleaner coal infrastructure projects overseas. According to USTDA, this effort
hopes to build upon prior agency successes in markets such as Namibia, where a USTDA-funded
study led to environmental and performance upgrades of a coal-fired power plant that the
country relies on for affordable and reliable electricity.xcv It would be beneficial for these USTDA
activities to be continued and expanded.
Table 7. U.S.-based entities with a role in coal financing and export development.
Bank/Entity Support Mechanisms Coal Status/Policy
Export-Import Bank
(EXIM Bank)
Project finance, loan
guarantees, export credit
insurance for U.S. exporters
2013 guidelines prohibit support for projects
associated with coal mining or coal-powered
electricity generation
Overseas Private Investment
Corporation (OPIC)
Direct loans, loan guarantees,
investment funds
Cap on project GHG emissions effectively serves
as prohibition on coal-related projects
U.S. Agency for International
Development (USAID)
Strategy development,
partnership building, technical
assistance
No explicit policy, but coal not included among 90
projects supported through USAID-led Power
Africa initiative
U.S. Trade and Development
Agency (USTDA)
Partnership building, reverse
trade missions, studies
No restrictions on coal; funding coal-focused
reverse trade missions and soliciting applications
related to clean coal infrastructure projects

P A G E | 53
Energy Access, Poverty Elimination and Energy Security
Continued growth in global demand for coal-fired power originates with developing
countries’ prioritization of economic growth and alleviation of energy poverty. In fact, this is the
central purpose of developed countries’ historical support for construction of new coal plants,
and it has proven undeniably successful. According to the IEAxcvi, 1.2 billion people gained
access to the electricity grid between 2000 and 2017. Coal-fired power comprised 45% of this
electrification, providing affordable energy to 540 million people (often through MDBs and
other government-backed financing mechanisms that have since imposed prohibitions on
support for coal-powered electricity access).
It is difficult to overstate the contributions of this electrification to human health and
well-being in these developing countries. Modern life is inconceivable without adequate access
to electricity. Electricity makes life easier and healthier, improving nutrition and freeing time for
other productive pursuits. It makes modern education and medicine possible. It is critical to
reducing infant mortality and undernourishment. It helps provide adequate supplies of clean
water for people and crops. It makes agriculture more efficient through mechanization and
affordable fertilizers. It makes people more mobile. And it connects them to a broad array of
information through various communication technologies that all run on electricity.
That importance continues today. As of 2016, an
estimated 1.1 billion people still live without access to
electricity – between one-seventh and one-eighth of the global
population.27,xcvii By 2030, IEA projects that nearly 400 million
of these people will gain access, in large part due to new coal-
fired power plants, to over 600 gigawatts of electricity which
are currently planned or under construction around the world.
Accordingly, direct and indirect U.S. government support for
financing this electrification would not only advance
longstanding economic development and humanitarian
objectives but also serve to enhance diplomatic and trade
relationships that could enable new partnerships to expand
U.S. exports of thermal coal.
27 IEA defines electricity access as a minimum of 250 kilowatt hours (kWh) per year for rural households (of five people) and 500 kWh per year for urban households. “In rural areas, this level of consumption could, for example, provide for the use of a floor fan, a mobile telephone and two compact fluorescent light bulbs for about five hours per day. In urban areas, consumption might also include an efficient refrigerator, a second mobile telephone per household and another appliance, such as a small television or a computer.” International Energy Agency, 2014. Defining and modelling energy access. World Energy Outlook. Available at: http://www.worldenergyoutlook.org/resources/energydevelopment/definingandmodellingenergyaccess/.
“The importance of coal in the
global energy mix is now the
highest since 1971. It remains
the backbone of electricity
generation and has been the fuel
underpinning the rapid
industrialization of emerging
economies, helping to raise
living standards and lift
hundreds of millions of people
out of energy poverty.”
Fatih Birol, IEA Executive
Director

P A G E | 54
The importance and value of such efforts may be best exemplified by prior missed
opportunities. For example, a 2015 analysis by George David Banks of the American Council on
Capital Formation described the implications of U.S. opposition to a clean coal plant in
Pakistan:xcviii
“This shift was best exemplified in December 2013 when the United States – albeit
unsuccessfully – opposed Asian Development Bank (ADB) funding for a supercritical
coal-fired plant in Pakistan. In overcoming U.S. disapproval, ADB officials claimed
that the power plant would help address acute power shortages of up to 20 hours
per day and save the Pakistani economy $535 million by replacing imported oil with
coal. Power shortages cost the Pakistani economy an estimated 2% of its annual
economic growth….Blocking funding to the plant would have reduced Pakistan’s
access to affordable power that is needed for job creation, increasing the odds of
political instability – a risk that the United States should seek to reduce, particularly
given Pakistan’s nuclear weapons stockpile.”
In addition to highlighting the importance of energy access to broader U.S. geopolitical
interests, this example also serves to remind that enhancing the energy security of allied
nations presents similar diplomatic opportunities around the world. We have already seen the
impact of U.S. liquefied natural gas (LNG) exports as a potential antidote to geopolitical
meddling in energy markets. Expanded U.S. coal exports could play a similar role.
Ukraine, for example, faces energy
security challenges related to disputes with
Russia over critical natural gas deliveries as
well as coal supply uncertainties stemming
from Russian-backed separatists contesting
the eastern portion the country (the source
of most coal production). In July 2017, the
government of Ukraine awarded Pennsylvania-based Xcoal Energy a contract to supply its state-
owned power generation company with 700,000 tons of coal. The partnership, which was
facilitated by the U.S. Department of Energy (DOE) and U.S. Department of Commerce (DOC),
illustrates the potential for U.S. political leadership to enhance allies’ energy security while also
providing a boost to the domestic coal industry.xcix Administration efforts to leverage diplomatic
relationships would help identify and facilitate similar partnership opportunities elsewhere
around the world.
“Ukraine already tells us they need millions and millions of metric tons right now. There are many other places that need it, too. And we want to sell it to them, and to everyone else all over the globe who need it.” President Trump, June 2017

P A G E | 55
Trade Barriers
As detailed throughout this report, increasing coal exports has the potential to improve
the U.S. balance of trade while also providing a boost to coal producers facing uncertainty in
domestic markets, both of which are key priorities of the Trump Administration. In addition to
the aforementioned barriers that indirectly limit the potential to advance exports, there are
numerous trade-specific challenges and opportunities that must be considered and addressed.
First and foremost among these are opportunities to elevate coal exports specifically as
part of trade negotiations and international trade development efforts. The case for U.S. coal is
strong – it provides a high-quality, reliable and competitive source of supply that can also
provide market diversity and an energy security hedge for importing countries. It is also a
volatile subject in broader ongoing trade negotiations. For example, in the span of just two
weeks in June 2018, China reportedly first offered to increase its imports of U.S. coal in an
effort to reduce its $375 billion trade surplus with the U.S., then promptly reversed course and
included coal on a list of potential retaliatory tariffs issued in response to $50 billion of Trump
Administration tariffs on Chinese goods.c On August 8, 2018, China’s Ministry of Commerce
announed that it would proceed to impose a 25% tariff on $16 billion worth of U.S. imports,
including coal.ci
This rapid turn of events illustrates how escalating trade tensions are a serious concern
that could result in significantly restricted markets for U.S. coal. In addition to China, a number
of other countries have initiated retaliation measures to U.S.-imposed tariffs on steel and
aluminum imports, and at least one – Turkey – has included coal among the list of targeted U.S.
products.cii Amidst escalating tensions, on August 15, 2018, Turkey raised the level of its coal
tariffs from 10% to 14%. Moreover, beyond specific barriers such as tariffs, the general ongoing
friction on trade issues threatens to reduce the willingness of U.S. trade partners to enter into
agreements to buy U.S. energy resources.
Meanwhile, a number of key markets have long imposed unfair tariffs on U.S. coal
imports. For example, Indonesia places a 5% tariff on imports of U.S. coal, while China places
6% and 3% tariffs on U.S.-based thermal and metallurgical coal, respectively.ciii These artificial
costs exacerbate the geographical disadvantage of U.S. coal exports to Asia and impact the
competitiveness of deliveries to the region, especially from the East Coast. U.S. government
efforts to reduce or eliminate these tariffs would facilitate increased coal export opportunities.
Ultimately, while the potential for current tensions to negatively impact U.S. coal is high,
heightened attention to global trade issues also presents an opportunity for U.S. negotiators to
expand market access for U.S. coal. Efforts by the DOE, U.S. trade negotiators and diplomatic
officials to actively encourage such purchases and undertake dedicated steps to identify and
pursue bilateral and multilateral opportunities throughout the world would also facilitate
opportunities for expanded U.S. coal exports.
P A G E | 56
Technological Considerations
Technological Improvements in Mining.28 Another important consideration on the supply side
is ensuring that the industry is keeping up with the potential technological improvements in
mining and preparation that would allow U.S. producers to better compete with other
producing countries. The coal industry has been challenged in recent years due to adverse
market conditions and high debt levels. Producers accounting for about 40% of total coal
production went through bankruptcy in the last four years. Demand in 2017 was over 20%
below demand in 2012. Not surprisingly, capital expenditures declined during this period.
The industry has identified areas where it can reduce operating costs with capital
investments. In the PRB, for example, a move to driverless vehicles has started. In Pittsburgh
seam mines, producers have incorporated advanced technology into their longwalls and are
now focusing on extending advanced technology to continuous miners which account for a
major share of the labor and costs in both longwall and room-and-pillar mines. Many future
advances could take advantage of state-of-the-art digital technology, including consolidated
data platforms, real-time analytics and optimization, advanced control systems, artificial
intelligence and machine learning, and predictive maintenance to improve decision making and
reduce downtime across the many interdependent processes involved in a mining operation.
Advances can be achieved in most supply regions. Since innovation is capital intensive, Federal
support would accelerate technology integration.
Coal Washing and Upgrading. Coal washing and upgrading technologies are designed to reduce
the amount of mineral matter and/or moisture in coal, which can be particularly important for
coal slated for export. Transporting coal with a higher heat content could reduce transportation
costs on a quality adjusted evaluated basis – improving the value proposition for some U.S. coal
compared to the international market. In addition, reducing the ash, sulfur and mercury
content may also allow U.S. coal to be increasingly competitive in some markets where lower
impurities is an attribute that is highly valued. Although coal washing and upgrading
technologies are being used globally, further technological improvements may be possible with
additional research and development. One potential example would be the development of
technologies that could increase the heat content of Powder River Basin coal, especially if
export opportunities are expanded.
28 The forthcoming (Sept. 2018) National Coal Council report, “Power Reset: Optimizing the Existing Coal Fleet” includes a more expansive discussion on improving the cost-competitiveness of U.S. coal through advances in coal mining and production technologies. See NCC website www.NationalCoalCouncil.org.

P A G E | 57
Exports of U.S. Advanced Coal Technologies. Some international markets for U.S. coals are
restricted or could become restricted due to coal quality constraints or lack of environmental
technologies/controls at end-user facilities. For example, some higher-sulfur coals from the
Eastern U.S. (NAPP, ILB) are limited/excluded from certain Asian and European markets
because of sulfur constraints. Growing Asian markets are increasingly recognizing the need to
control emissions but still have a number of unscrubbed/uncontrolled power plants, precluding
the use of certain U.S. coals.
While it is beyond the scope of this report, it would be beneficial to continue U.S. efforts
to research, develop and deploy advanced coal technologies that could be retrofit to existing
plants and/or adopted in new plant construction that would enable other nations to make use
of a wider range of U.S. coals. For example, installation of state-of-the-art, commercially
available emissions controls, such as sulfur dioxide (SO2) scrubbers, would enable fuel sulfur
limits to be modified thus enabling a wider range of coals to be used with an accompanying net
reduction in SO2 emissions.
A number of nations, including China, India and Japan, are deploying HELE coal plants
employing Advanced Ultra Super Critical technologies. The opportunity exists for the U.S. to
pursue technology exchanges with these nations as part of its efforts to develop and adopt
advanced coal technologies in the U.S. and abroad, enhancing markets for U.S. coals in the
process.

P A G E | 58
Chapter 4. Conclusions & Recommendations
Global demand for coal-fired power is driven in large part by developing nations’ efforts
to grow their economies and alleviate energy poverty. The Trump Administration has
emphasized its interest in unlocking U.S. energy and coal export potential to service rising
international market demand and aid its global partners in their quest to end energy poverty
and advance energy security. Unleashing U.S. coal exports will advance both U.S. and global
energy security objectives.
The primary strategic objective recommended by the National Coal Council is to
advance U.S. coal exports as part of the nation’s efforts to achieve U.S. energy dominance,
enhance international energy security and eliminate global energy poverty. This report
provides recommendations in support of these objectives in the areas of coal production,
transportation, trade and international relations, and regulatory reform. Executing these
recommendations will result in a more robust role for the U.S. in global coal trade, providing
economic benefits to the U.S. as well as economic, environmental and social benefits to our
trading partners.
To facilitate execution of the recommendations in this report, NCC recommends
establishing a DOE-led, government-wide Coal Exports Task Force (or Energy Exports
Coordination Task Force) to monitor and coordinate policy developments relevant to advancing
coal exports. Participants should include all agencies engaged in energy development and
international relations, including the U.S. Departments of Energy, Interior, State and Treasury,
as well as USTDA, OPIC and the EXIM Bank, among others.
___________________________________
The competitiveness and growth of U.S. coal exports depends primarily on the ability of
U.S. producers to mine and ship coal to end-use markets at an overall evaluated delivered cost
that is economically competitive vis-à-vis other global coal suppliers and vis-à-vis other energy
sources29. Numerous opportunities exist to enhance the competitiveness of U.S. coal exports at
every link in the coal supply chain and by addressing various trade and regulatory barriers.
NCC’s primary strategic recommendations are:
Coal Production. Deploy advanced coal mining and processing technologies to reduce
production costs, thus making U.S. coals more competitive in international markets.
Enhance U.S. coal mining operations with the greatest export potential in both traditional
and non-traditional coal supply regions.
River Transport. Streamline the funding to the nation’s inland waterway system locks and
dam infrastructure to facilitate the cost-efficient flow of U.S. coals to international markets
via U.S. East and Gulf Coast ports.
29 Such as LNG, petroleum coke, etc.

P A G E | 59
Ports & Terminals. Enhance coal export port and terminal capacity on the U.S. Atlantic,
Gulf and Pacific coasts.
Trade and International Relations. Eliminate policy and technology barriers to the
deployment of advanced coal facilities in international markets. Additionally, capitalize on
trade opportunities, assessing policies and approaches that inhibit or promote U.S. trade
and U.S. coal exports.
Economic Development in International Markets. Support efforts to advance economic
growth in international markets and the global development of advanced coal technologies,
as well as the elimination of regulatory and institutional barriers to the deployment of coal-
fired facilities worldwide.
NCC recommends the following tactics be employed to achieve these strategic objectives.
Coal Production
Strategic Objective 1: Deploy advanced coal mining and processing technologies to reduce
production costs, thus making U.S. coals more competitive in international markets.
Recommended Tactics:
Support research and development (R&D) initiatives to develop more efficient mining
technologies to reduce the cost of extracting coal. Initiatives for new production-enhancing
technologies in coal mining should include automation, robotics, big data/advanced
computing, machine learning/artificial intelligence, and remote mining technologies.
Support R&D to develop advanced coal preparation and upgrading technologies – such as
coal fines/waste coal recovery and coal drying/coal beneficiation – to increase coal heat
content30, remove impurities and lower costs.
Strategic Objective 2: Enhance U.S. coal mining operations with export potential in both
traditional and non-traditional coal supply regions.
Recommended Tactics:
States may benefit from offering a range of support mechanisms to induce continued
mining activity. One such initiative was undertaken by the State of Virginia whose
legislature passed tax credits for metallurgical coal production from thin-seamed
underground mines and surface mines. Tax credits that reduce severance or other forms of
public payments associated with investment in new mining capacity might also prove
effective and could well be revenue positive when applied appropriately.
Identify and support infrastructure projects in non-traditional coal supply regions, including
Oklahoma, Arkansas and Alaska.
Eliminate barriers to production of coal on Federal lands associated with bonus payments,
rents and uncertain royalty payments.
Assess any future mining regulations, such as the Stream Protection Rule repealed by the
Trump Administration, to determine their impacts on U.S. coal exports.
30 Heat content is measured on a Btu per pound (Btu/lb) or on a kilocalorie per kilogram basis (kcal/kg).

P A G E | 60
River Transport
Strategic Objective: Streamline the funding to the nation’s inland waterway system locks and
dam infrastructure to facilitate the cost-efficient flow of U.S. coals to international markets
via East and Gulf Coast ports.
Recommended Tactics:
Support regular maintenance and dredging of inland waterway river channels to ensure
non-restricted movements of coal barge traffic especially during period of low water.
Deploy funds from the current excess balance of fees collected from the Harbor
Maintenance Tax and support efficient funding levels from the Inland Waterways Trust
Fund to maintain and modernize inland waterway locks and dams, specifically those on the
Ohio River as is being done with the Olmstead Locks and Dam projects.
Ports & Terminals
Strategic Objective: Enhance coal export port and terminal capacity on the U.S. Atlantic, Gulf
and Pacific coasts.
Recommended Tactics:
Dredge key export ports and ship channels to accommodate larger vessels – such as
Capesize and Baby Capes – thereby lowering shipping costs and enhancing the delivered
economics of U.S. eastern and interior basin coals in international markets.
Facilitate improved planning and cooperation between state and Federal authorities
responsible for environmental review and permitting of proposed projects, limit state
misuse of such processes aimed at challenging exports of U.S. produced goods.
Undertake further study to assess the potential to reduce export constraints through
development of export terminals on Federal properties.
Identify and analyze bottlenecks and infrastructure upgrades at existing export terminals
and assess opportunities to address logistical constraints to enable optimal utilization of the
U.S. coal export transportation system (rail, waterway, port).
Advance comprehensive reforms to NEPA and related permitting processes, including
relevant proposals described in Parts 3 and 4 of the Infrastructure Permitting Improvement
portion of the White House’s February 2018 Legislative Outline for Rebuilding Infrastructure
in America.
Clarify the application of GHG considerations in NEPA reviews associated with development
of U.S. coal export facilities. Engage CEQ to develop updated regulations or guidance
clarifying how agencies should address GHGs in NEPA scoping processes.
P A G E | 61
Trade & International Relations
Strategic Objective 1. Eliminate policy and technology barriers to the deployment of
advanced coal facilities in international markets.
Recommended Tactics:
Reform Export-Import (EXIM) Bank of the U.S. policies and guidelines to allow support for
projects associated with coal mining or high efficiency, low emissions (HELE) coal
generation. Finalize appointments to the EXIM Bank board to facilitate reforms.
Revise Overseas Private Investment Corporation (OPIC) and U.S. Agency for International
Development (USAID) policies to allow for support for coal generation projects using HELE
technology.
Reassess U.S. policy prohibiting public financial support for construction of coal power
plants overseas instituted under the Obama Administration and implemented through the
U.S. Treasury Department (Multilateral Development Banks). These policies put the U.S. at
a disadvantage as other nations step in to fill the financing void and secure lucrative
contracts for fuel supplies, technology, equipment and operations. Restore U.S. and MDB
support for construction of HELE coal power plants in international markets.
Promote installation of state-of-the-art, commercially available emissions controls on
international coal-fired facilities to expand opportunities for more varied qualities of U.S.
coal to be exported.
Work with key end-use nations to make the technical and economic case that new power
plants should be designed for a wide range of coal qualities.
Strategic Objective 2. Capitalize on trade expansion opportunities, assessing policies and
approaches that inhibit or promote U.S. trade and U.S. coal exports.
Recommended Tactics:
Pursue opportunities to expand market access for U.S. coal through the reduction or
elimination of trade barriers, while avoiding escalation of barriers that could conversely
result in reduced access to markets.
Support U.S. Trade and Development Agency (USTDA) initiatives to advance exports of coal
and advanced coal technologies through development of cleaner coal infrastructure
projects overseas.
Proactively engage with the African Development Bank and leaders of African nations to
expand electricity access in pursuit of partnership opportunities. Work with Power Africa to
reform policies and allow coal-related projects to compete for financing in support of
economic growth and development throughout Africa.
Pursue bilateral relationships that advance efforts to ensure energy security and universal
access to affordable and reliable energy in order to eradicate poverty. Model these
partnerships on the Japan-United States Strategic Energy Partnership (JUSSEP).
Facilitate relationships between U.S. coal exporters and overseas markets similar to the
recent Ukraine coal export agreement.

P A G E | 62
Economic Development in International Markets
Strategic Objective: Support efforts to advance economic growth in international markets
and the global development of advanced coal technologies, as well as the elimination of
regulatory and institutional barriers to the deployment of coal-fired facilities worldwide.
Recommended Tactics:
Support initiatives such as the BUILD Act to create a new International Development
Finance Corporation to assist developing nations’ efforts to achieve broad-based economic
growth and poverty reduction.
Assess the negative environmental impacts associated with restrictive financing for
deployment of high efficiency, advanced coal technology facilities in international markets.
Assess opportunities for U.S. industry to export advanced coal technologies to international
markets and the associated environmental and poverty-reduction benefits for emerging
economies.
Support efforts to establish a global fossil fuels alliance to promote energy access and
security through responsible use of advanced fossil fuel technologies.

P A G E | 63
APPENDIX A: Coal Statistics
U.S. Coal Production Basins
Source: Energy Information Administration

P A G E | 64
National Mining Association – Most Requested Coal Statistics 2010-2017
https://nma.org/wp-content/uploads/2017/12/c_most_requested.pdf

P A G E | 65
National Mining Association – U.S. Coal Production by State 2006-2017
https://nma.org/wp-content/uploads/2017/11/coal_production_by_state_2017p.pdf

P A G E | 66
National Mining Association – Coal Data at a Glance 2001-2017
https://nma.org/wp-content/uploads/2017/11/data_at_a_glance_2017p.pdf
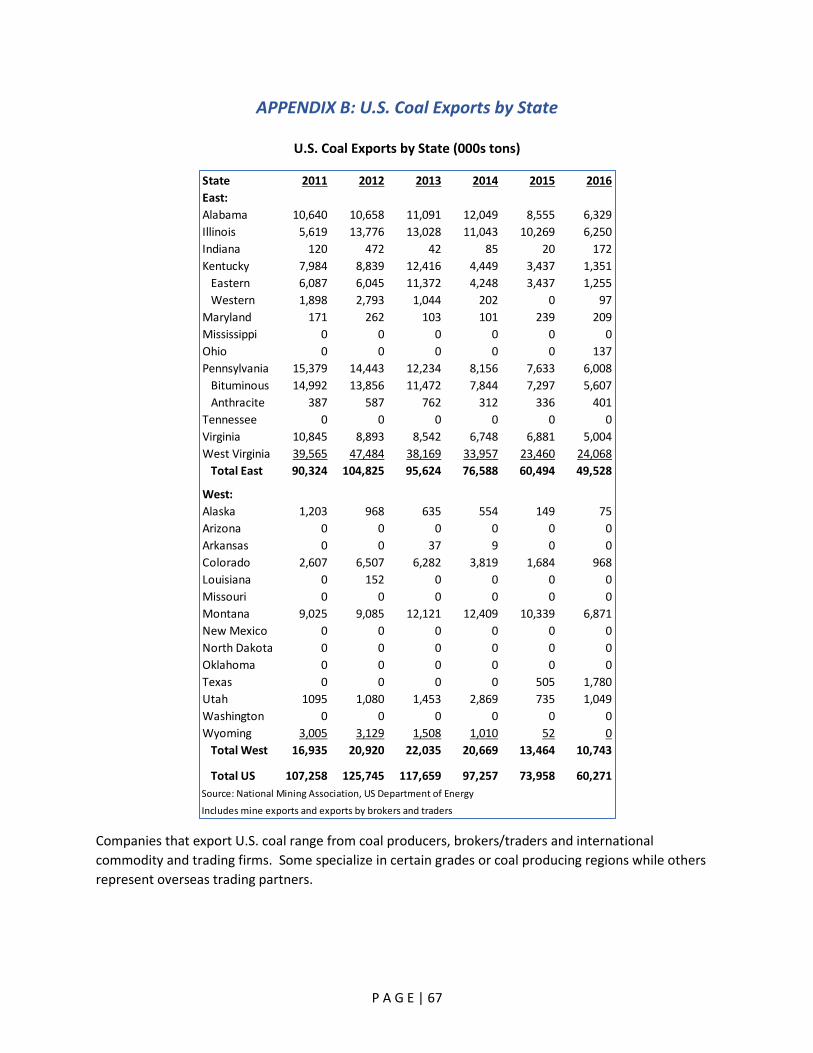
P A G E | 67
APPENDIX B: U.S. Coal Exports by State
U.S. Coal Exports by State (000s tons)
Companies that export U.S. coal range from coal producers, brokers/traders and international
commodity and trading firms. Some specialize in certain grades or coal producing regions while others
represent overseas trading partners.
State 2011 2012 2013 2014 2015 2016
East:
Alabama 10,640 10,658 11,091 12,049 8,555 6,329
Illinois 5,619 13,776 13,028 11,043 10,269 6,250
Indiana 120 472 42 85 20 172
Kentucky 7,984 8,839 12,416 4,449 3,437 1,351
Eastern 6,087 6,045 11,372 4,248 3,437 1,255
Western 1,898 2,793 1,044 202 0 97
Maryland 171 262 103 101 239 209
Mississippi 0 0 0 0 0 0
Ohio 0 0 0 0 0 137
Pennsylvania 15,379 14,443 12,234 8,156 7,633 6,008
Bituminous 14,992 13,856 11,472 7,844 7,297 5,607
Anthracite 387 587 762 312 336 401
Tennessee 0 0 0 0 0 0
Virginia 10,845 8,893 8,542 6,748 6,881 5,004
West Virginia 39,565 47,484 38,169 33,957 23,460 24,068
Total East 90,324 104,825 95,624 76,588 60,494 49,528
West:
Alaska 1,203 968 635 554 149 75
Arizona 0 0 0 0 0 0
Arkansas 0 0 37 9 0 0
Colorado 2,607 6,507 6,282 3,819 1,684 968
Louisiana 0 152 0 0 0 0
Missouri 0 0 0 0 0 0
Montana 9,025 9,085 12,121 12,409 10,339 6,871
New Mexico 0 0 0 0 0 0
North Dakota 0 0 0 0 0 0
Oklahoma 0 0 0 0 0 0
Texas 0 0 0 0 505 1,780
Utah 1095 1,080 1,453 2,869 735 1,049
Washington 0 0 0 0 0 0
Wyoming 3,005 3,129 1,508 1,010 52 0
Total West 16,935 20,920 22,035 20,669 13,464 10,743
Total US 107,258 125,745 117,659 97,257 73,958 60,271
Source: National Mining Association, US Department of Energy
Includes mine exports and exports by brokers and traders

P A G E | 68
Alphabetical listing of the top U.S. coal exporting firms in 2017 based on data from company reports,
news reports and export data from TP Host.
Company Metallurgical Thermal
Alliance Coal X
Arch Coal X X
Blackhawk Mining X
Bowie Resource Partners X
Cloud Peak Energy X
Consol Energy X X
Contura X
Drummond Company X
Global Mining (Signal Peak) X
Integrity Coal Sales (Trader) X
Javelin (Trader) X X
JERA Trading (Trader) X X
Lighthouse Resources X
Murray Energy X
Robindale Energy (Trader) X X
United Coal Company X
Vitol (Trader) X
Warrior Met Coal X
Xcoal Energy and Resources' (Trader) X X

P A G E | 69
APPENDIX C: Principal U.S. Coal Export Facilities
Source: Doyle Trading Consultants
Facility Name Owner Port Name Pier Loading RateThroughput
Capacity
Stockpile
(tonnes)Vessel Size Restrictions
Primary User or
DestinationAccess
US West Coast Ports
Oxbow Terminal/Metro PortsKoch Carbon Port of Long Beach, CAG
Loader 1: 3500
tonnes/hr Loader 2:
5000 tonnes/hr 1.8 Mt 175,000 Panamax 40-50 ft Coal & Petcoke BNSF/UP
Metropolitan Bulk TerminalCity of Stockton Port of Stockton, CA12-13
Loader 1: 800
tonnes/hr Loader 2:
4000 tonnes/hr 2.6 Mt 100,000
Panamax
to 50,000
tonnes to
35 ft 35 ft
Coal and other
bulk commodities UP
Levin-Richmond Levin-Richmond Terminal CorpPort of Richmond, CA22-26
12000-15000
tonnes/day 2.6 Mt 80,000
Panamax
to 55,000
tonnes
Berth A: 39
ft, Berth B 30
ft
Coal and other
bulk commodities UP
Millennium Bulk Terminal (proposed)Lighthouse Resources Port of Longview, WADocks 2-3 tbd
Plan: Phase 1:
25 Mt; Phase
II: 44 Mt 1.5 mm Panamax 43 ft
Coal and other
bulk commodities BNSF/UP
Oakland Bulk and
Oversized Terminal
(proposed) Oakland Global Port of Oakland, CA1 tbd 5 Mt 180,000 Cape 50 ft
Coal and other
bulk commodities BNSF/UP
Canadian and Mexican Ports Currently Handling US Coal
Westshore Terminals
Westshore Terminals
Investment Corp Roberts Bank, BC 7000 tonnes/hr 33 Mt 2.0 mm Cape
Berth 1: 20.9
M, Berth 2:
19.4 M Coal & Petcoke BNSF/CN/CP
Puerto de Guaymas
Administración
Portuaria Integral de
Guaymas
Guaymas,
Sonora, MX 15000 tonnes/day 2 Mt (est) Panamax
Coal and other
bulk commodities Ferromex
US EAST COAST -- BALTIMORE (Atlantic Ocean via Chesapeake Bay)
Consol Marine Terminal Consol Energy
Port of
Baltimore CNX Pier 16 mm 1.2 mm
Cape
(small) 47 ft Coal CSX, NS
Curtis Bay Coal Piers CSX Railroad
Port of
Baltimore
Bayside,
Curtis (B&O) 14 mm 500,000
Cape
(small) 41 ft Coal CSX
US EAST COAST -- HAMPTON ROADS (Atlantic Ocean at mouth of Chesapeake Bay)
Dominion Terminal
Associates
Arch Coal 35%, Contura
65%
Port of
Hampton Roads DTA 22 mm 1.7 mm
Cape
(small) 55 ft Coal CSX
Pier IX Kinder Morgan
Port of
Hampton Roads Pier 9 18 mm 1.4 mm
Cape
(small) 50 ft Coal CSX
Lamberts Point Coal
Terminal
Norfolk Southern
Railroad Port of Norfolk Pier 6 38 mm
na - Inventory
held in railcars
Cape
(small) 50 ft Coal NS
US EAST COAST -- Charleston (Atlantic via )
Shipyard River Coal
Terminal Kinder Morgan
Port of
Charleston
Shipyard
Bulk 2.5 mm 250,000 Panamax 45 ft Bulk Commodities CSX, NS
US GULF COAST (Atlantic Ocean via the Gulf of Mexico)
McDuffie Coal Terminal Alabama State Docks Port of Mobile
McDuffie
Island 14 mm 2.3 mm Baby Cape 45 ft
Coal and other
Bulk Commodities
CN, BNSF,
NS, CSX, KCS
& barge
United Bulk Terminal Marquard & Bahls
Lower
Mississippi
Mile Post
55.3 (east) 12 mm 4.0 mm Baby Cape
47 ft at S.
Pass
Coal and other
Bulk Commodities Barge
International Marine
Terminal Kinder Morgan
Lower
Mississippi
Mile Post
61.0 (west) 10 mm 1.3 mm Baby Cape
47 ft at S.
Pass Coal Barge
Convent Marine
Terminal SunCoke Energy
Lower
Mississippi
Mile Post
160.8 (east) 15 mm 1.5 mm Baby Cape
47 ft at S.
Pass Coal
CN (IC) &
Barge
Impala Burnside
Trafigura (Impala
subsidiary)
Lower
Mississippi
Mile Post
169.9 (east) 7.5 mm 600,000 Baby Cape
47 ft at S.
Pass
Coal and other
Bulk Commodities
CN (IC)
proposed
Midstream Buoys various
Lower
Mississippi
Lower
Mississippi approx 20 mm
na - Inventory
held in barges Baby Cape
47 ft at S.
Pass
Coal and other
Bulk Commodities Barge
Deepwater Terminal Kinder Morgan
Houston Ship
Channel
Deepwater -
shares w/
Petcoke 10 mm 650,000 Panamax 40 ft Petcoke and Coal
UP, BNSF,
KCS

P A G E | 70
Category
Deadweight
Tonnage Range
(DWT)
Typical Length
(meters)
Draft
(feet)Handysize <40,000 up to 33Handymax 40,000-50,000 150-200Supramax 50,000-60,000 150-200Panamax 60,000 - 80,000 294 max 41.2New/Post Panamax 120,000 366 max 49.9Capesize 150,000-400,000 60 plusChinamax up to 400,000 360 max 79
http://maritime-connector.com/wiki/ships/

P A G E | 71
APPENDIX D: Status of Proposed Coal Export Projects Summary of Recent Proposed Coal Export Projects
Project Background/info Status
Gateway Pacific
Terminal
Location: Cherry Point, Washington
Proposed: 2011
Overview: $700 million investment in new bulk
terminal that would have exported up to 54
million tons per year (mostly coal but
agricultural products as well).
Local economic impacts: Project estimated to
create up to 4,400 direct and indirect jobs
during the construction phase, and 1,250 jobs
during operation, generating $140 million in
local economic activity each year.31
Cancelled. In May 2016, the U.S. Army
Corps of Engineers denied a water permit
under section 404 of the Clean Water Act,
citing potential impacts to treaty fishing
rights.32 Local authorities subsequently
denied development and zoning permits.33
In February 2017, GPT withdrew its permit
applications, effectively cancelling the
project.34
Millennium Bulk
Terminal
Location: Longview, Washington
Proposed: 2012
Overview: $680 million investment would
revitalize 70-year old industrial site to allow for
up to 44 million tons per year of coal exports.
Local economic impacts: Project estimated to
create up to 2,650 direct and indirect jobs
during the construction phase, and 300 jobs
during operation, generating $49 million in
local economic activity each year.35
Active. In September 2016, the U.S. Army
Corps of Engineers released a generally
favorable draft environmental impact
statement for the project,36 but in April
2017, the Washington State Dept. of
Ecology issued a separate EIS under the
State Environmental Policy Act (SEPA)
concluding that the project would result in
“unavoidable and significant adverse
impacts” in a number of different areas.37
In September 2017, the Ecology
Department denied a key water quality
permit under section 401 of the Clean
Water Act.38 Project developer Lighthouse
Resources then sued the state of
Washington in federal court, citing a
number of process objections and arguing
that permit denials violated the Interstate
Commerce Clause. Six states (MT, WY, SD,
UT, KS and NE) have filed a brief in support
of the suit, which is awaiting argument.
Morrow Pacific
Project
Location: Boardman, Oregon (Port of Morrow)
Proposed: 2012
Canceled. While the Oregon state DEQ
issued air quality, water quality, and
31 http://createnwjobs.com/education/proposed-projects/ 32 http://www.nws.usace.army.mil/Media/News-Releases/Article/754951/army-corps-halts-gateway-pacific-terminal-permitting-process/ 33 http://www.whatcomcounty.us/DocumentCenter/View/23248/Letter-to-Pacific-International-Holdings-October-252016 34 https://www.whatcomcounty.us/993/Gateway-Pacific-Terminal-Proposed-Projec 35 http://createnwjobs.com/education/proposed-projects/ 36 http://www.millenniumbulkeiswa.gov/nepa-draft-eis.html 37 https://fortress.wa.gov/ecy/publications/documents/1706013.pdf 38 http://www.millenniumbulk.com/wp-content/uploads/2017/10/401-WQ-Certification-Denial-Letter.pdf

P A G E | 72
Overview: $200 million investment to in facility
to barge up to 8.5 million tons per year of coal
along Columbia River to Port Westward for
export.
Local economic impacts: According to project
supporters, development of the facility would
have created 2,100 direct and indirect jobs
during the construction phase, and 1,000
permanent jobs during full operation.
construction stormwater permits for the
project,39 in August 2014, the Oregon
Department of State Lands (ODSL) denied a
removal-fill permit for the project, citing
potential concerns related to waterways
and fishing.40 An administrative law judge
later upheld the decision, and in October
2016, Lighthouse Resources withdrew its
application for the project, noting that it
would instead route exports through
Vancouver, British Columbia.41
Oakland Bulk &
Oversized
Terminal
Location: Oakland, California
Proposed: 2012
Overview: In 2012, the city of Oakland entered
into an agreement with the Oakland Bulk &
Oversized Terminal (OBOT) to develop a
shipping terminal on land near a former Army
base. Among other bulk goods, the developers
planned for the facility to export roughly 5
million tons of coal per year sourced from
mines in Utah.
Local economic impacts: The OBOT is projected
to create up to 12,000 jobs, generating $300
million annually in direct and indirect local
employment income.42
Active. In 2016, the City of Oakland passed
an ordinance prohibiting the storage and
handling of coal at the facility, citing
concerns with particulate emissions from
coal dust. OBOT sued to block the
ordinance, and in May 2018, the U.S.
District Court for the Northern District of
California overturned the ordinance.43 The
City appealed the decision to the Circuit
Court.44
39 https://www.oregon.gov/deq/Programs/Pages/Coyote-Island-Coal-Project.aspx 40 http://op.bna.com.s3.amazonaws.com/env.nsf/r%3FOpen%3dsbra-9n5t2g 41 http://www.lighthouseresourcesinc.com/lighthouse-resources-sending-coal-to-asia/ 42 http://www2.oaklandnet.com/oakca1/groups/ceda/documents/agenda/oak039156.pdf 43 http://blogs2.law.columbia.edu/climate-change-litigation/wp-content/uploads/sites/16/case-documents/2018/20180515_docket-316-cv-07014_decision.pdf 44 https://www.eastbayexpress.com/SevenDays/archives/2018/06/14/city-of-oakland-appeals-decision-striking-down-coal-ban

P A G E | 73
APPENDIX E: Global Coal Market Statistics
World Coal Trade (million tonnes)
Source: IEA Coal Information 2017 Table 3.1
60%
62%
64%
66%
68%
70%
72%
74%
76%
78%
-
1,000
2,000
3,000
4,000
5,000
6,000
7,000
8,000
2010 2015 2020 2025 2030 2035 2040 2045 2050
Mill
ion
Sh
ort
To
ns
World Coal Consumption
Africa
Middle East
Asia
Europe
Americas
% Global Coal in Asia
Source: EIA 2017 International Energy Outlook
(Quads converted to short tons at 10,000 Btu/lb)
0%
10%
20%
30%
40%
50%
60%
70%
80%
-
1,000
2,000
3,000
4,000
5,000
6,000
2010 2015 2020 2025 2030 2035 2040 2045 2050
Mill
ion
Sh
ort
To
ns
Asia Coal Consumption
Other
S. Korea
Japan
India
China
China % of Asia
India % of Asia
Source: EIA 2017 International Energy Outlook
(Quads converted to short tons at 10,000 Btu/lb)

P A G E | 74
Chinese Coal Imports by Country of Origin
(thousand tonnes)
Source: IEA Coal Information 2017
P A G E | 75
APPENDIX F: Principal Global Suppliers of Metallurgical Coal – Country Breakdownciv Australia
Australia is one of the world’s largest metallurgical coal producers and the world’s largest metallurgical coal exporter. Australian metallurgical coal exports circle the globe and provide competition to all suppliers everywhere. Its highly-desired low-volatile coals set the industry standard.
Australia has a large remaining marketable reserve of metallurgical coal in Queensland and New South Wales. Reserves exist in the Bowen Basin in Queensland, and in the Sydney and Gunnedah basins of New South Wales. Much of the marketable reserve is located at currently operating mines. Nearly all this coal reserve is earmarked for the export market. A good portion of the Australian reserve is hard coking coal with the remainder split between soft coking coal and pulverized injection coal (PCI).
With only occasional and modest market driven setbacks, Australian metallurgical coal production has been steadily climbing for many years on the back of rising Asian demand for coke and steel. Recent annual metallurgical production has approached 200 million tonnes and additional increases are expected in the future. Hard coking coal production exceeds 100 million tonnes per year, with the remainder of production split between soft coking coal and PCI coal. Most of the production is from surface mines.
Australian metallurgical coal is valued for its high quality. When building metallurgical coal blends, consumers appreciate the diversity of coal types in Australia and the stability of supply offered by Australian producers. Australian low volatility hard coking coal is considered the industry benchmark. Prime Australian coking coals typically make strong coke as evidenced by their high CSR values. However, the best high-volatility Australian coking coals lack the high fluidity of their U.S. competitors and therefore do not flow as well and are not as prized in blends as their U.S. counterparts.
For some consumers, Australian coal is distant from their operations and the long haulage adds significantly to its delivered cost. Furthermore, Australian mines are often subject to the impacts of tropical cyclones that can last for days to weeks. Customers must remain flexible to accommodate these potential and unpredictable interruptions, either by contracting for non-Australian supply or by carrying extra inventory during the wet season. Customers of Australian metallurgical coal are also wary of the increased supplier pricing power arising from dominance by a few large producers.
Coal exports from Australia utilize nine terminals at seven ports, and by rail systems servicing these ports.
Australian mining companies are subject to a range of taxes that vary by location. Taxes and other fees in Queensland and New South Wales include royalties, a federal corporate income tax, a research contribution tax, service leave and mine safety taxes, and a voluntary “Coal21” greenhouse gas abatement contribution.
P A G E | 76
United States The U.S. is a significant global producer of metallurgical coal and usually the second or
third largest exporter. At today’s prices, its marketable reserve is substantial, in the neighborhood of one billion tons. Most of this reserve exists in Central Appalachia (CAPP), with the remainder split between Northern and Southern Appalachia (NAPP and SAPP). States with large reserves include West Virginia, Alabama, Virginia, Pennsylvania and Kentucky. Most of the U.S. metallurgical coal reserve is hard coking coal. There is a small amount of PCI coal. Almost all the reserve must be accessed using underground mining methods.
U.S. metallurgical coal production has been variable over the years. In 2015, metallurgical coal production totaled about 60 million tons, but was lower in 2016 given weak market fundamentals and higher in 2017 as the global market improved.
High-volatility A and B coking coals dominate production, but some low-volatility and mid-volatility coal is also produced. When market conditions and ocean freight rates allow, substantial amounts of high-volatility C metallurgical coal are exported from NAPP. In NAPP, there are two broad categories of coking coal: low- and mid-volatile coals in the eastern side of the basin; and high-volatility coals in southwestern Pennsylvania. The high-volatility coking coals in Pittsburgh seam mines have sulfur contents greater than coking plants desire, so much of this coal is consumed in thermal markets.
Most NAPP metallurgical and thermal export coal is exported through Baltimore, Maryland, via the CNX Marine Terminal or the Chesapeake Bay Piers. Baltimore’s CNX Marine Terminal is owned by CONSOL Energy and served by both CSX and Norfolk Southern (NS). CNX Marine is the largest export coal terminal serving NAPP and can load small capesize vessels. CSX's Chesapeake Bay Piers is a smaller terminal in Baltimore that also handles domestic coast-wise business.
CSX and NS are the Class 1 railroads serving NAPP mines along with a few small short lines. The MGA Railroad (jointly operated by the CSX and NS railroads) serves some large Pittsburgh seam mines.
SAPP production is primarily low-volatile and mid-volatile coals. Steel makers like the low sulfur, low ash, low moisture, and high CSR Blue Creek seam coal for making coke. SAPP metallurgical coal is considered to be one of the highest quality coals in the world. Coking coals from SAPP generally have a lower ash and sulfur content than competing Northern and CAPP coals.
Consumers of U.S. coal appreciate the high fluidity of the high-volatility. A U.S. coals given their ability to improve flowing in the blend and make a larger coke. Some U.S. metallurgical coals are considered to have quality equal to the best of the premium Australian coals thereby providing a good supply diversity option for consumers.
Most CAPP export coal (both metallurgical and thermal) is exported through one of three coal terminals at Hampton Roads, Virginia. DTA (Dominion Terminal Association) and Pier IX are served by CSX, and Lamberts Point is served by NS. New Orleans also remains an important center for coal exports from these eastern regions given its location at the mouth of the Mississippi River which many coal mines can access via inexpensive river transport.

P A G E | 77
Lamberts Point Coal Terminal is the largest capacity coal port in North America. The terminal is owned, operated and served by the NS railroad. Virtually all export coal produced by NS-served mines in Central Appalachia is moved through Lamberts Point. Nearly all the coal exported from Lamberts Point is metallurgical coal.
The CSX-served DTA terminal is the larger of the two terminals in Hampton Roads. Most of the coal shipped from DTA is metallurgical grade. Pier IX terminal is the other CSX-served export terminal at Hampton Roads and it exports both thermal and metallurgical coal depending on then-current market conditions.
U.S. suppliers have a transportation advantage to most European locations. Also, FOB mine costs for the high sulfur high-volatility C coals are very competitive which improve the economics somewhat into far-distant markets in Asia.
In the U.S., taxes and fees imposed on export coals at the federal level include corporate income taxes, reclamation taxes, and corporate income taxes. State governments typically impose income and severance taxes and guide counties on the imposition of property taxes except in West Virginia where property taxes are assessed at the state level. Royalties and taxes vary by state and sometimes by mining method.
Russia
Russia is a major global producer of metallurgical coal. Even though it consumes most of its domestic production, Russia remains one of the top five metallurgical coal exporters in the world.
Russian remaining marketable metallurgical coal reserves are quite large, larger than those in the U.S. The reserve base exists primarily at operating mines with about half at mines serving domestic customers and half serving the export market. The reserve spans all qualities of metallurgical coal, from hard to semi-soft to soft coking coals. Russia also has a significant amount of high quality PCI coal.
Russia’s metallurgical coal reserves are accessed by both underground and surface mining methods. Most of the reserves exist in the Kuzbass region of central Russia. Production is spread among many companies, but two-thirds of production is controlled by the five largest producers.
Unlike most other coal producing and exporting countries, Russia was not significantly affected by the recent multi-year production rationalization process. Despite weaker international and domestic coal demand and continued ruble cost inflation during the rationalization period, most major Russian coal producers have kept production and exports stable.
There is a limited amount of hard coking coal in Russia. Its coal often contains impurities and delivery is sometimes inconsistent.
Ocean freights from eastern Russian terminals to metallurgical coal customers in northeast Asia are very low providing them with a significant transportation advantage compared to most suppliers, although the rail cost to their ports is very high. Consumers of Russian coal like that Russian coal allows them to diversify from Australian metallurgical coal. Russian PCI coal directed into the European Union has almost complete dominance due to its low sulfur and high energy content. Note that the low CSR levels of Russian coal (compared to many other sources) can make it less desirable.

P A G E | 78
The location of Russian mines in the center of the country creates extremely long haulage distances to eastern and western terminals or to most western landborne customers. Weather can be a problem, as can railroad maintenance, both of which can and do interrupt supply periodically.
Coal export infrastructure is remote with high capital and operating costs that impact availability. Some ports are impacted by ice and shallow water depths. Coal is exported from ports in Russia’s Northwest, Baltic Sea, Black Sea and the Far East. In the aggregate, loading capacity is nearly double actual exports. However, Far East ports are currently operating at or near total capacity and port expansion plans are numerous.
Government-owned Russian Railways operates the rail system but rail car operation services are privately controlled.
Russia's legal framework is evolving as its economy trends to becoming less government controlled. Foreign investment inside Russia is challenging and limited. Mining companies pay an assortment of taxes including a corporate profits tax, a value added tax, a mineral extraction tax, and property and land taxes.
Canada Marketable metallurgical coal reserves in Canada are similar in size to those in the U.S.
Most of this reserve is located in British Columbia with nearly all the remainder found in Alberta. There is a very small metallurgical coal reserve in Nova Scotia.
There are multiple possible projects in Western Canada which could add significantly to Canadian reserves and could potentially replace existing mines if market conditions allow.
Since 2010, Canadian metallurgical coal production has ranged from 25 to 35 million tonnes per year and is currently increasing. Depending on the year, between three and five companies contribute to metallurgical coal production. Production has been highly concentrated with one producer responsible for most of the production. The new Donkin underground mine in Nova Scotia owned by Kameron Collieries is looking to expand metallurgical coal production.
Most of Canada’s production is thermal coal. While most of Canada’s coal exports are metallurgical coal, the Donkin mine could also export significant volumes of thermal coal. Of total metallurgical coal production in Canada only one to two million tonnes is consumed domestically.
Canada has some of the highest quality metallurgical coal in the world. Its low- and mid-volatility metallurgical coals are in high demand with steel producers around the world, particularly in Asia. Volatile matter in the western Canadian metallurgical coal mines is usually low. Most of it is blended with high-volatile coal by customers. Most Canadian coal also has low fluidity requiring other high-volatile coals to be introduced into the blend to make proper coke. Canada can also produce some high quality PCI coal.
Western Canadian port capacity has been expanded to over 60 million tonnes per year. Primary Canadian terminals include Westshore, Neptune and Ridley Island terminals. In addition to Canadian metallurgical coal, a few million tonnes of U.S. western thermal coal is shipped through Westshore. The Nova Scotian coal is exported through the Provincial Energy Ventures terminal near Sydney, Nova Scotia.
P A G E | 79
Two railroads control the movement of most Canadian coal: Canadian Pacific (CP) railway and Canadian National (CN) railway. CP controls most of the export coal, and eastbound shipments to the U.S. and to Thunder Bay Terminal on Lake Superior. CN serves mines in central Alberta and north-eastern BC. If new mines are developed in northern British Columbia, the CN is well-positioned to transport their coal to Ridley Terminal for export. Ample rail capacity exists for the foreseeable future.
The coal mining industry in Canada is subject to federal, provincial and local regulation and legislation. Mining operations are regulated primarily by provincial legislation, but also by federal legislation and local by-laws.
All new projects must prepare environmental impact assessments. Jurisdiction over mining is provided by the province with particular attention paid to heritage and cultural resources, site remediation and reclamation.
Provinces assess lease fees, income taxes and royalties, and the federal government assesses a federal net profits tax. Furthermore, British Columbia has a substantial carbon tax that applies when fuel is purchased for any reason; however, coal sold and exported outside British Columbia is exempt.
Mozambique Mozambique is emerging as a producer and exporter of metallurgical coal. Thermal coal
exports are, essentially, a byproduct of metallurgical coal production. Higher production and export of coal in Mozambique depends on investment in the coal value chain, higher coal prices and guarantees of improved internal country security. All of Mozambique's marketable reserves are located in the Tete Province, mostly in the Moatize coal basin. Although there are reports of a total reserve of 20 billion tonnes of coal, actual marketable reserves are probably much smaller, perhaps comparable to those in the U.S., at most.
Mozambique coal production began in 2011 and is increasing as infrastructure is improved, mostly at Vale’s Moatize mine. While there is no internal consumption of coal in Mozambique, efforts are underway to develop a coal-fired station, called the Benga Independent Power Project. A recent joint venture agreement between Kibo Mining and a Mozambique energy company Termoelectrica de Benga S.A. was formed for this purpose.
Mozambique has high quality hard coking coal. CSR levels are high. Some Mozambique hard coking coal is on par with the premiere Australian coking coals. However, ash and phosphorous levels are high so the coal must be blended in order to make high quality coke.
Coal is exported using two rail and port systems – Beira and Nacala. The completion of the Nacala Logistics Corridor which includes a 912-kilometer rail line and a new export coal terminal in Nacala in 2017 has significantly improved the logistics of moving coal to the export market with a large reduction in cost. Acknowledgement of Mozambique’s potential was the purchase by Mitsui of a portion of the Moatize mine and the Nacala Logistics Corridor.
Multiple new projects are planned in Mozambique. The economic viability of these projects is in question. Mineral resources in Mozambique are owned by the state and governed by a federal mining law. Foreign companies are allowed to apply for an exploration license but to mine coal, companies must be registered in Mozambique and the government must provide its consent to mine. Mining companies are subject to the usual royalties and corporate income taxes.
P A G E | 80
APPENDIX G: Principal Global Suppliers of Thermal Coal – Country Breakdowncv
Indonesia Indonesia has an extremely large, marketable coal reserve of billions of tonnes, nearly
all of which is thermal coal. The majority of this reserve is located in Kalimantan, with most of the rest located in Sumatra. More than one-half of this reserve is classified as low-rank coal. However, since much of the reserve is located in South Sumatra and East Kalimantan, a substantial amount of infrastructure development will be required in order to mine and market the coal.
Indonesian thermal coal production exceeded 400 million tonnes in 2015 but has fallen since. Accurate production statistics are difficult to obtain since some Indonesian coal production is “illegal”, a problem the government is making good progress in rectifying. Most production has been in Kalimantan. All production is by surface methods in mines whose costs are typically very low. Most of the coal is exported. The government reserves a certain amount (the domestic market obligation, or DMO) for domestic use and the rest is exported. The DMO was about 80 million tonnes in 2015.
Indonesia produces three types of thermal coal: bituminous coal (>5,400 kcal/kg on a gross as received (gar) basis), sub-bituminous coal (>4,600 to 5,400 kcal/kg gar), and low rank or lignite coal (less than 4,600 kcal/kg gar). Three-quarters of coal production is low rank (lignite and sub-bituminous) coal. Of the low rank coal, about one-third is lignite coal. U.S. PRB coals are on a quality par with the best Indonesian coal. In Indonesia, producers usually manage their own logistics. Exported coal moves from mine to ocean vessel mainly by barge to low capital and operating cost trans-shipment facilities where current capacity is more than sufficient. There are some possible future projects in Indonesia that are essentially “stranded” by the lack of infrastructure available to deliver their coal to market.
Australia Australian thermal coal marketable reserves are in the billions, much greater than those
in the U.S. The reserve is split roughly equally between New South Wales and Queensland. Important coal basins include the Sydney, Bowen, Surat, Galilee and Gunnedah Basins.
Recent thermal coal production totals about 250 million tonnes per year, roughly 80% of which is exported. Thermal coal production is primarily concentrated in the Sydney Basin in New South Wales and the Bowen Basin in Queensland. Over 50 companies produce thermal coal in roughly 75 mines, but the top eight companies control 75% of total thermal coal production. The largest miner produces nearly three times the thermal coal of its nearest competitor.
Australian thermal coal exports total about 200 million tonnes per year. Japan is the largest consumer of Australian thermal coal, consuming twice as much as the next largest consumer, China. South Korea, and Taiwan are also large consumers.
P A G E | 81
Russia Marketable reserves of thermal coal in Russia are similar to those in Australia in size.
Half of this reserve is located in the Kuzbass region in Kemerovo. High rank coals form the majority of the marketable reserves. Low-rank lignite accounts for about one-quarter of the reserve, mostly in Krasnoyarsk and Irkutsk. Most of the Russian coal reserves are far from major international markets and require an inland transport to exporting port of as much as 4,000 – 6,000 km.
Russian thermal coal production exceeds 250 million tonnes per year thereby making up the majority of total Russian coal production. Bituminous coal accounts for 70% of thermal coal production, with lignite accounting for most of the rest.
Recently, exports have strengthened, now totaling about 120 million tonnes. Most exports to Asia are by seaborne methods. To the west into Europe, exports are by both landborne and seaborne methods.
Russia's thermal coals are good quality bituminous coals. They are characterized by low sulfur content typically usually below 0.6% and often below 0.4% making them attractive to European buyers, in particular. Ash content of Russian bituminous thermal coal is average but energy content almost always exceeds 6,000 kcal/kg, except for high ash coals. High-ash coals can have an ash content well above 20% with an energy content of about 5,500 Kcal/kg nar.
Most Russian coal producers' costs are denominated in Russian currency. The ruble exchange rate is still the main driver in cost trends, with cost inflation in ruble-denominated categories of prime importance. Recent changes in the ruble exchange rate have lifted Russian mining costs. FOB port costs are similar to those in Australia, but inland rail transport can reach one-half of the total FOBT cost. Russian port costs are high, being impacted by the ruble exchange rate.
Colombia Colombia’s total marketable reserves are greater than those in the U.S. but smaller than
those in Russia and Australia. Most of the reserves are located in the departments of La Guajira and Cesar. Production has continued to expand, reaching over 89 million tonnes in 2017 with expectations of exceeding 100 million tonnes per year early in the next decade. The vast majority of production is from surface mines, most of them large and very efficient, and the vast majority of production is exported. FOB mine costs are among the lowest in the Atlantic Basin, making Colombia a preferred source of thermal coal in the Atlantic markets.
New projects will require a build-out of rail and port capacity. Projects outside of La Guajira and Cesar are located in interior Colombian states and, for the coal to be exported, will require new rail lines at very high capital cost.
Most Colombian thermal coals are high volatile bituminous coals with medium to high calorific value, low sulfur and ash levels, and generally good thermal combustion characteristics. Quality has declined over time as the large mines expanded production into somewhat poorer quality coals. The primary market for Colombian coal has been the Atlantic market. With the decline in U.S. imports, Europe remains the primary source of demand followed by Mexico and Central and South America. With the opening of the third channel at the Panama Canal, exports to Asia are believed to be a promising growth market.

P A G E | 82
Nominal rail and port capacity are sufficient to accommodate existing production but
increased production will require expansion of both rail and ports. By regulation, all exports are
direct-loaded into vessels. The major producers have invested in ports to provide direct ship
loading and eliminate barge-to-ship transfers. Currently, any coal produced in the Colombian
interior can only be transported by truck. Ongoing expansion efforts have been delayed for a
variety of reasons.
South Africa South Africa’s large thermal coal reserves are similar in size to those in Australia.
Mpumalanga Province contains the majority of marketable coal within South Africa. Reserves are greatest in the Waterburg and Witbank coalfields, but the Witbank, Highveld and Ermelo coalfields are the key current coal producing areas
Thermal coal production has surpassed 250 million tonnes. The majority of this coal is consumed in the domestic market. Currently, about 75 million tonnes per year. Export coal is sourced primarily from the Witbank field.
Although port capacity is far greater, exports of South African thermal coal have hovered around 75 million tons per year for a few years, hindered by rail-to-port delivery problems. Most recently, exports are split between standard and high-ash bituminous coals. India is by far the largest destination market. Other markets include Europe, Northeast Asia and Turkey. Pakistan and Egypt represent markets of opportunity for South African thermal coal. South African thermal coal for export ranges greatly in quality from under 5,000 kcal/kg nar to over 7,000 kcal/kg nar. Typically, coal is processed to meet a standard seaborne market specification for bituminous coals. However, coal qualities have been falling but with increased yields, margins are being maintained, nonetheless. A high-ash product for the Indian and Chinese market is also produced at a quality similar to that of the Australian high-ash coals. The growth in this high-ash market has been swift and its volume already significantly exceeds that of the standard 6,000 kcal/kg specification market. Eventually, high quality South African coal reserves will be exhausted.
In local currency terms, mining costs have increased substantially since 2013. But in U.S. dollar terms, the cost has actually declined due to exchange rate changes, although this last year, costs increased.
South African coal exports are serviced by four terminals at three ports, and by three main rail systems. Total port capacity is over 100 million tonnes and total rail capacity is about 90 million tonnes. Exports have failed to perform partly due to constraints on the rail system which state-owned Transnet hopes to solve through additional capital spend on rolling stock and upgrades to the existing Richards Bay coal line. A guarantee is in place to lift capacity on the important Richards Bay line up to 81 million tonnes per year of capacity.
The South African government owns all mineral rights. Historically disadvantaged South Africans are given preference regarding the opportunity to invest in the mining industry. Minimum black ownership levels are mandated.
South African miners are subject to taxes including royalties and corporate income taxes.
P A G E | 83
United States Northern Appalachia (NAPP). At today’s prices, marketable thermal coal reserves are in
the low single digit billions of tons range, although additional underground reserves are present that could support new mines if sustained market conditions warrant. Thermal coal production in NAPP totals around 90 million tonnes per year, of which 0 to 8 million tonnes per year is annually exported, usually to Europe, the Mediterranean and Latin America. Exports of NAPP coal have increased significantly over the last four years. When petroleum coke prices are high, some NAPP coal is often exported to India as a low-cost replacement fuel in cement plants.
Thermal coal produced in NAPP is high in energy content and generally high in sulfur. The average quality for NAPP thermal coal is high, over 12,500 Btu/lb, with ash under 10%, but sulfur in the range of 3%. Most of the thermal production occurs in large Pittsburgh Seam longwall operations. The sulfur content of future production will rise as mine operations move westward in NAPP.
Low natural gas prices in the Marcellus region are threatening NAPP coal producers. This pressure has driven thermal coal mines to reduce costs over the last several years although higher wages and higher diesel costs have lifted costs in the last two years.
Central Appalachia (CAPP). Marketable thermal coal reserves in CAPP are small and occur mostly in West Virginia. Current thermal coal production totals about 30 million tonnes per year, but CAPP is under pressure from low-cost natural gas and environmental regulation. Thermal coal exports can range from 0 to 5 million tonnes per year depending on market conditions. The average quality of CAPP coals is roughly 12,500 Btu/lb nar, under 10% ash and less than 1% sulfur. Overall quality has been declining since producers tend to mine their highest-quality reserves first. Almost all CAPP coals are low in sulfur content. Average mining and transportation costs are high in CAPP, reflecting a mature basin where low-cost reserves are mined out. These high costs make it difficult for CAPP producers to earn a margin in the export market. Illinois Basin (ILB). Marketable thermal coal reserves in the Illinois Basin (Illinois, Indiana and western Kentucky) are quite large in the range of several billion tons. Low-strip-ratio surface reserves are largely controlled by two companies and will be gone within 10 years. Abundant dragline-amenable, mid-strip-ratio surface reserves remain, as do significant reserves of underground thermal coal at fairly shallow depth. Production in the ILB grew in the early 2000s, peaked in 2014 then declined sharply through 2016 as domestic demand fell. The domestic and export market for ILB coal has rebounded and production has increased in 2017 and 2018. Costs declined through 2016, as poor market conditions forced operators into austerity programs, but are now rising as demand returns and royalties rise along with sales prices. Productivity improvement will help to minimize cost increases. ILB coal is typically a high-volatile, bituminous thermal coal. Average ILB thermal coal quality is around 11,300 Btu/lb, under 10% ash, and close to 3% sulfur, with great variation seen around those figures. Chlorine content can be high in some of the deeper coals. Its low cost allows ILB thermal coal to penetrate the export market, but its high sulfur reduces its potential market and allows those customers willing to consume it to heavily discount the price.

P A G E | 84
Powder River Basin (PRB). This purely thermal coal basin possesses a very large marketable reserve base about twice the size of that in the ILB. Coal is produced from 17 mines almost all of which are large surface operations. Coal seams are thick allowing for efficient and low-cost mining. Surface mining cash costs in the PRB are typically extremely low. Just two companies produce over 50% of the coal in the PRB. Just as elsewhere in the rest of the U.S., competition with low-cost natural gas is hindering production. From its peak in 2015, production has fallen by about 20%. Production will stay under pressure as long as natural gas prices stay low. Even so, production exceeds 300 million tons per year, making the PRB the largest U.S. coal producing basin. The PRB possesses mostly low-sulfur, sub-bituminous thermal coal. Sub-bituminous coal quality ranges from 8,000 Btu/lb to 9,400 Btu/lb, with low ash content (well under 10%) and very low sulfur content (averaging under 0.5%). Some low-ash, very low-sulfur bituminous coal is produced as well, with an energy content of about 10,500 Btu/lb. Some PRB coal is exported, largely to Asia and South America. It competes well with Indonesian coal for markets in northeast Asia, especially South Korea and Japan. However, the lack of available export port capacity limits its potential as new port projects experience permit denials and litigation continues. Meanwhile, modest volume is exported though Canadian ports in British Columbia when they have available capacity.

P A G E | 85
APPENDIX H: Competitive Assessment of U.S. vis-à-vis Global Supplierscvi
Australia Coal producers in Australia are, by far, the largest and most significant competitor to
U.S. metallurgical coal exporters. Where qualities are similar, the U.S. and Australia compete for met markets globally.
Advantages enjoyed by Australian producers include the superiority of their low- and mid-volatility products as well as the size and diversity of their production base. The reserve base of equivalent, high-quality coal is much smaller in the U.S. where there are also fewer, and generally smaller producers.
U.S. metallurgical coal mining costs are higher on average than those in Australia, and U.S. rail costs to port are two to three times higher than rail-to-port costs in Australia. To Asia, ocean freight rates favor Australian shippers; to Europe, they favor U.S. shippers. Where quality is similar, then, the total cost structure provides a net margin advantage to Australian metallurgical coal producers in Asia and usually to U.S. coal producers in Europe.
But, qualities are not always similar. While Australia enjoys a reputation as the premier low- and mid-volatility products, the U.S. is recognized for having a significant high-volatility reserve and production base that is far superior to that found in Australia, given its desirability in blends requiring highly fluid coal. On the other hand, some U.S. coals are too expanding and need to be blended with others to balance.
For thermal coals, the comparison is more nuanced. U.S. thermal coal producers in Appalachia and the Illinois Basin compete with Australian thermal coal producers for markets in Asia.
On an energy-adjusted basis, thermal coal costs at U.S. Appalachian mines are slightly higher than Australian mining costs but rail costs are roughly twice those in Australia, creating a definite cost disadvantage to Australian thermal coal mines. Barge costs for Illinois Basin thermal coal mines to port are also twice the cost of Australian inland transportation, but ILB mining costs are significantly lower on an energy-adjusted basis. On an energy-adjusted basis, the average total FOB port cost of ILB thermal mines is lower than in Australia.
However, the high sulfur content of Illinois Basin coal is heavily penalized by consumers. The penalty is usually greater than the cost advantage leaving Australian producers with the advantage over U.S. ILB coals in Asian markets.
Thus, FOB origin port costs for Australian thermal producers are typically lower than those in the U.S. giving Australian producers pricing flexibility versus their higher cost U.S. competitors. Furthermore, into the Asian market, Australia enjoys a transportation cost advantage over U.S. metallurgical coal producers. In the Atlantic region, however, transportation favors U.S. coals where U.S. coals can often out-compete Australian metallurgical and thermal coals. Russia
U.S. and Russian coals compete in both thermal and metallurgical markets. Geographically, competition is centered in Europe and the Mediterranean, where both countries have an ocean freight advantage over Australian shippers.
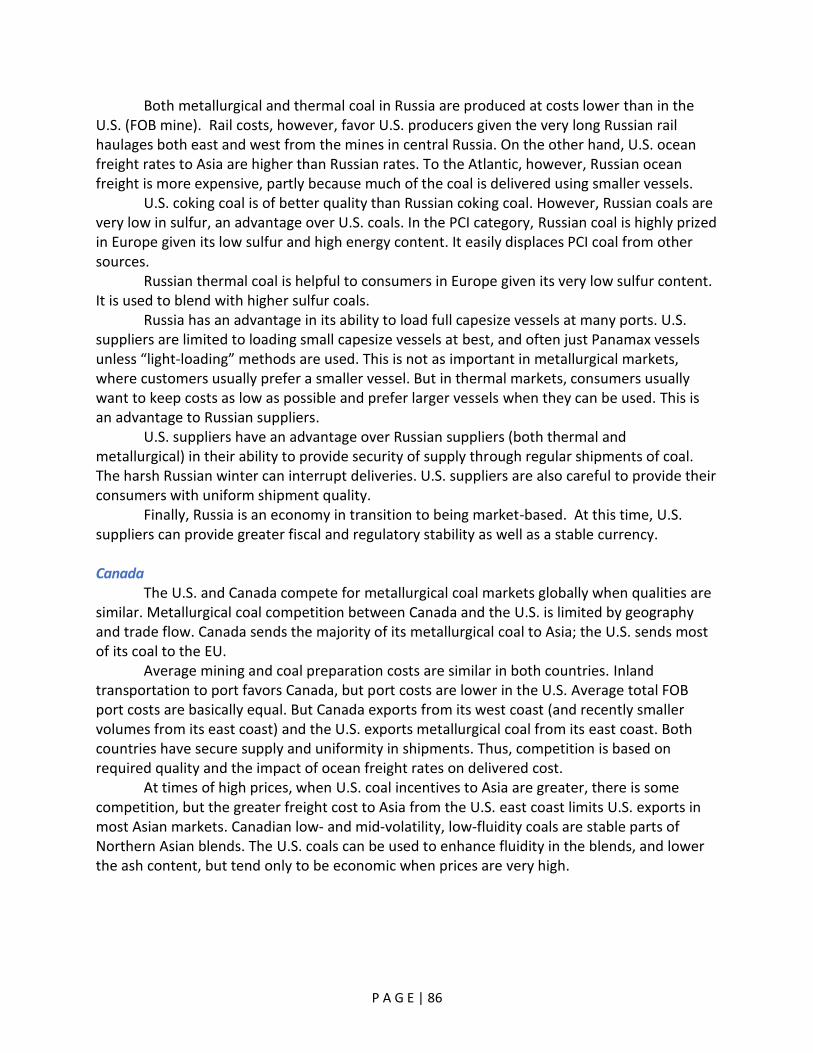
P A G E | 86
Both metallurgical and thermal coal in Russia are produced at costs lower than in the U.S. (FOB mine). Rail costs, however, favor U.S. producers given the very long Russian rail haulages both east and west from the mines in central Russia. On the other hand, U.S. ocean freight rates to Asia are higher than Russian rates. To the Atlantic, however, Russian ocean freight is more expensive, partly because much of the coal is delivered using smaller vessels.
U.S. coking coal is of better quality than Russian coking coal. However, Russian coals are very low in sulfur, an advantage over U.S. coals. In the PCI category, Russian coal is highly prized in Europe given its low sulfur and high energy content. It easily displaces PCI coal from other sources.
Russian thermal coal is helpful to consumers in Europe given its very low sulfur content. It is used to blend with higher sulfur coals.
Russia has an advantage in its ability to load full capesize vessels at many ports. U.S. suppliers are limited to loading small capesize vessels at best, and often just Panamax vessels unless “light-loading” methods are used. This is not as important in metallurgical markets, where customers usually prefer a smaller vessel. But in thermal markets, consumers usually want to keep costs as low as possible and prefer larger vessels when they can be used. This is an advantage to Russian suppliers.
U.S. suppliers have an advantage over Russian suppliers (both thermal and metallurgical) in their ability to provide security of supply through regular shipments of coal. The harsh Russian winter can interrupt deliveries. U.S. suppliers are also careful to provide their consumers with uniform shipment quality.
Finally, Russia is an economy in transition to being market-based. At this time, U.S. suppliers can provide greater fiscal and regulatory stability as well as a stable currency.
Canada
The U.S. and Canada compete for metallurgical coal markets globally when qualities are similar. Metallurgical coal competition between Canada and the U.S. is limited by geography and trade flow. Canada sends the majority of its metallurgical coal to Asia; the U.S. sends most of its coal to the EU.
Average mining and coal preparation costs are similar in both countries. Inland transportation to port favors Canada, but port costs are lower in the U.S. Average total FOB port costs are basically equal. But Canada exports from its west coast (and recently smaller volumes from its east coast) and the U.S. exports metallurgical coal from its east coast. Both countries have secure supply and uniformity in shipments. Thus, competition is based on required quality and the impact of ocean freight rates on delivered cost.
At times of high prices, when U.S. coal incentives to Asia are greater, there is some competition, but the greater freight cost to Asia from the U.S. east coast limits U.S. exports in most Asian markets. Canadian low- and mid-volatility, low-fluidity coals are stable parts of Northern Asian blends. The U.S. coals can be used to enhance fluidity in the blends, and lower the ash content, but tend only to be economic when prices are very high.

P A G E | 87
Mozambique
Mozambique is an emerging supplier of metallurgical coal. Competition with the U.S. is currently limited and sporadic. Should it occur, the U.S. has an advantage given its lower mine and inland transportation costs.
The U.S. coal is perceived to have a better quality as regards the level of impurities. Metallurgical coal in Mozambique is at the high end for sulfur and ash. However, Mozambique has high fluidity coal that is helpful in certain blends.
Indonesia
The U.S. and Indonesia compete in Asian thermal markets, particularly those in Northeast Asia. Specifically, U.S. Powder River Basin (PRB) coal competes with Indonesian sub-bituminous coal.
U.S. coal producers enjoy a substantial mine cost advantage over Indonesian producers. However, Indonesian inland transportation (barge to transshipment facility) costs are roughly one-third the cost of U.S. rail to Canadian ports. The absence of a U.S. west coast port is a clear disadvantage to U.S. producers, since U.S. coal must export either in Canada, where capacity is limited or in the U.S. Gulf of Mexico which increases both inland transportation and ocean freight costs.
Furthermore, Indonesia’s producer-owned logistics chain gives them an advantage over the U.S., where third party transportation and infrastructure costs are higher. Port costs in the U.S. are a few dollars per tonne greater than typical offshore transloading costs in Indonesia. Coal specifications are similar for sub-bituminous coal, but the U.S. enjoys a general advantage in providing a stable and secure source of supply that consistently meets contract specifications. Indonesian producers must cope with the constant threat of rising taxes and royalties, licensing and permitting issues, and the requirement that Indonesian coal is obligated first and foremost to the Indonesian domestic market. Colombia
Colombia and the U.S. compete directly in Atlantic thermal markets. With its low mining, inland transportation and port costs, and with its ocean freight advantage to markets in Europe and the Mediterranean, Colombian coal producers are able, when necessary, to lower their prices more than their competitors are willing or able to do.
Colombian coal is low in sulfur and ash content and competes well against certain U.S. coals with higher sulfur content, such as those in NAPP. While consumers in the European Union desire NAPP and ILB coals for their very high energy content, they dislike the high sulfur content and, in the case of the ILB, the high chlorine content. Including Colombian coal in a blend with NAPP and ILB coals with Colombian coal lowers the sulfur and chlorine contents. Financial transactions are easier to manage in the U.S. as lenders are more efficient given the existence of credit information and better regulation which make the coal transactions less risky. Also, in Colombia, government policy is discouraging existing producers from investing.

P A G E | 88
South Africa For years, South Africa has been slowly lowering its exports to the Atlantic and
increasing its exports to the Pacific, particularly India. For this reason, direct competition between South Africa and the U.S. is declining. Where they compete on a head-to-head basis, South Africa has an advantage with its lower FOB mine, inland transportation and port costs. Rail capacity constraints for rail shipments from mine to port are a problem, however.
South African coal quality is declining as the availability of standard 6,000 kcal/kg coal is declining. South Africa is increasingly offering a non-standard high-ash product, similar to what the Australians offer in the seaborne market. U.S. coals have a quality advantage, although washing rates and yields determine the final South African specification. If costs allow, South African coal can be washed to any normal standard specification.
Policy uncertainty is high in both countries, but fiscal stability is greater in the U.S. There is growing concern that the South African government will institute some form of a domestic mine obligation if South African public utility company Eskom is unable to source sufficient coal from domestic suppliers under normal market circumstances. These uncertainties create an advantage for U.S. producers, who operate in much more stable market.
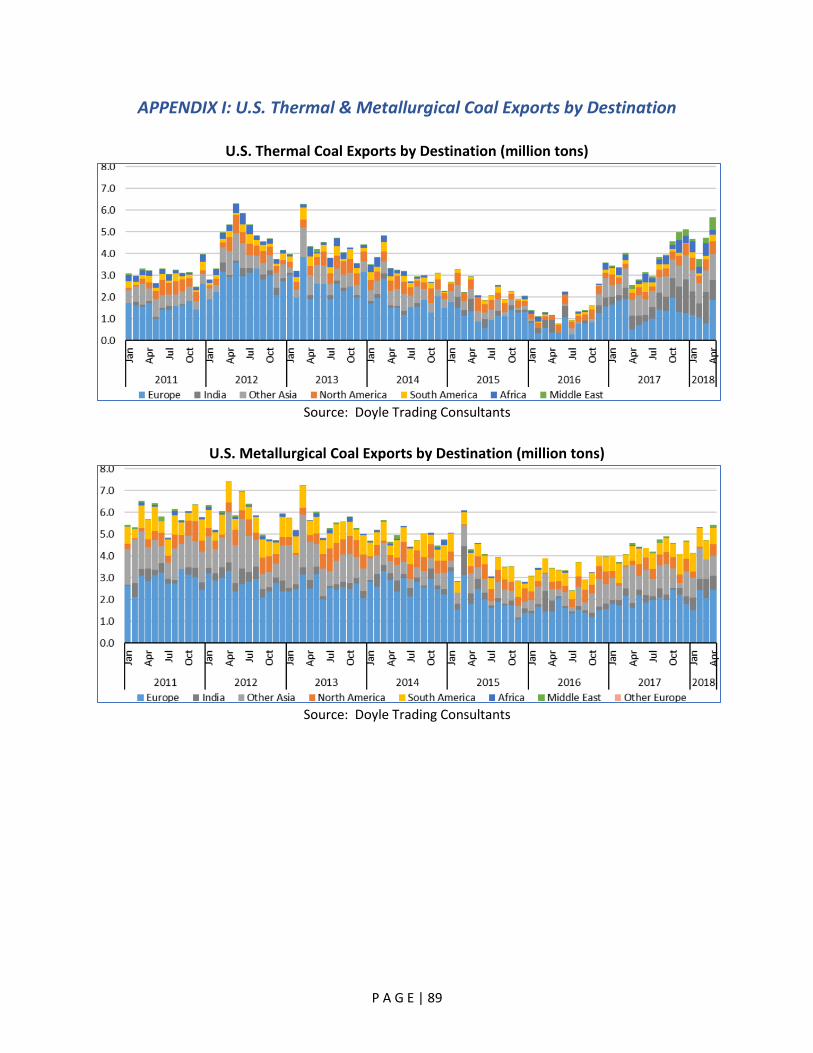
P A G E | 89
APPENDIX I: U.S. Thermal & Metallurgical Coal Exports by Destination
U.S. Thermal Coal Exports by Destination (million tons)
Source: Doyle Trading Consultants
U.S. Metallurgical Coal Exports by Destination (million tons)
Source: Doyle Trading Consultants

P A G E | 90
APPENDIX J: Coal Financing Policies of Key Lending Institutions
Coal Financing Policies of Key International Lending Institutions45 Bank/Entity U.S.
share %
Coal financing,
2007-2013
Policy on financing coal-fired power plants
African Development
Bank
6%46 $2.84 billion 2012 AfDB energy sector policy states that the bank will
support coal power plants when investment will have a strong
development impact and is also environmentally responsible.
Asian Development
Bank
16%47 $1.69 billion 2009 ADB energy policy48 states the Bank will support coal-fired
power plants selectively if adequate emissions mitigation
measures are incorporated into project design. However, ADB
has not pursued recent coal projects of any significance.
Asian Infrastructure
Investment Bank
0% N/A (bank
launched in 2016)
June 2017 policy draft energy strategy states “Carbon efficient
oil- and coal-fired power plants would be considered if they
replace existing less efficient capacity or are essential to the
reliability and integrity of the system, or if no viable or
affordable alternative exists in specific cases. The Bank will pay
attention to the particular needs of its less developed
members.”49
European Bank for
Reconstruction and
Development
0% $.41 billion 2014 policy states coal-fired plants will only be financed “in
rare and exceptional circumstances.”50
World Bank: 2013 WB policy eliminates financing support for coal power
generation except in rare circumstances.51 International Bank for
Reconstruction and
Development
16%52 $4.6 billion
International
Development Agency
54%53 $.05 billion
International Finance
Corporation
21%54 $1.83 billion
45 Unless otherwise noted, information drawn from 2017 IEA report on International Coal plant financing, p. 66. Available at http://www.iea.org/access2017/ 46 https://www.afdb.org/fileadmin/uploads/afdb/Documents/Boards-Documents/ADB_-_Statement_of_Voting_Powers_30_April_2018.pdf 47 https://www.adb.org/site/investors/credit-fundamentals/capital-structure 48 https://www.adb.org/sites/default/files/institutional-document/32032/energy-policy-2009.pdf 49 https://www.aiib.org/en/policies-strategies/strategies/sustainable-energy-asia/.content/index/_download/aiib-energy-sector-Strategy-2017.pdf 50 http://www.ebrd.com/documents/climate-finance/methodology-for-the-assessment-of-coal-fired-generation-projects.pdf 51 http://www.worldbank.org/en/news/feature/2013/07/16/world-bank-group-direction-for-energy-sector 52 http://siteresources.worldbank.org/BODINT/Resources/278027-1215524804501/IBRDCountryVotingTable.pdf 53 http://siteresources.worldbank.org/BODINT/Resources/278027-1215524804501/IDACountryVotingTable.pdf 54 http://siteresources.worldbank.org/BODINT/Resources/278027-1215524804501/IFCCountryVotingTable.pdf

P A G E | 91
i World Coal Association 2018, https://www.worldcoal.org/coal ii BP Statistical Review of World Energy 2018, https://www.bp.com/content/dam/bp/en/corporate/pdf/energy-economics/statistical-review/bp-stats-review-2018-full-report.pdf iii International Energy Agency (IEA), 2018 Coal Information Overview https://webstore.iea.org/download/direct/1136?filename=coal_information_2018_overview.pdf iv International Electrotechnical Commission, 2018. v IEA 2018 Coal Information Overview op. cit. vi U.S. Energy Information Administration, www.eia.gov/coal/reserves vii National Mining Association, U.S. Coal Industry Statistics, https://nma.org/wp-content/uploads/2017/12/c_most_requested.pdf viii American Coalition for Clean Coal Electricity, Coal Facts, http://www.americaspower.org/issue/coal-facts/ ix White House, “Unleashing American Energy”, June 2017 https://www.whitehouse.gov/briefings-statements/remarks-president-trump-unleashing-american-energy-event/ x Ernst & Young, “U.S. Coal Exports: National and State Economic Contributions,” prepared for the National Mining
Association, May 2013, and Management Information Services, Inc. xiRoger H. Bezdek, “The Economic Contribution of Coal to the American Economy,” American Coal, 2018, Issue 1, pp. 26-30; Roger H. Bezdek, “Coal Industry and Appalachia,” Public Utilities Fortnightly, October 1, 2017, pp. 32-36, http://misi-net.com/publications/PUF-1017.pdf; Management Information Services, Inc., “Analyzing and Estimating the Economic and Job Benefits of U.S. Coal,” prepared for the U.S. Department of Energy, September 2017, http://misi-net.com/publications/DOECoal-0917.pdf. xiiErnst & Young, op. cit., and Management Information Services, Inc. xiiiManagement Information Services, Inc., op. cit. xivDOE Secretary Perry noted that “This Administration looks forward to making available even more of our abundant natural resources to allies and partners like Ukraine in the future to promote their own energy security through diversity of supply and source. Partnerships like this are crucial to the path forward to achieve energy dominance.” See “Secretary Perry and Secretary Ross Hail New Coal Deal with Ukraine,” U.S. Department of Energy press release, July 31, 2017, https://energy.gov/articles/secretary-perry-and-secretary-ross-hail-new-coal-deal-ukraine. xvManagement Information Services, Inc., “Job Benefits of U.S. Coal Exports to Ukraine,” prepared for the National Coal Council, May 2018. xviAssociation of American Railroads, “Railroads and Coal,” May 2018. Coal dominates rail traffic in major coal producing states. In Kentucky, West Virginia and Wyoming, for example, coal accounted for 72%, 87%, and 94%, respectively, of total originated rail tonnage in 2016. xviiThe five major coal-transporting U.S. railroads are BNSF Railway, Canadian National Railway, CSX Transportation, Norfolk Southern Railway, and Union Pacific Railroad. Ibid. xviii U.S. Energy Information Administration (EIA), “U.S. coal exports increased by 61% in 2017 as exports to Asia more than doubled,” April 19, 2018, https://www.eia.gov/todayinenergy/detail.php?id=35852. xix EIA, “Quarterly Coal Report,” July 6, 2018, https://www.eia.gov/coal/production/quarterly/ xx EIA, “Coal Explained – Where Our Coal Comes From,” https://www.eia.gov/energyexplained/index.php?page=coal_where xxi Mine Safety and Health Administration from ABB Energy Velocity xxii Brian Solomon and Patrick Young, Coal Trains: The History of Railroading and Coal in the United States, Voyageur Press, 2009. xxiii Association of American Railroads, “Railroads and Coal”, May 2018, https://www.aar.org/wp-content/uploads/2018/05/AAR-Railroads-Coal.pdf xxiv CSX Quarterly Financial Report: Fourth Quarter 2017, http://phx.corporate-ir.net/phoenix.zhtml?c=92932&p=quarterlyearnings2017 xxv Norfolk Southern Quarterly Financial Data: Fourth Quarter 2017, http://www.nscorp.com/content/dam/QuarterlyEventFiles/4q-2017/4q2017_financial_data.pdf

P A G E | 92
xxvi The American Waterways Operators, Industry Facts, https://www.americanwaterways.com/initiatives/jobs-economy/industry-facts xxvii U.S. Army Corps of Engineers, , “Final Waterborne Commerce Statistics for Calendar Year 2016”, https://usace.contentdm.oclc.org/utils/getfile/collection/p16021coll2/id/1655 and “The U.S. Waterway System: 2016 Transportation Facts & Information” https://usace.contentdm.oclc.org/utils/getfile/collection/p16021coll2/id/1829%20, and American Society of Civil Engineers, “Infrastructure Report Card – Ports”, https://www.infrastructurereportcard.org/cat-item/inland-waterways/ xxviii Host, Finn; Status of U.S. Coal Exports; April 2017. Available: http://www.uscoalexports.org/wp-content/uploads/2018/02/Status-of-U.S.-Coal-Exports-Finn-Host-April-2017.pdf; U.S. Coal Exports by Year, Quarter, and Customs District, 2002 – 2018; U.S. Energy Information Administration and the U.S. Department of Commerce, Bureau of the Census, Monthly Report EM 545; Available: www.eia.gov/coal/archive/coal_historical_exports.xlsx; USA Trade Online; Port-level Exports; Available: https://usatrade.census.gov/ xxix Derived from IEA 2018 Coal Information: Overview (2018 edition), https://webstore.iea.org/download/direct/1136?fileName=Coal_Information_2018_Overview.pdf xxx IEA 2018 Coal Information: Overview (2018 edition), https://webstore.iea.org/download/direct/1136?fileName=Coal_Information_2018_Overview.pdf xxxi Derived from IEA Coal Information: Overview (2018 edition), https://webstore.iea.org/download/direct/1136?fileName=Coal_Information_2018_Overview.pdf and World Coal Association, Coal Market & Pricing, https://www.worldcoal.org/coal/coal-market-pricing xxxii IEA 2018 Coal Information: Overview (2018 edition), https://webstore.iea.org/download/direct/1136?fileName=Coal_Information_2018_Overview.pdf xxxiii UN Climate Change Annual Report 2017, https://unfccc.int/resource/annualreport/ xxxiv BP Statistical Review of World Energy 2018, https://www.bp.com/content/dam/bp/en/corporate/pdf/energy-economics/statistical-review/bp-stats-review-2018-full-report.pdf xxxv Peabody Energy Investor Presentation, https://www.peabodyenergy.com/Peabody/media/MediaLibrary/Investor%20Info/Jefferies-2018-Investor-Presentation-8-6-18.pdf xxxvi EIA International Energy Statistics, Beta Tool, https://www.eia.gov/beta/international/ xxxvii Ibid. xxxviii Ibid. xxxix Ibid. xl IEA Coal Information: Overview (2018 edition), https://webstore.iea.org/download/direct/1136?fileName=Coal_Information_2018_Overview.pdf xli Ibid. xlii Derived from Quarterly Coal Report – Release Date July 6, 2018, https://www.eia.gov/coal/production/quarterly/ and IEA Coal Information: Overview (2018 edition), https://webstore.iea.org/download/direct/1136?fileName=Coal_Information_2018_Overview.pdf xliii IEA Coal Information: Overview (2018 edition), https://webstore.iea.org/download/direct/1136?fileName=Coal_Information_2018_Overview.pdf xliv Derived from Quarterly Coal Report – Release Date July 6, 2018, https://www.eia.gov/coal/production/quarterly/ and IEA Coal Information: Overview (2018 edition), https://webstore.iea.org/download/direct/1136?fileName=Coal_Information_2018_Overview.pdf xlv Indonesia-Investments, https://www.indonesia-investments.com/news/todays-headlines/coal-mining-update-indonesia-production-export-price/item8894? xlvi Australian Mining, https://www.australianmining.com.au/news/australian-coal-exports-set-new-record-in-2017/ xlvii Coal Price DB, https://www.oanda.com/solutions-for-business/historical-rates/main.html xlviii Japan’s Ministry of Economy, Trade, and Industry (METI), “Strategic Energy Policy of Japan,” April 2014, Tokyo.

P A G E | 93
xlix National Mining Association, U.S. Bituminous Coal Exports, 1985-2017, Updated February 2018, https://nma.org/wp-content/uploads/2017/03/bituminous_coal_exports_17.pdf l Bureau of Land Management, https://www.blm.gov/programs/energy-and-minerals/coal/coal-data li https://usace.contentdm.oclc.org/utils/getfile/collection/p16021coll7/id/6941 Port of Virginia, 2065 Master Plan, http://www.portofvirginia.com/wp-content/uploads/2016/02/TPOV-master-plan-2065-final-020316.pdf lii National Waterways Foundation, Economic Impact of Increased Investment in Inland Waterways System by Universities of Kentucky and Tennessee, November 2014, http://waterwayscouncil.org/featured/national-waterways-foundation-commissioned-study-examines-economic-impact-of-increased-investment-in-inland-waterways-system/ liii Inland Waterways Users Board Meeting No. 86, Financial Report & Project Summaries liv https://www.congress.gov/bill/113th-congress/senate-bill/574 lv Lighthouse Resources, http://www.lighthouseresourcesinc.com/millennium-bulk-terminals/ lvi Great Lakes Ports Association, http://www.greatlakesports.org/issues/harbor-maintenance-trust-fund/ lvii Ibid. lviii U.S. Government Publishing Office, https://www.gpo.gov/fdsys/pkg/PLAW-113publ121/pdf/PLAW-113publ121.pdf lix Millennium Bulk Terminal EIS, http://www.millenniumbulkeiswa.gov/nepa-comment-archive.html lx Ibid. lxi Washington State Government, Millennium Terminal EIS, https://fortress.wa.gov/ecy/publications/documents/1706013.pdf lxiiMillennium Terminal, http://www.millenniumbulk.com/wp-content/uploads/2017/10/401-WQ-Certification-Denial-Letter.pdf lxiii White House, https://www.whitehouse.gov/presidential-actions/presidential-executive-order-establishing-discipline-accountability-environmental-review-permitting-process-infrastructure/ lxiv White House, https://www.whitehouse.gov/wp-content/uploads/2018/04/MOU-One-Federal-Decision-m-18-13-Part-2-1.pdf lxv Congressional testimony of Roger Martella, A Hard Look at the Administration’s Revised Guidance for Greenhouse Gas Emissions and Climate Change under NEPA Law and Practice, June 2016, https://naturalresources.house.gov/uploadedfiles/martellatestimony.pdf lxvi Obama Administration, https://obamawhitehouse.archives.gov/administration/eop/ceq/initiatives/nepa/ghg-guidance lxvii White House, https://www.whitehouse.gov/presidential-actions/presidential-executive-order-promoting-energy-independence-economic-growth/ lxviii Washington State Government, Millennium Bulk Terminal EIS, http://www.millenniumbulkeiswa.gov/assets/chapter_6.8_greenhouse_gas_emissions.pdf lxix Frank Wolak, Stanford University, Assessing the Impact of the Diffusion of Shale Oil and Gas Technology on the Global Coal Market, November 2017, https://ngi.stanford.edu/sites/default/files/40%20Wolak_NGI_2017.pdf lxx IEA, https://www.iea.org/weo2017/ lxxi Obama Administration, https://obamawhitehouse.archives.gov/the-press-office/2013/06/25/remarks-president-climate-change lxxii U.S. Treasury Department, https://www.treasury.gov/press-center/press-releases/Pages/jl2195.aspx lxxiii Export-Import Bank, https://www.exim.gov/news/export-import-bank-board-adopts-revised-environmental-guidelines-reduce-greenhouse-gas lxxiv Bank for Reconstruction and Development, https://www.ebrd.com/what-we-do/sectors-and-topics/ebrd-energy-strategy.html lxxv IEA Clean Coal Centre, International finance for coal-fired power plants, p. 27-28,
https://www.usea.org/sites/default/files/International%20finance%20for%20coal%20fired%20power%20plants%2
0-%20ccc277.pdf lxxvi IEA, Ibid lxxvii IEA, Ibid

P A G E | 94
lxxviii IEA, Ibid lxxix World Coal Association, https://www.worldcoal.org/sites/default/files/resources_files/The%20Power%20of%20high%20efficiency%20coal%20-%20WCA%20-%200316.pdf lxxx U.S. Treasury, https://www.treasury.gov/resource-center/international/development-banks/Pages/guidance.aspx lxxxi African Development Bank, https://www.afdb.org/en/news-and-events/launch-of-the-japan-africa-energy-initiative-remarks-by-akinwumi-adesina-president-of-the-african-development-bank-letter-of-intent-signing-ceremony-at-the-africa-union-summit-17155/ lxxxii African Development Bank, https://www.afdb.org/en/topics-and-sectors/initiatives-partnerships/power-africa-initiative/energy-power/ lxxxiii METI, http://www.meti.go.jp/english/press/2017/pdf/1107_001a.pdf lxxxiv U.K. Government, https://assets.publishing.service.gov.uk/government/uploads/system/uploads/attachment_data/file/700613/powering-past-coal-declaration.pdf lxxxv Export Import Bank, https://www.exim.gov/policies/ex-im-bank-and-the-environment/international-environmental-and-social-guidelines lxxxvi 2010 Consolidated Appropriations Act, section 7079. https://www.congress.gov/111/plaws/publ117/PLAW-111publ117.pdf lxxxvii OPIC, Revised Environmental and Social Policy Statement (January 13, 2017). Available at https://www.opic.gov/sites/default/files/files/final%20revised%20ESPS%2001132017(1).pdf lxxxviii U.S. Congress, https://www.congress.gov/bill/115th-congress/senate-bill/2463/text lxxxix Obama Administration, https://obamawhitehouse.archives.gov/the-press-office/2013/06/30/fact-sheet-power-africa xc USAID, https://www.usaid.gov/powerafrica/ xci USAID, https://www.usaid.gov/sites/default/files/documents/1869/ElectrifyAfricaAct_ReportCongress.pdf xcii USAID, https://www.usaid.gov/sites/default/files/documents/1860/USAID_PA_Roadmap_April_2016_TAG_508opt.pdf xciii USAID, https://www.usaid.gov/news-information/press-releases/mar-1-2018-usaid-administrator-mark-greens-remarks-fourth-annual-powering-africa-summit xciv USTDA, https://www.ustda.gov/events/2017/south-and-southeast-asia/coal-fired-power-emissions-control-technologies-reverse-trade xcv USTDA, https://www.ustda.gov/news/press-releases/2018/ustda-accepting-initial-proposals-cleaner-coal-projects-emerging-markets xcvi IEA Energy Access 2017, http://www.iea.org/access2017/ xcvii IEA Coal Information 2017, op. cit., pg. xi xcviii American Council for Capital Formation, CDN, http://cdn.accf.org/wp-content/uploads/2017/04/ACCF-CPR-Special-Report_Coal-Financing-FINAL.pdf xcix U.S. Department of Commerce, https://www.commerce.gov/news/press-releases/2017/07/secretary-ross-and-secretary-perry-hail-new-coal-deal-ukraine c Bloomberg, https://www.bloomberg.com/news/articles/2018-06-15/china-s-taxing-america-s-coal-just-as-it-was-looking-to-buy-more ci https://www.businessinsider.com/trump-tariffs-china-trade-war-chinese-goods-2018-8 cii Hurriyet, http://www.hurriyetdailynews.com/turkey-to-respond-to-us-over-steel-aluminum-tariffs-132770 ciii CNBC, https://www.cnbc.com/2014/11/13/rise-of-protectionism-in-china-a-threat-to-commodities-imports.html civ These descriptions summarize key elements of common coal industry knowledge supplemented by information provided by Wood Mackenzie, Inc. cv Ibid. cvi Ibid.