northrop grumman private / proprietary presentation to: 2009 narccap users’ meeting glenn higgins...
TRANSCRIPT
Northrop Grumman PRIVATE / PROPRIETARY
Presentation to: 2009 NARCCAP Users’ Meeting
Glenn HigginsAtmospheric Sciences & Engineering Department
Northrop Grumman
11 September 2009

Northrop Grumman PRIVATE / PROPRIETARY
2
Introduction
• IPCC reports have focused considerable attention on climate change and global and regional climate modeling
• However, there is a gap between the science products that climate models produce and the “engineering” products that planners need to:– Support mitigation and adaptation efforts at local and regional levels
• Today I will discuss NG’s strategy and efforts to bridge the gap:– Through Regional Climate (downscaling) and Decision Aid modeling
• Decision Aids translate scientific products from climate models to engineering products for local and regional planners
• We have used NARCCAP data to develop example decision aid products in or to engage with potential users- some examples to follow
Northrop Grumman PRIVATE / PROPRIETARY
3
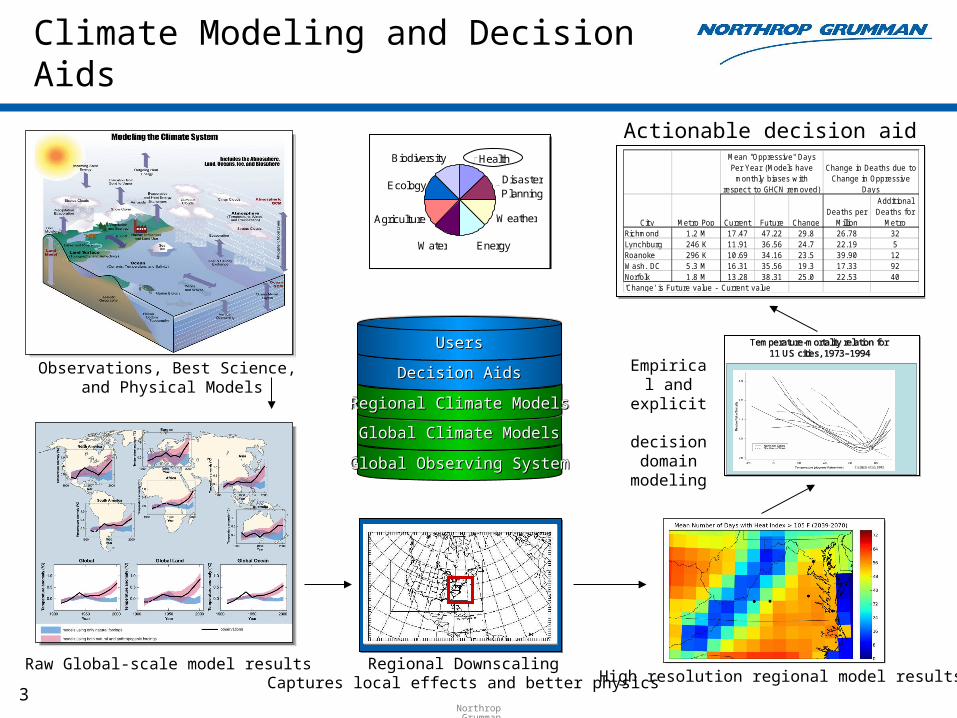
Climate Modeling and Decision Aids
Health
Disaster Planning
Weather
EnergyWater
Agriculture
Ecology
Biodiversity Health
Disaster Planning
Weather
EnergyWater
Agriculture
Ecology
Biodiversity
Global Observing SystemGlobal Observing SystemGlobal Observing SystemGlobal Observing System
Global Climate ModelsGlobal Climate ModelsGlobal Climate ModelsGlobal Climate Models
Regional Climate ModelsRegional Climate ModelsRegional Climate ModelsRegional Climate Models
Decision AidsDecision AidsDecision AidsDecision Aids
UsersUsersUsersUsers
Curriero et al. 2002Curriero et al. 2002
TemperatureTemperature--mortality relation for mortality relation for 11 US cities, 197311 US cities, 1973––19941994
Curriero et al. 2002Curriero et al. 2002
TemperatureTemperature--mortality relation for mortality relation for 11 US cities, 197311 US cities, 1973––19941994
City Metro Pop Current Future ChangeDeaths per
Million
Additional Deaths for
MetroRichmond 1.2 M 17.47 47.22 29.8 26.78 32Lynchburg 246 K 11.91 36.56 24.7 22.19 5Roanoke 296 K 10.69 34.16 23.5 39.90 12Wash. DC 5.3 M 16.31 35.56 19.3 17.33 92Norfolk 1.8 M 13.28 38.31 25.0 22.53 40'Change' is Future value - Current value
Mean "Oppressive" Days Per Year (Models have
monthly biases with respect to GHCN removed)
Change in Deaths due to Change in Oppressive
Days
Observations, Best Science, and Physical Models
Raw Global-scale model results Regional DownscalingCaptures local effects and better physicsHigh resolution regional model results
Empirical and
explicit decision domain
modeling
Actionable decision aid

Northrop Grumman PRIVATE / PROPRIETARY
4
Some Examples of Climate Products
and Decision Aids

Northrop Grumman PRIVATE / PROPRIETARY
5
Some Examples Climate Products andDecision Aids Annual Temperatures for Several Cities
• At most sites, temp increases throughout the current and future periods, although the rate of increase is much higher in the future period
• Biases are evident at some sites and vary by season
Lynchburg Reagan National Roanoke
Richmond Norfolk
Washington, Dulles
Cape Hatteras
Plots below show the mean annual temperature over each site
NARCCAP data from GFDL and CRCM

Northrop Grumman PRIVATE / PROPRIETARY
6
Some Examples Climate Products and Decision Aids Agriculture: VA Growing Season
Bias corrected by month Days in Growing Season
Current Future
Richmond 179 196
Lynchburg 171 185
Roanoke 166 187
Washington DC 157 176
Norfolk 196 228
Use: Agricultural planning, crop selection and rotation, trends in food sources

Northrop Grumman PRIVATE / PROPRIETARY
7
Some Examples Climate Products and Decision Aids Health: VA Heat Index
City Metro Pop Current Future ChangeDeaths per
Million
Additional Deaths for
MetroRichmond 1.2 M 17.47 47.22 29.8 26.78 32Lynchburg 246 K 11.91 36.56 24.7 22.19 5Roanoke 296 K 10.69 34.16 23.5 39.90 12Wash. DC 5.3 M 16.31 35.56 19.3 17.33 92Norfolk 1.8 M 13.28 38.31 25.0 22.53 40'Change' is Future value - Current value
Mean "Oppressive" Days Per Year (Models have
monthly biases with respect to GHCN removed)
Change in Deaths due to Change in Oppressive
Days
Bias corrected by month
Use: City planning, emergency planning, public facility planning, HVAC planning

Northrop Grumman PRIVATE / PROPRIETARY
8
Some Examples Climate Products and Decision Aids Energy: VA Cooling Degree Days and Energy Demand
CityMetro Pop Current Future Change
KWHr/ Capita
Metro MW-Hr
Richmond 1.2 M 1538 2480 942 452 548Lynchburg 246 K 1206 2088 882 423 104Roanoke 296 K 1202 2040 838 377 112Wash. DC 5.3 M 1134 1850 716 286 1518Norfolk 1.8 M 1708 2604 896 430 772'Change' is Future value - Current value
Mean CDD Per Year
Change in Residential
Electricity Demand
Bias corrected by month
Use: Strategic energy planning, future energy demand, power plant needs, alterative power sources
Northrop Grumman PRIVATE / PROPRIETARY
9
Summary
• Northrop Grumman is reaching out to regional and local planners in order to understand user needs for climate information
• The combination of global and regional climate models and user-oriented decision aids can provide critical information to planners
• Using past climatic data as a surrogate for future planning is not consistent with IPCC projections
• Although climate models have weaknesses, they are improving and offer the best guidance for planning today
• Running multiple simulations with multiple climate models creates a range of solutions and permits probabilistic estimates
• Interaction with users is critical to optimally tailoring decision aid development and making best use of climate data
• NARCCAP data have helped us develop example decision aid products and understand issues with the data, such as biases and differences among models

10