northland and coromandel scallop stock assessment …docs.niwa.co.nz/library/public/far2002_60.pdfm....
TRANSCRIPT
ISSN 1175-1584
MINISTRY OF FISHERIES
Te Tautiaki i nga fini a Tangaroa
Northland and Coromandel scallop stock assessment for 2001
M. Cryer
New Zealand Fisheries Assessment Report 2002/60 December 2002

Northland and Coromandel scallop stock assessment for 2001
NIWA P 0 Box 109 695
Newmarket Auckland
New Zealand Fisheries Assessment Report 2002160 December 2002

Published by Ministry of Fisheries Wellington
2002
ISSN 1175-1584
0 Ministry of Fisheries
2002
Citation: cryer, M.. (2002).
Northland and Corornandel scallop stock assessment for 2001. New Zealand Fisheries Assessment Report 2002/60.20 p.
This series continues the informal New Zealand Fisheries Assessment Research Document series
which ceased at the end of 1999.

Cryer, M. (2002). Northland and Coromandel scallop stock assessments for 2001. New Zealand Fisheries Assessment Report 2OOW6O. 20 p.
The Northland and Coromandel scallop fisheries were surveyed by dredge in Apd-May 2001 to predict start-of-season recruited biomass. Areas thought unlikely to support commercial fishing in the 2001 season were not surveyed. Dredge efficiency was not estimated directly, but assumed based on precautionaiy treatment of historical estimates in each fishery. For the Northland fishery, start-of-season biomass (scallops 100 mm or more shell length) was estimated at 871 t greenweight with a C.V. of 27%, or 118 t meatweight at an assumed average recovery rate of 13.5% (meat h m green). For the Commandel fishery, start-of-season biomais (scallops 90 mm or more shell length) was estimated at 577 t greenweight with a C.V. of 27%, or 78 t meatweight at an assumed average recovery rate of 13.5%. For comparison with historical surveys, start-of-season biomass (scallops 100 mm or more shell length) was estimated as 195 t with a C.V. of 29%. Estimates of recruited biomass in 2001 are among the lowest on record for both fisheries, although slightly better than the most recent surveys in both fisheries (1998 in the Northland fishery and 1999 in the Commandel fishery). Using'estimates of Fo.1 h m stochastic yield-per-recruit models as reference rates of fishing mortality, yield for the Northland fishery was estimated as CAY = 45 t (meatweight), and yield for the Coromandel fishery was estimated as CAY = 28 t. Provisional Yield (F'Y) for the Coromandel fishery was estimated (for historical comparison) as PY = 11 t (meatweight). Estimates of biomass and yield for both fisheries are sensitive to assumptions about dredge efficiency in 2001, to exclusion of areas of low scallops density (where it is assumed uneconomic to fish), and to the selection of a reference rate of fishing mortality. The gazetted conversion factor of 8 (equivalent to a recovery of 12.5%) also leads to lower estimates of yield in meatweight than the estimated recovery rate of 13.5%.

1. INTRODUCTION
1.1 Overview
This report summarises research and catch information for the Northland and Coromandel scallop fisheries (Ahipara to Cape Rodney and Cape Rodney to Town Point, respectively). Yield estimates for the commercial season beginning July 2001 are derived using methods after Cryer (1994), Cryer & Morrison (1997), and Annala et al. (2000). This work was funded by the Ministry of Fisheries under projects SCA2000/01 and SCA2000/02.
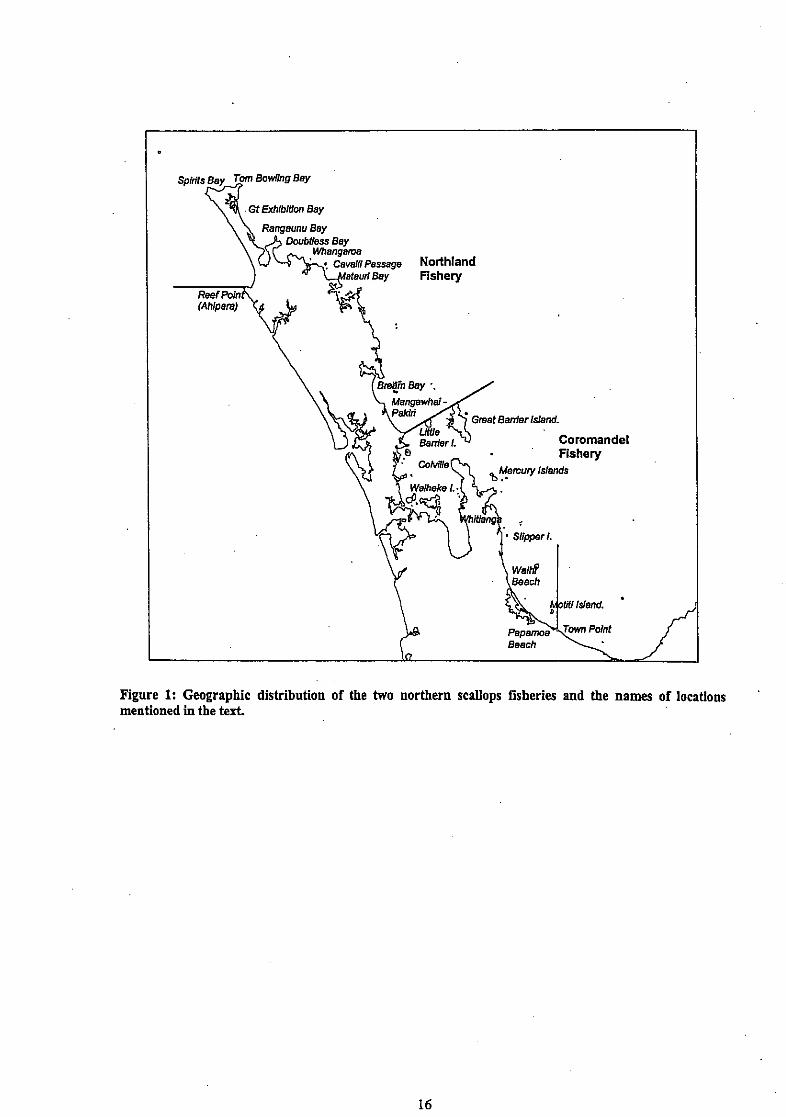
1.2 Description of the fishery
Scallops support regionally important commercial fisheries and an intense non-commercial interest off the northeast coast of the North Island. The Northland fishery is managed under the Quota Management System (QMS) whereas the Coromandel fishery (including the Hauraki Gulf) is a Controlled Fishery. The dividing line between the two runs from Cape Rodney to the northernmost tip . of Great Barrier Island (Figure 1). All commercial fishing is by dredge and self-tipping "box" dredges are preferred to the ring bag designs in common use in southern fisheries. Many effort controls and daily catch limits have been imposed in the past, but both fisheries are limited by explicit seasonal catch limits specified in meatweight, together with some additional controls on dredge size, fishing hours, and (in the Coromandel fishery) non-fishing days. Catch and catch rates h m both fisheries are variable both within and among years, a characteristic of scallop fisheries worldwide (Shumway & Sandifer 1991).
Fishing in the Northland fishery is within discrete beds in Spirits Bay, Tom Bowling Bay, Great Exhibition Bay, Rangaunu Bay, Doubtless Bay, Stephenson Island, the Cavalli Passage, Bream Bay, and the coast between Mangawhai and Pakiri Beach. In the Coromandel fishery, the main beds are found north of Whitianga (at the Mercury Islands), east of Waiheke Island, around Little Barrier and Great Barrier Islands, and in the Bay of Plenty (principally off Waihi, and around Motiti and Slipper Islands). Recreational and Maori customary fishing is undertaken in suitable areas throughout both fisheries, more especially in enclosed bays and harbours, many of which are closed to commercial fishing.
The minimum legal size (MLS) for scallops for commercial and amateur fishers throughout both fisheries was 100 mmuntil 1995. Starting with the 1995 commercial season in July 1995, the MLS for scallops taken commercially from the Coromandel fishery was reduced to 90 mm as part of a package of measures which also included further voluntary closed areas (VCAs) and reduced commercial catch limits. This package was introduced to address concerns expressed by all user groups over the impact of scallop dredging on juvenile scallops.
1.3 ~iterature review
General descriptions of the biology of the New Zealand scallop, Pecten novaezelandiae, were given by Bull (1988) and Cryer (1994), and little new information on the biology has become available subsequently other than an unpublished PhD thesis by Morrison (1998). The New Zealand scallop is one of several species of "fan shell" bivalve molluscs found in New Zealand waters. They have a characteristic round shell with a flat upper valve and a deeply concave lower valve. Scallops inhabit waters to about 60 m deep (to 85 m in the Chatham Islands), but are more common in the Coromandel fishery in depths of 10 to 30 m. Growth rates are spatially and temporally variable; growth to 100 nun takes between 1.5 and 3.5 y-. The maximum age of scallops in unexploited populations is thought to be about 6 or 7 years.

P. novaaelandiae is an hermaphroditic species, each individual carrying both male and female gonads at the same time. Most individuals are sexually mature at about 60 mm, although larger individuals have disproportionately larger gonads. They are extremely fecund and can spawn several times each year (although not all of these spawning events lead to successful spat settlement). Larval development lasts for about 3 weeks, depending on water temperature. Initial spat settlement is by byssus thread attachment to some surface free of sediment (shell hashes, hydroids, spat bags, etc.). The characteristic scallop shell does not develop until a few days after the spat loses the byssus thread and settles to the seabed.
Scallops grow rapidly (albeit with considerable variation), have high natural mortality @i - 0.50 y-I), and exhibit variable recruitment. Such a life history results in fluctuating biomass, catch, and CPUE in most fisheries for scallops, and 'reliance on relatively few year-classes (Caddy & Gulland 1983, Orensanz et al. 1991, Shumway & Sandifer 1991). New Zealand stocks are not extreme examples, but Cryer (1994) examined data from 1978 to 1992 and found that recruited biomass in the Coromandel fishery could not be predicted from historical biomass estimates, nor even from the biomass in the previous year together with estimates of intenrening removals by commercial fishing.
2. Review of the fishery
2.1 TACCs, catch, landings, and effort data
The Northland fishery is managed under the QMS using individual transferable quotas (TI'Q) that are proportions of the Total Allowable Commercial Catch (TACC) (Table 1). The Coromandel fishery is managed as a Controlled Fishery, and catch is limited by seasonal limits which have the same effect as a TACC (Table 2). Seasons run from 15 July to 14 February (Northland fishery) or 21 December (Coromandel fishery). Catch rates are variable both within and among seasons, but the relationship between biomass and CPUE is complex and (declines in) CPUE cannot be used to estimate biomass within a season (Cryer 2001b). Effort data are, therefore, not presented.
2.2 Other information
The incidental impacts of commercial scallop dredges were examined in 1996-97 (Cryer & Monison 1997). Individual-based modelling and stochastic yield-per-recruit (YPR) analysis suggest that neither the 100 mm MLS in force in Northland nor the PY method of estimating yield were optimal (for maximising long term average landings).
2.3 Recreational and Maori customary fisheries
There is an intense amateur interest in scallops throughout the Northland and Coromandel fisheries. Amateurs usually dive or use small dredges, but, in some circumstances, they collect scallops by hand from intertidal areas. To some extent, management of northern scallop fisheries has concentrated on spatial separation of commercial and amateur fisheries through the closure of harbours and enclosed waters to commercial dredging. There remain, however, areas of contention and conflict, some of which were addressed between 1995 and 1999 using additional voluntary or regulated closures.
Recreational catch in 1993-94 from the area shared with the Northland commercial fishery (Bradford 1997) was 4-0 t (green weight). Commercial landings from the Northland fishery in the most comparable period (July 1994 to February 1995 scallop season) were about 1300t, suggesting that, in that year, the recreational catch of scallops was probably less than 5% of total removals. Estimates of
catch by recreational fishers in 1993-94 (Bradford 1997) are 60-70 t fiom the area shared with the Corornandel commercial fishery. Commercial landings liom the Coromandel controlled fishery in the most comparable period (July to December 1994 scallop season) were about 300 t, suggesting that, in that year, the recreational catch of scallops was about 20% of total removals.
2.4 Other sourcesof fishing mortality
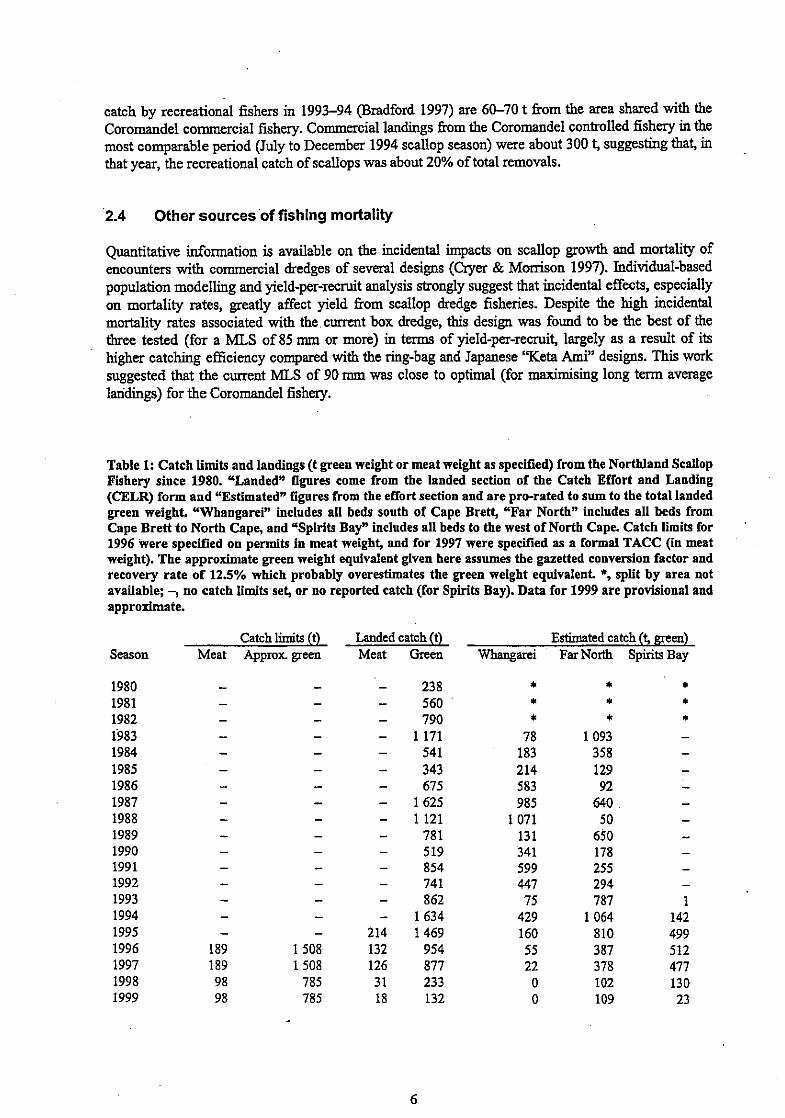
Quantitative information is available on the incidental impacts on scallop growth and mortality of encounters with commercial dredges of several designs (Cryer & Morrison 1997). Individual-based population modelling and yield-per-recruit analysis strongly suggest that incidental effects, especially on mortality rates, greatly affect yield from scallop dredge Iisheries. Despite the high incidental mortality rates associated with the current box dredge, this design was found to be the best of the three tested (for a MLS of 85 mm or more) in terms of yield-per-recruit, largely as a result of its higher catching efficiency compared with the ring-bag and Japanese 'Keta Am?' designs. This work suggested that the current MLS of 90 mm was close to optimal (for maximising long term average landings) for the Coromandel fishery.
Table 1: Catch limits and landings (t green weight or meat weight as specified) from the Northland Scallop Fishery since 1980. "Landed" figures come from the landed section of the Catch Effort and Landing (CELR) form and "Estimatedn figures from the effort section and are pro-rated to sum to the total landed green weight. "Whangarei" includes all beds south of Cape Brett, "Far North" includes all beds from Cape Brett to North Cape, and "Spirits Bay" includes all beds to the west of North Cape. Catch limits for 1996 were specified on permits in meat weight, and for 1997 were specified as a formal TACC (in meat weight). The approximate green weight equivalent given here assumes the gazetted conversion factor and recovery rate of 12.5% which probably overestimates the green weight equivalent. *, split by area not available; -, no catch limits set, or no reported catch (for Spirits Bay). Data for 1999 are provisional and approximate.
Season
1980 1981 1982 1'983 1984 1985 1986 1987 1988 1989 1990 1991 1992 1993 1994 1995 1996 1997 1998 1999
Catch limits (t) Landed catch (t) Estimated catch (f green) Meat Approx green Meat Green FVhangarei FarNorth Spirits Bay

Table 2: Catch limits and landings (t greenweight or meatweight) from the Coromandel fishery since 1980. "Landed" figures come from the landed section of the Catch Effort and Landing (CELR) form and "Estimatedn figures from the effort section and are pro-rated to sum to the total landed greenweight %aurakin includes areas 2X and 2W, "Whitianga" includes 2L and 2K, "Barrier " includes 2R, 2S, and 24, "Bay of Plentyn includes areas 2A-21. Catch limits since 1992 specified on permits in meatweight. "Approximate greenweight" assumes the gazetted conversion factor of 12.5% and probably overestimates the real ereenweieht. * Landings in 1991 include about 400 t from Colville; -, no catch limits set. Data for 1999 areprovisional and appro>mate.
Catch limits Landed
Season
1974 1975 1976 1977 1978 1979 1980 1981 1982 1983 1984 1985 1986 1987 1988 1989 1990 1991 1992 1993 1994 1995 1996 1997 1998 1999
Meat
- - - - - - - - - - - - - - - - - -
154 132 66 86 88
105 110 29
Approximate greenweight
- - - - - - - - - - - - - - - - - -
1232 1056
528 686 704 840 880 230
Green
Estimated H a d Barrier Bavof
Gulf Whitianga Islands
3. RESEARCH
3.1 Stock structure
Little is known of the stock structure of New Zealand scallops. It is currently assumed for management that the Coromandel fishery is separate from the adjacent Northland fishery and from the various west coast harbours, Golden Bay, Tasman Bay, Marlborough Sounds, Stewart Island, and Chatham Island fisheries.
3.2 Resource surveys
Scaled length frequency distributions from major areas of the Northland and Coromandel fisheries since 1993 are shown in Figures 2-5. The fraction of scallops above the MLS of 100 or 90 rnm varies considerably from bed to bed and abundance in most beds varies considerably among years. Full

details of the dredge surveys conductedin Apnl-May 2001 which led to these data were given by Cryer & Parkinson (2002).
I
1 3.3 Other studies
K A R Walshe (1984) estimated the parameters of the von Bertaldfy growth function for scallops in Bay of Plenty and Hauraki Gulf beds using Gulland's (1964) method of analysing tag return data He found both K and L, to be different for these two areas (1.20 vs. 0.38 y'l and 116 vs. 141 mm, respectively). Walshe's estimates have been used for many years to estimate the expected growth of scallops between the midpoint of surveys and the start of the season. Both growth curves derived by Walshe suggest that scallops 95 mm or longer are likely to grow to the legal size of 100 mm during the period between survey and season, and 95 mm has therefore been used as a "critical size" to divide scallops likely to recruit fiom those unlikely to recruit by the start of each season. Analysis of L.G. Allen's (unpublished) data by Cryer & Parkinson (1999b) suggested that the growth rate of scallops close to 100 mm long was variable between years and with depth. This could render start-of- season biomass estimates sensitive to growth rate between survey and season and to the depth distribution of scallop biomass. The implications of these results have not been examined in detail, so it is assumed for the purpose of predicting start-of-season biomass that scallops of 95 mm or over at the time of the survey are likely to grow to 100 mm by the start of the season, and that scallops of 85 mm or over at the time of the survey are likely to grow to 90 mm by the start of the season. Until 1997, start-of-season biomass of 100 mm scallops was used to estimate yield for both fisheries (notwithstanding the lower MLS in the Coromandel fishery). CAY estimators, using the predicted start-of-season biomass at the appropriate MLS, have been used since.
Cryer (2001a) summarked estimates of the natural mortality rate of scallops in the Coromandel fishery. The various experiments generated estimates of M with an average of about 0.47 y" but, because some experiments used enclosures and are likely to have underestimated M, he suggested the adoption of a value of 0.50 y-' for biomass and yield estimates.
3.4 Biomass esimates
Composite dive-dredge surveys were used throughout the Northland fishery between 1992 and 1997, except in 1993 when only divers were used (Table 3). Diver surveys of the Whitianga beds were canied out almost annually between 1978 and 1997 (Table 4), and composite dive-dredge surveys covering most commercially exploited beds in the Coromandel fishery were conducted annually between 1992 and 1997. All diving was discontinued in 1998 in favour of (cheaper) dredge-only surveys. The Northland fishery was not surveyed in 1999 or 2000, and the Coromandel fishery was not surveyed in 2000. Dredge surveys of both fisheries were conducted in 2001 (Cryer & Parkinson 2002). Where dredges have been used, absolute biomass must be estimated using multiplim to correct for the efficiency of the particular dredges used. Previously, these multipliers were estimated by comparing dredge counts with diver counts in experimental areas (e.g., Cryer & Parkinson 1999a & b). However, different vessels were used in 2001 and no trials were conducted into the efficiency of the dredges used. Both 2001 surveys were therefore corrected using a precautionary interpretation of historical dredge efficiency estimates (Cryer & Parkinson 2002).
The 2001 biomass estimates for the Northland fishery in Table 3 were calculated using historical average dredge efficiency. This is not the same as the more precautionary approach used to estimate biomass for yield calculations. However, they show that biomass in Spirits Bay and Rangaunu Bay was similar in 2001 to the previous survey in 1998. The beds at Stephenson Island (Whangaroa) and Doubtless Bay both had their lowest ever estimates of recruited biomass, even using historical average dredge efficiency, and they are unlikely to contribute to the fishery in 2001. The bed at Bream Bay

seems to have improved from a nadir in 1998 (the 1997 estimate of 580 t for Bream Bay is based on very few samples and is probably unreliable). Beds at Great Exhibition Bay, through the Cavalli Passage, and at Mangawhai and PakLi Beach were not surveyed but were expected by fishers not to be productive in 2001.
Table 3: Estimated recruited biomass of scallops (at the time of surveys) in various component beds of the Northland scallop fishery since 1992, assuming historical average dredge efficiency of 63.7%. - indicates no survey in a given year. Estimates of biomass given for 1993 are probably negatively biased, especially for Rangaunu Bay (*), by the restriction of diving to depths under 30 m, and aU estimates before 1996 are negatively biased by the lack of surveys in Spirits Bay (f). Totals also include biomass from less important beds at Mangawhai, Pakiri, around the CavaUi Passage, in Great Exhibition Bay, and Tom Bowling Bay when these were surveyed. Commercial landings in each year for comparison can be seen in Table 1, wherein "Far Northn landings come from beds described here as "Whangaroa", "Doubtlessn and "Rangaunun.
Biomass (t) Year Bream Bay Whangaroa Doubtless Rangaunu Spirits Bay Total
The beds at the Mercury Islands, close to Whitianga, have been one of the mainstays of the Coromandel fishery since the fishery began. Biomass has varied by about an order of magnitude, with seemingly little link to fishing pressure (e.g., C~yer 1994). However, the two most recent biomass estimates have been the worst on record, and eight of the ten lowest estimates in the history of the fishery have been since 1993 (Table 4). Historically, the second most important bed in the Coromandel fishery was at Waiheke. This bed underwent a rapid decline in the late 1980s and was essentially unfished between 1993 and 1996. Following very low estimates in 1994 to 1996, the biomass at Waiheke appeared to increase in 1997 and 1998, but was very low in 1999. Despite the presence of very large numbers of scallops in 2001, the recruited biomass was again low because most of the scallops were small. The bed at Little Barrier Island was highly productive in the mid 1990s, but surveys in 1998 and 1999 showed relatively low populations, and the 1999 biomass was the smallest on record. The 2001 biomass was much higher than in 1998 and 1999, but not as high as between 1996 and 1998.

Table 4: Estimated recruited biomass (at the time of surveys) of scallopsof 95 mm or more shell length in various component beds of the Coromandel scallop fishery since 1978 using historical average dredge efficiency. -indicates no survey in a given year, *not all beds surveyed, estimate of total biomass probably si@cantly biased low. Commercial landings in each year for comparison are given in Table 1, wherein @Bay of Plentyn landings come from beds described here as "Waihin and "Motiti".
Biomass (t) Year Waiheke Whitianga L. Barrier Waihi Motiti Total
3.5 Yield estimates
3.5.1 Estimation of Maximum Constant Yield (MCY)
MCY is not normally estimated for scallops and, given the highly variable nature of most wild scallop fisheries, is likely to be close to zero.
3.5.2 Estimation of Current Annual Yield (CAY)
The choice among reference mortality rates for estimating yield is not a simple one. It is probably useful to use Caddy's (1998) notation of target reference points (TRF') and limit reference points (LFV) where reference points can be measures of fishing mortality Q or biomass (B). F,, &om a yield-per-recruit model was the classical TRP (Caddy 1998), but may be too high as a target (Annala et al. 2000) and has more recently been generally regarded as an LRP (a "threshold" beyond which fishing mortality should not be increased) and Fo.1 has been substituted as a ''target? (Caddy 1998). Mace (1994) recommended Fa% as a "default" TRP in the "common situation where there is adequate information to place bounds on all relevant life history parameters except those characterising the stock-recruit relationship" (although Collie & Gislason (2001) list F m as a LRP). Mace's (1994) simulations showed that, in her model, Fa% was similar to F0., when recruitment and maturity

schedules coincidei and approximated FW for fisheries of average to high resilience to fishing. She also affirmed Mace & Sissenwine's (1993) proposition that the default overfishing threshold should be 20% Bo for stocks of at least average resilience to fishing. However, Myers et al. (1994) considered this threshold (20% of virgin stock size) the least desirable and the least precautionary of those they examined. The available information and models allowed the estimation of F, as a LRP, and Fo,I and FmasTRPs in2001.
Cryer & Monison (1997) modelled yield-per-recruit in the Commandel fishery, but their model was modified to incorporate growth parameters more suited to the Northland fishery and used to estimate reference fishing mortality rates for that fishery. For an assumed rate of natural mortality of M = 0.50 y-I, Fo.l was estimated as 0.550 y-l, and F,, as 0.700 y-'. Fw, was not estimated. Yield estimates based on Fo., should probably be preferred as targets over that based on F, (which might be considered a limit). The following modified version of the Baranov equation given by Cryer & Monison (1997) should be used in their application.
where Bj,, is the estimate of recruited biomass in July. Natural mortality is assumed to act in tandem with fishing mortality for the fist 7 months of the year, the length of the cwent Northland commercial scallop season.
The recruited biomass of scallops 100 mm in shell length or more in the Northland fishery was estimated by Cryer & Parkinson (2002) to be 1010 t green weight in 2001. CAY was calculated using this biomass and the reference fishing mortality rates Fo.l and F,, as folIows (the conversion rate from green weight to meat was assumed to be 13.5%, Cryer & Parkinson 1999a):
For Fo.1, CAY = 0.6535 * 0.690 * 871 = 323 t (green) or 44 t (meat)
For F,, CAY = 0.7059 * 0.6290 *871 = 387 t (green) or 52 t (meat)
These estimates of CAY would have a C.V. at least as large as the estimate of start of season recruited biomass (27%) and relate to the surveyed beds only. The level of risk to the putative Northland scallop stock of fishing at the estimated CAY level cannot be determined.
Ciyer & Momson's (1997) estimates of F40% (0.514 y-I), Fo., (0.508 y-'), and F,, (0.650 y-') (all assuming M = 0.50 y-l) were used to estimate yield as CAY. Yield estimates basedon F w and Fo.l should probably be preferred as targets over that based on F,, (which might be considered a limit). Because of the derivation of these estimates, they should be applied to the modified version of the Baranov equation given by Cryer & Momson
where B,d is the estimate of recruited biomass in July. In this formulation of the Baranov equation, natural mortality is assumed to act in tandem with fishing mortality for the first 5 months of the year, the length of the current Coromandel commercial scallop season.
The recruited biomass of scallops 90 mm i n shell length or more in the Coromandel fishery was estimated by Cryer & Parkinson (2002) to be 577 t greenweight in 2001. CAY was calculated using
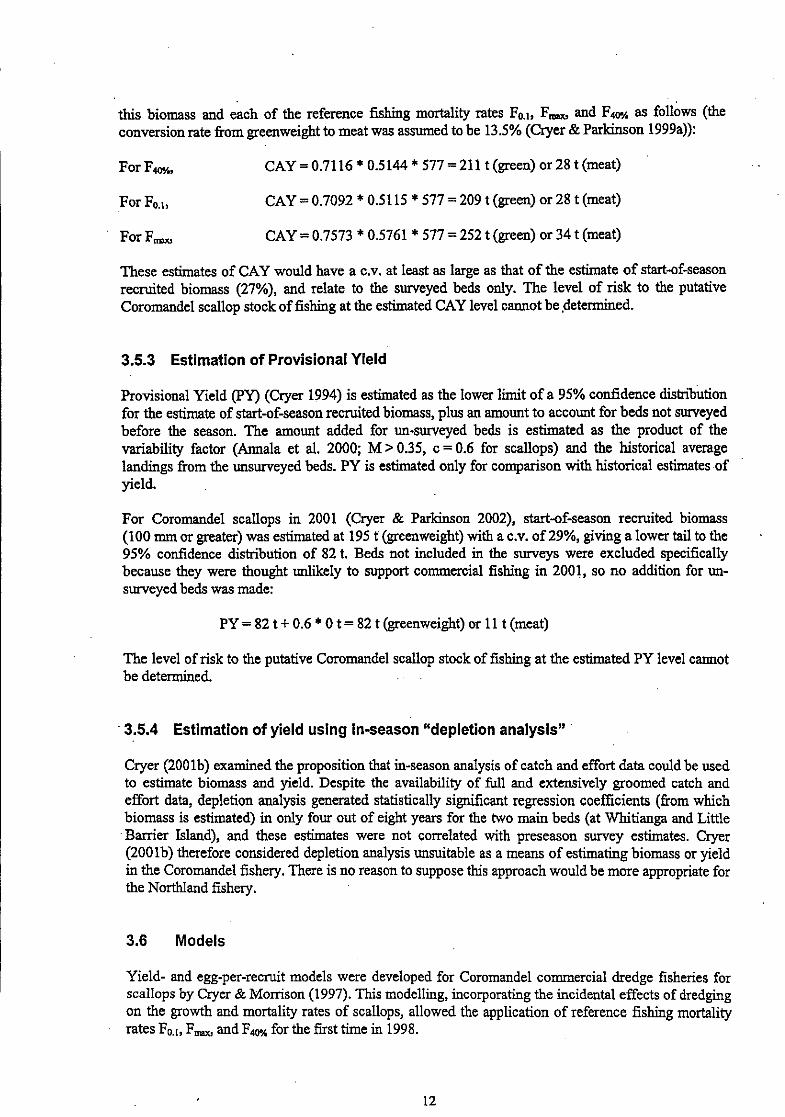
this biomass and each of the reference fishing mortality rates F0.1, F,, and FwL as follows (the conversion rate from greenweight to meat was assumed to be 13.5% (Cryer & Parkinson 1999a)):
For F40K, CAY =0.7116 * 0.5144 * 577 =211 t (green) or 28 t (meat)
For Fo.I, CAY = 0.7092 * 0.51 15 * 577 = 209 t (green) or 28 t (meat)
For F,, CAY = 0.7573 * 0.5761 * 577 = 252 t (green) or 34 t (meat)
These estimates of CAY would have a C.V. at least as large as that of the estimate of start-of-season recruited biomass (27%), and relate to the surveyed beds only. The level of risk to the putative Coromandel scallop stock of fishing at the estimated CAY level cannot be fietermined.
3.5.3 Estimation of Provisional Yield
Provisional Yield (PY) (Cryer 1994) is estimated as the lower limit of a 95% confidence distribution for the estimate of start-of-season recruited biomass, plus an amount to account for beds not surveyed before the season. The amount added for un-surveyed beds is estimated as the product of the variability factor (Annala et al. 2000; M > 0.35, c = 0.6 for scallops) and the historical average landings from the unsurveyed beds. PY is estimated only for comparison with historical estimates of yield.
For Coromandel scallops in 2001 (Cryer & Parkinson 2002), start-of-season recruited biomass (100 mm or greater) was estimated at 195 t (greenweight) with a C.V. of 29%, giving a lower tail to the 95% confidence distribution of 82 t. Beds not included in the w e y s were excluded specifically because they were thought unlikely to support commercial fishing in 2001, so no addition for un- surveyed beds was made:
I PY = 82 t + 0.6 * 0 t = 82 t (greenweight) or 11 t (meat)
The level of risk to the putative Coromandel scallop stock of fishing at the estimated PY level cannot be determined. . .
I .3.5.4 Estimation of yield using in-season "depletion analysis"
Cryer (2001b) examined the proposition that in-season analysis of catch and effort data could be used to estimate biomass and yield. Despite the availability of full and extensively groomed catch and effort data, depletion analysis generated statistically si&cant regression coefficients (from which biomass is estimated) in only four out of eight years for the two main beds (at Whitianga and Little Barrier Island), and these estimates were not correlated with preseason survey estimates. Cryer (2001b) therefore considered depletion analysis unsuitable as a means of estimating biomass or yield in the Coromandel fishery. There is no reason to suppose this approach would be more appropriate for the Northland fishery.
i 3.6 Models
Yield- and egg-per-recruit models were developed for Coromandel commercial dredge fisheries for scallops by Cryer & Momson (1997). This modelling, incorporating the incidental effects of dredging on the growth and mortality rates of scallops, allowed the application of reference fishing mortality rates Fo.,, F,, andF4ML for the first time in 1998.

The 1999 biomass was, for poorly understood reasons, the lowest ever recorded in the Coromandel fishery. There was no survey in Northland in that year, but fishing was, anecdotally, poor. There were no surveys in 2000. There have been large fluctuations in biomass in the past 20 years, and years of low biomass have sometimes been followed by years of high biomass. However, both fisheries were poor in 2000, and the 2001 biomass estimates give cause for only cautious optimism. Based on analysis of catch and effort data, Cryer (2001b) suggested that high mortality occurred between survey and season in 1998 in the Coromandel fishery, and may have occurred in the Northland fishery too and continued since. The cause of this mortality is not known, but an associated and very visible "black gill" condition was reported in several species of filter feeding bivalves around the Coromandel Peninsula in 1999 oggles et al. 2000). Diggles et al. concluded that the black gill condition was probably not indicative of a causative disease agent (although Rickettsiales like organisms were found in animals with the condition), q d suggested that broad scale environmental conditions were probably responsible in some way.
Whatever the cause of any high mortality in 1998 and 1999, both fisheries still appear to be "depressed" in 2001, and this suggests that caution should be exercised when setting catch limits. The lack of strong correlation between biomass and fleet average catch rate in the Whitianga bed (Cryer 2001b) suggests that it may be possible for fishers to catch or kill a large proportion of scallops 90 mm shell length or more before the fishery becomes uneconomic. The consequences of such a depression in recruited and spawning biomass are not known as the current comme~ial MLS of 90 mm has been in force in the Coromandel fishery only since 1995. Maturation of scallops at 60 rnm shell length, well below the MLS, does not appear to protect this stock fiom serious depression of spawning biomass, probably because small scallops carry few eggs compared with larger individuals. Stochastic egg-per-recruit (EF'R) modelling (Cryer & Morrison 1997) suggested that, assuming knife edge recruitment at 90 mm, fishing at Fo.1 or F, would reduce the lifetime fecundity of a cohort to about 33-40% of its virgin level. Population fecundity in a given year would be reduced to the same level under constant recruitment. EPR modelling (Cryer & Monison 1997) suggested that unrestrained fishing mortality could reduce population fecundity to less than 15% of its virgin level under constant recruitment, especially if there were large incidental effects on small but mature scallops of 60-90 mm shell length. The recent series of low biomass years in the Coromandel fishery (evidence is scarcer for the Northland fishery) suggests that recent average recruitment has been low, and equilibrium estimates of population fecundity relative to virgin levels are likely to be optimistic. Thus, under the 90 mm MLS, failure to restrain fishing mortality could result in depression of the effective spawning stock size below 15% of the unfished level. Although recruitment overfishing is rarely considered a serious issue for bivalve molluscs (e.g., Hancock 1973), relationships between stock size and subsequent recruitment have been published for scallops and other invertebrates (e.g., scallops, Peterson & Summerson 1992, Peterson et al. 1996; sea urchins, Quinn et al. 1993, Pfister & Bradbury 1996; abalone, Prince et al. 1988, Tegner 1993; clams, Peterson 2002; and whelks, Stoner & Ray-Culp 2000). There is, therefore, accumulating evidence that recruitment in highly fecund invertebrate species may be influenced by stock size under some circumstances, and it would be prudent to restrain fishing mortality below F, as a precaution against recruitment overfishing. Full stochastic population modelling would be useful to examine the possible effects of variable recruitment and growth on the estimates ofreference fishing mortality given for this stock by Cryer & Morrison (1 997).
5. ACKNOWLEDGMENTS
This work was funded by the Ministry of Fisheries under contracts SCA2000101 and SCA2000102. Thanks to skippers and crew on board dredge boats for their assistance. Members of the Shellfish
Fishery Assessment Working Group reviewed an early draft and Dave Gilbert's review was much appreciated, especially for his remarkable attention to detail.
' 6. REFERENCES
Annala, J.H.; Sullivan, K.J.; O'Brien, C.J. (comps.) (2000). Report from the Fishery Assessment Plenary, May 2000: stock assessments and yield estimates. Ministry of Fisheries, Wellington. 495 p. (Unpublished report held at NIWA library, Wellington.)
Bradford, E. (1997). Estimated recreational catches from Ministry of Fisheries North region marine recreational fishing surveys, 1993-94. New Zealand Fisheries Assessment Research Document 9717.16 p. (Unpublishedreport held at NIWA ll'brary, Wellington.)
Bull, M.F. (1988). New Zealand scallop. New Zealand Fisheries Assessment Research Document 88/25. 16 p. (Unpublished report held at NlWA library, Wellington)
Caddy, J.F. (1998). A short review of precautionary reference points and some proposals for their use in data-poor situations. FA0 Fisheries Technical Paper No. 379.30 p.
Caddy, J.F.; Gulland, J.A. (1983). Historical patterns of fish stocks. Marine Policy 7: 267-278. Collie, J.S.; Gislason, H. (2001). Biological reference points for fish stocks in a multispecies context.
Canadian Journal of Fisheries andAquatic Sciences 58: 2167-2176. Cryer, M. (1994). Estimating CAY for northern commercial scallop fisheries: a technique based on
estimates of biomass and catch from the Whitianga bed. New Zealand Fisheries Assessment Research Document 94118.21 p. (Unpublished report held at NIWA library, Wellington.)
Cryer, M. (2001a). Coromandel scallop stock assessment for 1999. New Zealand Fisheries Assessment Report 2001/9.18 p.
Cryer, M. (2001b). An appraisal of an in-season depletion method of estimating biomass and yield in the Coromandel scallop fishery. New Zealand Fisheria Assessment Report 2001/8.28 p.
Cryer, M.; Morrison, M. (1997). Yield per recruit in northern commercial scallop fisheries: inferences fiom an individual-based population model and experimental estimates of incidental impacts on growth and survival. Final Report to Mjnistry of Fisheries on Project AKSC03. 67 p. (Unpublished report held by Ministry of Fisheries, Wellington.)
Cryer, M.; Parkinson, D.M. (1999a). Dredge surveys and sampling of commercial landings in the Northland and Coromandel scallop fisheries, May 1998. hTKA Technical Report 69.63 p.
Cryer, M.; Parkinson, D.M. (1999b). Dredge surveys of scallops in the Coromandel scallop fishery, May 1999. Working Document for Ministry of Fisheries Shellfish Fishery Assessment Working Group Meeting 9 June 1999. 24p. (Unpublished report held by Ministry of Fisheries, Wellington.)
Cryer, M.; Parkinson, D.M. (2002). Dredge surveys of scallops in the Northland and Coromandel scallop fisheries, 2001. Draft New Zealand Fisheries Assessment Report 200U00.00 p.
Diggles, B.; Chang, H.; Smith, P.; Uddstrom, M.; Zeldis, J. (2000). A discolouration syndrome of commercial bivalve molluscs in the waters surrounding the Coromandel Peninsula. Final Research Report for Ministry of Fisheries Project MOF1999104B. (Unpublished report held by Ministry of Fisheries, Wellington.)
Gulland, J.A. (1964). Manual of methods for fish population analysis. FA0 Fisheries Technical Paper No. 40.60 p.
Hancock, D.A. (1973). The relationship between stock and recruitment in exploited invertebrates. Rapports et Process V e r b e m de la Reunion du Conseil Internationale pour I'Exploration dela Mer 164: 113-131.
Mace, P.M. (1994). Relationships between common biological reference points used as thresholds and targets of fisheries management strategies. Canadian Journal of Fisheries and Aquatic Sciences 51: 110-122.
Mace, P.M.; Sissenwine, M.P. (1993). How much spawning per recruit is enough? Canadian Special Publication in the Fisheries and Aquatic Sciences 120: 101-118. -

Morrison, M. (1998). Population dynamics of the scallop, Pecten novaezelandiae, in the H a d Gulf. Unpublished PhD thesis, University of Auckland, Auckland, New Zealand
Myers, RA.; Rosenberg, A.A.; Mace, P.M.; Barrowman, N.; Restrepo, V.R (1994). In search of thresholds for recruitment overfishing. ICES Journal ofMarine Science 51: 191-205.
Orensanz, J.M.; Panna, A.M.; Iribarne, 0.0. (1991). Population dynamics and management of nafxral stocks. Ch. 13 In Shumway, S.E. (ed.) Scallops: biology ecology and aquaculture. Developments in Aquaculture and Fisheries Science, Elsevier, Amsterdam.
Peterson, C.H. (2002). Recruitment overfishing in a bivalve mollusc fishery: hard clams (Mercenaria mercenaria) in North Carolina. Canadian Journal of Fisheries and Aquatic Sciences 59: 96- 104.
Peterson, C.H.; Summerson, H.C. (1992). Basin-scale coherence of population dynamics of an exploited marine invertebrate, the bay scallop: implications of recruitment limitation. Marine Ecology Progress Series 90: 257-272.
Peterson, C.H.; Summerson, H.C.; Leuttich, RA. (1996). Response of Bay scallops to spawner transplants: a test of recruitment limitation. Marine Ecology Progress Series 132: 93-107.
Pfister, J.D.; Bradbury, A. (1996). Harvesting red sea urchins: recent effects and future predictions. Ecological Applications 6: 298-3 10.
Prince, ID:; Sellers, T.L.; Ford, W.B.; Talbot, S.R. (1988). Confirmation of a relationship between localized abundance of breeding stock and recruitment for Haliotis rubra Leach (Molluscs: Gastropoda). Journal of Experimental Marine Biology and Ecology 122: 91-104.
Quinn, J.F.; Wing, SR; Botsford, L.W. (1993). Harvest refugia in marine invertebrate fisheries: models and application to the red sea urchin, Sfrongylocenfrohts franciscanus. American Zoology 33: 537-550.
Shumway, S.E.; Sandifer, P.A. (eds) (1991). Scallop biology and culture. Selected papers &om the 7th International Pectinid Workshop. World Aquaculture Society, Baton Rouge, Louisiana, USA.
Stoner, A.W.; Ray-Culp, M. (2000). Evidence for Allee effects in an over-harvested marine gastropod: densitydependent maturing and egg production. Marine Ecology Progress Series 202: 297-302.
Tegner, M.J. (1993). Southern California abalone - can stocks be rebuilt using marine harvest refugia? Canadian Journal ofFisheries and Aquatic Sciences 50: 2010-2018.
Walshe, K.A.R. (1984). A study to determine the optimum number of Iicences for the Tauranga commercial scallop fishery based on an optimum yield estimate. Unpublished report for Diploma in Business and Administration, Massey University, Palmerston North, New Zealand.
Great Benier Island.
Corornandel
Figure 1: Geographic distribution of the two northern scallops fisheries and the names of locations mentioned in the text.

Figure 2: Approximate scaled length frequency distributions (thousands of animals) for the Northland scallop fishery, corrected using historical average dredge efficiency by size. Left panel, Spirits Bay and Tom Bowling Bay; right panel, Rangaunu Bay and Doubtless Bay. There were no surveys in Spirits Bay or TomBowling Bay before 1996.

Figure 3: Approximate scaled length frequency distributions (thousands of animals) for the Northland scallop fishery, corrected using historical average dredge etficiency by size. Left panel, Stephenson Island (Whangaroa); right panel, BreamBay. The 1997 result for BreamBay was based on very few samples and may be unreliable.

BOO 20 40 80 60 100 120
MO 400
300
mo
Figure 4: Approximate scaled length frequency distributions (thousands of animals) for the Coromandel scallop fishery, corrected using historical average dredge efficiency by size. Left panel, Mercury Islands; right panel, Little Barrier Island. There were no surveys at Little Barrier Island before 1995.

two
500 :I 0 0 20 40 €4 80 100 120
1000
500 :E 0 80 100 120
t5W ", t w o
5M)
0 0 20 40 60 BO 1W 120
2500 , I
1WO
two
500
0
Figure 5: Approximate scaled Length frequency distributions (thousands of animals) for the Coromandel scallop fishery, corrected using historical average dredge eff~ciency by size class. Left panel, Waiheke Island; right panel, Motiti and Papamoa Beach. There were no surveys at Motiti-Papamoa before 1995.