northern hemisphere climate variability over the past few hundred years: proxy-based reconstructions...
Post on 20-Dec-2015
216 views
TRANSCRIPT

Northern Hemisphere Climate Variability
over the Past Few Hundred Years: Proxy-based Reconstructions of the winter NAM and PNA
Justin J. Wettstein
John M. [email protected]
du
Climate Impacts Group Seminar January 4th, 2005

N.H. Climate Variability over the Past Few Hundred Years: NAM/PNA Reconstructions
OUTLINE
NAM ? PNA ?
Existing Proxy-based Reconstructions
A more parsimonious approach
Where from here?

NAM ? PNA ?

N.H. Climate Variability over the Past Few Hundred Years: NAM/PNA Reconstructions
Northern Annular Mode (NAM)Pacific North America [pattern] (PNA)
PNA:Sea Level Pressure
NAM:Sea Level Pressure
Max in both figures is ~6 millibars per unit change in the NAM / PNA index
N.H. Climate Variability over the Past Few Hundred Years: NAM/PNA Reconstructions
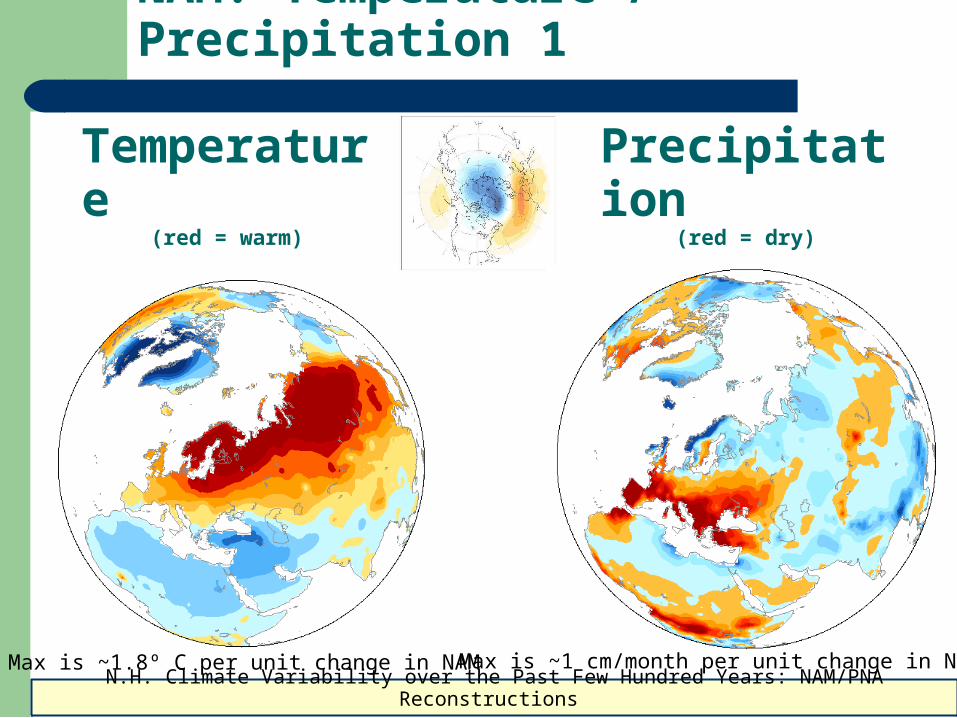
NAM: Temperature / Precipitation 1
Max is ~1.8º C per unit change in NAM Max is ~1 cm/month per unit change in NAM
Temperature(red = warm)
Precipitation(red = dry)

N.H. Climate Variability over the Past Few Hundred Years: NAM/PNA Reconstructions
NAM: Temperature / Precipitation 2
Max is ~1.8º C per unit change in NAM Max is ~1 cm/month per unit change in NAM
Temperature(red = warm)
Precipitation(red = dry)
N.H. Climate Variability over the Past Few Hundred Years: NAM/PNA Reconstructions
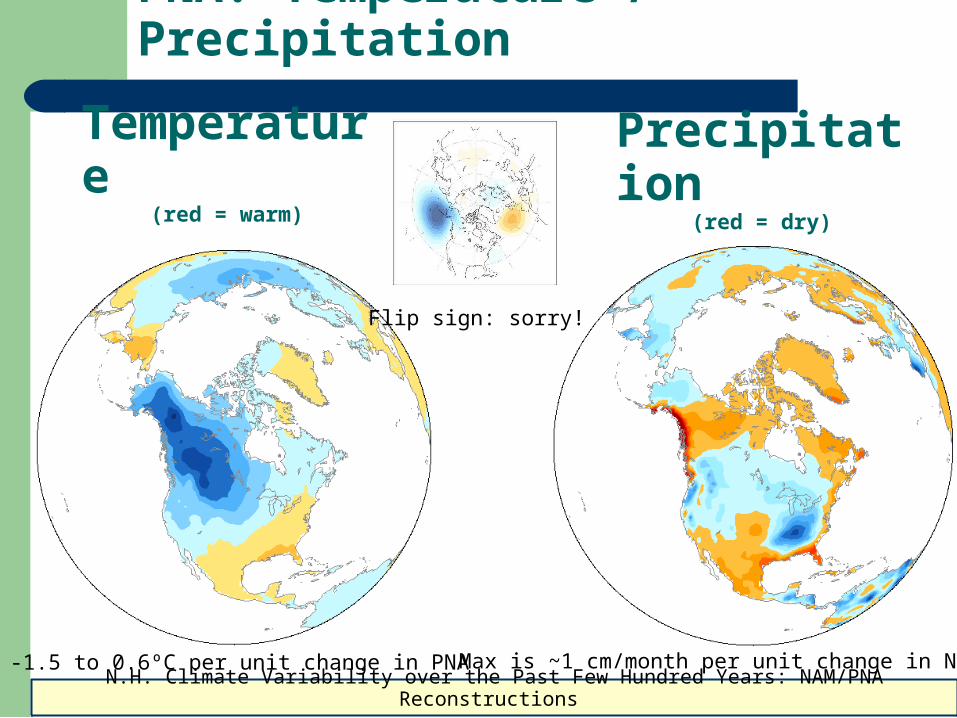
PNA: Temperature / Precipitation
~ -1.5 to 0.6ºC per unit change in PNA Max is ~1 cm/month per unit change in NAM
Temperature(red = warm)
Precipitation(red = dry)
Flip sign: sorry!

N.H. Climate Variability over the Past Few Hundred Years: NAM/PNA Reconstructions
Time Series of the NAM / PNA

Existing Proxy-based Reconstructions
N.H. Climate Variability over the Past Few Hundred Years: NAM/PNA Reconstructions
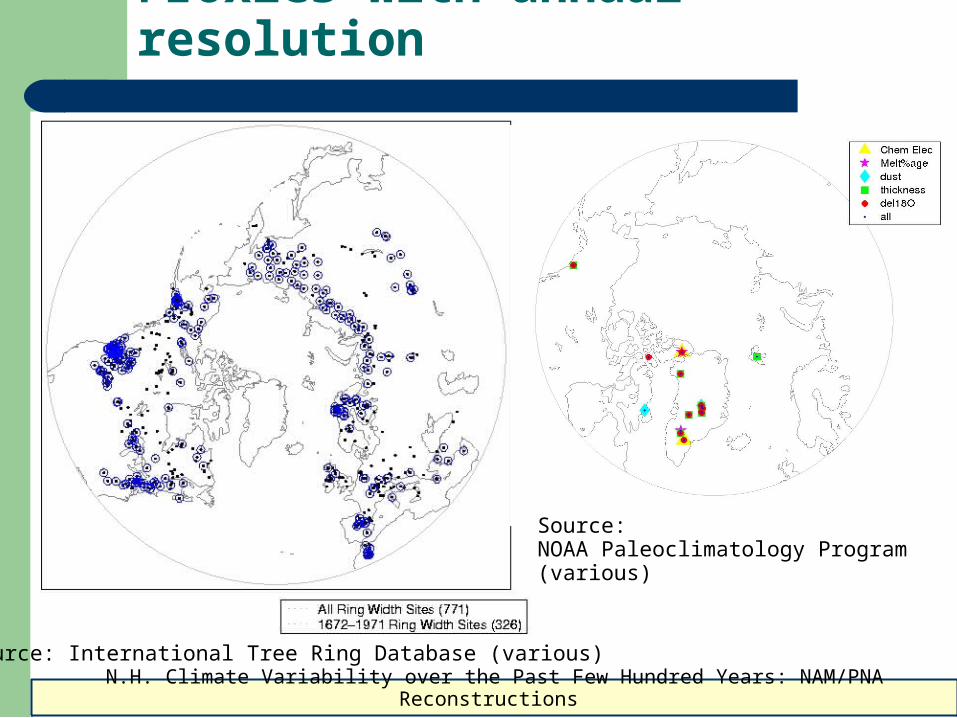
Proxies with annual resolution
Source: International Tree Ring Database (various)
Source: NOAA Paleoclimatology Program (various)

N.H. Climate Variability over the Past Few Hundred Years: NAM/PNA Reconstructions
NAO Reconstructions: Summary
[Jones and Mann, 2004 (Reviews of Geophysics: Fig 6b)]
Jones+ 1997: Observed NAO (1821-Present)
Luterbacher+ 2002: Multi-proxy, documentary records, met data (1500-1990)
Cook+ 2002: Multi-proxy (1400-1979)
Vinther+ 2003: Greenland ice cores (1250-1970)
Others: Appenzeller+ (1998), Gluek and Stockton (2001), Cullen+ (2001)

N.H. Climate Variability over the Past Few Hundred Years: NAM/PNA Reconstructions
NAO Reconstruction: 1 example
Cook et al., 2002 (J. Climate)

N.H. Climate Variability over the Past Few Hundred Years: NAM/PNA Reconstructions
Cook et al., 2002: Proxy weights

N.H. Climate Variability over the Past Few Hundred Years: NAM/PNA Reconstructions
PNA-like Reconstruction
Moore et al., 2002 (Nature)
See also: Minobe, 1997 (GRL)
Accumulation vs. time at site

N.H. Climate Variability over the Past Few Hundred Years: NAM/PNA Reconstructions
PDO reconstruction: example(s)
Biondi et al., 2001 (J. Climate)
Others: Gedalof and Smith, 2001 Evans et al., 2000
Urban et al., 2000 Linsley et al., 2000

N.H. Climate Variability over the Past Few Hundred Years: NAM/PNA Reconstructions
PDO meta-reconstruction: example
Gedalof et al., 2002 (GRL)
• PC-based reconstruction of the PDO index using 5 existing reconstructions
• PC1 kept, PDO correlation is 0.64 from ~1900 - 1990
• “PDO may not have been an important organizing structure during the 19th century” SST regression

A more parsimonious approach

N.H. Climate Variability over the Past Few Hundred Years: NAM/PNA Reconstructions
Approach
1. Species-by-species
2. Trees must lie in a region where the temperature and/or precipitation signal of the NAM / PNA is robust
3. Growth of a particular species must be significantly and consistently related to temperature or precipitation during the winter preceding the annual growth ring
4. Ring width time series must be available 1711-1971 so only one statistical model is required
5. Each candidate predictor must add to both the calibration and cross-validated skill of the model, or it is removed

N.H. Climate Variability over the Past Few Hundred Years: NAM/PNA Reconstructions
Good locations: NAM temperature

N.H. Climate Variability over the Past Few Hundred Years: NAM/PNA Reconstructions
Good locations: NAM precipitation

N.H. Climate Variability over the Past Few Hundred Years: NAM/PNA Reconstructions
Bad locations

N.H. Climate Variability over the Past Few Hundred Years: NAM/PNA Reconstructions
Prior winter proxy skill: monthly
Black Pine: Mediterranean Temperature (good proxy)
Norway Spruce: Mediterranean Temperature (poor proxy)

N.H. Climate Variability over the Past Few Hundred Years: NAM/PNA Reconstructions
Poor seasonal correlations: 2 ex.
Scots Pine Minimum Density temperature correlation
Camp century temperature correlation

N.H. Climate Variability over the Past Few Hundred Years: NAM/PNA Reconstructions
Depends on where you look
Norway Spruce Temp. Correlation Norway Spruce Precip. Correlation
N.H. Climate Variability over the Past Few Hundred Years: NAM/PNA Reconstructions
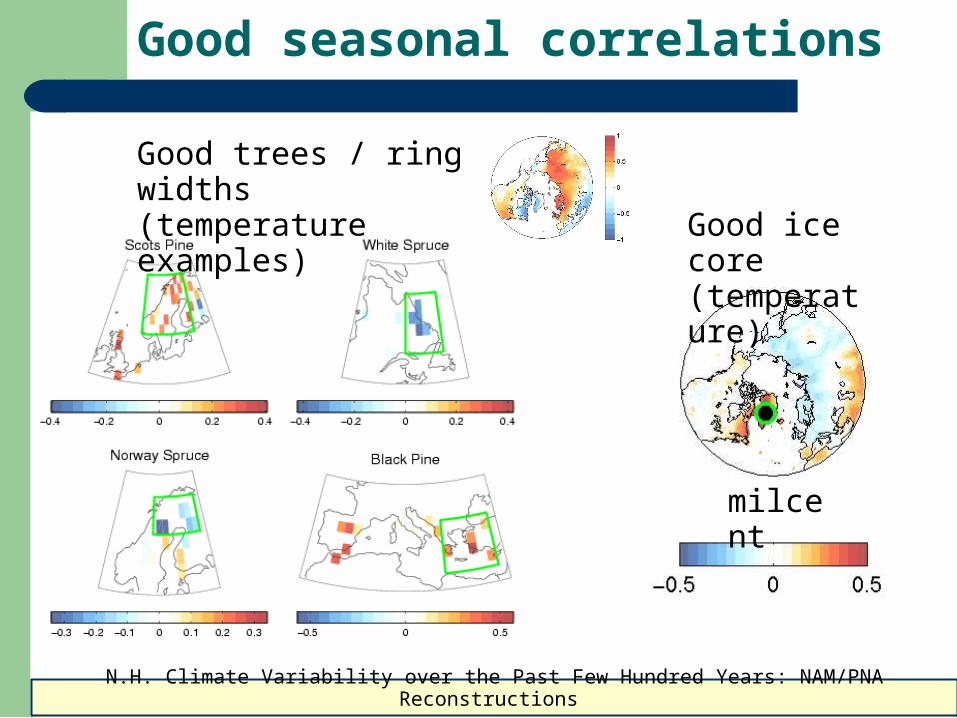
Good seasonal correlations
Good trees / ring widths(temperature examples)
milcent
Good ice core(temperature)

N.H. Climate Variability over the Past Few Hundred Years: NAM/PNA Reconstructions
Summary of results

Where from here?

N.H. Climate Variability over the Past Few Hundred Years: NAM/PNA Reconstructions
Frequency dependent 1

N.H. Climate Variability over the Past Few Hundred Years: NAM/PNA Reconstructions
Frequency dependent 2
correlation

N.H. Climate Variability over the Past Few Hundred Years: NAM/PNA Reconstructions
Future Work
66 annually-resolved records from ice cores– Local temperature correlations up to 0.55– Local precipitation correlations up to 0.55– NAM index correlations up to 0.55 – PNA index correlations up to 0.60
– Best correlations generally from low-pass filtered ice data– Possibility to “staple” two reconstructions together?
Match cross-validation method to Cook et al., 2002 and compare with NAO reconstruction directly– Simplified NAM and PNA (not shown) reconstructions seem
comparable to existing literature (x-valid r’s ~0.65 and ~0.60)
Other suggestions?