northern health and social care trust · northern health and social care trust ... positive...
TRANSCRIPT

NORTHERN HEALTH AND SOCIAL
CARE TRUST
TRUST BOARD
Performance Report
August 2013
Date Issued: 19/09/13

2
Contents
1.0 Executive Summary 2.0 Summary of Commissioning Plan, Commissioning Direction Targets 3.0 Governance 4.0 Commissioner Targets and Associated Activity 5.0 Access / Waiting Time Targets 6.0 Community Care and Associated Targets 7.0 Improving Productivity APPENDIX 1: LIST OF TABLES APPENDIX 2: LIST OF GRAPHS

3
SECTION 1
1.0 Executive Summary – Reporting on Performance at End of August 2013
The Executive Summary highlights areas of improved performance, key challenges or changing trends. Please see full report for comprehensive performance overview and details. Emergency Department (A&E)
Positive progress has been made in the number of patients being seen and treated within 4hrs and 12 hrs in the acute Emergency Departments. Antrim Hospital achieved an improvement from the July position of 68.6% with Causeway Hospital showing a slight decrease on July’s position of 80.7%
Under 4hrs
Antrim Hosp 77.3%
Causeway Hosp
77.9%
The number of patients waiting over 12 hrs for the completion of their treatment in the ED has seen a sustained improved position during August with virtually no 12 hour breeches.
Over 12 hrs
Antrim 0 Causeway 1
Benchmark: The regional picture has been encouraging too with improvements in the 4 hours target achievement. The 12 hour regional position has also improved.
4 hrs Regionally Jun-13 81.5% Jul-13 80.1%
12 hrs Regionally
Jun-13 – 247 Jul-13 - 198
Discharge of Complex Cases from Hospital
It’s important that patients who are medically fit but require ongoing care in the community after leaving hospital are supported to do so in a timely way. The regional target is that 90% should be discharged in 48 hrs with the appropriate community care in place and no-one delayed more than 7 days. The Complex Discharge target has been met since May 2013.
93% complex cases
discharged within 48 hours
There remain challenges for some complex cases and 6 cases were delayed over 7 days mainly due to training needs, family resistance to discharge and equipment needs.
6 cases delayed over 7 days
Cancer
95% of urgent patients with a suspected cancer should begin treatment within 62 days of referral, 79% has been achieved in July and August. At the end of August 4 patients were exceeding 85 days, with the longest waiter waiting 136 days.
79% commenced
treatment within 62 days
All urgent breast cancer referrals should be seen within 14 days. August position has returned to 100% being seen within 2 weeks, however the situation remains challenging.
100% Referrals seen within 14 days
Elective (Planned) Wating Times for Hospital Services
70% of patients to wait within 13 weeks for Inpatient / Day Case treatment increasing to 80% by March 2014. Whilst August’s position presents a 3% reduction from that of July, it remains 6% above target.
76% within 13 weeks
70% of patients to wait within 9 weeks for 1st outpatient appointment, increasing to 80% by March 2014. The end of August position is 7% below target compared to 6% below target at the end of July.
63% within 9 weeks

4
Elective (Planned) Hospital Services – Reporting Against SBA Volumes
The position at 8th September in respect of the combined Elective Inpatients and Daycases, shows an under performance of - 849 (-10%) admissions. General Surgery is presenting an under performance of -25% (607 patients) & Urology -10% (155 patients). Complex General Surgery cannot be carried out at Whiteabbey & Mid Ulster hospitals for patient safety reasons and this has resulted in vacant slots on both theatre lists. The under performance in Urology has been affected by Consultant vacancies in Causeway hospital. The overall position at the end of July, (excluding endoscopy) was -10%. The Endoscopy position at 31st August shows an under performance of -14% (658 patients). July’s position was -12% (462 Patients).
-10% compared to SBA Volume
The position for 8th September New Outpatient services shows an under performance of -9% attendances. New General Surgery attendances shows an under performance of -12% (466 patients), and Gynae -12% (294 patients). The overall position at the end of July was -6%. Performance for Outpatient Reviews was above draft target by 2949 (8%) attendances. July’s position was 13% above draft target.
-9% compared
to New SBA Volume
8% above Review SBA
Volume
Control of Infection
25 cases of C Difficile have been reported from April to August compared to 24 over the same period last year. Target for year is no more than 56.
25 cases
8 cases of MRSA have been reported from April to August, compared to 6 cases over the same period last year. April to July’s position was 7 cases. Target for year is no more than 8.
8 cases
Unallocated Cases
Planned reduction in unallocated cases has been impacted on by increased demand and fluctuating staff levels. Positive progress has been made on reducing the number of unallocated cases from the position in June of 131 cases. All child protection cases are allocated within 24 hrs.
101 Unallocated Cases
Corporate Performance Absence
The cumulative 2013/14 absence position at the end of July was 5.12%, which is above the target of 5.0% for 13/14. This is however an improvement on the 12 /13 cumulative position of 5.75%. August position is not yet available.
5.12%

The Performance Management Department has recognised for some time that the format of the Trust Board Performance Report was in need of an overhaul. We have taken into consideration comments from Trust Board members and will implement a number of changes on a phased approach. Such changes will include the redesign of the summary section, providing trend and narrative explaining performance and noting actions. A final phase will include improving our use of available technology and contributing to a paper lighter environment. Targets have been realigned to Key Service areas outlined in the Commissioning Plan.
SECTION 2: Measurable Performance against Commissioning Plan, Commissioning Direction, and Additional Targets Period: 1 April 2013 – 31 August 2013
(Note in some cases information is cumulative in others a ‘snapshot’ position is provided eg number patients waiting over 13 weeks is a snapshot at the end of the period, whereas the number of waits over 12 hrs in A&E is a cumulative count of how many times that situation occurred in the period)
NOTE: 2013/14 Targets are from the Commissioning Plan Direction Target Areas. A number of additional indicators are also included in support of these target areas. Some are still in development stage and some do not have specific targets confirmed. PMSI are liaising with Trusts on these.
Key for Trend on previous month
Red arrow pointing down indicates a performance worse than previous month and below target.
Red arrow pointing up indicates a performance better than previous month though below target.
Red side to side arrow indicates no significant movement and is below target
Monthly Key
Achieving Target
Amber arrow pointing down indicates a performance worse than previous month almost on target
Amber arrow pointing up indicates a performance better than previous month almost on target
Amber side to side arrow indicates no significant movement and is almost on target
Almost Achieving Target
Not Achieving Target
Green arrow pointing down indicates a performance worse than previous month yet still above target.
Green arrow pointing up indicates a performance better than previous month and also above target.
Green side to side arrow indicates no significant movement though is achieving target
Not Applicable / Available
Not comparable to previous month

Dir. Target
Description Comments and Actions Recent 3 month Perf.
Assessment Trend on
prev. month
Trend Analysis
June July Aug
Elective Care AHS From April 2013,
70% of patients wait within 9 weeks for 1
st
outpatient appointment, increasing to 80% by March 2014
6,015 NHSCT Patients >9 weeks at 29/08/13, 647of which are IS transfers New backstops applied for quarter 1 & 2 2013/14
Core & Independent Sector Patients seen
within 9 weeks
0%
20%
40%
60%
80%
100%
A M J J A S O N D J F M
% within 9 wks 12/13 % within 9 wks 13/14Target 13/14
68% 64% 63%
Core & Independent Sector backstop breaches
2,091 2,490 2,725
AHS From April 2013, no patient to wait > 18 weeks for 1
st outpatient
appointment decreasing to 15 weeks by March 2014
494 of the 2,246 NHSCT patients >15 weeks at 29/8/13 are IS transfers.
Core & Independent Sector patients > 15
weeks
0
750
1500
2250
A M J J A S O N D J F M
0
5000
10000
15000
20000
Pats > 15 wks 12/13 Pats > 15 wks 13/14
Target 13/14 Total Waits 13/14
1,683 2,052 2,246
Total Core & Independent OP Waiters
16,418 16,255 16,583
AHS From April 2013, no patient to wait > 9 weeks for a diagnostic test
Breaches in cardiac echo and MPI – action plan in place to bring both back in line to 9 weeks. MPI performance to be at 9 weeks by 30 Sep
0
400
800
1200
1600
A M J J A S O N D J F M
No pats > 9 wks 12/13 No pats > 9 wks 13/14Target 13/14
544 533 420

Dir. Target Description
Comments and Actions Recent 3 month Perf. Assessment
Trend on prev.
month Trend Analysis
June July Aug
AHS From April 2013, no patient to wait > 9 weeks for a day case endoscopy.
Actions - Endoscopy templates reviewed - Pre-assessment implemented to
reduce DNA rate
75 of the 190 patients >9 weeks at 29th
August are IS transfers.
Core & Independent Patients > 9 weeks
0
150
300
450
600
A M J J A S O N D J F M
500
1000
1500
2000
No pats > 9 wks 12/13 No pats > 9 wks 13/14
Target 13/14 Total Waits 13/14
268 227 190
Total Core & Independent Endoscopy Patients
Waiting
1,590 1,363 1,153
AHS From April 2013, 100% of all Urgent diagnostic tests to be reported on within 2 days
33 patients waited > 2 days for July ‘13 29 in Imaging 4 in Physiological Measurement
0%
20%
40%
60%
80%
100%
A M J J A S O N D J F M
% within 2 days 12/13 % within 2 days 13/14Target 13/14
99% 99% 99%
AHS From April 2013, 70% of patients wait within 13 weeks for Inpatient / Day Case treatment increasing to 80% by March 2014
932 (24%) NHSCT Patients (Inc IS)>13 weeks at 29/08/13 New backstops applied for quarter 1 & 2 2013/14 Excludes scopes who are solely within 9 weeks position
0%
20%
40%
60%
80%
100%
A M J J A S O N D J F M
% within 13 wks 12/13 % within 13 wks 13/14 Target 13/14
Core & Independent Sector Patients within 13
weeks
80% 79% 76%
Core & Independent
Sector backstop breaches
179 210 262

Dir. Target Description
Comments and Actions Recent 3 month Perf. Assessment
Trend on prev.
month Trend Analysis
June July Aug
AHS From April 2013, no patient to wait longer than 30 weeks for Inpatient / Day Case treatment decreasing to 26 weeks by March 2014
Excludes scopes who are solely within 9 weeks position
Core & Independent Sector patients > 26
weeks
0
50
100
150
200
250
300
A M J J A S O N D J F M
2000
3000
4000
5000
No pats > 26 wks 12/13 No pats > 26 wks 13/14
Target 13/14 Total Waits 13/14
143 169 199
Total Core & Independent IPDC Waiters
4,022 3,961 3,822
AHS From April 2013, no patient to wait longer than 9 weeks from referral to commencement of AHP treatment
OT – 3 new peripatetic community OT’s have commenced and a further 1 has been appointed. Paediatric OT is currently recruiting 2 peripatetic staff. LD have recruited 1 permanent & 1 agency OT. Draft action plan & IPT completed for non recurring resources to support waiting list. SLT – continued pressure in the SLT service. Vacancies in the adult service are being recruited to, in the interim 2 temporary staff have been employed.
0
250
500
750
1000
1250
1500
A M J J A S O N D J F M
No pats > 9 wks 12/13 No pats > 9 wks 13/14 Target 13/14
718 782 1,218
OT – 723 Orthoptics - 24
SLT - 94 Physio – 296 Dietetics - 81
Unscheduled Care (Including Delayed Discharges) AHS From Apr 13,
95% of patients attending any A&E dept to be treated, discharged home or admitted within 4 hrs of arrival in Dept
There are numerous work streams in operation working to reduce the number of patients with a completed ED journey time of 12 hours. ED teams on both sites meet fortnightly as ED Improvement Teams to focus on patient journey in ED. This has led to a renewed focus on key performance indicators, for example working to ensure patients are triaged within 15 minutes of registration. There has been further work to extend Assessment Unit operations, which have reduced the number of GP referrals to ED.
Antrim
0%
20%
40%
60%
80%
100%
A M J J A S O N D J F M
Antrim 12/13 Antrim 13/14 C'way 12/13
C'way 13/14 Target 13/14
78% 69% 77%
Attendances
5,889 6,474 5,989
Causeway
82% 81% 78%
Attendances
3,543 4,162 3,832

Dir. Target Description
Comments and Actions Recent 3 month Perf. Assessment
Trend on prev.
month Trend Analysis
June July Aug
AHS From April 13 no patient should wait longer than 12 hours in A&E dept to be treated, discharged home or admitted
There are numerous work streams in operation working to reduce the number of patients with a completed ED journey time of 12 hours. Further to the above, when the system is under times of pressure, the ED has been very proactive in ensuring consultants are available to review and progress patients through the system. The Turnaround Team, led by M Hinds has brought a renewed focus on unscheduled care and significant effort from across clinical and managerial structure has moved to improve flow and active management of all patients in hospital.
Antrim
0
100
200
300
400
A M J J A S O N D J F M
Antrim 12/13 Antrim 13/14 Cway 12/13 Cway 13/14 Target 13/14
0 19 0
Causeway
14 3 1
AHS/ PCCOPS
From April 13 90% of complex discharges take place within 48 hours of decision to discharge
August Discharges Antrim Hosp Dsch = 93% Causeway Hosp Dsch = 93.7% Mid Ulster Hosp Dsch = 100% Whiteabbey Hosp Dsch = 87.5% Not all wards / specialties are included
Monthly Position
40%
60%
80%
100%
A M J J A S O N D J F M
Monthly 12/13 Monthly 13/14Target 13/14
94% 90% 93%
AHS/ PCCOPS
From April 13 all non-complex discharges take place within 6 hours of decision to discharge
August Discharges Antrim Hosp Dsch = 95.2% Causeway Hosp Dsch = 96.5% Mid Ulster Hosp Dsch = n/a Whiteabbey Hosp Dsch = 95.5% Not all wards / specialties are included
Monthly Position
40%
60%
80%
100%
A M J J A S O N D J F M
Monthly 12/13 Monthly 13/14 Target 13/14
96% 97% 96%

Dir. Target Description
Comments and Actions Recent 3 month Perf. Assessment
Trend on prev.
month Trend Analysis
June July Aug
AHS/ PCCOPS
From April 13 no complex discharge from an acute hospital setting takes longer than 7 days
6 patients waited over 7 days during the month of August (3 ANT, longest wait 38 days, 2 CAU, longest wait 10 days & 1 WHA longest wait 7 days). Not all wards / specialties are included Non Complex Discharges included in 2012/13 target monitoring, excluded from April 13 onwards. (Only Complex Discharges shown in graph for 2012/13)
Number of Patients discharged > 7 days
0
7
14
21
28
35
A M J J A S O N D J F M
Dsch >7 days 12/13 Dsch >7 days 13/14Target 13/14
5 10 6
% discharged within 7 days
99% 99% 99%
AHS From April 13 95% of patients wait no longer than 48 hours for inpatient hip fracture treatment
August Fractures Transferred 1 patient transferred to RVH > 2 nights.
0%
20%
40%
60%
80%
100%
A M J J A S O N D J F M
% Cum <48 hrs 12/13 % Cum <48 hrs 13/14Target 13/14
43% 56% 46%
AHS/ PCCOPS
By March 2013 secure a 10% reduction in the number of emergency readmissions within 30 days
Interim Target = 3076 readmissions (Ant – 2230 Cau – 846) Target is 10% below 10/11 baseline, as per HSCB guidance. Monitored activity is from CHKS 30 day Re-Admissions performance indicator. Information excludes regular day attenders, obstetrics and < 14 years of age. Local information based on HSCB definitions in development. Information presented one month in arrears.
Readmissions Antrim (Cumulative)
0
50
100
150
200
250
300
350
400
A M J J A S O N D J F M
Readm 12/13 Readm 13/14
Target 13/14
751 1011
Readmissions Causeway (Cumulative)
290 404

Dir. Target Description
Comments and Actions Recent 3 month Perf. Assessment
Trend on prev.
month Trend Analysis
June July Aug
AHS/ PCCOPS
By March 2014 reduce the number of unplanned admissions to hospital by 10% for adults with specified long term conditions
Interim Cum Target 1644 (10/11 baseline) Included: Diabetes, Heart Failure, Asthma and COPD to be monitored. Target of 137 per month. Figures presented are dependent on completeness of clinical coding. Current month information will be subject to change and updated in future reports
0
50
100
150
200
A M J J A S O N D J F M
Unplanned Admissions 12/13Unplanned Admissions 13/14Target 13/14
Monthly
148 115 119
Cumulative
442 557 676
AHS By March 2014 reduce the number of excess bed days for the acute programme of care by 10%
Information is being developed. Currently presented amber as per TDP. Target to be achieved in partnership with community and primary care services, in addition to considering hospital internal processes and development of managing new models of LTC.
Health and Social Wellbeing Improvement, Health Protection and Screening (& HCAI)
AHS
By March 14, extend the bowel cancer screening programme to invite 50% of all eligible men and women aged 60-71, with a screening uptake of at least 55% of those invited.
Achieving this target is outside Trusts control as it is centrally administered by PHA. The target is scored green in that all actions within the Trusts control can be achieved.

Dir. Target Description
Comments and Actions Recent 3 month Perf. Assessment
Trend on prev.
month Trend Analysis
June July Aug
MG By March 13, reduce MRSA infections by 29% (regionally), compared to 2011/12 (all ages) NHSCT target of 12 cases for 12/13
Target now confirmed for 2013/14 as 8 MRSA cases
Cumulative Cases
0
3
6
9
12
15
A M J J A S O N D J F M
Cumul Position 12/13 Cumul Position 13/14
Target 13/14
4 7 8
MG By March 13, reduce CDiff infections by 29% (regionally), compared to 2011/12 (> 2 years). NHSCT target of 59 cases for 12/13
Target now confirmed for 2013/14 as 56 C. Difficile cases
Cumulative Cases
0
25
50
75
100
A M J J A S O N D J F M
Cumul Position 12/13 Cumul Position 13/14Target 13/14
9 14 25
Cancer Care AHS From April 2013
95% of urgent patients with a suspected cancer will begin treatment within 62 days
Delays are mainly at outpatients and endoscopy. Actions: - Templates reviewed to ensure adequate capacity for suspect cancer referrals. - Additional activity being carried out to eliminate backlogs.
0%
20%
40%
60%
80%
100%
A M J J A S O N D J F M
Monthly 12/13 Monthly 13/14 Target 13/14
80% 79% 79%
Dir. Target Description
Comments and Actions Recent 3 month Perf. Assessment
Trend on prev.
month Trend Analysis
June July Aug
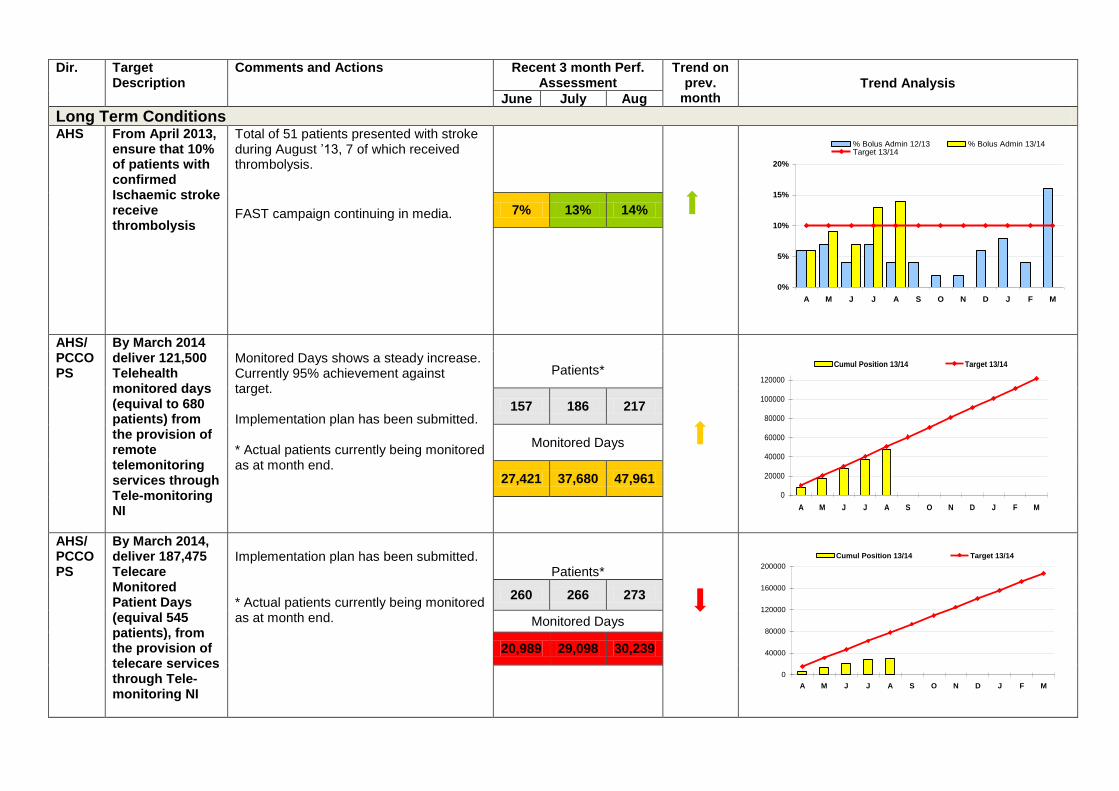
Long Term Conditions AHS From April 2013,
ensure that 10% of patients with confirmed Ischaemic stroke receive thrombolysis
Total of 51 patients presented with stroke during August ’13, 7 of which received thrombolysis.
FAST campaign continuing in media.
0%
5%
10%
15%
20%
A M J J A S O N D J F M
% Bolus Admin 12/13 % Bolus Admin 13/14Target 13/14
7% 13% 14%
AHS/ PCCOPS
By March 2014 deliver 121,500 Telehealth monitored days (equival to 680 patients) from the provision of remote telemonitoring services through Tele-monitoring NI
Monitored Days shows a steady increase. Currently 95% achievement against target. Implementation plan has been submitted. * Actual patients currently being monitored as at month end.
0
20000
40000
60000
80000
100000
120000
A M J J A S O N D J F M
Cumul Position 13/14 Target 13/14
Patients*
157 186 217
Monitored Days
27,421 37,680 47,961
AHS/ PCCOPS
By March 2014, deliver 187,475 Telecare Monitored Patient Days (equival 545 patients), from the provision of telecare services through Tele-monitoring NI
Implementation plan has been submitted. * Actual patients currently being monitored as at month end.
Patients*
0
40000
80000
120000
160000
200000
A M J J A S O N D J F M
Cumul Position 13/14 Target 13/14
260 266 273
Monitored Days
20,989 29,098 30,239

Dir. Target Description
Comments and Actions Recent 3 month Perf. Assessment
Trend on prev.
month Trend Analysis
June July Aug
AHS/ PCCOPS
By 2014, develop and secure a range of quality assured education, information and support programmes to help people manage their long term conditions effectively.
First education programme commenced 3
rd June for people with Type 1 diabetes.
Trust will deliver 3 programmes over forthcoming months to approx 50 people. Other planned programmes include Chest Heart & Stroke Association Taking Control programme. Planned to deliver across 4 localities 2013/14. Discussions ongoing regarding identification of & funding for programme for people with Type 2 Diabetes.
Specialist Services
MG / AHS
From April 2013 no waits > 13 weeks to commence NICE approved specialist therapies for rheumatoid & psoriatic arthritis or ankylosing sponylitis
Target achieved from June ‘12
0
2
4
6
8
10
A M J J A S O N D J F M
No pat >13 wks 12/13 No pat >13 wks 13/14
Target 13/14
0 0 0
MG / AHS
From April 2013 no waits > 39 weeks to commence NICE approved specialist therapies for psoriasis, decreasing to 13 weeks by Sept 13
0 > 13 weeks August 2013
0
2
4
6
8
10
A M J J A S O N D J F M
No pat >39 wks 12/13 No pat >39 wks 13/14Target 13/14
0 0 0

Dir. Target Description
Comments and Actions Recent 3 month Perf. Assessment
Trend on prev.
month Trend Analysis
June July Aug
Mental Health & Learning Disability MHD A. From April
2013, ensure that 99% of all Learning Disability Discharges take places within 7 days of the patient being assessed as medically fit for discharge
5 Patients discharged July 2013 5 = 0 – 7 days
40%
60%
80%
100%
A M J J A S O N D J F M
Monthly 12/13 Monthly 13/14 Target 13/14
Monthly
100% 67% 100%
Cumulative
92% 88% 91%
MHD B. No Learning Disability discharge to take more than 28 days of the patient being assessed as medically fit for discharge
12/13 target, no patient > 7 days
0
1
2
3
4
5
A M J J A S O N D J F M
Dsch >28 days 13/14 Target 13/14
0 1 0
MHD A. From April 2013 99% of patients admitted as Mental Health inpatients for assessment & treatment are discharged within 7 days of decision to discharge
50%
75%
100%
A M J J A S O N D J F M
Monthly 12/13 Monthly 13/14 Target 13/14
Monthly
88% 97% 97%
Cumulative
93% 94% 95%
Dir. Target Description
Comments and Actions Recent 3 month Perf. Assessment
Trend on prev.
month Trend Analysis
June July Aug
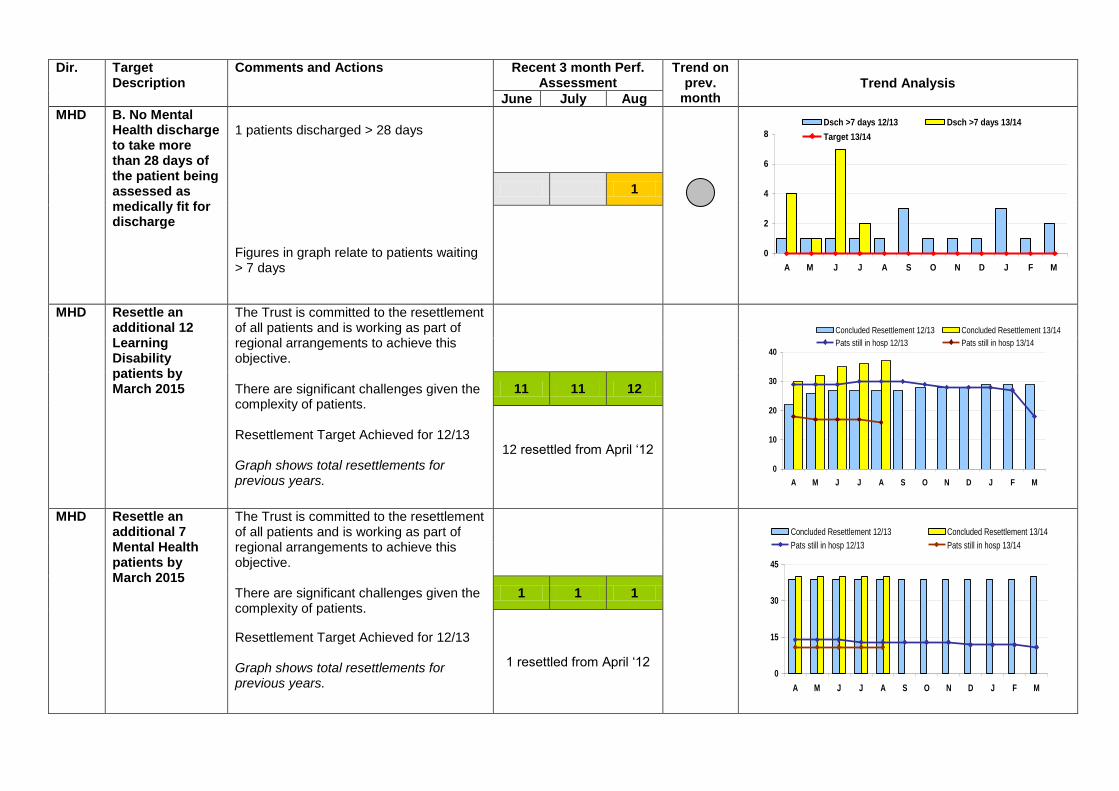
MHD
B. No Mental Health discharge to take more than 28 days of the patient being assessed as medically fit for discharge
1 patients discharged > 28 days Figures in graph relate to patients waiting > 7 days
0
2
4
6
8
A M J J A S O N D J F M
Dsch >7 days 12/13 Dsch >7 days 13/14
Target 13/14
1
MHD Resettle an additional 12 Learning Disability patients by March 2015
The Trust is committed to the resettlement of all patients and is working as part of regional arrangements to achieve this objective. There are significant challenges given the complexity of patients. Resettlement Target Achieved for 12/13 Graph shows total resettlements for previous years.
0
10
20
30
40
A M J J A S O N D J F M
Concluded Resettlement 12/13 Concluded Resettlement 13/14
Pats still in hosp 12/13 Pats still in hosp 13/14
11 11 12
12 resettled from April ‘12
MHD Resettle an additional 7 Mental Health patients by March 2015
The Trust is committed to the resettlement of all patients and is working as part of regional arrangements to achieve this objective. There are significant challenges given the complexity of patients.
Resettlement Target Achieved for 12/13 Graph shows total resettlements for previous years.
0
15
30
45
A M J J A S O N D J F M
Concluded Resettlement 12/13 Concluded Resettlement 13/14
Pats still in hosp 12/13 Pats still in hosp 13/14
1 1 1
1 resettled from April ‘12

Dir. Target Description
Comments and Actions Recent 3 month Perf. Assessment
Trend on prev.
month Trend Analysis
June July Aug
MHD From April 2013 no patient waits longer than 9 weeks to Access mental health services (Adult)
0
2
4
6
8
10
A M J J A S O N D J F M
No pat > 9 wks 12/13 No pat > 9 wks 13/14
Target 13/14
1 0 0
MHD From April 2013 no patient waits longer than 13 weeks for psychological therapies (any age)
0
10
20
30
40
50
60
A M J J A S O N D J F M
No pat >13 wks 12/13 No pat >13 wks 13/14Target 13/14
13 34 52
Children’s Services CS From April 2013
no patient waits longer than 9 weeks to Access child and adolescent mental health services
- Breach position remains fragile - Referral rates and referral accepted rates have increased significantly - Contact NI continue recruitment processes and hope to renew service delivery in coming weeks
0
50
100
150
200
A M J J A S O N D J F M
No pat >9 wks 12/13 No pat >9 wks 13/14
Target 13/14
16 50 45

Dir. Target Description
Comments and Actions Recent 3 month Perf. Assessment
Trend on prev.
month Trend Analysis
June July Aug
CS From April 2013 increase the number of children in care for 12 month or longer with no placement change to 85%
Information reported annually. Amber as per TDP.
CS By March 2014 increase the number of care leavers aged 19 in education, training or employment to 75%.
Aged 19 years old at month end 54 care leavers 10 ineligible
30%
60%
90%
A M J J A S O N D J F M
% 19 yr old Care Leavers 12/13 % 19 yr old Care Leavers 13/14
Target 13/14
care leaver aged 19 years
80% 80% 81%
care leaver aged 18 years
78% 82% 78%
care leaver aged 20 years
76% 78% 67%
CS From April 2013 ensure a 3 year time-frame for 90% of all children to be adopted from care
Information reported annually. Green as per TDP.

Dir. Target Description
Comments and Actions Recent 3 month Perf. Assessment
Trend on prev.
month Trend Analysis
June July Aug
Community Care – Older People & Physical Disability PCCOPS
From April 2013 no waits > 5 weeks for a completed assessment
12/13 target – 8 weeks
Monthly
60%
80%
100%
A M J J A S O N D J F M
% waits <8 wks 12/13 % waits <5 wks 13/14
Target 13/14
99% 95% 100%
Cumulative
97% 97% 97%
PCCOPS
From April 2013 all components of care needs to be met within 8 weeks
12/13 target – 12 weeks
Monthly
60%
80%
100%
A M J J A S O N D J F M
% waits <12 wks 12/13 % waits <8 wks 13/14Target 13/14
96% 98% 100%
Cumulative
96% 96% 97%
Transforming Your Care PPMSSS
During 2013/14, implement integrated Care Partnerships in support of Transforming Your Care.
Planning infrastructure is in place across the Trust and LCG. This will be taken forward jointly.

The following trends are for Indicators of Performance which are in support of the Commissioning Direction Targets. (This section is new to the 2013/14 report and will be developed over the coming months)
MINISTERIAL PRIORITY: TO IMPROVE AND PROTECT HEALTH AND WELL-BEING AND REDUCE INEQUALITIES; THROUGH A FOCUS ON PREVENTION, HEALTH PROMOTION AND EARLIER INTERVENTION
A Area Indicator Jan Feb Mar Apr May Jun Jul Aug Sept
Self Harm A10. Number of new & unplanned review attendances at A&E due to deliberate self harm
139 120 131 139 129 140 142 116
Alcohol-related Admissions
A15. Reduction in the rate of alcohol-related admissions to hospital
Information being developed
Seasonal Flu Vaccine
A22. Uptake of the seasonal flu vaccine by frontline Health and Social Care workers.
Reporting to commence Oct ‘13
Admissions for Venous Thromboembolism
A23. Number of emergency readmissions within 3 months (90 days) with a diagnosis of venous thromboembolism in 2013/14, regardless of the diagnosis related to the original (initial) admission.
Information being developed
Maternity Child Health POC
A24. Level of activity in maternity and child health programme of care including average length of stay.
KH03A returned quarterly
Caesarean Sections A25. Percentage of babies born by caesarean section and number of babies born in midwife-led units, either freestanding or alongside.
30% (Antrim/Causeway) 31% (Antrim/Causeway) KP19 returned quarterly
Intervention Rates A28. Percentage reduction in intervention rates (including caesarean sections) benchmarked against comparable units in UK and Ireland.
44% (Antrim/Causeway) 43% (Antrim/Causeway) KP19 returned quarterly
MINISTERIAL PRIORITY: TO IMPROVE THE QUALITY OF SERVICES AND OUTCOMES FOR PATIENTS, CLIENTS AND CARERS
Cancer Services B1. From April 2012 98% of patients should commence treatment within 31 days of decision to treat
96.8% 98.8% 99% 96.8% 98.9% 99.2% 100% 99%
B2. Number of patients given a red flag referral for suspect cancer by a GP for a first OP appointment with a cancer specialist (inc. consultant upgrades)
796 811 761 821 932 880 979 913
B3. From April 2012 all urgent breast cancer referrals should be seen within 14 days (Red Flag)
100% 100% 100% 78% 98% 53% 51% 100%
Attendances At A&E Department
B5. Number of new & unplanned attendances at A&E departments Types 1 & 2 (Antrim & Causeway)
9176 8661 9386 9506 9388 9432 10636 9821
Attendances At A&E Department
B6. Percentage of new & unplanned review A&E attendances by time band (<30mins, 30mins – 1 hr, 1-2 hours etc.)
A&E Information presented in Section 4

A Area Indicator Jan Feb Mar Apr May Jun Jul Aug Sept
Review Outpatient DNA's
B8. Rate of review outpatient appointments where the patient did not attend.
10.6% 8.8% 11.1% 10.5% 9.3% 9.8% 9.9% 9.6%
New Outpatient Appointments cancelled by hospital
B9. Rate of New outpatient appointments cancelled by the hospital.
5.4% 7.7% 9.0% 7.8% 6.5% 6.7% 6.3% 8.0%
GP Referrals B10. Number of GP referrals to consultant-led outpatient services.
7053 6418 6586 6822 6935 6377 6547 6444
OP Appointments B11. Number of outpatient appointments with procedures (for selected specialties)
Outpatient coding currently on hold until additional funding is received
Radiology Tests B12. Number of radiology tests carried out for a discrete list of tests
Awaiting guidance from Department
Stroke B13. Number of emergency admissions with a primary diagnosis of stroke.
36 49 55 63 58 43 40 52
Pressure Ulcers B15. The number of incidents (i.e. forms) of hospital acquired pressure ulcers (grade 2 and above) within all programmes of care.
28 (Jan – Mar) 28 (Apr – Jun) Reported Quarterly
Falls B16. Number of falls in hospital settings
471 (Jan – Mar) 464 (Apr – Jun) Reported Quarterly
Hearing Aids B17. Number of hearing aids fitted within 3 months as a percentage of completed waits. (figures shown relate to those waiting < 13 wks)
97% waiting
< 13 wks
98% waiting
< 13 wks
95% waiting
< 13 wks
91% waiting
< 13 wks
92% waiting
< 13 wks
93% waiting
< 13 wks
92% waiting
< 13 wks
73% waiting
< 13 wks
Wheelchairs B18. Percentage of patients waiting over 13 weeks for any wheelchair (basic and specialised).
87% waited < 13 wks
87% waited < 13 wks
83% waited < 13 wks
80% waited < 13 wks
84% waited < 13 wks
86% waited < 13 wks
86% waited < 13 wks
93% waited < 13 wks
Housing Adaptations
B19. Percentage of patients who have lifts and ceiling track hoists installed within 16 weeks of the OT assessment and options appraisal.
89% within 15 wks
86% within 15 wks
65% within 15 wks
100% within
15 weeks
100% within
16 weeks
96% within
16 weeks
100% within
16 weeks
88% within
16 weeks
Emergency Admissions for Specific Acute Conditions
B26. Emergency Admissions for acute conditions which should not usually require hospital admission
Information being developed

A Area Indicator Jan Feb Mar Apr May Jun Jul Aug Sept
Emergency Admissions & Readmissions
B27. Number and proportion of emergency admissions and readmissions for people aged 0-64 and 65+, (i) with and (ii) without a recorded long term condition, in which medicines were considered to have been the primary or contributing factor.
Information being developed
MINISTERIAL PRIORITY: TO DEVELOP MORE INNOVATIVE, ACCESSIBLE AND RESPONSIVE SERVICES: PROMOTING CHOICE AND BY MAKING MORE SERVICES AVAILABLE TO THE COMMUNITY
Pharmaceutical Services within TYC
C1(b) (i) Number and proportion of Health and Care Centres in each Trust active in pharmaceutical services provision currently and in future. (ii) Number and proportion of Health and Care Centres in each Trust without active pharmaceutical services currently but with plans to introduce in the next 6 months.
Reporting Frequency – Half Yearly
Remote Telemonitoring
C5. Number of patients benefiting from remote telemonitoring
13/14 information presented in Target Section above
Telecare Services C6. Number of patients benefiting from the provision of telecare services
13/14 information presented in Target Section above
Occupational Therapy Waiters
C7. Number of patients waiting longer than nine weeks from referral to commencement of Occupational Therapy treatment.
36 13 0 37 222 352 481 723
Speech & Language Therapy Waiters
C8. Number of patients waiting longer than nine weeks from referral to commencement of Speech & Language Therapy treatment.
2 0 0 22 51 93 87 94
Dementia Waiters C9. Number of patients waiting longer than 9 weeks to access dementia services
Dementia Patients previously included in Community MH Teams
0 0
MINISTERIAL PRIORITY: TO IMPROVE THE DESIGN, DELIVERY AND EVALUATION OF HEALTH AND SOCIAL CARE SERVICES THROUGH INVOLVEMENT OF INDIVIDUALS, COMMUNITIES AND THE INDEPENDENT SECTOR
Direct Payments D2. Number of direct payment cases by programme of care
524 514 518 516 520 523 531 533
MINISTERIAL PRIORITY: TO IMPROVE THE PRODUCTIVITY BY ENSURING EFFECTIVE AND EFFICIENT ALLOCATION AND UTILISATION OF ALL AVAILABLE RESOURCES IN LINE WITH MINISTERIAL PRIORITIES
Pre-operative stay
E1. Elective average pre-operative stay. 0.76 0.39 0.46 0.51 0.48
Elective LOS E2. Elective average length of stay in acute programme of care.
2.9 3.1 3.3 3.3 3.4
Stroke LOS E3. Average length of stay for stroke patients within the acute & elderly programme of care.
13.8 18.0 22.0 15.3 9.7

A Area Indicator Jan Feb Mar Apr May Jun Jul Aug Sept
Day Surgery Rates E4. Day surgery rate for each of a basket of elective procedures. (Figures shown are cumulative)
62% 61% 62% 73% 68% 68% 63% 63%
Cancelled Ops E5. Percentage of operations cancelled for non-clinical reasons.
1.1% 1.9% 3.7% 3.6% 1.0% 1.5% 1.8% 1.4%
Elective Admissions E6. Percentage of patients admitted electively who have their surgery on the same day as admission. (Indicator – 75%)
79% 81% 77% 72% 76% 81%
Diagnostic Tests E7. Percentage of routine diagnostic tests reported on within 2 weeks of the test being undertaken.
98.9% 94.8% 97.8% 96.1% 95.7% 91.9% 93.5% 93.8%
Diagnostic Tests E8. Percentage of routine diagnostic tests reported within 4 weeks of the test being undertaken.
100% 99.7% 99.7% 99.4% 99% 99.1% 99.1% 99.1%
Nurse / Bed Staffing Ranges
E9. (a) Initiate the use of existing normative nurse to bed staffing ranges (b) normative staffing ranges to be developed within specific community settings
Reporting frequency - Annually
New / Review OP Ratio
E10. Ratio of new to review outpatient appointments scheduled by speciality and Trust. (All specialties)
1.55 1.66 1.74 1.72 1.60 1.61 1.61 1.61
MINISTERIAL PRIORITY: TO ENSURE THE MOST VULNERABLE IN OUR SOCIETY, INCLUDING CHILDREN AND ADULTS AT RISK OF HARM, ARE LOOKED AFTER ACROSS ALL OUR SERVICES
Foster Care F1. Percentage of all foster care placements that are kinship care placements.
29% 29% 30% 29% 30% 31% 31%
Care Leavers F2. Number of care leavers in education, training and employment by placement type. Reporting frequency – Annually
Adoption F3. The % of children with an adoption best-interests decision that are notified to the (ARIS) within 4 weeks of the HSC Trust approving the adoption panel’s recommendation that adoption is in the best interest of the child.
100% (2 of 2) 100% (4 of 4) Reported Quarterly
Lost School Days
F4. Number of school-age children in care for 12 months or longer who have missed 25 or more school days
Reporting frequency – half yearly
Adoption Decision F5. Length of time it takes for the decision to be made that adoption is in the best interests of a child
Reporting frequency – Annually
Children in MH Wards
F6. Children in Adult Mental Health Wards (Quarterly Info)
4 Jan ‘13 – Mar ‘13 1 Apr ’13 – Jun ‘13 Reported Quarterly

ADDITIONAL INDICATORS IN SUPPORT OF TARGETS / INDICATORS ABOVE
A Area Indicator Jan Feb Mar Apr May Jun Jul Aug Sept
Patient Client Experience
Outcomes against the patient client experience standards in the settings agreed for the formal work plan.
Quarterly reports produced & submitted for each area to PHA
Absenteeism
The HSCB and PHA should ensure that Trusts achieve a level of performance that they reduce the rate of absenteeism to 5% across HSC Trusts.
5.7% 5.74% 5.75% 5.64% 5.32% 5.22% 5.12%
Children
From April 2011 the Trust should maintain the standard that all children admitted to residential care will have, prior to their admission. (a) been subject to a formal assessment
100% 100% 100% 100% 100% 100% 100% 100%
From April 2011 the Trust should maintain the standard that all children admitted to residential care will have, prior to their admission. (b) have their placement matched
100% (2of2)
100% (4of4)
100% (4of4)
100% (4of4)
100% (2of2)
100% (4of4)
100% (3of3)
100% (5of5)
Child Protection (allocation of referrals) – From April 11 100% of all child protection referrals are allocated to a social worker within 24 hours of receipt of referral
100% 100% 100% 100% 100% 100% 100% 100%
Child Protection (initial assessment) – From April 11 all Child Protection referrals are investigated and an initial assessment completed within 10 working days
100% 100% 100% 100% 100% 100% 100% 100%
Child Protection (pathway assessment) – From April 11, following completion of Initial Assessment a Case Conference is held with 15 working days of original referral
85% 100% 77% 87% 97% 96% 93%
Level of usage of advocacy services by Looked After Children – number of contacts made with advocacy services
Reporting frequency – Annually
Looked After Children (initial assessment) - From April 2011, an initial assessment completed within 10 working days from date of child becoming looked after
100% 100% 100% 91% 96% 100% 100%
Family Support (Referrals) – From April 2011, 90% of family support referrals to be allocated to a social worker within 20 working days for initial assessment
42% 67% 66% 89% 89% 81% 69%

A Area Indicator Jan Feb Mar Apr May Jun Jul Aug Sept
Family Support (initial assessment) – From April 2011 all FSR must have an initial assessment completed within 10 working days from date referral allocated to the SW
31% 34% 42% 43% 45% 49% 58%
Family Support – From April 2011 on completion of the initial assessment 90% of cases requiring a family support pathway assessment should be allocated within 20 working days
53% 55% 71% 38% 64% 49% 37%
Unallocated Cases Unallocated Cases - All Family Support or Disability Referrals must be allocated to a social worker within 20 working days
126 129 91 98 117 131 101
Autism Autism – Children wait < 13 weeks for assessment following referral, and a further 13 weeks for specialised intervention
Assess185 >
13 wks Inter
0 > 13 wks
Assess145 >
13 wks Inter
0 > 13 wks
Assess26 >
13 wks Inter
0 > 13 wks
Assess0 > 13 wks Inter
0 > 13 wks
Assess0 > 13 wks Inter
0 > 13 wks
Assess0 > 13 wks Inter
0 > 13 wks
Assess0 > 13 wks Inter
0 > 13 wks
Assess 4 > 13 wks Inter
0 > 13 wks
Pre-op Assessment From Apr 11, all surgical patients should have a pre-op assessment
76% 74% 74% (Info from PMSI)
Housing Adaptations From April 11, maintain 95% standard for minor urgent housing adaptations completed within 10 working days.
95% (53 of
56)
98% (81 of 83)
97% (37 of 38)
100% (48 of 48)
100% (43 of 43)
98% (47 of 48)
100% (36 of 36)
100% (60 of 60)
Acquired Brain Injury From April 11, maintain 13 wk maximum waiting time from referral to assessment & commencement of treatment
0 > 13 wks
0 > 13 wks
0 > 13 wks
0 > 13 wks
0 > 13 wks
0 > 13 wks
0 > 13 wks
0> 13 wks
Care Management Assessments
From April 11, the Trust should achieve a performance level of 48% of care management assessments completed in relation to nursing home, residential or domiciliary care, recommend domiciliary care provision.
66% 66% 66% 67% 67% 67% 67% 67%
Elective Care – Consultant Led Outpatient Waiting Times (Reviews)
All Outpatient Reviews to be completed within the clinical indicated time. Excludes patients waiting for independent sector.
5,419 7,404 8,446 6,939 7,037 6,087 5,387 5,590
New Outpatient DNA’s
Rate of new outpatient appointments where the patient did not attend.
8.0% 6.0% 7.7% 6.3% 5.8% 6.3% 7.1% 6.8%
Mortality From Sept 10 Trust to put in place arrangements to routinely review mortality rates, over time and against NI & GB comparator organisations.
Reporting continuing on a monthly basis via CHKS analysis. CHKS providing web based Benchmarking service. The RAMI for the Trust for 11/12 was 81, better than the expected range.

A Area Indicator Jan Feb Mar Apr May Jun Jul Aug Sept
Complaints Respond within 20 days of receipt (complaints received and % responded to within 20 days)
56% 74% 70% 50% 53% 76% 44%
Acute Environmental Cleanliness
Comply with 85% cleanliness target 93% 91% 93% 94% 94% 94% 94%
Clinical Coding 95% coding within 31 days 98% @ 8/1/13
98% @ 13/2/1
3
99% @ 4/3/13
99% @ 3/5/13
99% @ 6/6/13
100% @
5/7/13
99% @ 6/8/13
99% @ 2/9/13
Clinical Coding 100% coding within 62 days
99% 8
th Jan
99% 13
th
Feb
99% 4
th Mar
99% @ 3
rd May
99% @ 6/6/13
100% @
5/7/13
100% @
6/8/13
99% @ 2/9/13
Nursing Skill Mix By Mar 11, achieve a reduction of one point in the ratio of qualified nurses to unqualified nurses.
78:22 78:22 78.22 78.22 78:22
AHP Skill Mix By Mar 11, achieve a reduction of one point in the ratio of qualified AHP’s to unqualified AHP’s
86:14 85:15 85:15 85:15 85:15
7 Day Follow up Trusts should ensure that, from April 2011, all mental health patients discharged from hospital who are to receive a continuing care plan in the community should receive a follow-up visit within 7 days of discharge
98.4% 98.4% 98.6% 100% 100% 100% 100% 100%
Directorate Codes: AHS Acute Hospital Services CS Childrens Services PCCOPS Primary & Community Care for Older Peoples Services MG Medical Governance PPMSS Planning, Performance Management and Support Services F Finance MHD Mental Health & Disabilities

Governance
Including Patient Safety Quality Improvement Plan Progress Report (July 2013)
& HCAI Performance Report
(July 2013)

PATIENT SAFETY QUALITY IMPROVEMENT PLAN (PSQIP) PROGRESS REPORT JULY 2013
28
TABLE 1: New Commissioning Priorities for 2013-14
Target Apr 13 May 13 Jun 13 Jul 13 Comments
Pressure Ulcer (SKIN
bundle)
Compliance with bundle (%) 95% 85 85 88 91 Pressure Ulcer bundle introduced to Antrim pilot wards in early 2013. Spread to 9 wards in April - May Spread to a further ward in June (10 wards) July – 12 wards, but no data was received for 2 of these wards Not yet introduced to Causeway
Number of PU ≥ grade 2 (hospital acquired)
N/A
1 1 7 5
Number of PU ≥ grade 2 (admitted with)
38 41 24 26
Pressure Ulcer Rate (per 1000 beddays)
6.76 7.54 5.47 4.04
Acute Falls Number of Falls
N/A 68 60 59 61 Falls Walking Stick introduced to wards in early 2013.
Data received from Antrim, Mid-Ulster and Whiteabbey. Awaiting data from Causeway.
Falls Rate (per 1000 beddays)
8.32 6.88 7.29 7.05
WHO Checklist
Trustwide (General Theatres, Maternity Theatres, DSUs & DPUs) (%)
95% 100 100 99 100 Target changed from 85% to 95% from April 13 July - No data received from 2 wards
VTE
Compliance with Risk Assessment (%)
95%
32 54 51 68 Audits being carried out by Local Medical Governance Groups across 10 wards in Antrim.
Appropriate prophylaxis prescribed in line with VTE Risk Assessment (%)
100 93 99 98
Crash Call Rate
Trust-wide (per 1000 beddays)
N/A 1.73 0.82 0.71 1.04
Compliance with SSI
Surveillance (C-Sections)
SSI Rate Trust-wide
N/A 19.0 13.4 12.5 17.9
Data received quarterly from PHA. Figures shown are for Quarters 2, 3 & 4 2012; and Quarter 1 2013. Quarter 2 2013 figures will not be available until mid-October 2013.
NI Aggregate 10.8 9.8 9.7 8.6
Return of surveillance forms (%)
Trust-wide 95%
79 82 85 79
NI Aggregate 78 76 76 74
Compliance with device-associated
surveillance
Ventilator Acquired Pneumonia (rate)
Antrim
N/A 8.62 0 0 ND
Data received from PHA. Figures are monthly. July 2013 data not yet available.
Causeway 0 0 0 ND NI Aggregate 1.37 0 0 ND
Central Line Blood Stream Infections (rate)
Antrim
N/A 0 0 0 ND
Causeway 0 0 0 ND NI Aggregate 0.53 0 0 ND
Catheter Associated Urinary Tract Infections
(rate)
Antrim
N/A 4.81 0 0 ND
Causeway 0 0 0 ND NI Aggregate 0.39 0.77 0.41 ND

29
TABLE 2: Other Patient Safety Initiatives (Non-Commissioning)
Target Apr 13
May 13
Jun 13
Jul 13
Comments
Leadership Walkrounds
Number of Walkrounds held per month
4 4 2 2 --- July – no Leadership Walkrounds held this month due to leave
Mental Health
Weekly team review (WTR) (%) 95% 100 70 95 100
Joint Risk Assessment (JRA)
(%) 95% 100 95 95 100
Treatment/ care plan (TCP) (%)
95% 100 100 100 100
Surgical Site bundle (Maternity C-Sections)
Trust-wide (%) 95% 100 100 99 100
Central Line bundle (Antrim & Causeway)
Trust-wide (%) 95% 100 100 100 100
Ventilator bundle (Antrim & Causeway)
Trust-wide (%) 95% 100 100 100 100
PEWS Compliance Trust-wide (%) 95% 95 93 94 96 July – no data received from Causeway wards
Medication Safety Meds Rec within 48 hours
(Antrim) (%) 95% 82 85 87 100
B1 reverted back to being the only admission ward, therefore data more centralised
ED Measures
Stroke
Assessment within 30 minutes (%)
95%
100 100 100 100
July - CT scans delayed for 3 patients - Lysis delayed for 1 patient due to requirement for MRI; and another patient required treatment for high blood pressure
CT scan within 45 minutes (%)
60 60 67 50
Lysis bolus within 60 minutes (%)
20 50 67 0
Appropriate ward within 90 minutes (%)
60 100 100 100
Number of stroke patients presenting
per month N/A 5 5 3 6
Unscheduled reattenders
Within 7 days (%)
1 – 5% 6.06 6.03 6.50 ND Data not yet received for July 2013
Left before treatment (%) <5% 4.26 3.19 3.21 ND Data not yet received for July 2013

SECTION 3.1 HCAI Performance Report The following indicators are included in this section; Clostridium Difficile / MRSA Targets 2013/14 MRSA: 8 per year C DIFF: 56 per year (please note that MRSA relates to all ages, CDiff target for 2013/14 relates to aged >2 Environmental Target INDICATOR – Compliance with 85% Cleanliness target A steering group has been set up to implement the Regional strategy “Cleanliness Matter”. This will be implemented where possible, within existing resources, as no additional funding is available. Hand Hygiene Target INDICATOR – 95% Overall Compliance

31
TABLE 1: SUMMARY TABLE 2013-14
Actual activity 12/13
12/13 Target
Apr-13 May-13 Jun-13 Jul-13 Monthly target 13/14*
Cumulative position as at
31 Jul 13
Cumulative target
(Jul 13)
13/14 Target
Comments
PERFORMANCE REPORT
C DIFFInfections ≥2 years 80 N/A 2 1 6 5 4.92 14 18.68 56
Deaths associated with C Diff Primary = (P) / Secondary = (S)
21 N/A 1 0 3 1 N/A 5 N/A N/A Please note figures include toxin negative cases
MRSA Infections 13 12 2 1 1 3 0.67 7 2.68 8
LOCAL IPC PERFORMANCE INDICATORS
Compliance with Hand Hygiene Policy (%) 99 95 98 96 97 97 95 97 95 95
Compliance with Antimicrobial Prescribing Policy (%)
94 90 94 92 93 92 90 93 90 90
Antimicrobial exemptions (appropriateness) 91 95 88 86 90 91 95 89 95 95
HIGH IMPACT INTERVENTIONS (HII)
HII 1 Central venous catheter bundle (%)
Insertion 100 95 100 100 95 100 95 99 95 95
July - HII 4 (Peri-op) awaiting data for 2 wards.
Ongoing 100 95 95 100 100 100 95 99 95 95
HII 2 Peripheral line bundle (%) Insertion 99 95 100 100 94 95 95 97 95 95
Ongoing 100 95 99 100 99 99 95 99 95 95
HII 3 Renal bundle (%) Insertion 100 95 100 NIL NIL NIL 95 100 95 95
Ongoing 99 95 100 99 99 100 95 100 95 95
HII 4 Surgical Site bundle (%) Maternity 100 95 100 100 99 100 95 100 95 95
Peri-op 98 95 99 99 99 87 95 96 95 95
HII 5 Ventilator care bundle (%) 100 95 100 100 100 100 95 100 95 95
HII 6 Urinary catheter care bundle (%)
Insertion 100 95 100 97 100 100 95 99 95 95
Ongoing 100 95 100 100 100 100 95 100 95 95
HII 7 C Diff bundle (%) 100 95 100 100 NIL 100 95 100 95 95
ENVIRONMENTAL CLEANLINESS
Trust-wide compliance (%) Acute 93 85 94 94 94 94 85 94 85 85
Trust-wide compliance (%) Community 91 85 90 92 91 89 85 91 85 85
C Diff death figures are accurate at the time of report production. Figures may change if subsequent cases are reported by laboratory services. Subsequent changes will be reflected in the next issue of the performance report. Includes Community figures (Dalriada, Moyle and Robinson). Figures relate to only those cases which are included in Target Monitoring NIL = no patients requiring intervention/bundle

32
TABLE 2: Summary of Infection Prevention & Control Validation Audits (carried out by IPCNs) – July 2013
ANTRIM Total number of audits carried out: 24
CAUSEWAY Total number of audits carried out:
Audit Number of audits in each compliance category
Audit Number of audits in each compliance category
Hand Hygiene Full compliance Partial compliance Minimal compliance
5 1 ---
Hand Hygiene Not audited
Management of Peripheral Lines
Full compliance Partial compliance Minimal compliance
7 2 ---
Management of Peripheral Lines
Full compliance Partial compliance Minimal compliance
--- --- 2
Management of Urinary Catheters
Full compliance Partial compliance Minimal compliance
4 1 ---
Management of Urinary Catheters
Full compliance Partial compliance Minimal compliance
--- --- 2
C Diff Validation Audits Full compliance Partial compliance Minimal compliance
2 2 ---
C Diff Validation Audits
Full compliance Partial compliance Minimal compliance
3 --- ---
Venepuncture Management
Full compliance Partial compliance Minimal compliance
--- 1 ---
MRSA Management Full compliance Partial compliance Minimal compliance
1 --- ---
HOLYWELL, MID-ULSTER & WHITEABBEY Total number of audits carried out:
DALRIADA, ROBINSON & INVER Total number of audits carried out:
Audit Number of audits in each compliance category
Audit Number of audits in each compliance category
Hand Hygiene Full compliance Partial compliance Minimal compliance
--- --- 1
Hand Hygiene Not audited
Management of Peripheral Lines
Not audited
Management of Peripheral Lines
Not audited
Management of Urinary Catheters
Full compliance Partial compliance Minimal compliance
--- 1 1
Management of Urinary Catheters
Not audited
C Diff Validation Audits Not audited
C Diff Validation Audits
Full compliance Partial compliance Minimal compliance
2 --- ---
MRSA Management
Full compliance Partial compliance Minimal compliance
1 --- ---
MRSA Management Not audited
NB: Wards / Depts falling below 90% compliance with Hand Hygiene, Management of Urinary Catheters or Management of Peripheral Lines are required to carry out weekly audits for a period of 3 months.
Compliance Scores: Compliant = 95% or above Partial Compliance = 90% - 94% Minimal Compliance = 89% or below

33
TABLE 3: Regional Healthcare Hygiene Cleanliness Audit Tool
entre – 3 July 2013 Average Compliance
Section 2 - General Environment 85%
Section 4 - Waste and Sharps 100%
Section 5 - Patient Equipment 99%
Section 6 - Hygiene Factors 93%
Section 7 - Hygiene Practices (observed) 96%
Inver 3 Holywell Hospital – 16 July 2013 Average Compliance
Section 2 - General Environment 93%
Section 3 - Patient Linen 94%
Section 4 - Waste and Sharps 97%
Section 5 - Patient Equipment 94%
Section 6 - Hygiene Factors 97%
Section 7 - Hygiene Practices (observed) 92%
Wilson House Day Centre – 24 July 2013 Average Compliance
Section 2 - General Environment 87%
Section 3 - Patient Linen 38%
Section 4 - Waste and Sharps 100%
Section 5 - Patient Equipment 84%
Section 6 - Hygiene Factors 93%
An action plan is put in place for any areas which fall below compliance.
Compliance Scores: Compliant = 95% or above Partial Compliance = 90% - 94% Minimal Compliance = 89% or below

SECTION 3.2 COMPLAINTS
INDICATOR – Respond to complaints within 20 working days TABLE 1: COMPLAINTS - April 12 – July 13
MonthComplaints
Received
Number replied to within
20 working daysPercentage
Apr-12 50 39 78%
May-12 58 34 59%
Jun-12 47 26 55%
Jul-12 50 29 58%
Aug-12 49 31 63%
Sept-12 44 24 55%
Oct-12 70 59 84%
Nov-12 75 47 63%
Dec-12 28 15 54%
Jan -13 59 33 56%
Feb -13 54 40 74%
Mar-13 50 35 70%
TOTAL TO DATE 634 412 65%
MonthComplaints
Received
Number replied to within
20 working daysPercentage
Apr-13 56 28 50%
May - 13 62 33 53%
June - 13 54 41 76%
July - 13 61 27 44%
TOTAL TO DATE 233 129 55% (Source: Governance Dept; Monthly Complaints Report)
GRAPH 1: COMPARATIVE GRAPH – COMPLAINTS 2012/13 – 2013/14
Complaints Responded to within 20 DaysApril 12 - July 13
0%
10%
20%
30%
40%
50%
60%
70%
80%
90%
Apr May June July Aug Sep Oct Nov Dec Jan Feb Mar
Month
Perc
en
tag
e
2012/13 2013/14

35
SECTION 3.3 HOSPITAL STANDARDISED MORTALITY RATIOS (HSMRs)
Hospital Standardised Mortality Ratios (HSMRs) = the ratio of the number of deaths in hospital within a given time period, to the number that might be expected if the hospital had the same death rates as some reference population i.e. using CHKS's national database containing more than 7 million episodes received annually from over 150 hospitals representative of DGH and Teaching hospitals in the United Kingdom. Of these, 146 English acute hospitals were used as the comparator group for NI. Step 1: The risk of dying with each given combination of age, sex, diagnosis and other risk factors is worked out for a ‘standard’ population. This process calculates the risk for particular patient subgroups within the standard population. In the HSMR for example, there are more than 2,000 different combinations of age, sex, deprivation, admission type, diagnosis and co-morbidity. Step 2: This risk is then applied to the corresponding subgroups in the local hospital in order to calculate how many deaths would be expected to occur in that trust if the standard level of risk applied locally. The expected number of deaths is therefore a locally-weighted count of deaths. For some local hospitals, there may be none or very few patients and deaths in some of the subgroups. Step 3: This ‘expected’ figure is then compared with the observed (actual) number of deaths that occurred in the hospital to give a ratio. The ratio between the number of expected deaths and the number of actual deaths is known as a standardised mortality ratio (SMR). It represents the number of actual deaths divided by the number of expected deaths x 100. Hospital Standardised Mortality Ratio (HSMR) = the number of actual deaths divided by the number of expected deaths x 100. When using mortality ratios, it is usual practice to set the SMR in the standard population at the value of 100. This simply means that there is an exact match between the observed deaths and the expected deaths - hence it is the ‘standard’. Using 100 also makes it easier to express local Trust HSMRs in terms of a percentage difference to this standard. Example: If a trust’s HSMR is 85, it has 15% fewer deaths than expected. Similarly an HSMR of 120 would indicate 20% more deaths than expected. The information on HSMRs is provided to the Trust through the work of CHKS (health care benchmarking service provider) which uses clinically coded data sourced from the Trust’s Patient Administration Systems. This data is then risk adjusted using the CHKS Risk Adjusted Mortality Index (RAMI) methodology. The HSMR for the Trust is therefore presented in the form of a Risk Adjusted Mortality Index (RAMI) score.
Performance against HSCB Trusts has been Benchmarked against 146 acute hospitals in England,
which are in the CHKS database.
The Trust stats have been published in the Trust Board Performance Report at March 2013.

36
Commissioner Targets and Associated
Activity

37
SECTION 4 4.0 COMMISSIONER TARGETS AND ASSOCIATED ACTIVITY
The following section presents detailed progress against our Service and Budget Agreement activity. This section also presents additional supporting hospital services activity. SERVICE AND BUDGET AGREEMENTS
4.1.1 ACTIVITY: Inpatients, Day Cases and Outpatient
INDICATOR – Elective targets have now almost all been agreed between the Trust and HSCB. This includes Inpatients, Day case and New Outpatients. Review Outpatients have not yet been agreed.
4.1.2 ACTIVITY: AHP and Community Health Services
INDICATOR – To maintain a level of activity consistent with volumes set out in the New Health and Social Care Board Service and Budget Agreement. (These have not yet been formally agreed for 13/14). Tables 9A, 9C & 9D presents the combined NHSCT position for AHP and Community Health Services. The currency used is Face to Face Contacts and the comparison shown for AHP is against 11/12 outturn and additional investment for 12/13.
(Note that the provision of this information continues to require development)

Table 1a:
Cumulative Period 23
NHSCT
Specialty
Core
expected
Target / Vol
Actual Cum
ActivityVariance % Variance
Core
expected
Target / Vol
Actual Cum
ActivityVariance % Variance
Core
expected
Target / Vol
Actual Cum
Activity
Variance % Variance
Cardiology 32 30 -2 -7.1% 98 88 -10 -10.0% 130 118 -12 -9.3%
Dermatology 14 0 -14 -100.0% 256 310 54 21.0% 270 310 40 14.9%
ENT 517 393 -124 -23.9% 521 624 103 19.8% 1038 1017 -21 -2.0%
Gastroenterology 123 38 -85 -69.2% 290 244 -46 -15.8% 413 282 -131 -31.7%
General Medicine 18 45 27 154.3% 40 18 -22 -54.8% 58 63 6 9.6%
General Surgery (includes paed surg) 837 569 -268 -32.0% 1586 1247 -339 -21.4% 2423 1816 -607 -25.1%
Breast Surgery 119 120 1 0.5% 30 27 -3 -10.2% 150 147 -3 -1.7%
Geriatric Medicine 4 4 0 13.0% 0 0 - n/a 4 4 0 13.0%
Haematology 0 45 45 n/a 109 89 -20 -18.2% 109 134 25 23.2%
Nephrology 27 33 6 22.3% 4 1 -3 -74.9% 31 34 3 9.8%
Neurology (excludes VC C'way & PNeur) 0 0 0 n/a 6 7 1 13.0% 6 7 1 13.0%
Obs and Gyn (Gynaecology) 552 440 -112 -20.2% 831 831 -0 0.0% 1383 1271 -112 -8.1%
Paed Med (excludes MUH amb) 71 66 -5 -6.7% 2 0 -2 -100.0% 73 66 -7 -9.0%
Pain Management 2 5 3 182.6% 264 266 2 0.9% 265 271 6 2.1%
Rheumatology 33 18 -15 -45.7% 307 366 59 19.1% 341 384 43 12.7%
Thoracic Medicine 4 61 57 - 219 234 16 7.1% 222 295 73 32.9%
Urology (incl Nurse Led Activity) 228 284 56 24.7% 1276 1065 -211 -16.5% 1504 1349 -155 -10.3%
Total for listed specialties 2580 2151 -429 -17% 5838 5417 -421 -7% 8417 7568 -849 -10%
NOTE: The following specialties exclude scopes: Gastro, GS & Medicine, which have been identified by procedure code on PAS
Elective Inpatients Daycases Combined Elective and Daycase
1st April 2013 - 8th September 2013 (23 weeks)
Elective Inpatient activity is based on Admissions (1st FCE only)13/14 Activity Comparison for NHSCT Inpatient and Daycase compared to 13/14 HSCB volumes. (Based on HSCB monitoring)
(Source: Acute Hospital Information Services; Cumulative Weekly SBA Activity Report)
Above table now includes Dr Valko WLIO (ENT) activity & Dr Riddell WLIO (Rheu) activity. Chemical Pathology now included in Endocrinology.
Table 1b: Endoscopy performance against HSCT target: 01/04/2013 – 31/8/2013 (5 months)
NHSCT April May June July August Cumulative
Actual Activity to Date 741 883 794 846 733 3997
Expected SBA Monthly Volume 931 931 931 931 931 4655
Monthly Variance -190 -48 -137 -85 -198 -658
% Variance -20.4% -5.2% -14.7% -9.1% -21.3% -14.1% (Source: Acute Hospital Information Services; Cumulative Weekly SBA Activity Report)

39
TABLE 1c:
(Based on HSCB monitoring)
Cumulative Period 23 1st April 2013 - 8th September 2013 (23 weeks)
NHSCT
Specialty
Core
expected
Target / Vol
Actual Cum
Activity
Variance%
Variance
Core
expected
Target / Vol
Actual Cum
Activity
Variance % Variance
Cardiology 1607 1923 316 19.6% 1671 2060 389 23.2%
Dermatology 1945 1842 -103 -5.3% 2587 2475 -112 -4.3%
Diabetes / Endocrinology 587 587 -0 -0.1% 960 2825 1865 194.2%
ENT 2752 2698 -54 -2.0% 2752 3410 658 23.9%
Gastroenterology 1327 1040 -287 -21.6% 2654 1993 -661 -24.9%
General Medicine 1095 529 -566 -51.7% 2190 1157 -1033 -47.2%
General Surgery (includes paed surg) 3753 3287 -466 -12.4% 4841 4416 -425 -8.8%
Breast Surgery 1211 1165 -46 -3.8% 1477 1121 -356 -24.1%
Geriatric Medicine 445 457 12 2.7% 445 666 221 49.7%
Haematology 203 250 47 22.9% 1650 2889 1239 75.1%
Nephrology 271 210 -61 -22.4% 1083 1677 594 54.9%
Neurology (excludes VC C'way & PNeur) 222 208 -14 -6.3% 278 472 194 69.9%
Obs and Gyn (Gynaecology) 2415 2121 -294 -12.2% 2415 2901 486 20.1%
Gynae - Colposcopy 748 724 -24 -3.3% 0 0 - n/a
Gynae - Urodynamics 129 123 -6 -4.8% 0 0 - n/a
Orthodontics 133 108 -25 -18.6% 1327 1117 -210 -15.8%
Paed Med (excludes MUH amb) 1534 1267 -267 -17.4% 3559 3226 -333 -9.4%
Pain Management 274 270 -4 -1.5% 576 380 -196 -34.0%
Rheumatology 771 768 -3 -0.4% 2700 3128 428 15.9%
Thoracic Medicine 1057 1015 -42 -4.0% 2114 2745 631 29.8%
Urology (incl Nurse Led Activity) 1296 1000 -296 -22.8% 1944 1514 -430 -22.1%
Total for listed specialties 23777 21592 -2185 -9% 37223 40172 2949 8%
13/14 Comparison for NHSCT Outpatient Activity compared to 13/14 HSCB volumes
New Outpatients Review Outpatients
(Source: Acute Hospital Information Services; Cumulative Weekly SBA Activity Report)

40
Table 2:
Northern Health and Social Care Trust SBA Volume Breakdown
Specialty Total Elect Adms Total Day Cases
Combined Elect
Adms & DC New Outs Review outs
Cardiology 73 221 294 3,634 3,779
Dermatology 31 579 610 4,398 5,849
Diabetes / Endocrinology 0 0 0 1,328 2,171
ENT 1168 1178 2346 6,222 6,222
Gastroenterology 279 655 934 3,000 6,000
General Medicine 40 90 130 2,476 4,952
General Surgery (includes paed surg) 1893 3585 5478 8,484 10,944
Breast Surgery 270 68 338 2,738 3,340
Geriatric Medicine 8 0 8 1,006 1,006Haematology 0 246 246 460 3,731
Nephrology 61 9 70 612 2,448
Neurology (excludes VC C'way & PNeur) 0 14 14 502 628
Obs and Gyn (Gynaecology) 1247 1879 3126 5,460 5,460Gynae - Colposcopy 0 0 0 1,692 0Gynae - Urodynamics 0 0 0 292 0
Orthodontics 0 0 0 300 3,000
Paed Med (excludes MUH amb) 160 4 164 3,468 8,046
Pain Management 4 596 600 620 1,302
Palliative Medicine 0 0 0 0 0
Rheumatology 75 695 770 1,744 6,104
Thoracic Medicine 8 494 502 2,390 4,780
Urology (incl Nurse Led Activity) 515 2885 3400 2,930 4,395
Total 5,832 13,198 19,030 53,756 84,157not yet agreed with HSCB
Endoscopes 11,167
(Source: HSCB; Based on NHSCT Capacity & Demand Report)
- The 2013 / 14 volumes are based mainly on 2012/13 volumes with a 2% increase for productivity.
- The majority of Elective activity volumes for 2013/14 have been agreed with HSCB for inpatients, day cases and new outpatients. Draft volumes are used in the
interim for review outpatients until 2013/14 volumes have been confirmed. Inpatient / Day Case volume split has not yet been agreed, HSCB draft percentage
split has been used in the interim.

41
AHP Activity TABLE 3a - Service & Budget Agreement (SBA) for New AHP Face to Face (FTF) Contacts CUMULATIVE POSITION: 1st April – 31st July 2013 (Update for August not yet available) (Commissioning targets have been agreed for new FTF contacts only. These have been based on 11/12 activity and include any additional investment received within the current year)
Dietetics 4,481 3,586 335 3,921 560 1,680 14%
Occupational Therapy 7,224 6,305 0 6,305 919 2,756 15%
Orthoptics 1,381 1,177 0 1,177 204 613 17%
Physiotherapy 14,301 12,745 0 12,745 1,556 4,667 12%
Podiatry 3,465 3,284 0 3,284 181 544 6%
Speech & Language Therapy 1,837 1,704 126 1,830 7 20 0%
% Year
End
Variance
Year End
Variance
Projected
AHPs (New)
13/14 New FTF
Contacts
Activity
13/14 SBA
New FTF
Target
Variance
Additional
Investment
FTF Target
(New)
Total 13/14
New FTF
Target
TABLE 3b – Additional Investment 2013/14 Additionality - Full Year Effect New Review
SLT New Post from 12/13 recurrent 378 756
Dietetics Elective Funding recurrent 1005 3205
To be Confirmed
Dietetics DAFNE - - -
Dietetics CAWT - - - Performance Notes: Speech & Language Therapy
SLT staff have relocated from Community Services to Antrim Hospital which impacts on elective target. Staff are endeavouring to balance the needs of new referrals and meeting targets with managing the risks with
delayed reviews. Adult Services have recruited to 1 vacancy, and one maternity leave, a further maternity leave vacancy remains
to be covered, in the interim 2 temporary staff (1 agency) have been employed and additional hours have been made available to other staff to minimise risk and endeavour to reduce numbers waiting in excess of 9 weeks to access the service.
Pressure continues on SLT services in both scheduled and unscheduled aspects. Occupational Therapy
Community, Dementia and Learning Disability OT services are all breaching 9 week target. 3 new peripatetic OT’s have been employed in the Community OT service and a further one has been appointed
and should start in the next few weeks. The Paediatric OT service is also currently recruiting 2 peripatetic OT staff.
The Trust is currently negotiating some additional temporary staff to help manage the waiting list position. Learning Disability have recruited a permanent OT to their service and 1 temporary agency OT. OT waiting list position is unlikely to improve over the next few months unless significant additional help is
provided with immediate effect. Physiotherapy
Demand for the service continues to increase. Physiotherapy does not have the funded capacity to service this increase in referrals. An IPT is presently being prepared to secure additional funding.
Dietetics
Additionality to be confirmed. Unusually high rate of absence in some areas of service Staff has been utilised to cover these areas to minimise breaches Staff contracts temporarily extended to cover absenteeism Dietetics waiting list is expected to improve by end of October

42
TABLE 3c - AHP Supporting Information - Review Face to Face (FTF) Contacts CUMULATIVE POSITION: 1st April – 31st July 2013 (Update for August not yet available)
(Review activity is not part of SBA activity however the following activity is provided in support of the new activity in the table above. Review targets have been based on 11/12 activity and include any additional investment received within the current year)
Dietetics 6,863 5,580 1,068 6,648 215 645 3%
Occupational Therapy 16,129 13,045 0 13,045 3,084 9,251 24%
Orthoptics 3,276 3,504 0 3,504 -228 -683 -6%
Physiotherapy 54,425 54,663 0 54,663 -238 -713 0%
Podiatry 26,130 28,141 0 28,141 -2,011 -6,034 -7%
Speech & Language Therapy 13,915 14,330 252 14,582 -667 -2,000 -5%
OT Contacts (Mental Health) (New)
(excluding Dementia)* 333
OT Contacts (Mental Health) (Review)
(excluding Dementia)* 11,446
% Year
End
Variance
Year End
Variance
ProjectedAdditional
Investment
FTF Target
(Review)AHPs (Review)
13/14 Review
FTF Contacts
Activity
13/14
Review FTF
Target
Total 13/14
Review FTF
Target
Variance
TABLE 3d - Community Health Services The following table is for information only and details at a high level Community Health Services. Activity provided is for 1st April – 31st July 2013 (Update for August not yet available)
Health Visitors 9,469
District Nurses 98,776
Community Midwifery 26,977
Community Nurses Learning Disability 1,549
Community Psychiatric Nurses 16,060
Community Dental 7,423
Clinical Psychology 7,013
Family Planning 2,663
Public Health Staff Nurses 806
Care Managed Nursing 1,906
Community Health Services
13/14 FTF
Contacts
Note: Health Visitor activity is now child health only. (TABLES 3a, b, c & d - Source: Corporate Information Services; AHP & Community Health Service Monthly (FTF Contact) Activity)

43
A&E Target INDICATOR – 95% of people who attend A&E are treated, admitted or discharged home within 4 hours; no patient should wait longer than 12 hours. Trusts should ensure that the 95% standard is achieved in individual hospital sites. TABLE 4: NEW AND UNPLANNED REVIEW PATIENTS WHO DEPART FROM A&E IN THE MONTH of August 2013
Antrim*
New/ Unpl
Rev 4627 77.3% 1362 22.7% 0 0.0% 5989
Causeway*
New/ Unpl
Rev 2985 77.9% 846 22.1% 1 0.0% 3832
Mid Ulster**
New/ Unpl
Rev 630 100.0% 0 0.0% 0 0.0% 630
Whiteabbey**
New/ Unpl
Rev 687 100.0% 0 0.0% 0 0.0% 687
Trust Total
New/ Unpl
Rev 8929 80.2% 2208 19.8% 1 0.0% 11138
Total
Attendances
(exc incorrect
DT)Department
Attendance
Type
Total 0-4
hours
%0-4
hours
Total 4-12
hours
% 4-12
hours
Total 12
hours +
% 12
hours +
(Source: Acute Hospital Information Services; Monthly AE Performance Report)
Includes unplanned review patients, Please note Planned reviews (Clinic Reviews) are excluded. 12 hr+ breaches include ambulance breaches which are attributed to NHSCT. Excludes those attributed to the Ambulance Service.
Mid Ulster and Whiteabbey Hospitals are Nurse-led Minor Injuries Units.
TABLE 5: ANTRIM HOSPITAL NEW AND UNPLANNED REVIEW PATIENTS WHO DEPART FROM A&E – April 12 – August 13
Fiscal Year April May June July Aug Sept Oct Nov Dec Jan Feb Mar
2012 / 13 5892 6225 5902 5748 6224 5952 6106 5776 5730 5769 5568 5967
2013 / 14 5894 5787 5889 6474 5989
Variance 2 -438 -13 726 -235 (Source: Acute Hospital Information Services; Monthly AE Performance Report)
TABLE 6: A&E 12 HOUR BREACHES September 12 – August 13 (Number of Patients Waiting >12 Hours)
NHSCT
Breaches
Sept
12
Oct
12
Nov
12
Dec
12
Jan
13
Feb
13
Mar
13
Apr
13
May
13
Jun
13
Jul
13
Aug
13
A&E 97 150 210 238 337 225 417 448 76 13 18 0
A&E /
Transport12 4 9 14 19 4 16 18 6 1 4 1
TOTAL 109 154 219 252 356 229 433 466 82 14 22 1
(Source: Acute Hospital Information Services; Monthly AE Performance Report)
*A&E Transport breaches for which NHSCT is responsible are shown separately.

44
Graph 1: Monthly % Departing A&E within 4 hours – Antrim & Causeway Hospital Sites
ED - % Seen 0- 4 Hours
68
.5%
61
.7%
61
.5%
60
.5%
59
.7%
62
.8%
77
.3%
68
.6%
77
.8%
75
.3%
67
.1%
63
.9%
78
.2%
82
.2%
85
.0%
78
.3%
70
.2%7
7.9
%
70
.9%
71
.9%
71
.1%
82
.4%
80
.7%
77
.9%
40%
45%
50%
55%
60%
65%
70%
75%
80%
85%
90%
95%
100%
Sep-12 Oct-12 Nov-12 Dec-12 Jan-13 Feb-13 Mar-13 Apr-13 May-13 Jun-13 Jul-13 Aug-13
%
ANT CAU Target
Accident and Emergency services continue to fall short of the 4 hour waiting target for 95% of attendances.
Graph 2: ANTRIM HOSPITAL A&E NEW AND UNPLANNED REVIEW PATIENT ATTENDANCES FOR AMBULANCE SOURCE OF REFERRAL: February 13 – August 13
ANTRIM & CAUSEWAY HOSPITAL A&E NEW & UNPLANNED REVIEW PATIENT
ATTENDANCES FOR MODE OF ARRIVAL EMERGENCY AMBULANCE
9321206 1111 1095 1206 1390 1261
496530 566 458
498653
577
0
500
1000
1500
2000
2500
Feb 13 Mar 13 Apr 13 May 13 Jun 13 Jul 13 Aug 13Arr
ivals
by E
merg
en
cy A
mb
ula
nce
Antrim Causeway
(Source: Acute Hospital Information Services)
Table 7: ADMISSIONS INTO HOSPITAL VIA A&E: August 12 – August 13
Month
ANT CAU MID WHA ANT CAU MID WHA
Aug-12 6224 4154 598 801 11777 1611 634 0 0 2245 19.1%
Sep-12 5952 3597 587 690 10826 1675 586 0 0 2261 20.9%
Oct-12 6106 3573 684 808 11171 1850 609 1 0 2460 22.0%
Nov-12 5776 3328 608 757 10469 1815 586 0 0 2401 22.9%
Dec-12 5730 3362 432 504 10028 1910 591 0 0 2501 24.9%
Jan-13 5769 3407 609 621 10406 2044 628 0 0 2672 25.7%
Feb-13 5568 3093 583 711 9955 1801 495 0 0 2296 23.1%
Mar-13 5967 3419 616 610 10612 1928 597 0 0 2525 23.8%
Apr-13 5894 3612 699 623 10828 1826 579 0 0 2405 22.2%
May-13 5787 3601 752 680 10820 1855 582 0 0 2437 22.5%
Jun-13 5889 3543 707 691 10830 1777 610 0 0 2387 22.0%
Jul-13 6474 4162 780 795 12211 1780 672 0 0 2452 20.1%
Aug-13 5989 3832 630 687 11138 1744 680 0 0 2424 21.8%
% AdmittedNo. of New & Unplanned Reattenders
TOTALNo of Patients Admitted via A&E from PAS
TOTAL
(Source: Acute Hospital Information Services; 2010-13 Admissions via AE Trust Position Report)

45
4.3 CANCELLED OPERATIONS INDICATOR – No more than 2% of operations should be cancelled for non-clinical reasons on the day. All surgical patients should have appropriate pre-operative assessment. This section of the report replaces the cancelled admissions section and is based on the monthly PMSI return monitoring the number of operations cancelled for non-clinical reasons.
GRAPH 3: Total Hospital Cancellations for Non-Clinical Reasons (Sept 12 – Aug 13)
Non Clinical Cancelled Operations Target
from Sept 12 - Aug 13
1.8%1.4%
1.1%
2.1%
1.8%2.2% 1.9%
1.1%
3.7%3.6%
1.0%
1.5%
0.0%
1.0%
2.0%
3.0%
4.0%
Sep
t 12
Oct
12
Nov
12
Dec
12
Jan
13
Feb
13
Mar
13
Apr
13
May
13
Jun
13
Jul 1
3
Aug
13
Month
% C
ance
lled
% Non Clinical Cancellations on day or later Target %
GRAPH 4: % of Admissions that had a valid corresponding Pre-Op Assessment Attendance
% of Admissions that had a valid corresponding Pre-Op Assessment Attendance - BY MONTH,
Admissions during Jun 12 - Mar 13
(See notes for exclusions)
76% 76% 72% 72% 76% 77% 77% 76% 74%
24% 24% 28% 28% 24% 23% 23% 24% 26% 26%
74%
0%
10%
20%
30%
40%
50%
60%
70%
80%
90%
100%
Jun-12 Jul-12 Aug-12 Sep-12 Oct-12 Nov-12 Dec-12 Jan-13 Feb-13 Mar-13
Yes No
Notes: Information based on coded Admissions only. Information includes Day Cases. Current levels of coding have contributed to the percentage in the graph above. Updated positions not yet available.

46
4.4 CLINICAL CODING INDICATOR – Trust to work towards 95% of all diagnosis/procedure coded activity to be carried out within 31 days of the end date of the relevant FCE/Day case or the OP Attendance. 100% should be achieved within 62 days. TABLE 8: CLINICAL CODING TIMELINESS
As at
Total
Episodes
Coded
Episodes % Coded Target
Total
Episodes
Coded
Episodes % Coded Target
03/05/2013 110243 109341 99% 95% 101239 100563 99% 100%
06/06/2013 120642 119792 99% 95% 111046 110337 99% 100%
05/07/2013 129072 128444 100% 95% 120258 119661 100% 100%
06/08/2013 139243 138412 99% 95% 129661 129046 100% 100%
02/09/2013 147168 146220 99% 95% 137965 137241 99% 100%
31 Day Target 62 Day Target
(Source: Acute Hospital Information Services; 2013 – 14 Clinical Coding Target Report)
This report shows the level of clinical coding completed within the 31 and 62 day target dates and excludes Independent Hospital Activity. It is not yet possible to calculate the % completed for OP Clinical coding as there is no way at present of accurately identifying those OP attendances where procedures have taken place.

47
Access / Waiting Time
Targets

48
SECTION 5 5.1 WAITING TIMES – Inpatient / Daycase Waiters INDICATOR – 70% of inpatients and daycases to be treated within 13 weeks, increasing to 80% by March 14, with no patient to wait longer than 30 weeks for treatment decreasing to 26 weeks by March 14. Table 1a below shows the numbers waiting against HSCB July Backstop positions.
As at 29/08/2013 there were; 932 NHSCT patients (Inc IS) waiting over 13 weeks (Inpatient / Daycase) 262 NHSCT (Inc IS) patients breached the backstop positions 199 NHSCT patients (Inc IS) waiting over 26 weeks
Table 1a: IP/DC Patients by Weeks Waiting at 29/08/13 (exc. Endoscopy) Patients waiting in the >13 week column are waiting 92 – 97 days, 14 weeks: 98 – 104 days etc.
>13 14 15 16 17 18 19 20 21 22 23 24 25 26 27 28 29 30 31 32 33 34 35
36-
44 > 44
Total > 13
Weeks
CARDIOLOGY (C) 2 1 3 16
DENT LEARN DIS/SPEC NEEDS (C) 5 1 1 1 1 9 22
DENTAL CHILDRENS (C) 3 5 2 1 2 1 2 16 22
EAR, NOSE & THROAT- ADULT (C) 2 2 1 1 1 7 19
EAR, NOSE & THROAT - ADULT (WLIO) 1 1 15
EAR, NOSE & THROAT – PAEDIATRIC (C) 1 1 2 2 1 7 18
EAR, NOSE & THROAT (IS) 1 1 1 3 21
GENERAL SURGERY ( C) IS 4 2 2 3 1 1 4 1 1 1 2 1 3 26 41
GENERAL SURGERY (C) 20 19 35 28 14 8 14 13 4 5 3 6 3 1 3 3 1 2 1 183 34
GENERAL SURGERY (WLIO) 1 1 1 1 4 31
GYNAECOLOGY (C ) IS 2 1 4 1 1 1 5 1 6 3 5 3 1 10 4 4 3 2 2 3 62 39
GYNAECOLOGY (C) 3 15 20 13 11 16 14 2 1 4 1 2 3 1 4 1 1 1 113 46
OBS & GYN (GYNAECOLOGY) (WLIO) 1 5 6 17
PAIN MANAGEMENT (IS) 1 1 2 15
UROLOGY (C) 4 9 7 8 6 3 1 2 1 5 6 6 4 5 10 3 2 82 43
INPATIENTS >13 14 15 16 17 18 19 20 21 22 23 24 25 26 27 28 29 30 31 32 33 34 35
36-
44 > 44
Total > 13
Weeks
EAR, NOSE & THROAT- ADULT (C) 3 1 1 1 7 2 4 1 1 1 22 28
EAR, NOSE & THROAT – PAEDIATRIC (C) 1 1 19
GENERAL SURGERY ( C) IS 4 2 1 2 1 3 3 1 1 1 5 24 42
GENERAL SURGERY (C) 4 9 9 8 18 7 4 9 3 1 1 2 3 2 1 2 2 1 1 1 1 3 3 95 45
GENERAL SURGERY (WLIO) 2 2 22
GENERAL SURGERY BREAST (C ) IS 1 1 1 1 2 1 3 10 48
GENERAL SURGERY BREAST (C) 1 1 2 3 7 41
GYNAECOLOGY (C ) IS 2 6 1 4 1 2 6 2 2 1 1 2 1 3 1 10 45 44
GYNAECOLOGY (C) 3 12 11 6 8 12 12 6 3 1 5 4 5 1 5 2 2 6 2 3 1 1 10 121 43
OBS & GYN (GYNAECOLOGY) (WLIO) 1 1 19
UROLOGY (C ) IS 1 1 49
UROLOGY (C) 5 6 6 5 5 3 3 9 4 4 4 4 3 6 3 2 3 1 1 1 78 34
UROLOGY (WLIO) 1 1 19
TOTAL IP/DC 55 82 97 80 76 64 69 51 19 35 23 37 31 21 20 38 26 19 10 8 13 6 3 41 8 932
DAYCASES
Longest
Wait
(Weeks)
WEEKS
(Source: Information Services – Acute, PTLIPDC – run date 29/08/2013)
NOTES: = 13 wk PFA target or agreed backstop for certain specialties.
- Patients are grouped into weeks waiting, ie. 18 weeks equals 126 – 132 days. Patients waiting >18 weeks (127-132 days) will therefore be included in the 18 week group. Only those waiting exactly 18 weeks in this column are not breaches.
- Waiting list figures are validated weekly by operational staff. Table 1a excludes Visiting Consultant waiters.

49
Table 1b: Endoscopy Patients by Weeks Waiting at 29/08/2013
190 NHSCT Endoscopy patients (Inc. IS) waiting over 9 weeks
>9 10 11 12 13 14 15 16 17 18 19 20 21 22 24 26 27 28 29
Total > 9
Weeks
GASTROENTEROLOGY ( C) IS 1 1 2 3 1 4 1 2 15
GASTROENTEROLOGY (C) 2 8 9 1 1 1 1 1 1 25
GENERAL SURGERY (C ) IS 1 3 8 6 2 2 2 1 4 9 3 1 4 2 3 1 1 5 1 59
GENERAL SURGERY (C) 12 23 15 21 4 4 3 1 1 2 1 1 1 89
GS ENDOSCOPY (C ) IS 1 1
GS ENDOSCOPY (C) 1 1
Total 15 34 32 29 8 8 7 2 9 11 9 3 4 3 6 2 1 6 1 190
Specialty
WEEKS
(Source: Information Services – Acute, PTLIPDC _ run date 29/08/2013) Table 1c: Visiting Consultant IP/DC Patients by Weeks Waiting at 29/08/2013
14 18 21 24 26 27
Total > 13
Weeks
OPHTHALMOLOGY (C) 2 1 1 1 5
UROLOGY BHSCT (C) 4 1 1 6
UROLOGY BHSCT (WLI) 1 1
Total 2 5 1 1 1 2 12
Specialty
WEEKS
(Source: Information Services – Acute, PTLIPDC – run date 29/08/2013)
Table 2: Waiting Times for Inpatients / Daycase Backstop Specialties – August 2013
Specialty WEEKS Specialty WEEKS
Breast Surgery 26 General Surgery 26
Dermatology 11 ENT 18
Endoscopy 9 Gynae 26
Urology 26 All Other Specialties 13

50
5.2 WAITING TIMES – Outpatient Waiters INDICATOR – 70% patients should wait no longer than 9 weeks for a 1st outpatient appointment, increasing to 80% by March 14, and all
patients to be seen within 18 weeks for a 1st outpatient appointment, decreasing to 15 weeks by March 14. Table 3a shows the numbers waiting against HSCB May backstop positions.
As at 29/08/13 there were
6,015 NHSCT patients waiting over 9 weeks Outpatients (inc. IS Transfers) 2,725 NHSCT patients breached the backstop positions (inc. IS Transfers) 2,246 NHSCT patients waiting over 15 weeks (inc. IS Transfers)
Table 3a: OP Patients by Weeks Waiting at 29/08/13 Patients waiting in the >9 week column are waiting 64 – 69 days, 10 weeks: 70 – 76 days etc.
>9 10 11 12 13 14 15 16 17 18 19 20 21 22 23 24 25 26 27 28 29 30 31 32
Total > 9
Weeks
CARDIOLOGY (C) 46 49 53 46 22 33 8 3 1 261
CHEMICAL PATHOLOGY (C) 1 3 1 3 1 1 10
COLPOSCOPY - GYNAE (C) 2 26 48 3 22 30 36 3 36 32 14 22 10 21 2 307
DERMATOLOGY (C) 36 68 39 34 14 16 7 4 1 3 3 3 2 6 4 5 8 2 2 4 3 4 2 1 271
DERMATOLOGY (IS) 7 16 20 10 1 2 11 6 12 3 1 9 3 5 4 2 4 4 3 2 2 5 132
DIABETIC (C) 1 1
DIABETIC/LIPID (C) 2 2
EAR, NOSE & THROAT (C) 86 121 144 134 105 159 115 87 78 52 29 10 7 5 1132
EAR, NOSE & THROAT (IS) 1 29 14 5 27 2 24 10 3 115
ENDOCRINOLOGY (C) 6 13 19 16 12 16 9 9 10 7 4 6 3 1 2 1 1 1 136
GASTROENTEROLOGY (C) 54 65 94 81 57 89 76 67 85 74 74 75 24 53 29 10 17 5 2 1 1032
GASTROENTEROLOGY (IS) 2 3 28 7 7 2 3 52
GENERAL MEDICINE (C) 3 4 1 3 1 12
GENERAL SURGERY (C) 92 113 80 98 48 54 24 9 8 3 1 1 1 532
GENERAL SURGERY (IS) 1 3 17 9 21 19 9 3 1 83
GENERAL SURGERY BREAST (C) 14 25 19 5 7 14 22 13 28 12 12 6 1 178
GERIATRIC ASSESSMENT (C) 2 1 4 1 5 13
GERIATRIC/CC (C) 1 1
GYNAECOLOGY (C) 64 119 103 94 40 58 17 12 4 1 512
GYNAECOLOGY (IS) 6 8 7 24 2 3 18 13 1 82
HAEMATOLOGY (C) 1 3 4
MIRENA - GYNAE (C) 1 1
NEPHROLOGY (C) 8 9 9 4 3 11 6 2 52
NEUROLOGY (C) 11 28 14 13 6 3 2 2 1 80
NEUROLOGY (IS) 1 2 1 1 5
ORTHODONTICS (C) 1 3 3 15 1 2 3 5 6 1 3 43
PAEDIATRIC MEDICINE (C) 30 24 21 14 6 12 5 7 5 7 4 12 4 3 3 157
PAIN MANAGEMENT (C) 19 24 34 32 2 5 6 4 4 5 2 1 1 139
PAIN MANAGEMENT (IS) 1 3 21 15 11 13 11 12 5 1 1 2 1 1 1 3 1 103
RHEUMATOLOGY (C) 22 25 21 29 8 11 1 2 3 1 1 124
RHEUMATOLOGY (IS) 2 12 8 3 2 8 11 15 6 4 2 1 1 75
THORACIC MEDICINE (C) 6 5 5 5 2 4 1 7 2 37
URACYST (C) 1 1
URODYNAMICS - GYNAE (C) 12 11 22 7 6 10 8 3 1 1 81
UROLOGY (C) 11 25 15 19 19 15 13 7 18 16 16 19 6 13 9 9 6 7 2 3 1 249
Total 529 766 771 681 437 585 399 278 387 299 192 198 64 123 85 86 53 27 12 9 16 7 4 7 6015
Specialty Description
WEEKS
(Source: Information Services – Acute OP PTL – run date 29/08/2013)
NOTES: = 9 wk PFA target or agreed backstop for certain specialties.
- Patients are grouped into weeks waiting, ie. 15 weeks equals 105 – 111 days. Patients waiting >15 weeks (106-111 days) will therefore be included in the 15 week group. Only those waiting exactly 15 weeks in this column are not breaches. - Waiting list figures are validated weekly by operational staff. Table 3 excludes ICATS and Visiting Consultant waiters. Community Paediatric (non PAS) included from 31
st March 2013

51
Table 3b: Visiting Consultant OP Patients by Weeks Waiting at 29/08/13
9 10 11 12 13 14 15 16 17 18 19 20 21 22 23 24 25 26 27 28 29 30 31 32 33 34 35 36 37 40 41 42
Total > 9
Weeks
DENTAL SURGERY (C) 4 12 15 6 15 17 5 5 12 11 8 6 11 9 14 5 5 4 6 5 12 7 10 6 10 2 3 5 1 2 2 2 237
NEUROLOGY (C) 4 7 8 9 8 3 2 1 1 1 4 1 4 1 3 2 1 60
OPHTHALMOLOGY (C) 16 12 4 1 33
ORTHOPAEDICS (C) 1 1 1 1 4
TRAUMA & ORTHOPAEDICS (C) 3 1 3 2 9
Grand Total 27 32 30 19 24 20 5 5 12 13 9 7 12 14 15 9 6 7 9 6 12 7 10 6 10 2 3 5 1 2 2 2 343
Specialty Description
WEEKS
(Source: Information Services – Acute OP PTL – run date 29/08/2013)
Table 4: Waiting Times for Outpatient Backstop Specialties – August 2013
Specialty WEEKS Specialty WEEKS Specialty WEEKS
Breast Surgery 13 Cardiology 15 Chem Path/Diabetic/Lipid 15
Dermatology 15 Endocrinology 15 ENT 15
Gastro 15 General Surgery 15 Gynae 15
Gynae - Colposcopy 10 Nephrology 10 Neurology (Dr Esmonde) 15
Orthodontics 15 Pain Management 15 Rheumatology 12
Urology 15 All Other Specialties 9

52
5.3 WAITING TIMES – Mental Health Outpatient Waiters INDICATOR –No patient to wait longer than 9 weeks from referral to assessment and commencement of treatment for mental health issues, 13 weeks for psychological therapies. TABLE 5: Waiting List Position as of 06/09/2013
All Non Consultant-led Services0-3 Weeks (0-21
days)
>3 to 6 weeks (22-
42 days)
> 6 to 9 weeks
(43 -63 days)
> 9 to 13 weeks
(64 -91 days)
> 13 weeks (>91
days)Total waiters
Community Mental Health Teams 264 191 53 0 0 508
Psychiatry of Old Age (Non Consultant Led) / Community
Mental Health Teams for Older People
Forensic Services 4 0 0 0 0 4
Eating Disorder Services 4 1 0 0 0 5
Addictions 138 84 11 0 0 233
Child and Adolescent Mental Health Services (CAMHS) Tier 3
services 72 46 34 38 7 197
Dementia Services 86 106 15 0 0 207
Personality Disorder Services
Consultant Led Psychosexual Services*
TOTAL 568 428 113 38 7 1154
All Non Consultant-led Services0-3 Weeks (0-21
days)
>3 to 6 weeks (22-
42 days)
> 6 to 9 weeks
(43 -63 days)
> 9 to 13 weeks
(64 -91 days)
> 13 weeks (>91
days)Total waiters
Adult Mental Health Service (including victims of sexual
violence and trauma) 97 111 91 91 49 439
Adult Health Psychology Services (including long term
conditions management) 5 11 7 1 0 24
Children's Psychology Services (including paediatric
psychology and therapeutic services for looked after children 0 2 0 0 0 2
Adult and Children's Learning Disability Services 32 18 28 7 0 85
Psychology Led Psychosexual Services
TOTAL 134 142 126 99 49 550 (Source: Corporate Information Services; Priority 6 – Weekly Mental Health Services Waiting Times HSCB Return 2013-14) As at 31/08/13 there were 45 CAMHS patients breaching the 9 week target, and 52 Psych Therapies patients breaching the 13 wk target.

53
5.4 WAITING TIMES – Diagnostics
INDICATOR – No patient to wait longer than 9 weeks for a Diagnostic Test.
TABLE 6: Waiting List Position as of 31/08/2013
0-3 Weeks
(0 - 21 days)
>3 to 6 weeks
(22 - 42 days)
>6 to 9 weeks
(43 - 63 days)
>9 to 13 weeks
(64 - 91 days)
>13 to 21 weeks
(92 - 147 days)
> 21 to 26 weeks
(148 - 182 days)
> 26 weeks
(183 days +)Total waiters
Imaging 3814 1941 899 58 2 0 0 6714
Cardiology 797 542 341 127 70 26 0 1903
GI Physiology 1 0 0 1 0 0 0 2
Respiratory Physiology 199 140 75 43 3 0 0 460
Urodynamics 25 40 24 64 26 0 0 179
Audiology 81 90 79 0 0 0 0 250
TOTAL 4917 2753 1418 293 101 26 0 9508
(Source: Acute Hospital Information Services; Priority 2 – Diagnostic Tests WL Monthly 2013-14)
As at the 31/08/13 there were 60 Imaging, 223 Cardiology, 1 GI Physiology, 46 Respiratory Physiology and 90 Urodynamic patients waiting over 9 weeks for a diagnostic test. (There are 39 tests, these are grouped in the headings shown above). Figures not yet validated.
* Cardiology Perfusion Studies – MPI breaches due to (i) A sharp rise in demand over several months, (ii) Limited reporting capacity due to having a single NHSCT cardiologist competent in MPI reporting.
Other Diagnostic Day cases and Outpatients are included in the IPDC / OP Waiting list figures and are subject to the 13 and 9 week targets.

54
5.5 WAITING TIMES – Allied Health Professionals
INDICATOR – No patient should wait longer than 9 weeks from referral to commencement of AHP treatment. TABLE 7: Waiting List Position as at 06/09/2013
0-3 Weeks (0-
21 days)
>3 to 6 weeks
(22-42 days)
>6 to 9 weeks
(43 - 63 days)
> 9 to 13 weeks
(64 - 91 days)
> 13 weeks (>
91 days)Total waiters
Longest Wait in
Days
Dietetics 372 419 134 51 39 1015 130
Occupational Therapy 760 608 445 407 344 2564 149
Orthoptics 198 234 71 38 5 546 137
Physiotherapy 1359 1491 795 266 9 3920 105
Podiatry 514 471 113 0 0 1098 59
Speech and Language Therapy 198 180 89 65 23 555 166
Multi-Disciplinary Teams 0
TOTAL 3401 3403 1647 827 420 9698
Patients still waiting to be seen/treatedWaiting List as at Fri 6/09/13
(Source: Corporate Information Services; Priority 2 – AHP Waiting Times Fortnightly Return 2013-14)
Notes – As at 31/08/13 there were 1,218 patients waiting over 9 weeks. - Part of the data for Dietetics, Orthoptics and Physio is reported one week behind due to restricted reporting mechanisms, these restrictions are being addressed.

55
5.6 CANCER TARGETS The Trust is required to monitor and deliver on targets for the timeliness of referral, diagnosis and treatment (where applicable) of suspect cancer patients.
INDICATOR – 98% of patients diagnosed with cancer (decision to treat) should begin their treatment within a maximum of 31 days.
TABLE 8: Patients with Confirmed Cancers with completed waits over 31 day target as at 09/09/13
Patients
DATE START FIRST
TREATMENTWithin Target NHSCT Breach Grand Total
% within
target% target
Sep-12 112 0 112 100% 98%
Oct-12 115 1 116 99% 98%
Nov-12 104 0 104 100% 98%
Dec-12 98 1 99 99% 98%
Jan-13 123 4 127 97% 98%
Feb-13 82 1 83 99% 98%
Mar-13 105 1 106 99% 98%
Apr-13 93 3 96 97% 98%
May-13 95 1 96 99% 98%
Jun-13 131 1 132 99% 98%
Jul-13 87 1 88 99% 98%
Aug-13 86 1 87 99% 98%
31 Day Target
(Source: Cancer Services; Completed Waits – 31 days)
From CaPPs & Cancer Waits Database Patients shared with another Trust count as 0.5 These figures are subject to change as patient notes are updated HSCNI official figures exclude the latest month.
INDICATOR – 95% of patients referred with a suspected cancer should begin their first definitive treatment within 62 days (of referral).
TABLE 9: Patients with Confirmed Cancers with completed waits over 62 day target as at 09/09/13
Patients
DATE STARTED FIRST
TREATMENT Within Target Breachers Total
% Within
Target % Target
Sep-12 44.5 10.5 55 81% 95%
Oct-12 38.5 9.5 48 80% 95%
Nov-12 37 5.5 42.5 87% 95%
Dec-12 37 5 42 88% 95%
Jan-13 51.5 12 63.5 81% 95%
Feb-13 33 11.5 44.5 74% 95%
Mar-13 47 12 59 80% 95%
Apr-13 30.5 12.5 43 71% 95%
May-13 37.5 7.5 45 83% 95%
Jun-13 56 14 70 80% 95%
Jul-13 40 10.5 50.5 79% 95%
Aug-13 40.5 11 51.5 79% 95%
62 Day Target
(Source: Cancer Services; Completed Waits – 62 days)
From CaPPs & Cancer Waits Database Patients shared with another Trust count as 0.5 These figures are subject to change as patient notes are updated The main reasons for Breach of the cancer target are due to Delay in TRUS biopsy, Endoscopic investigation, Hysteroscopy diagnostic test and complex cases.

56
SUSPECTED BREAST CANCER INDICATOR – All Breast referrals, deemed urgent according to regionally agreed guidelines, for suspected breast cancer, should be seen within 14 days of receipt of GP referral. At present there are weekly reports prepared for Service Delivery Unit, DHSSPS. A summary of Performance (by month) for breast “urgent” referral waiting times is set out below.
TABLE 10: % OF “URGENTLY” REFERRED PATIENTS SEEN AT BREAST CLINIC WITHIN 2 WEEKS OF REFERRAL AT 12/09/13
Month
No of "Urgent"
Breast Clinic
Attendances seen
No of Patients Seen
within 2 Weeks of
Referral
Target 100% to be
seen within 2 weeks
% seen within 2
Weeks of
Referral
September 12 117 117 100% 100%October 12 190 190 100% 100%November 12 131 131 100% 100%December 12 145 145 100% 100%January 13 106 106 100% 100%February 13 115 115 100% 100%March 13 151 151 100% 100%
April 13 121 94 100% 78%
May13 179 175 100% 98%
Jun 13 137 73 100% 53%
Jul 13 225 114 100% 51%
Aug 13 185 185 100% 100% (Source: Corporate Information Services; Breast Cancer – SDR2BC Return)
Notes: Performance based on those referred to Breast Clinic and flagged as "BC" or "CAS" on PAS.
"Urgent" based on the Patient having a Priority Type = 2

57
Community Care and Associated Targets

58
SECTION 6 6.1 DELAYED DISCHARGES – MENTAL HEALTH & LEARNING DISABILITY
INDICATOR – From April 13, 99% of patients admitted for assessment and treatment are discharged within 7 days of the decision to discharge.
TABLE 1: MENTAL HEALTH – COMPLETED WAITS
Month End 0 - 7 days8 to 90
days
91 to 365
days>365 days Total
% Discharged
within 0-7 days
30/04/2013 68 2 2 0 72 94.4%
31/05/2013 50 1 0 0 51 98.0%
30/06/2013 50 4 3 0 57 87.7%
31/07/2013 59 2 0 0 61 96.7%
31/08/2013 60 1 1 0 62 96.8% (Source: Corporate Information Services; Priority 6 – Mental Health Services Monthly Return to HSCB 12/13 & 13/14)
TABLE 2: LEARNING DISABILITY – COMPLETED WAITS
Month End 0 - 7 days8 to 28
days
29 to 90
days
91 to 365
days>365 days Total
% Discharged
within 0-7 days
30/04/2013 7 0 0 1 0 8 88%
31/05/2013 4 0 0 0 0 4 100%
30/06/2013 1 0 0 0 0 1 100%
31/07/2013 2 0 0 0 1 3 67%
31/08/2013 5 0 0 0 0 5 100%
(Source: Corporate Information Services; Priority 6 – Learning Disability Monthly Return to HSCB 12/13 & 13/14)
Figures in above tables are based on Patients where a decision to discharge has been taken and who have been discharged (Completed Waits = Length of Time between Decision to Discharge date and Date of Discharge)
6.2 OLDER PEOPLE
INDICATOR – From April 13, people with continuing care needs should wait no longer than 5 weeks for assessment to be completed and have the main components of their care needs met within a further 8 weeks.
TABLE 3: CARE IN THE COMMUNITY – COMPLETED 5 WEEK TARGET (100%) The following table provides an indication of the NHSCT progress to meet the 5 week target for assessments.
30/04/2013 179 2 181 99%
31/05/2013 156 11 167 93%
30/06/2013 143 1 144 99%
31/07/2013 149 8 157 95%
31/08/2013 137 0 137 100%
April 13 - July
13 Total764 22 786 97%
Completed > 5
weeks
Assessments
CompletedMonth
% Waiting <5
weeks
Completed < 5
weeks
(Source: Corporate Information Services; Priority 3 / 4 - HSCB Monthly Return on Care Assessment / Management /
Direct Payments Performance Issues 2013 – 14)
Information is based on clients who have had an assessment completed within the month and how long it has taken this assessment to be completed.
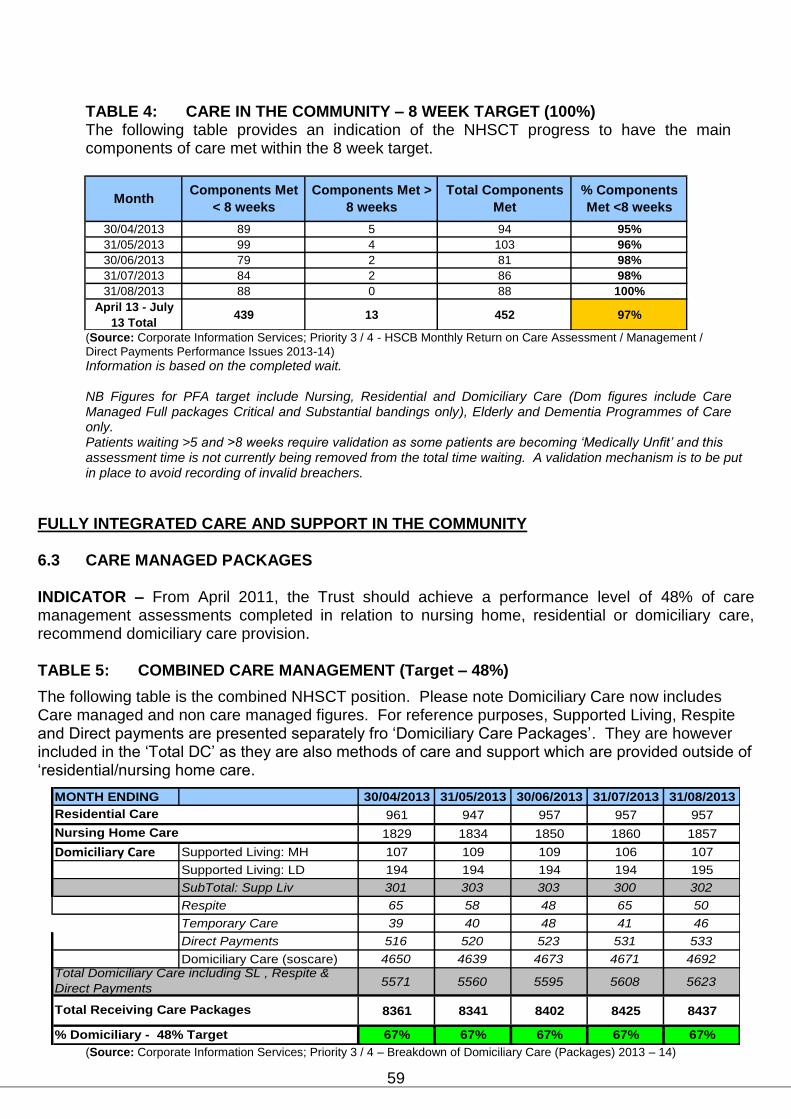
59
TABLE 4: CARE IN THE COMMUNITY – 8 WEEK TARGET (100%) The following table provides an indication of the NHSCT progress to have the main components of care met within the 8 week target.
30/04/2013 89 5 94 95%
31/05/2013 99 4 103 96%
30/06/2013 79 2 81 98%
31/07/2013 84 2 86 98%
31/08/2013 88 0 88 100%
April 13 - July
13 Total439 13 452 97%
Components Met >
8 weeks
Total Components
MetMonth
% Components
Met <8 weeks
Components Met
< 8 weeks
(Source: Corporate Information Services; Priority 3 / 4 - HSCB Monthly Return on Care Assessment / Management /
Direct Payments Performance Issues 2013-14)
Information is based on the completed wait. NB Figures for PFA target include Nursing, Residential and Domiciliary Care (Dom figures include Care Managed Full packages Critical and Substantial bandings only), Elderly and Dementia Programmes of Care only. Patients waiting >5 and >8 weeks require validation as some patients are becoming ‘Medically Unfit’ and this assessment time is not currently being removed from the total time waiting. A validation mechanism is to be put in place to avoid recording of invalid breachers.
FULLY INTEGRATED CARE AND SUPPORT IN THE COMMUNITY
6.3 CARE MANAGED PACKAGES INDICATOR – From April 2011, the Trust should achieve a performance level of 48% of care management assessments completed in relation to nursing home, residential or domiciliary care, recommend domiciliary care provision. TABLE 5: COMBINED CARE MANAGEMENT (Target – 48%)
The following table is the combined NHSCT position. Please note Domiciliary Care now includes Care managed and non care managed figures. For reference purposes, Supported Living, Respite and Direct payments are presented separately fro ‘Domiciliary Care Packages’. They are however included in the ‘Total DC’ as they are also methods of care and support which are provided outside of ‘residential/nursing home care.
MONTH ENDING 30/04/2013 31/05/2013 30/06/2013 31/07/2013 31/08/2013
961 947 957 957 957
1829 1834 1850 1860 1857
Domiciliary Care Supported Living: MH 107 109 109 106 107
Supported Living: LD 194 194 194 194 195
SubTotal: Supp Liv 301 303 303 300 302
Respite 65 58 48 65 50
Temporary Care 39 40 48 41 46
Direct Payments 516 520 523 531 533
Domiciliary Care (soscare) 4650 4639 4673 4671 4692
5571 5560 5595 5608 5623
8361 8341 8402 8425 8437
67% 67% 67% 67% 67%% Domiciliary - 48% Target
Residential Care
Nursing Home Care
Total Domiciliary Care including SL , Respite &
Direct Payments
Total Receiving Care Packages
(Source: Corporate Information Services; Priority 3 / 4 – Breakdown of Domiciliary Care (Packages) 2013 – 14)

60
6.4 DIRECT PAYMENT CASES INDICATOR – Increase the number of direct payment cases from 2011/12 outturn of 527.
TABLE 6: DIRECT PAYMENT CASES – August 2013
Directorate POC
Internal
POC target Mar-13
13/14
Target Aug-13
MHLD Dementia 14% 129 74 132
EPCOP Eldercare 32% 125 169 133
MHLD Learning Disability 4% 64 21 63
MHLD Mental Health 1% 5 5 7
MHLD Physical Disability 41% 143 216 148
CW Children's 8% 52 42 50
Total 100% 518 527 533 (Source: Corporate Information Services; Priority 3 / 4 - HSCB Monthly Return on Care Assessment / Management /
Direct Payments Performance Issues 2013 – 14)
Note: (i) The above table refers to all Direct Payment Cases which are open as at the end of July 2013. While there
have been additions, some clients have died during the year and therefore these cases have ceased. (ii) A number of Direct Payment Cases have changed to a “Caring Hands” contract and are not included in the above figures.
(iii) The Target split of 527 is under review within the Trust. This split is for internal purposes and is only a guide to assist achieving Trust target.
CHILDRENS TARGET Unallocated Cases
Indicator - All family support or disability referrals must be allocated to a named social worker within 20 working days.
TABLE 7: Unallocated Cases by Category > 20 Working Days
Category Aug-12 Sep-12 Oct-12 Nov-12 Dec-12 Jan-13 Feb-13 Mar-13 Apr-13 May-13 Jun-13 Jul-13
Gateway 18 29 33 41 100 39 43 0 0 0 8 3
Family Support / Family
Intervention Team 68 65 80 85 121 86 86 87 92 111 115 88
Disability 7 1 0 1 1 1 0 4 6 6 8 10
Total 93 95 113 127 222 126 129 91 98 117 131 101
100 % of Child Protection referrals to be allocated to a social worker within 24 hours of receipt of referral. April – July ‘13 = 100%
Planned reduction in unallocated cases has been impacted on by increased demand and fluctuating staff levels. Interviews have been completed to refresh the Social Worker waiting list and ways to escalate recruitment to vacant posts has been agreed with Human Resources. Analysis of caseload weighting measures indicates potential to temporarily redirect staff to reduce further the level of unallocated cases.
Notes - Figures include assessed cases not yet allocated to a named social worker but allocated to other staff
(e.g. family support workers) and in receipt of services. - Includes Initial Assessments completed within Gateway but not yet allocated to a named social worker
for Pathway Assessment etc.

APPENDIX 1: TABLE LIST
Section Table No Table Name Governance 3.0 1 Clinical Dashboard PfA Targets
2 Patient Safety Clinical Dashboard
Governance 3.1 HCAI Performance Report
1 HCAI Performance Dashboard
2 Infection Prevention & Control Validation Audits (carried out by IPCNs)
Governance 3.2 1 Complaints
Commissioner Targets and Associated Activity
1a , 1b, 1c SBA Activity Comparison
2 NHSCT SBA Volume Breakdown
3a,3b, 3c & 3d AHP New SBA, Additional Investment, Review Contacts and
Community Contacts
4 New & Unplanned Review Patients who depart A&E for the month
5 Antrim Hospital New & Unplanned Review Patients by Month
6 A&E 12 Hour Breachers
7 Admissions into Hospital via A&E
8 Clinical Coding Timeliness
Access / Waiting Time Targets
1a, 1b IP / DC & Endoscopy Core Patients by weeks waiting at month end
1c, 1d IP / DC & Endoscopy Independent Sector Patients by weeks waiting at month end
2 Waiting Times for IP/DC Backstop Specialties
3a OP Core by weeks waiting at month end
3b Visiting Consultant OP by weeks waiting at month end
4 Waiting Times for Outpatient Backstop Specialties
5 Mental Health Outpatient Waiters
6 Diagnostic Waiting List
7 Allied Health Professional Waiting List
8 Patients with confirmed Cancers with completed waits > 31 Day Target
9 Patients with confirmed Cancers with completed waits > 62 Day Target
10 % of "Urgently" referred patients seen at Breast Clinic within 2 weeks
Community Care & Associated Targets
1 Mental Health - Completed Waits
2 Learning Disability - Completed Waits
3 Care in the Community - Completed 8 week Target
4 Care in the Community - Completed 12 week Target
5 Combined Care Management
6 Direct Payment Cases
7 Unallocated Cases
APPENDIX 2: GRAPH LIST
Section Graph
No Graph Name
Governance 3.2 Complaints
1 Complaints Comparative Graph 2012/13 - 2013/14
Commissioner Targets and Associated Activity
1 Monthly % Departing A&E within 4 hours – All Hospital Sites
2 Antrim Hospital A&E New & Unplanned review attendances by source of referral
3 Total Hospital Cancellations for Non Clinical Reasons
4 % Admissions with valid PreOP Assessment Attendances