northern conference trainee satisfaction & feedback · 2 springboard northern conference...
TRANSCRIPT

Northern Conference Trainee Satisfaction & Feedback
Thunder Bay, November 6-7, 2014
Mark Schuler

2
Northern Conference Trainee Satisfaction & Feedback Report
Springboard
Mark Schuler
Manager, Program Design & Evaluation
Springboard Services
800-2 Carlton Street,
Toronto, Ontario
M5B 1J3
(416) 953-5635
Training Description…............................................................................p3 Methodology………................................................................................p4 Results………….......................................................................................p5 Appendix 1………………..……...………………………….…...p12
Table of Contents

3 Springboard
Training Description The HUB is an evidence-informed, not-for-profit, community-of-practice project focused on the continuous development, distribution, and support of high quality skill-development programming for at-risk youth and high quality knowledge exchange resources for facilitators.
The purpose of this evaluation is to demonstrate trends observed in feedback collected from trainees who participated in the 2014 HUB Northern Conference facilitator training event, held by Springboard on November 6th & 7th, at the Valhalla Inn, in Thunder Bay, Ontario.
A total of 26 youth/social workers from 12 different partnering sites, including five different Aboriginal agencies, were trained by three Springboard HUB instructors over a period of one and a half days, in the operation and facilitation of HUB programming. Table 1 below demonstrates the names of the sites, the numbers of persons trained, and the number of training feedback surveys completed.
Table 1
Site Trained Location Service Type # of Staff
Trained
WJS Canada Dryden Attendance Program 1
Nishnawbe Aski Legal Services Corporation
Attawapiskat Community Youth
Intervention Program 1
Nishnawbe Aski Legal Services Corporation
Ft. Albany Community Youth
Intervention Program 1
Nishnawbe Aski Legal Services Corporation
Thunder Bay HUB Community
Facilitator 3
Nishnawbe Aski Legal Services Corporation
Sandy Lake Community Youth
Intervention Program 1
Payukotayno Child & Family Service Moose Factory
Attendance Program 1
MCYS - Justice Ronald Lester Youth Centre
Thunder Bay Secure Facility
(direct operated) 3
MCYS - Donald Doucet Youth Centre Sault Ste. Marie Secure Facility
(direct operated) 3
William W. Creighton Youth Services, J.J. Kelso Centre
Thunder Bay Secure Facility 8
Nog-Da-Win-Da-Min Child & Family Service
Sault Ste. Marie Child & Family Ser-
vices 1
Ininew Friendship Centre, Meequam Residence
Cochrane Open Custody Facility 2
Indian Friendship Centre Sault Ste. Marie Social Service Agency 1

4
Northern Conference Trainee Satisfaction & Feedback Report
Springboard
The training reviewed the correct set up and operation of HUB hardware and software. The training covered the intended facilitation of the HUB Northern Ontario Anger Management Program (NOAMP), the HUB Northern Ontario Substance Abuse Prevention program (NOSAP), the HUB Employment Program (EMP) and the HUB Financial Literacy Program (FL). The training introduced participants to the new HUB Web Portal and the various knowledge exchange resources for facilitators available through the site. The training reviewed the correct use and submission of the HUB’s client tracking system and client satisfaction and feedback surveys.
Training was guided by printed program manuals. Program manuals include instructions on how to operate the HUB interface and launch and navigate the various HUB programs. The manuals state the learning objectives (for the youth) for each session, and provide detailed instructions on how to facilitate the many interactive exercises and activities found within each program. Background information on key health-promotion topics informing the HUB program sessions is provided for the benefit of the facilitators.
Methodology The overall goal of the training was to provide trainees with a structured opportunity to acquire the knowledge, skills, and confidence they require to effectively facilitate HUB programs with at-risk/ in-need youth in their communities. To this end, a ten question, trainee satisfaction and feedback survey was administered to participants at the end of the training.
The trainee satisfaction and feedback survey consists of nine 1-6 Likert-like items followed by a single open ended item: (“Additional Comments”). The satisfaction survey utilized two different styles of Likert-like questions:
Style 1:
Style 2:
The final, tenth question on the survey (Q.10: Additional Comments…) functioned as an open-ended invitation for trainees to express their opinions on any aspect of the training.
Of the 26 people trained at the conference, 22 completed the nine question client satisfaction survey, and 13 trainees responded to the single, open-ended feedback question.
The nine Likert-like item Trainee Satisfaction Survey was determined to function as a reliable scale. A Cronbach’s alpha of .854 was found for the scale (n = 22), with all questions except questions 1 and 2 contributing to the overall reliability of results (the impact of questions 1 and 2 on the overall result was very marginal). This indicates that the survey operates within an acceptable level of internal consistency, and produces reasonably reliable results.
1 2 3 4 5 6
Strongly
Disagree
Disagree Slightly
Disagree
Slightly
Agree
Agree Strongly
Agree
1 2 3 4 5 6 Not Confi-dent at All
Mostly Not Confident
Slightly Not Confident
Slightly Confident
Confident Very Confident

5 Springboard
Mean and median values for individuals’ total survey scores were calculated to determine the overall level of trainee satisfaction.
Mean values for individual Likert-like items were determined to better identify areas of the training in need of improvement. To this end, each item’s mean score was considered along with the rank score of its mean, its median value, the item’s response frequencies and distribution shape, and the item’s congruence with any related qualitative indicators. Of particular interest is each item’s ratio of “favourable” to “unfavourable” responses. The extent to which the distribution of responses on an item features a preponderance of responses in the “5” and “6” choice-options (of “agree” or “strongly agree”) and a paucity of responses in the “1”, “2”, “3”, or “4” choice-options (of “strongly disagree”, “disagree”, “slightly disagree”, or “slightly agree”) is important because the overall goal in customer satisfaction is to have no responses lower than choice-option “5” (“agree”).
Qualitative responses to the single, open-ended, tenth question at the end of the survey were coded to determine both the frequency of topics commented on by the trainees, as well as the ratio of positive to negative comments made within each topic of commentary.
Results Chart 1, below, illustrates the response frequencies for each individual choice-option appearing on the nine, 1-6, Likert-like items (i.e.: how often did respondents select choice-option “5” Agree / Confident; how often did respondents select choice-option “6” Strongly Agree / Very Confident; and so on).
There were a total of 198 individual responses to the nine Likert-like questions. If we consider the borderline choice-option “4” (Slightly Satisfied or Slightly Confident) as a “negative” response, then 26 responses (or 13.13% of responses), were negative, while 172 responses (or 86.87%) were positive. Chart 2, below, illustrates that the ratio of clearly positive responses (choice-options “6” and “5”) to negative responses (choice-options “1”, “2”, “3”, & “4”) is 6.6 : 1.
Chart 1

6
Northern Conference Trainee Satisfaction & Feedback Report
Springboard
Chart 3, below, is a histogram distribution of individual scores on the nine question trainee satisfaction survey. The mean of the distribution represents the overall rate of trainee satisfaction. The indicated rate of trainee satisfaction is 86%, which mirrors the overall satisfactory results shown in Chart 1.
Chart 3
Chart 2

7 Springboard
Charts 4 to 12, below, demonstrate the response choices of trainees for each individual question.
Charts 8 & 9
Charts 4 & 5
Charts 6 & 7

8
Northern Conference Trainee Satisfaction & Feedback Report
Springboard
Overall, the series of charts above replicate the very positive trends evinced in Charts 1 and 2.
In this study, the main reason for consideration of the mean values of individual Likert items is to try to better identify areas of the training in need of improvement. To this end, each item’s mean score is considered alongside consideration of other values observed for the item. Table 2 below outlines the “context” of the mean value for each of the nine individual Likert-like items on the survey.
Charts 10 & 11
Chart 12

9 Springboard
Trainees felt very positive about the trainers, the venue, HUB implementation, the relevance of the programming, and the value of the training (see questions 1, 2, 5, 6 & 9 – highlighted in grey above). These items generated the highest ranked averages and the most favourable ratios of positive to negative comments.
Items that point to areas of the HUB training in need of improvement include question 3 (Confidence with the operation of the HUB), question 4 (Confidence with understanding HUB content), question 7 (Helpfulness of the printed manual), and question 8 (Confidence with ability to track HUB program delivery). These questions show the largest number of respondents selecting choice-options lower than choice-option “5”, and have the lowest ratios of positive to negative responses.
The final question on the survey, Question 10: “Additional Comments”, is an open ended question where trainees are invited to write something about their overall experience of the training. Of the 22 trainees who completed the training feedback survey (answering all of the Likert-type questions), 10 respondents, or 45.45%, chose to answer question 10 by including one or more brief comments. In total, 10 respondents produced some 13 distinct comments. See Appendix 1 at the end of this report for a copy of all recorded comments.
Chart 13 below, demonstrates the ratio of positive to negative comments made by facilitators in response to the open-ended question 10 (Additional Comments).
Table 2
Q
#
Question
Topic
Mean
Score
Mean
Score
Rank
Response
Value of Mean
Score
Median
# of Responses
Below Choice “5”
(Agree /
Confident)
Ratio of
Positive to
Negative
Responses
1 Trainer 87% 3 Strongly Agree (6) 83% 1 respondent 21 : 1
2 Venue 90% 1 Strongly Agree (6) 83% 1 respondents 21 : 1
3 HUB Operation 83% 6 Confident (5) 83% 7 respondents 2.1 : 1
4 HUB Content 85% 4 Very Confident (6) 83% 5 respondents 3.4 : 1
5 HUB
Implementation 87% 3 Very Confident (6) 83 % 2 respondents 10 : 1
6 Health
Promoting (relevance)
87% 3 Strongly Agree (6) 83% 1 respondent 21 : 1
7 HUB Manuals 84% 5 Strongly Agree (6) 83% 4 respondent 4.5 : 1
8 HUB Tracking 83% 6 Confident (5) 83% 5 respondents 3.4 : 1
9 Value of Training
89% 2 Strongly Agree (6) 83% 0 respondents 100% positive
10
Northern Conference Trainee Satisfaction & Feedback Report
Springboard
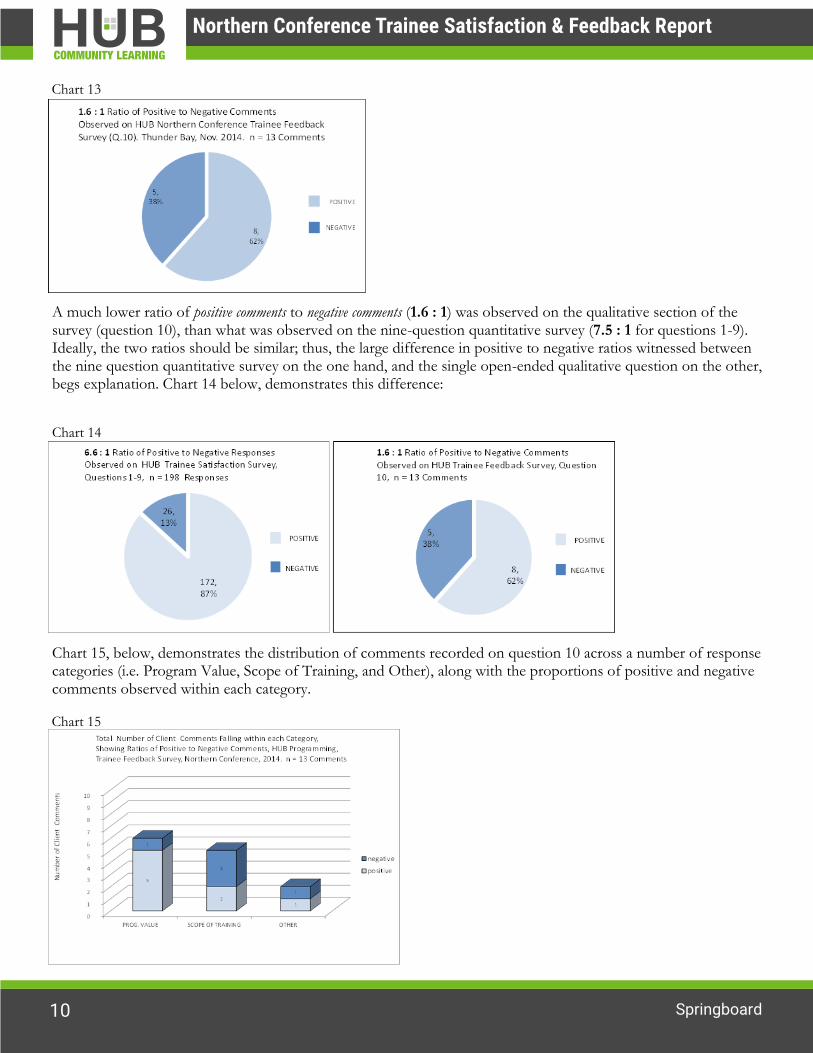
A much lower ratio of positive comments to negative comments (1.6 : 1) was observed on the qualitative section of the survey (question 10), than what was observed on the nine-question quantitative survey (7.5 : 1 for questions 1-9). Ideally, the two ratios should be similar; thus, the large difference in positive to negative ratios witnessed between the nine question quantitative survey on the one hand, and the single open-ended qualitative question on the other, begs explanation. Chart 14 below, demonstrates this difference:
Chart 15, below, demonstrates the distribution of comments recorded on question 10 across a number of response categories (i.e. Program Value, Scope of Training, and Other), along with the proportions of positive and negative comments observed within each category.
Chart 14
Chart 13
Chart 15

11 Springboard
Chart 15 shows that the scope of training was the primary area of concern for participants who provided qualitative feedback. While positive comments on the survey included appreciation of the instructors, recognition of the relevance of HUB programming for the youth, and enjoyment of the overall training event, the negative comments indicated that there was “too much info for one and a half days” and that at times the volume of presented material seemed “excessive”. Interestingly, concerns about the scope of the training and an attempt to cover what turned out to be too much material in one and a half days, seems evident in the lower scoring questions on the Trainee Satisfaction Survey. Survey questions relating to the operation of the HUB, the use of program manuals, and the utilization of the client tracking system, scored slightly lower than other survey questions, indicating, perhaps, that trainees were not afforded the time they required to feel confident in these areas of detailed operation.
The one and half day conference was organized around the following itinerary:
One full day of travel to Thunder Bay
1st night at the conference hotel
One full-day training,
2nd night at the conference hotel
Half-day training (a.m.)
Half-day of travelling (p.m.)
The second day of the conference was only a half day (morning) of training, in order to allow participants time in the afternoon to travel home. The feedback received from the trainees, as well as an examination of travel receipts, suggest that the half-day of travel provided for participants was not effective in promoting either a well-paced conference, or an easy trip home. Many of the participants from remote communities required connecting flights and therefore a full day of return travel. These individuals ended up staying a 3rd night at some hotel along the route of their connecting flights. It would have been much better to utilize two full days of training (so that the agenda would not be so crammed), utilize a 3rd night at the conference hotel, and then leave participants with a full day to travel back to their communities:
Full day of travel to Thunder Bay
1st night at the conference hotel
First full-day training,
2nd night at the conference hotel
Second full-day of training
3rd night at the conference hotel
Full day to travel home
These types of travel considerations are absolutely crucial for planning conference-based training in the North.

12
Northern Conference Trainee Satisfaction & Feedback Report
Springboard
Appendix 1
HUB Trainee Responses to Question #10: “Additional Comments”
Trainee Comments
NC1 A lot of programs are not geared towards realities of youth from Northern communities (First Nation) although most clients a majority are First Nation
NC2 A few tips for facilitators … the page by page, slide by slide style of presenting the information seemed very excessive. Your audience had many very experienced youth workers who present a variety of materials, including the Hub program. Also at times, the presentation was dry, seemed to go off on a tangent.
NC3 I have internet problem
NC4 Great program!!
NC5 Really enjoyed the workshop & the training! We use the programme often.
NC6 Great venue and knowledgeable instructors. I think I will have a better idea of how youth will respond as I deliver the program.
NC7 I love these programs, the updates they have done from the training that was done in 2013 are great. I can't wait to see the next update!!
NC8 Very new presentation tool that I think will keep youth interested.
NC9 Well done - looking forward to implementing these programs!
NC10 Too much info for 1 & a half days.
NC11
NC12
NC13
NC14
NC15
NC16
NC17
NC18
NC19
NC20
NC21
NC22
Table 3