northeastern north american pleistocene megafauna
TRANSCRIPT

lable at ScienceDirect
Quaternary Science Reviews 85 (2014) 35e46
Contents lists avai
Quaternary Science Reviews
journal homepage: www.elsevier .com/locate/quascirev
Northeastern North American Pleistocene megafauna chronologicallyoverlapped minimally with Paleoindians
Matthew T. Boulanger a,b,*, R. Lee Lyman a
aDepartment of Anthropology, 107 Swallow Hall, University of Missouri, Columbia, MO 65211, USAbArchaeometry Laboratory, University of Missouri Research Reactor, 1513 Research Park Drive, Columbia, MO 65211, USA
a r t i c l e i n f o
Article history:Received 8 May 2013Received in revised form26 November 2013Accepted 28 November 2013Available online
Keywords:ExtinctionMegafaunaNorth AmericaPaleoindianRadiocarbon
* Corresponding author. Department of Anthropolversity of Missouri, Columbia, MO 65211, USA.
E-mail addresses: [email protected], mattT. Boulanger).
0277-3791/$ e see front matter � 2013 Elsevier Ltd.http://dx.doi.org/10.1016/j.quascirev.2013.11.024
a b s t r a c t
It has long been argued that specialized big-game-hunting Paleoindians were responsible for theextinction of three dozen large-bodied mammalian genera in North America. In northeastern NorthAmerica, the overkill hypothesis cannot be tested on the basis of associations of Paleoindian artifacts andremains of extinct mammals because no unequivocal associations are known. The overkill hypothesisrequires Paleoindians to be contemporaneous with extinct mammalian taxa and this provides a means toevaluate the hypothesis, but contemporaneity does not confirm overkill. Blitzkrieg may produce evidenceof contemporaneity but it may not, rendering it difficult to test. Overkill and Blitzkrieg both require largemegafaunal populations. Chronological data, Sporormiella abundance, genetics, and paleoclimatic datasuggest megafauna populations declined prior to human colonization and people were only brieflycontemporaneous with megafauna. Local Paleoindians may have only delivered the coup de grace tosmall scattered and isolated populations of megafauna.
� 2013 Elsevier Ltd. All rights reserved.
1. Introduction
During the late Pleistocene, North America lost 36 genera ofmammals, most of them (N ¼ 30) large-bodied (�44 kg). Thirtygenerawent globally extinct, but the remainder survived elsewhere(Grayson, 2011). Paleontologists and archaeologists have debatedthe causes of these extinctions for decades (Grayson, 1980, 1984a),with purported growing consensus on a single cause an illusion(Barnosky et al., 2004; Grayson, 2006, 2007; Koch and Barnosky,2006; Surovell, 2008; Ripple and Van Valkenburgh, 2010). Themost popular causes are overkill by humans (Wesler, 1981; Fiedeland Haynes, 2004; Martin, 2005; Surovell et al., 2005; Haynes,2007, 2009; Surovell and Waguespack, 2009) and environmentalchange of one sort or another (Graham and Lundelius, 1984;Guthrie, 1984; Haynes, 2008; Nogués-Bravo et al., 2010). A hyper-disease has also been suggested as the cause (MacPhee and Marx,1997), but no known diseases have the properties necessary towipe out genetically unrelated genera (e.g., Lyons et al., 2004). Arecently proposed extraterrestrial impact at 12,900 BP (Firestoneet al., 2007) as the cause has been extensively questioned
ogy, 107 Swallow Hall, Uni-
All rights reserved.
(Buchanan et al., 2008; Marlon et al., 2009; Surovell et al., 2009b;Daulton et al., 2010; Haynes et al., 2010; Pigati et al., 2012), andwe do not consider it here.
Studies examining the chronologies of Pleistocene extinctionsand Paleoindian arrivals into the North American continent havetended to adopt a continent-wide perspective (e.g., Buchanan et al.,2008; Haynes, 2008). Yet, these large-scale studies tend to bebiased by the rich paleontological and archaeological records ofwestern North Americadspecifically the Great Plains and AmericanSouthwestdrelative to that of eastern North America (Meltzer,1988; Lepper and Meltzer, 1991). Moreover, although continent-wide studies provide general views of historical events, theydiminish resolution and mask details that may have importantbearing on regional issues. Just as the history of a fauna can beunderstood only through the histories of individual speciescomposing that fauna (Grayson, 2007), so too the history ofcontinent-wide extinctions can be understood only through theextinction histories of individual regions (e.g., Lima-Ribeiro andDiniz-Filho, 2013). This issue of scale is commonly acknowledgedin modern ecology and evolution (e.g., Landres, 1992; Callicott,2002; Frankham and Brook, 2004; Berkes, 2006), and we viewextinction, regardless of its cause(s), as an ecological and evolu-tionary process.
Here, we adopt a fine-scale approach to the question of humaninvolvement in the extinction processes of Pleistocene megafaunain northeastern North America, defined here as the New England

M.T. Boulanger, R.L. Lyman / Quaternary Science Reviews 85 (2014) 35e4636
states and neighboring states of New York, New Jersey, and Penn-sylvania, and adjacent portions of the provinces of Quebec andOntario in Canada. Though several purported associations ofmegafauna remains with human material culture have been re-ported from this region, none of these has provided unequivocalevidence of human predation on megafauna despite over 100 yearsof archaeological and paleontological research. In spite of thisabsence of evidence, and perhaps a bit because of it, the belief thatPaleoindians hunted megafauna has assumed the qualities of an“almost romantic myth” (Dent, 1991:37). That is, it has become aproposition that is either directly or indirectly asserted, but as yethas not been directly evaluated (e.g., Dragoo, 1976:9; Haviland andPower, 1994:28; Lake, 2003:35; Wiseman, 2001:20e23). Straight-forward testing of human hunting of megafauna has been difficultfor want of uncontested associations of megafauna and Paleo-indians. Here we examine the viability of the overkill hypothesisthrough analysis of available chronometric evidence for contem-poraneity of humans and extinct megafauna.
2. Background
The overkill hypothesis, first described by Martin (1967, 1973),continues to have advocates (e.g., Surovell et al., 2005; Surovell andWaguespack, 2008; Fiedel, 2009; Haynes, 2009) and naysayers(e.g., Grayson and Meltzer, 2002, 2003, 2004; Grayson, 2007;Nagaoka, 2012). Because terminal ages of some genera indicatethey went extinct at approximately the same time, some analystsargue that all genera went extinct simultaneously (e.g., Haynes,2008; Fiedel, 2009). Though certainly possible, the age of extinc-tion of more than half the genera is unclear, perhaps because ofsampling error (Faith and Surovell, 2009). Models suggest humans(e.g., Mosimann andMartin, 1975; Alroy, 2001; Brook and Bowman,2004) or climate (e.g., Nogués-Bravo et al., 2010) could have causedthe extinctions, but the prehistoric record must be the final arbiterof timing as well as of cause (Grayson, 2007; Wolverton et al.,2009).
Simulations (e.g., Mosimann and Martin, 1975) and empiricaldata (e.g., Hamilton and Buchanan, 2007; Waters and Stafford,2007; Haynes, 2008; Fiedel, 2009) imply rapid human coloniza-tion of North America. Northeastern North America is believed tohave been colonized late relative to more western areas (Ellis et al.,1998; Hamilton and Buchanan, 2007; Waters and Stafford, 2007;Faught, 2008; Ellis, 2011; Miller and Gingerich, 2013). The meanage of 10,900 14C YBP (12,800 cal BP1) for Clovis (Waters andStafford, 2007) is older than all but one northeastern Paleoindiansite: ShawneeeMinisink in southern Pennsylvania (Gingerich,2007a, 2007b, 2011).
3. Hypotheses
The chronology of extinctions is critical to deciphering theircause (Grayson, 2007; Faith and Surovell, 2009; Fiedel, 2009). If all36 genera went extinct at approximately the same time (within,say, 500e1000 years), that will have implications for cause that aredifferent than those suggested by the 36 genera going extinct over,say, 5000, or 10,000 years (Martin, 1986; Fiedel, 2009). Chronologyis also critical to the overkill hypothesis because remains of pre-historic people and remains of the extinct megafauna must, at aminimum, be contemporaneous. If there is no evidence thathumans and extinct fauna were contemporaries, then the overkillhypothesis could not be sustained. If the two are contemporaries,
1 All dates cited in text are calibrated using IntCal13 (Reimer et al., 2013) andgiven as the mean of the areas of highest probability at the two-sigma level.
overkill would not be confirmed but neither would it be refuted(e.g., Haynes and Stanford, 1984; Lima-Ribeiro and Diniz-Filho,2013).
When Paul Martin originally outlined the overkill hypothesis, headvocated human hunting as the singular cause of the terminalPleistocene extinctions. His major line of evidence for the overkillhypothesis was the apparent contemporaneity of the appearance ofPaleoindians in North America and the extinctions (Martin,1966:342; 1967:75, 115; 1973:969; 1974:680; Mosimann andMartin, 1975:304). Lack of contemporaneity of the two eventswould falsify the original overkill hypothesis. The test implicationsof Martin’s hypothesis are (i) the two phenomena must becontemporary, and (ii) populations of megafaunamust be large andnot in decline when humans first appear on the landscape. Thelatter rests in Martin’s belief that only humans were responsible forthe extinction rather than, say, a combination of environmentalchange and human predation.
When faced with the fact that there were few documenteddirect associations of humans and extinct megafauna and few killsites, Martin (1973:969) proposed the “Blitzkrieg” version of theoverkill hypothesis: “Extinction [that is, Blitzkrieg overkill] wouldhave occurred before there was opportunity for the burial of muchevidence by normal geological processes. Poor paleontologicalvisibility would be inevitable”. Using estimates of the rate of kill sitecreation (with no empirical or theoretical warrant) and theirresulting (exceedingly low) density on the landscape, Martin(1973:974) concluded “it is clear that the probability of the fieldevidence actually being detected and appreciated by the discov-erers of the bones is small.”
Martin and Steadman (1999:34) later noted the Blitzkriegmodel“accommodates a tight chronology, with no more than a fewhundred years of overlap between human colonization andmegafaunal extinction within the United States and as little as adecade of overlap of extinct fauna and first colonists in any oneregion.” The test implications of Blitzkrieg are (i) contemporaneity,or (ii) no evidence of contemporaneity given (a) the real-timebrevity of overkill, (b) the resolution of radiocarbon dating, and(c) the low probability of finding and dating the last of the mega-fauna and the oldest archaeological material. Blitzkrieg is quitedifficult to test because both its occurrence and its non-occurrencecan produce no evidence of the contemporaneity of humans andmegafauna (Grayson, 1984b).
Although there are no megafauna kill sites in the Northeast,there is no scarcity of terminal Pleistocene megafauna. Remains ofat least 140 individual mastodon and 18 mammoths have beenrecovered in New York alone (Hartnagel and Bishop, 1922; Fisher,1955; Thompson et al., 2008). A 2009 compilation prepared atthe Earth SciencesMuseumUniversity ofWaterloo contains recordsof 160 proboscidean finds in southern Ontario.2 Other sites andremains of other taxa are known elsewhere. In the Northeast itseems highly likely that neither poor preservation of the remains ofextinct mammalian genera nor sampling error has created a lack ofevidence of contemporaneity.
Finally, Martin (1967:102) indicated “clear-cut cases of massiveunbalanced Pleistocene extinction before man [appears]” wouldfalsify overkill. Evidence of population depletion followed chro-nologically by human appearance would accommodate somecontemporaneity of the two, and suggest people delivered the coupde grace to megafaunal populations that were on the verge ofextirpation. This hypothesis accommodates the view of researcherswho favor a middle ground in which both human hunting and
2 Available on-line at https://uwaterloo.ca/earth-sciences-museum/life-earth/ice-age-mammals. Last accessed February 15, 2013.
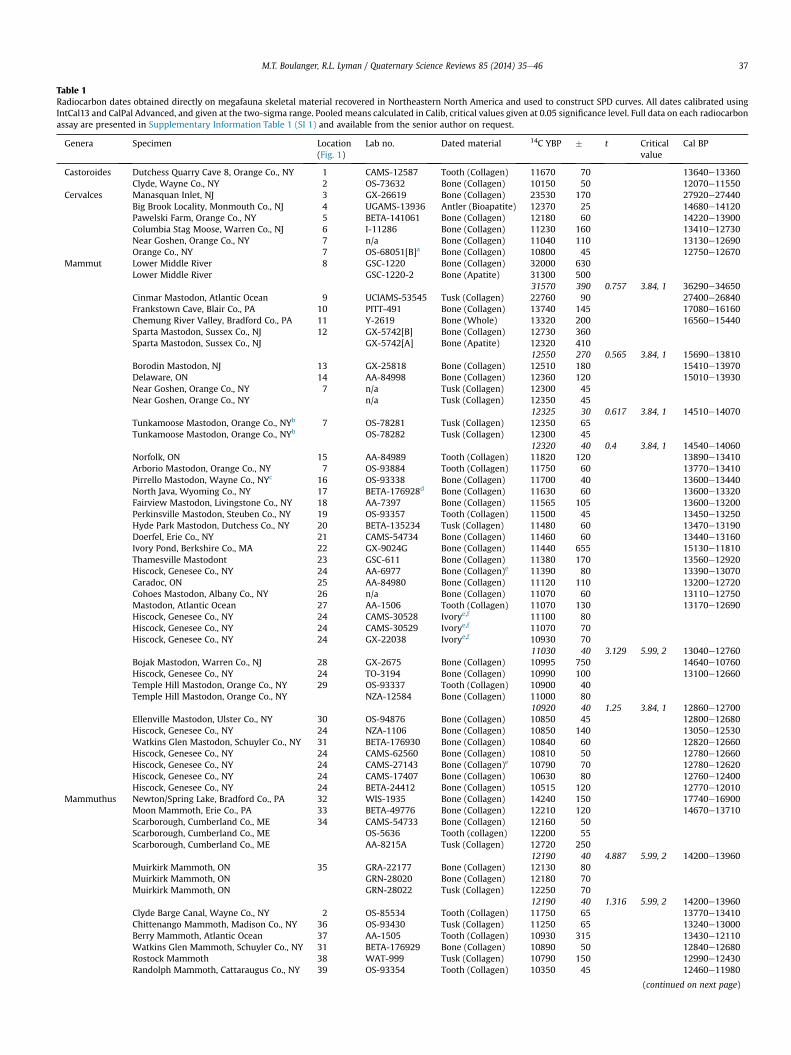
Table 1Radiocarbon dates obtained directly on megafauna skeletal material recovered in Northeastern North America and used to construct SPD curves. All dates calibrated usingIntCal13 and CalPal Advanced, and given at the two-sigma range. Pooled means calculated in Calib, critical values given at 0.05 significance level. Full data on each radiocarbonassay are presented in Supplementary Information Table 1 (SI 1) and available from the senior author on request.
Genera Specimen Location(Fig. 1)
Lab no. Dated material 14C YBP � t Criticalvalue
Cal BP
Castoroides Dutchess Quarry Cave 8, Orange Co., NY 1 CAMS-12587 Tooth (Collagen) 11670 70 13640e13360Clyde, Wayne Co., NY 2 OS-73632 Bone (Collagen) 10150 50 12070e11550
Cervalces Manasquan Inlet, NJ 3 GX-26619 Bone (Collagen) 23530 170 27920e27440Big Brook Locality, Monmouth Co., NJ 4 UGAMS-13936 Antler (Bioapatite) 12370 25 14680e14120Pawelski Farm, Orange Co., NY 5 BETA-141061 Bone (Collagen) 12180 60 14220e13900Columbia Stag Moose, Warren Co., NJ 6 I-11286 Bone (Collagen) 11230 160 13410e12730Near Goshen, Orange Co., NY 7 n/a Bone (Collagen) 11040 110 13130e12690Orange Co., NY 7 OS-68051[B]a Bone (Collagen) 10800 45 12750e12670
Mammut Lower Middle River 8 GSC-1220 Bone (Collagen) 32000 630Lower Middle River GSC-1220-2 Bone (Apatite) 31300 500
31570 390 0.757 3.84, 1 36290e34650Cinmar Mastodon, Atlantic Ocean 9 UCIAMS-53545 Tusk (Collagen) 22760 90 27400e26840Frankstown Cave, Blair Co., PA 10 PITT-491 Bone (Collagen) 13740 145 17080e16160Chemung River Valley, Bradford Co., PA 11 Y-2619 Bone (Whole) 13320 200 16560e15440Sparta Mastodon, Sussex Co., NJ 12 GX-5742[B] Bone (Collagen) 12730 360Sparta Mastodon, Sussex Co., NJ GX-5742[A] Bone (Apatite) 12320 410
12550 270 0.565 3.84, 1 15690e13810Borodin Mastodon, NJ 13 GX-25818 Bone (Collagen) 12510 180 15410e13970Delaware, ON 14 AA-84998 Bone (Collagen) 12360 120 15010e13930Near Goshen, Orange Co., NY 7 n/a Tusk (Collagen) 12300 45Near Goshen, Orange Co., NY n/a Tusk (Collagen) 12350 45
12325 30 0.617 3.84, 1 14510e14070Tunkamoose Mastodon, Orange Co., NYb 7 OS-78281 Tusk (Collagen) 12350 65Tunkamoose Mastodon, Orange Co., NYb OS-78282 Tusk (Collagen) 12300 45
12320 40 0.4 3.84, 1 14540e14060Norfolk, ON 15 AA-84989 Tooth (Collagen) 11820 120 13890e13410Arborio Mastodon, Orange Co., NY 7 OS-93884 Tooth (Collagen) 11750 60 13770e13410Pirrello Mastodon, Wayne Co., NYc 16 OS-93338 Bone (Collagen) 11700 40 13600e13440North Java, Wyoming Co., NY 17 BETA-176928d Bone (Collagen) 11630 60 13600e13320Fairview Mastodon, Livingstone Co., NY 18 AA-7397 Bone (Collagen) 11565 105 13600e13200Perkinsville Mastodon, Steuben Co., NY 19 OS-93357 Tooth (Collagen) 11500 45 13450e13250Hyde Park Mastodon, Dutchess Co., NY 20 BETA-135234 Tusk (Collagen) 11480 60 13470e13190Doerfel, Erie Co., NY 21 CAMS-54734 Bone (Collagen) 11460 60 13440e13160Ivory Pond, Berkshire Co., MA 22 GX-9024G Bone (Collagen) 11440 655 15130e11810Thamesville Mastodont 23 GSC-611 Bone (Collagen) 11380 170 13560e12920Hiscock, Genesee Co., NY 24 AA-6977 Bone (Collagen)e 11390 80 13390e13070Caradoc, ON 25 AA-84980 Bone (Collagen) 11120 110 13200e12720Cohoes Mastodon, Albany Co., NY 26 n/a Bone (Collagen) 11070 60 13110e12750Mastodon, Atlantic Ocean 27 AA-1506 Tooth (Collagen) 11070 130 13170e12690Hiscock, Genesee Co., NY 24 CAMS-30528 Ivorye,f 11100 80Hiscock, Genesee Co., NY 24 CAMS-30529 Ivorye,f 11070 70Hiscock, Genesee Co., NY 24 GX-22038 Ivorye,f 10930 70
11030 40 3.129 5.99, 2 13040e12760Bojak Mastodon, Warren Co., NJ 28 GX-2675 Bone (Collagen) 10995 750 14640e10760Hiscock, Genesee Co., NY 24 TO-3194 Bone (Collagen) 10990 100 13100e12660Temple Hill Mastodon, Orange Co., NY 29 OS-93337 Tooth (Collagen) 10900 40Temple Hill Mastodon, Orange Co., NY NZA-12584 Bone (Collagen) 11000 80
10920 40 1.25 3.84, 1 12860e12700Ellenville Mastodon, Ulster Co., NY 30 OS-94876 Bone (Collagen) 10850 45 12800e12680Hiscock, Genesee Co., NY 24 NZA-1106 Bone (Collagen) 10850 140 13050e12530Watkins Glen Mastodon, Schuyler Co., NY 31 BETA-176930 Bone (Collagen) 10840 60 12820e12660Hiscock, Genesee Co., NY 24 CAMS-62560 Bone (Collagen) 10810 50 12780e12660Hiscock, Genesee Co., NY 24 CAMS-27143 Bone (Collagen)e 10790 70 12780e12620Hiscock, Genesee Co., NY 24 CAMS-17407 Bone (Collagen) 10630 80 12760e12400Hiscock, Genesee Co., NY 24 BETA-24412 Bone (Collagen) 10515 120 12770e12010
Mammuthus Newton/Spring Lake, Bradford Co., PA 32 WIS-1935 Bone (Collagen) 14240 150 17740e16900Moon Mammoth, Erie Co., PA 33 BETA-49776 Bone (Collagen) 12210 120 14670e13710Scarborough, Cumberland Co., ME 34 CAMS-54733 Bone (Collagen) 12160 50Scarborough, Cumberland Co., ME OS-5636 Tooth (collagen) 12200 55Scarborough, Cumberland Co., ME AA-8215A Tusk (Collagen) 12720 250
12190 40 4.887 5.99, 2 14200e13960Muirkirk Mammoth, ON 35 GRA-22177 Bone (Collagen) 12130 80Muirkirk Mammoth, ON GRN-28020 Bone (Collagen) 12180 70Muirkirk Mammoth, ON GRN-28022 Tusk (Collagen) 12250 70
12190 40 1.316 5.99, 2 14200e13960Clyde Barge Canal, Wayne Co., NY 2 OS-85534 Tooth (Collagen) 11750 65 13770e13410Chittenango Mammoth, Madison Co., NY 36 OS-93430 Tusk (Collagen) 11250 65 13240e13000Berry Mammoth, Atlantic Ocean 37 AA-1505 Tooth (Collagen) 10930 315 13430e12110Watkins Glen Mammoth, Schuyler Co., NY 31 BETA-176929 Bone (Collagen) 10890 50 12840e12680Rostock Mammoth 38 WAT-999 Tusk (Collagen) 10790 150 12990e12430Randolph Mammoth, Cattaraugus Co., NY 39 OS-93354 Tooth (Collagen) 10350 45 12460e11980
(continued on next page)
M.T. Boulanger, R.L. Lyman / Quaternary Science Reviews 85 (2014) 35e46 37

Table 1 (continued )
Genera Specimen Location(Fig. 1)
Lab no. Dated material 14C YBP � t Criticalvalue
Cal BP
Ovibos Elizabethtown Musk Ox 40 AA-4935 Bone (Collagen) 11362g 115 13440e13000Platygonus Dutchess Quarry Cave 8, Orange Co., NY 1 CAMS-12592 Tooth (Collagen) 12430 70 14990e14110
Dutchess Quarry Cave 8, Orange Co., NY 1 CAMS-13027 Tooth (Collagen) 12220 60Dutchess Quarry Cave 8, Orange Co., NY 1 CAMS-13057 Tooth (Collagen) 12160 80
12200 50 0.36 3.84, 1 14230e13950Wyoming Co., NY 41 OS-68051[A]a Bone (Collagen) 10750 50 12740e12620
Proboscidean Camburn Elephant, Monmouth Co., NJ 42 GX-18789 Bone (Collagen) 12470 260 15530e13770
** Reporting authors recommend averaging these two dates alone, although AA-8215A (12720 þ/� 250) is statistically identical.a Duplicate laboratory numbers given in same publication. Authors note of the Cervalces specimen: "This specimen is likely the same specimen previously dated by Buckley
and Willis (1970) and reported by Funk et al. (1970) as the C. scotti (NYSM 24123) from the Dewey Parr locality (I-4016).” Specimen I-4016 (10950 þ/� 150 14C YBP) wasexcluded from our analyses but the date is statistically identical to this more-recent assay (t ¼ 0.917, c2
(.05, 1) ¼ 3.84).b Specimens derive from the same locality, and dates are statistically identical; however, reporting authors make no mention of the possibility that they derive from the
same mastodon individual. Here, we adopt a conservative approach and treat the two specimens as representing the same individual.c An assay conducted on this same individual at some point prior to 1974 is reported by Reilly (1974) and returned a date of 10340 þ/� 170 14C YBP(no laboratory number
provided). We prefer the more-recent AMS assay reported bydand also preferred bydFeranec and Kozlowski (2012).d Hodgson and colleagues in the abstract of their paper in the same volume in which this date is published list this assay as 11560þ/� 60. We use the date as given by Griggs
and Kromer (2008) because (1) their chapter explicitly deals with analysis of radiocarbon dates from this site, and (2) by cross-reference to other published accounts of thisdate.
e Reporting authors (Tankersley et al., 1998) do not explicitly identify this specimen as mastodon bone; however, see McAndrews (2003) and Laub (2003).f Three assays on same specimen of ivory. See McAndrews (2003) and Laub (2003).g Rayburn et al. (2007) correct the original AMS date using an estimated 13C value.
M.T. Boulanger, R.L. Lyman / Quaternary Science Reviews 85 (2014) 35e4638
climatic change were important but individually partial causes(Barnosky et al., 2004; Koch and Barnosky, 2006; Nikoloskiy et al.,2011). But again, evidence of contemporaneity does not meanpeople had a causal hand in the extinction process; rather, it onlyindicates they could have.
4. Materials and methods
Northeastern North American Paleoindian peoples are identifiedbydiagnosticfluted andunfluted stone lanceolate bifacial tools (Elliset al., 1998; Newby et al., 2005; Bradley et al., 2008; Lothrop et al.,2011). Extinct megafauna are defined as mammalian taxa withestimated body masses exceeding 44 kg that have been eitherregionally or globally extinct since the PleistoceneeHolocene tran-sition, ca 11,000e10,000 14C YBP (12,800e11,500 cal BP). Taxameeting this definition include mastodon (Mammut sp.), Scott’sstag-moose (Cervalces scotti), mammoth (Mammuthus sp.), giantbeaver (Castoroides ohioensis), musk ox (Ovibos moschatus), flat-headed peccary (Platygonus compressus), and Steppe bison (Bisonpriscus [formerly B. crassicornis]). Caribou (Rangifer tarandus) werepresent in theNortheast during the Pleistocene andwouldqualify asmegafauna but they are excluded here because historical, archaeo-logical, and paleoecological data indicate they persisted in the re-gion throughout the Holocene until being locally extirpated duringthe twentieth century (Goodwin,1936; Palmer,1938; Guilday,1968;Bergerud, 1974; Bergerud et al., 2008; Putnam and Putnam, 2009).
4.1. Chronometric data
We first consulted radiocarbon databases, including FAUNMAPII (Graham and Lundelius, 2010), CARD (Morlan, 1999; Gajewskiet al., 2011), Harington’s (2003) compilation, and state-level data-bases (Jordan, 1969; Herbstritt, 1988; Hoffman, 1988; Levine, 1990;Gengras, 1996; Cox, 1999; Reeve and Forgacs, 1999; Will, 1999;Boulanger, 2007; Public Archaeology Laboratory, 2010). We thenconsulted primary sources to identify errors (e.g., compare dates forMichaud in Spiess and Wilson [1987] with those in Lothrop et al.,[2011]). Recent literature was consulted to ensure inclusion ofdates that had appeared since the compilation of radiocarbon da-tabases, and regional archaeologists and paleontologists werequeried for as-yet unreported dates. Finally, one AMS date obtainedby the authors during this study is included and reported here forthe first time.
4.1.1. Megafauna databaseWe identified a total of 115 radiocarbon determinations asso-
ciated with Pleistocene megafauna in the Northeast. This databasewas then vetted using a modified version of the criteria advocatedby Barnosky and Lindsey (2010: Table 1) to increase confidence thatthe measured variabledthe calibrated (radiocarbon) age-daccurately reflects the target variabledthe date when an animaldied. Unlike Barnosky and Lindsey, we included assays performedon bone apatite when isotopic or complementary 14C analysesindicated that contamination is not evident.
Our vetting protocol resulted in the elimination of 46 dates(Supplementary Information [SI] 2), leaving 69 individual assays inour sample (SI 1). Two or more radiocarbon assays were reportedfor nine individual specimens in our database. To eliminate undueinfluence of multiple dates on the same megafauna specimen, wesubjected the dates to a chi-square test of significance using Calibv.6.0.1 (Stuiver and Reimer, 1993). Dates from an individual mega-fauna specimen determined to be statistically identical at the 95%confidence interval were combined into pooled means in Calib. Noinstances were encountered in our vetted sample of a megafaunaspecimen having two or more ranges of dates that were not sta-tistically identical at this confidence interval. Calculation of pooledmeans resulted in a final sample size of 57 radiocarbon-datedspecimens from 47 separate localities (Fig. 1), and representingsix different genera (Table 1). More than half of these assays areobtained onMammut specimens, and nearly 80% of our sample is ofthe order Proboscidea. Thus, our sample is strongly biased towardsproboscideans.
On one hand, we suspect genera not represented in the vettedsample of dates were absent or quite rare on the Northeast land-scape. The abundance of proboscideans, on the other hand, mayreflect their abundance on the landscape, a greater probability ofbeing dated than remains of other genera, or some other factor.Nevertheless, we assume the vetted sample reflects at an ordinaland relative scale the abundance of individuals of the multi-taxoncategory “megafauna”.
4.1.2. Paleoindian databaseWe identified a total of 102 radiocarbon dates reported for
Paleoindian components in the Northeast (SI 3 and 4). Yet, thequality of this database continues to be a subject of debate. Unlikedirect dates onmegafaunal skeletal remains, not all measured datesfrom archaeological sites can be reasonably assumed to represent
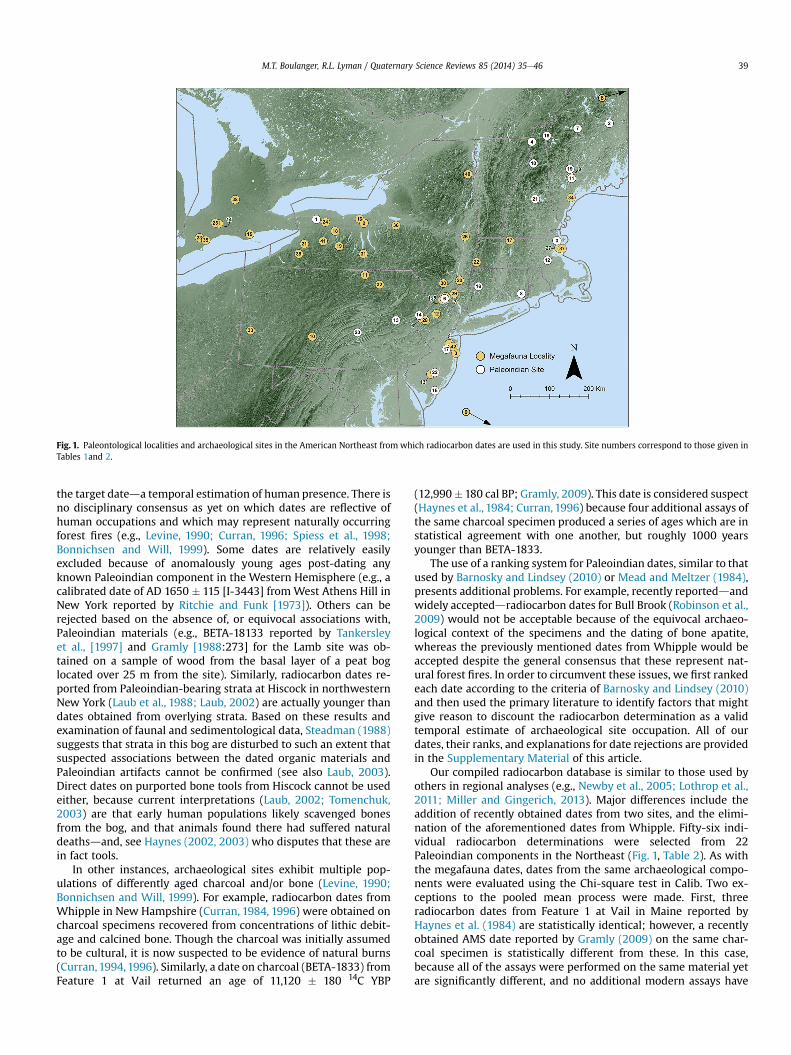
Fig. 1. Paleontological localities and archaeological sites in the American Northeast from which radiocarbon dates are used in this study. Site numbers correspond to those given inTables 1and 2.
M.T. Boulanger, R.L. Lyman / Quaternary Science Reviews 85 (2014) 35e46 39
the target dateda temporal estimation of human presence. There isno disciplinary consensus as yet on which dates are reflective ofhuman occupations and which may represent naturally occurringforest fires (e.g., Levine, 1990; Curran, 1996; Spiess et al., 1998;Bonnichsen and Will, 1999). Some dates are relatively easilyexcluded because of anomalously young ages post-dating anyknown Paleoindian component in the Western Hemisphere (e.g., acalibrated date of AD 1650 � 115 [I-3443] from West Athens Hill inNew York reported by Ritchie and Funk [1973]). Others can berejected based on the absence of, or equivocal associations with,Paleoindian materials (e.g., BETA-18133 reported by Tankersleyet al., [1997] and Gramly [1988:273] for the Lamb site was ob-tained on a sample of wood from the basal layer of a peat boglocated over 25 m from the site). Similarly, radiocarbon dates re-ported from Paleoindian-bearing strata at Hiscock in northwesternNew York (Laub et al., 1988; Laub, 2002) are actually younger thandates obtained from overlying strata. Based on these results andexamination of faunal and sedimentological data, Steadman (1988)suggests that strata in this bog are disturbed to such an extent thatsuspected associations between the dated organic materials andPaleoindian artifacts cannot be confirmed (see also Laub, 2003).Direct dates on purported bone tools from Hiscock cannot be usedeither, because current interpretations (Laub, 2002; Tomenchuk,2003) are that early human populations likely scavenged bonesfrom the bog, and that animals found there had suffered naturaldeathsdand, see Haynes (2002, 2003) who disputes that these arein fact tools.
In other instances, archaeological sites exhibit multiple pop-ulations of differently aged charcoal and/or bone (Levine, 1990;Bonnichsen and Will, 1999). For example, radiocarbon dates fromWhipple in New Hampshire (Curran, 1984, 1996) were obtained oncharcoal specimens recovered from concentrations of lithic debit-age and calcined bone. Though the charcoal was initially assumedto be cultural, it is now suspected to be evidence of natural burns(Curran,1994,1996). Similarly, a date on charcoal (BETA-1833) fromFeature 1 at Vail returned an age of 11,120 � 180 14C YBP
(12,990� 180 cal BP; Gramly, 2009). This date is considered suspect(Haynes et al., 1984; Curran, 1996) because four additional assays ofthe same charcoal specimen produced a series of ages which are instatistical agreement with one another, but roughly 1000 yearsyounger than BETA-1833.
The use of a ranking system for Paleoindian dates, similar to thatused by Barnosky and Lindsey (2010) or Mead and Meltzer (1984),presents additional problems. For example, recently reporteddandwidely accepteddradiocarbon dates for Bull Brook (Robinson et al.,2009) would not be acceptable because of the equivocal archaeo-logical context of the specimens and the dating of bone apatite,whereas the previously mentioned dates from Whipple would beaccepted despite the general consensus that these represent nat-ural forest fires. In order to circumvent these issues, we first rankedeach date according to the criteria of Barnosky and Lindsey (2010)and then used the primary literature to identify factors that mightgive reason to discount the radiocarbon determination as a validtemporal estimate of archaeological site occupation. All of ourdates, their ranks, and explanations for date rejections are providedin the Supplementary Material of this article.
Our compiled radiocarbon database is similar to those used byothers in regional analyses (e.g., Newby et al., 2005; Lothrop et al.,2011; Miller and Gingerich, 2013). Major differences include theaddition of recently obtained dates from two sites, and the elimi-nation of the aforementioned dates from Whipple. Fifty-six indi-vidual radiocarbon determinations were selected from 22Paleoindian components in the Northeast (Fig. 1, Table 2). As withthe megafauna dates, dates from the same archaeological compo-nents were evaluated using the Chi-square test in Calib. Two ex-ceptions to the pooled mean process were made. First, threeradiocarbon dates from Feature 1 at Vail in Maine reported byHaynes et al. (1984) are statistically identical; however, a recentlyobtained AMS date reported by Gramly (2009) on the same char-coal specimen is statistically different from these. In this case,because all of the assays were performed on the same material yetare significantly different, and no additional modern assays have

Table 2Radiocarbon dates obtained from Paleoindian archaeological sites in Northeastern North America and used to construct SPD curves. All dates calibrated using IntCal13 andCalPal Advanced and given at the two-sigma range. Pooled means calculated in Calib, critical values given at 0.05 significance level. Full data on each radiocarbon assay arepresented in Supplementary Information Table 1 (SI 3) and available from the senior author on request.
Site Location Lab no. 14C YBP � t Critical value Cal BP
Arc 1 BGS-1794, BGS-1795 10375 110 0.002 3.84, 1 12610e11850Brigham (ME90.2C) 2 BETA-7183 10290 460 13150e10670Bull Brook 3 BETA-240629
BETA-24063010410 60 0.015 3.84, 1 12550e12030
Colebrook (27CO38) 4 BETA-107429BETA-258579
10225 40 0.161 3.84, 1 12110e11750
Debert (BiCu-1) 5 P-977,P-743a,P-970a,P-972,P-741a,P-966a,P-967a,P-973,P-739a,P-971,P-974,P-975
10580b 40 14.86 19.7, 11 12690e12410
Dutchess Quarry Cave 8 6 BETA-25255 8290 100 9550e8990Esker (ME86.12) 7 BETA-103384 10110 70 12090e11290Hidden Creek (72e163) 8 BETA-126817 10260 70 12340e11700Hidden Creek (72e163) 8 BETA-121846,
BETA-1499209150 30 0.00 3.84, 1 10430e10190
Janet Cormier (ME23.25) 9 BETA-126645 10240 90 12360e11600Jefferson II (27CO29) 10 BETA-108465 8570 60 9660e9460Michaud (ME23.12) 11 BETA-13833,
BETA-156609130 200 3.305 3.84, 1 10850e9690
Neponset/Wamsutta (19NF70) 12 BETA-75527 10210 60 12150e11670Nesquehoning Creek (36CR142) 13 BETA-278334 9940 50 11640e11160ShawneeeMinisink (36MR43) 14 BETA-203865,
BETA-127162,UCIAMS-24865,BETA-101935,UCIAMS-24866,OXA-1731
10940b 20 15.197 11.1, 5 12840e12720
Steel (28CM42) 15 BETA-81355 9530 60 11190e10590Templeton (6LF21) 16 W-3931,
AA-716010210 90 0.006 3.84, 1 12260e11540
Turkey Swamp 17 DIC-1059 8740 165 10300e9380Vail (ME81.1) 18 SI-4617
AA-114,AA-115,AA-117,BETA-207579
10610y 40 15.95 9.49, 4 12700e12500
Varney Farm (1) (ME36.57) 19 BETA-81250,BETA-88674,BETA-81251
8410 50 0.151 5.99, 2 11310e10110
Varney Farm (2) (ME36.57) 19 BETA-88673,BETA-93001
8660 40 0.889 3.84, 1 9720e9520
Varney Farm (3) (ME36.57) 19 BETA-79658 9410 190 9540e9300Wallis (36PE16) 20 BETA-128231 9890 40 11390e11190Weirs Beach (NH26.32) 21 GX-4569 9615 225 11540e10340West Creek (28OC45) 22 BETA-71577 9850 160 11900e10780
a Radiocarbon date is itself an average of multiple assays on the same specimen.b Dates are significantly different at 95% confidence interval; however, reporting authors suggest averaging is appropriate.
M.T. Boulanger, R.L. Lyman / Quaternary Science Reviews 85 (2014) 35e4640
been performed to evaluate the accuracy of the newly obtaineddate, we opted to include all of the dates in the pooled mean.Second, a total of ten radiocarbon dates are reported for ShawneeeMinisink (McNett et al., 1977; Dent, 2002; Gingerich, 2007a, 2007b,2011). McNett et al. (1985) reject two of these (W-3388[9310 � 1000 14C YBP] and W-3391 [11,050 � 1000 14C YBP]),presumably because of large errors. The remaining two dates fromMcNett’s original work are statistically identical but have large er-rors compared to six recently obtained AMS dates on charredCrataegus seeds (Dent, 2002; Gingerich, 2007a, 2011). These sixAMS dates are significantly different from one another at the 95%confidence interval, yet all were obtained on charred seeds from
the same archaeological feature. In keeping with other treatmentsof the site (e.g., Gingerich, 2007a, 2007b, 2011; Miller andGingerich, 2013), we opt to use the pooled mean of these sixdates as a single estimate of the age of ShawneeeMinisink.
Using the pooled mean procedure discussed above, our finalarchaeological database contains 25 ages from 22 Paleoindianarchaeological sites. Two sites (Hidden Creek in Connecticut andVarney Farm in Maine) have multiple statistically different ageranges represented in their radiocarbon dates. There is as-yet noway to identify which is the “correct” datedif not alldto associatewith human occupation at these sites, sowe opt to includemultipleranges for each site in our database. This procedure reduces the
M.T. Boulanger, R.L. Lyman / Quaternary Science Reviews 85 (2014) 35e46 41
chances of rejecting overkill because it increases the probability offinding temporal overlap of extinct megafauna and human occu-pation of the Northeast because it potentially increases the timedepth of the latter.
4.2. Summed probability distributions
4.2.1. Constructing summed probability distribution curvesWe follow methods outlined in recent studies that use radio-
carbon dates as archaeological data (e.g., Hamilton and Buchanan,2007; Shennan and Edinborough, 2007; Buchanan et al., 2008;Tallavaara et al., 2010; Gajewski et al., 2011; Miller andGingerich, 2013). Individual radiocarbon dates and pooled meanswere calibrated using the IntCal13 calibration curve (Reimer et al.,2013), and summed probability distributions (SPDs) of calibratedages BP were created for each database using CalPal Advanced(Weninger and Jöris, 2008). All ages mentioned below are given incalibrated years BP and at the 2-sigma range unless otherwisenoted.
4.2.2. Interpretive and analytical challengesRecently, the use of SPDs as population proxies, for humans or
other phenomena, has been the subject of some debate (e.g., Rick,1987; Kuzmin and Keates, 2005; Surovell and Brantingham,2007; Surovell et al., 2009a; Louderback et al., 2010; Steele,2010; Buchanan et al., 2011; Williams, 2012). A thorough dis-cussion of the pros and cons of these statistical constructs is bestleft for another venue; however, some discussion of recent crit-icisms and how we address them is necessary here. Williams’(2012) recent review highlights three methodological concernswith the use of SPDs: (1) sample size, (2) effects of calibrationcurve, and (3) taphonomic correction. Below, we address each ofthese concerns as they impact our study. We find that Williams’methodological concerns are peculiar to the temporal scale of hisown data (ca 40,000 years) and to his choice in calibrationsoftware.
4.2.3. Sample sizeMichczy�nska and Pazdur (2004) demonstrate that the mini-
mum number of dates required to construct a reliable SPD isdependent upon the mean standard error (DT) and the overallspan of time represented in a database. Williams (2012:587),however, recommends that “at least 500 radiocarbon dates shouldbe used in any form of summed probability analysis” irrespectiveof the duration of time involved in the analysis or of DT. Impor-tantly, the radiocarbon database that Williams used spanned aperiod of 40,000 years, and in this context a total sample size of500 would equate to one date every 80 years or so. As applied tothe relatively brief span of time we address in the current study (ca5000 years), a sample size of 500 dates would equate to a singledate every 10(!) years. We therefore feel, in agreement withMichczy�nska and Pazdur (2004), that effective sample size shouldbe dictated by the temporal scale of the study and the precision ofthe available database.
In order to evaluate sample size requirements for our data, wemodeled a series of radiocarbon dates spaced at equal intervalsspanning a period of 8000 radiocarbon years (16,000e8000 14CYBP), each with a standard error of 120 years, equal to DT of ourdatabase. This span of time exceeds that in which we are interestedby several thousand years on either end, and thus should provide aconservative estimate of sample size necessary for our study. Theresults (Fig. 2) suggest that with a DT of 120, a sample of 33 or moreradiocarbon dates is sufficient to generate an SPD reflecting theunderlying distribution. Whereas our megafauna database isalmost twice this size, our Paleoindian database is slightly smaller.
4.2.4. Effects of calibration curveWilliams (2012) and others (e.g., Steele, 2010) have argued that
fluctuations in the calibration curve used by radiocarbon-date-calibration software directly influence the resultant shape of anSPD. Both Williams and Steele used OxCal (Bronk Ramsey, 2009) togenerate their SPDs. Yet, whereas SPDs produced in OxCal arestrongly influenced by patterns in the underlying radiocarbonecalibration curve, there is no such sensitivity in CalPal (Buchananet al., 2011; Weninger et al., 2011; Schmidt et al., 2012) becauseof theway inwhich Bayesian priors are applied to the posterior datafrequency. So, while we agree with Williams (2012) that the shapeof the underlying calibration curve will influence the shape of anSPD in OxCal (and Calib), this is not a concern for our study, as wemake use of CalPal. Indeed, as shown in Fig. 2dthere is nocalibration-curve influence visible in the SPDs generated using auniform distribution of dates.
4.2.5. Taphonomic correctionAs made clear by Lima-Ribeiro and Diniz-Filho (2013), the
youngest dated extinct animal and the oldest dated artifacts likelydo not represent the last living individual or the first colonizer,respectively (see also Johnson et al., 2013 and references therein).Older materials generally are less well and less often preservedthan younger materials (Surovell and Brantingham, 2007; Surovellet al., 2009a). Thus, we acknowledge that the archaeological andpaleontological radiocarbon records are subject to some preserva-tion bias and that these records are also subject to sampling bias.For instance, remains of extinct megafauna found in what arebelieved to be late Pleistocene sedimentsdand thus are suspectedof being contemporaneous with early Americansdare more likelyto be assayed by radiocarbon dating than are remains encounteredin contexts clearly pre-dating the human entrance into the Amer-icas (Meltzer and Mead, 1983). Similarly, it may be that some timeperiods (e.g., sites anticipated to be “the first” or “the earliest”) getmuch dating attention (Grayson, 2011).
Surovell and Brantingham (2007; see also Surovell et al., 2009a)suggest correcting any temporal frequency data by an empiricallyderived factor to account for taphonomic bias (see also Johnsonet al., 2013). We agree this is good practicedparticularly whencomparing numbers of specimens over prolonged periods of time.Yet, in this study, we compare the frequencies of two phenomena atmore or less the same point in time. Thus, correcting for tapho-nomic bias is largely irrelevant to our project. Indeed, applying thecorrection advocated by Surovell et al. (2009a) has minimal effecton the underlying frequency distribution of our data (Fig. 3). Thereason for this is simple: Surovell et al. (2009a,b) developed theirtaphonomic-bias-correction factor to evaluate the relative fre-quencies of events occurring across spans of 15,000 and 40,000years, whereas the temporal distributions of events we aremeasuring are on a scale of a few thousand years and, significantly,are of equivalent age. Certainly if wedlike Williams (2012)dwerecomparing the distribution of dates over a span of 40,000 years,taphonomic bias would most definitely need to be accounted for. Inthe case of our data, however, this does not appear to be an issue.
5. Results
The two resultant SPD curves are shown in Fig. 4. The SPD formegafauna is bimodal, with one peak between 14,300 and14,100 cal BP, and the other showing a relatively stable plateaubetween 13,500 and 12,800 cal BP followed by a sharp spike anddrop at 12,800e12,700 cal BP. The sharp spike at 12,800e12,700 calBP is more-or-less contemporaneous with the first well-dated hu-man occupation in the regiondShawneeeMinisink at (12,840e12,720 cal BP; m ¼ 12,780 cal BP).

Fig. 2. Summed probability distribution curves generated with CalPal for six samples of equal-interval radiocarbon dates spanning the time period of interest. Note that below asample size of 33, the standard error between dates results in a curve characterized by peaks and valleys; whereas, with n ¼ 33 or greater, the curves reflect a continuous dis-tribution that does not appear influenced by either sample size or by fluctuations in the calibration curve.
M.T. Boulanger, R.L. Lyman / Quaternary Science Reviews 85 (2014) 35e4642
The youngest megafauna specimen in our dataset, a specimen ofCastoroides from Wayne County, New York, dates to 12,070e11,550 cal BP (m ¼ 11,810 cal BP). This alone would suggest thatthere was temporal overlap of megafaunal and human populationsin the Northeast on the order of roughly 1000 years. However, as isclear in Fig. 4, this youngest megafauna date appears somewhatanomalous. That is, a period of roughly 500 years exists between it
16,00018,000 14,000
0.0
0.2
0.4
0.6
0.8
1.0
Megafauna
Paleoindian
ActualModeled
ActualModeled
14C YBP
p [re
l]
Fig. 3. Temporal frequency distributions of megafauna and Paleoindian radiocarbon datestaphonomic bias following Surovell and Brantingham (2007) and Surovell et al. (2009a, b).
and the next-youngest date. Indeed, only 15 (26%) of our mega-fauna specimens produced dates younger than the initial date ofhuman occupation in the region. Of these 15 specimens, all but fourdate to within one century of the date at ShawneeeMinisink. Theremaining four (7% of the total database) specimens (Mammut,n ¼ 3; Castoroides, n ¼ 1) post-date the next-oldest-dated Paleo-indian site (Vail, 12,700e12,500 cal BP; m ¼ 12,600 cal BP). Viewed
12,000 10,000
in the Northeast between 18,000 and 9000 14C YBP. Solid lines are data modeled forDotted lines represent actual data.

Fig. 4. Summed probability distribution curves generated for megafauna specimens and Paleoindian archaeological sites in the American Northeast based on radiocarbon datesavailable in 2013.
M.T. Boulanger, R.L. Lyman / Quaternary Science Reviews 85 (2014) 35e46 43
in another light, greater than 90% of known megafauna specimensare as old or older than the first appearance of humans, and 75%clearly pre-date human entrance into the region.
6. Discussion
The megafauna SPD is bimodal, with a clear increase in thenumber of dated specimens leading up to ca 14,200 cal BPdover1000 years before any evidence of human presence in the region.The initial decline in large herbivore populations ca 14,100 cal BP isunrelated to human presence in the region. The temporal span ofthis earlier event is consistent with a collapse of Northeast mega-faunal populations hypothesized to have occurred between 14,800and 13,700 cal BP based on Sporormiella spore abundance (Gillet al., 2009; Robinson and Burney, 2008; Robinson et al., 2005;but see; Feranec et al., 2011; Parker and Williams, 2012; Raper andBush, 2009). Though Robinson et al. (2005) suggested some degreeof human involvement with this decline, our data clearly suggestthat humans were not a factor during this time period. A collapse ofmegafauna populations at this time is also suggested by anapparent genetic bottleneck of various mammalian taxa during theterminal Pleistocene (references in de Bruyn et al., 2011), thoughwe concede that the chronological resolution of this genetic evi-dence is not as precise as that offered by radiocarbon-dated re-mains and soil cores. We also note that the timeframe of thisincreased number of dated megafauna specimens is coincidentwith the onset of extreme aridity at 14,500 cal BP across largeportions of North America (Polyak et al., 2012).
The second peak of megafauna radiocarbon dates falls between13,600 cal BP and ca 12,700 cal BP. Yansa and Adams (2012)document significant dietary stress in proboscidean populationsof the neighboring Great Lakes region 13,500 and 13,000 calBPdwell in line with the second peak in our megafauna SPD, andcoincident with regionally documented increases in temperature,lake level, and vegetation change (Munoz et al., 2010). Because thisincrease in megafauna dates precedes the appearance of humans,and yet is commensurate with documented environmental changeand documented dietary stress in megafauna of neighboring areas,we interpret the second peak to most likely be the result of acombination of dietary-stress induced deaths. We do, however,concede that there may be some sample bias evident, reflecting ahigher probability of dating what seem to be terminal Pleistocenemegafauna. The drop in the megafauna SPD ca 12,700 cal BP ispreceded by the single archaeological date at ShawneeeMinisink of12,780 cal BP noted above. The two SPDs thus suggest humanarrival at the tail end of a prolonged extinction process that hadbeen occurring for more than 1000 years beforehand (since ca14,100 cal BP).
One could argue the temporal overlap presented by the two SPDcurves supports an overkill scenario. This ignores the fact that (A)overkilldincluding the Blitzkrieg modeldby definition, was thesingular cause of the terminal Pleistocene extinction of megafauna,
and yet the SPDs suggest increases in the deaths of megafauna wellbefore humans arrived; and, (B) not one specimen in our mega-fauna database shows evidence of human involvement in its death,and not one of the archaeological sites in our database containsevidence of the hunting of megafauna.
If our results are interpreted as supporting overkill of any sort,we are left having to explain how human hunting resulted in pro-nounced decline in megafauna for over 1000 years (from 14,100 calBP to 12,780 cal BP) while leaving no evidence of human occupa-tion, bone modification, or butchering on the hundreds of mega-fauna specimens that have been recovered. We are also left tryingto explain why humans began leaving archaeological traces in theregion later than the mean radiocarbon dates of more than 90% ofall known megafaunal remains, and why no known archaeologicalsite in the region contains evidence (equivocal or otherwise) ofmegafauna hunting.
In short, we believe that the simplest explanation, that which ismost in linewith all available evidence, and that which requires thefewest assumptions, is that megafaunal extinction processes in theAmerican Northeast began well before humans arrived in the re-gion. During the Pleistocene to Holocene transition the taxonomiccomposition of mammal communities shifted from so-called “noanalog” faunas to faunas of modern composition (FaunmapWorking Group, 1996). Mean body size of bison (Bison spp.), big-horn sheep (Ovis canadensis), wapiti (Cervus canadensis), wood rats(Neotoma spp.), horses (Equus sp.) and other taxa in North Americadecreased during the late Pleistocene (Hill et al., 2008; Lyman,2009, 2010; Lyman and O’Brien, 2005; Guthrie, 2003, respec-tively). The diminution process seems to have preceded the firstappearance of humans, implicating an environmental cause of astressful time for at least some mammals. Given the absence ofevidence for direct association of humans with Pleistocene mega-fauna, an environmentally dynamic terminal Pleistocene, and whatseems to be a depleted population of megafauna, we, like Haynes(2013), suspect the SPDs indicate human entrance into the North-east at a time when megafauna were depleted in abundance andthus found in geographically (and hence genetically) isolatedpopulations. If this suspicion is correct, then if human hunters hadany input into extinction of Pleistocene megafauna in the North-east, it was only the coup de grace in a process largely driven bynonhuman mechanisms.
7. Conclusions
The SPD of Paleoindian archaeological components displaysminimal overlap with the tail end of the SPD for directly datedmegafauna specimens. This minimal overlap suggests that the twowere contemporary for only a brief span of time. The SPDs alsoindicate declines in megafauna populations preceded humanentrance into the American Northeast. These findings are inde-pendent of, and supportive of, conclusions based on Sporormiellaabundances and genetic evidence suggesting declines in

M.T. Boulanger, R.L. Lyman / Quaternary Science Reviews 85 (2014) 35e4644
megafauna populations prior to the arrival of humans, as well aswith paleoclimatic data indicating periods of environmentalchange. This scenario, if correct, explains why archaeologists andpaleontologists have as yet failed to identify any unequivocal as-sociations of humans and megafauna in the Northeast. If peoplehad a hand in the extirpation, it seems to have been at best a coupde grace. Whatever drove local declines in regional megafaunapopulations, chronological evidence suggests that humans had aminimal role. We stress that our data do not speak to continent-wide population dynamics of megafauna, or to extinction pro-cesses elsewhere in North America. That is, the declines we see inNortheast megafauna populations may be a cascade effect fromdeclines in regional populations elsewhere on the continent thatmay or may not have been the result of human hunting. Yet, in theNortheast itself, the presently available data do not support a sce-nario in which humans hunted megafauna to extinction in thefashion suggested by Martin’s original or Blitzkrieg overkillhypothesis.
Acknowledgments
We thank Michael J. O’Brien, Briggs Buchanan, Donald Grayson,and numerous anonymous reviewers for insisting on brevity, clarityand focus. We thank Gregory Lattanzi, David Parris, R. MichaelStewart, and Guy Robinson for sharing radiocarbon dates for thisstudy. Some data used in this study were obtained from the Neo-toma Paleoecology Database (http://www.neotomadb.org), and thework of the data contributors and the Neotoma community isgratefully acknowledged.
Appendix A. Supplementary data
Supplementary data related to this article can be found at http://dx.doi.org/10.1016/j.quascirev.2013.11.024.
References
Alroy, J., 2001. A multispecies overkill simulation of the end-Pleistocene megafaunalmass extinction. Science 292, 1893e1896.
Barnosky, A.D., Koch, P.L., Feranec, R.S., Wing, S.L., Shabel, A.B., 2004. Assessing thecauses of late Pleistocene extinctions on the continents. Science 306, 70e75.
Barnosky, A.D., Lindsey, E.L., 2010. Timing of Quaternary megafaunal extinction inSouth America in relation to human arrival and climate change. Quat. Int. 217,10e29.
Bergerud, A.T., 1974. Decline of caribou in North America following settlement.J. Wildl. Manage 38, 757e770.
Bergerud, A.T., Luttich, S.N., Camps, L., 2008. The Return of Caribou to Ungava.McGill-Queen’s University Press, Montreal.
Berkes, F., 2006. From community-based resource management to complex sys-tems. Ecol. Soc. 11 (1) art45.
Bonnichsen, R., Will, R.F., 1999. Radiocarbon chronology of northeastern Paleo-american sites: discriminating natural and human burn features. In:Bonnichsen, R., Turnmire, K.L. (Eds.), Ice Age People of North America: Envi-ronments, Origins, and Adaptations. Oregon State University Press, Corvallis,OR, pp. 395e415.
Boulanger, M.T., 2007. Database of published radiocarbon dates for Vermont with abrief discussion of the method. J. Vt. Archaeol. 8, 1e25.
Bradley, J.W., Spiess, A.E., Boisvert, R.A., Boudreau, J., 2008. What’s the point?:modal forms and attributes of Paleoindian bifaces and the New England-Maritimes region. Archaeol. East. N. Am. 36, 119e172.
Bronk Ramsey, C., 2009. Bayesian analysis of radiocarbon dates. Radiocarbon 51,337e360.
Brook, B.W., Bowman, D.M.J.S., 2004. The uncertain blitzkrieg of Pleistocenemegafauna. J. Biogeogr. 31, 517e523.
Buchanan, B., Collard, M., Edinborough, K., 2008. Paleoindian demography and theextraterrestrial impact hypothesis. Proc. Natl. Acad. Sci. U.S.A 105, 11651e11654.
Buchanan, B., Hamilton, M., Edinborough, K., O’Brien, M.J., Collard, M., 2011.A comment on Steele’s (2010) “radiocarbon dates as data: quantitative strate-gies for estimating colonization front speeds and event densities.” J. Archaeol.Sci. 38, 2116e2122.
Buckley, J.D., Willis, E.H., 1970. Isotopes’ radiocarbon measurements VIII. Radio-carbon 12, 87e129.
Callicott, J.B., 2002. Choosing appropriate temporal and spatial scales for ecologicalrestoration. J. Biosci. 27, 409e420.
Cox, S., 1999. Radiocarbon dates obtained by Steven Cox, Maine State Museum,Augusta, Maine as of October 1, 1999. Mass. Archaeol. Soc. Newsl. 13 (Summer/Fall), 3e5.
Curran, M.L., 1984. The Whipple site and Paleoindian tool assemblage variation: acomparison of intrasite structuring. Archaeol. East. N. Am. 12, 5e40.
Curran, M.L., 1994. New Hampshire Paleo-Indian research and the Whipple site.N. H. Archaeol. 33/34, 29e52.
Curran, M.L., 1996. Paleoindians in the Northeast: the problem of dating fluted pointsites. Rev. Archaeol. 17, 2e5.
Daulton, T.L., Pinter, N., Scott, A.C., 2010. No evidence of nanodiamonds in Younger-Dryas sediments to support an impact event. Proc. Natl. Acad. Sci. U.S.A 107,16043e16047.
de Bruyn, M., Hoelzel, A.R., Carvalho, G.R., Hofreiter, M., 2011. Faunal histories fromHolocene ancient DNA. Trends Ecol. Evol. 26, 405e413.
Dent, R.J., 1991. Deep time in the Potomac river valley e thoughts on Paleoindianlifeways and revisionist archaeology. Archaeol. East. N. Am. 19, 23e42.
Dent, R.J., 2002. Paleoindian occupation of the Upper Delaware Valley: revisitingShawnee Minisink and nearby sites. In: Carr, K.W., Adovasio, J.M. (Eds.), Ice AgePeoples of Pennsylvania. Recent Research in Pennsylvania Archaeology. Penn-sylvania Historical Museum Commission, Harrisburg, pp. 51e78.
Dragoo, D.W., 1976. Some aspects of eastern North American prehistory: a review1975. Am. Antiq. 41, 3e27.
Ellis, C., 2011. Measuring Paleoindian range mobility and land-use in the GreatLakes/Northeast. J. Anthropol. Archaeol. 30, 385e401.
Ellis, C., Goodyear, A.C., Morse, D.F., Tankersley, K.B., 1998. Archaeology of thePleistoceneeHolocene transition in eastern North America. Quat. Int. 49e50,151e166.
Faith, J.T., Surovell, T.A., 2009. Synchronous extinction of North America’s Pleisto-cene mammals. Proc. Natl. Acad. Sci. U.S.A. 106, 20641e20645.
Faught, M.K., 2008. Archaeological roots of human diversity in the New World: acompilation of accurate and precise radiocarbon ages from earliest sites. Am.Antiq. 73, 670e698.
Faunmap Working Group, 1996. Spatial response of mammals to late Quaternaryenvironmental fluctuations. Science 272, 1601e1606.
Feranec, R.S., Kozlowski, A.L., 2012. New AMS radiocarbon dates from Late Pleis-tocene mastodons and mammoths in New York State, USA. Radiocarbon 54,275e279.
Feranec, R.S., Miller, N.G., Lothrop, J.C., Graham, R.W., 2011. The Sporormiella proxyand end-Pleistocene megafaunal extinction: a perspective. Quat. Int. 245, 333e338.
Fiedel, S., 2009. Sudden deaths: the chronology of terminal Pleistocene megafaunalextinction. In: Haynes, G. (Ed.), American Megafaunal Extinctions at the End ofthe Pleistocene. Springer, Dordrecht, pp. 21e37.
Fiedel, S., Haynes, G., 2004. A premature burial: comments on Grayson and Melt-zer’s “Requiem for overkill.” J. Archaeol. Sci. 31, 121e131.
Firestone, R.B., West, A., Kennett, J.P., Becker, L., Bunch, T.E., et al., 2007. Evidence foran extraterrestrial impact 12,900 years ago that contributed to the megafaunalextinctions and the Younger Dryas cooling. Proc. Natl. Acad. Sci. U.S.A 104,16016e16021.
Fisher, D.W.,1955. Prehistoric mammals of NewYork. N. Y. State Conserv. 9 (4), 18e22.Frankham, R., Brook, B.W., 2004. The importance of time scale in conservation
biology and ecology. Acta Zool. Fenn. 41, 459e463.Funk, R.E., Fisher, D.W., Reilly, E.M., 1970. Caribou and Paleo-Indian in New York
State: a presumed association. Amer. J. Sci. 268, 181e186.Gajewski, K., Munoz, S., Peros, M., Viau, A., Morlan, R., Betts, M., 2011. The Ca-
nadian archaeological radiocarbon database (CARD): archaeological 14C datesin North America and their paleoenvironmental context. Radiocarbon 53,371e394.
Gengras, J.B., 1996. Radiocarbon dates for archaeological sites in New Hampshire.N. H. Archaeol. 36, 8e15.
Gill, J.L., Williams, J.W., Jackson, S.T., Lininger, K.B., Robinson, G.S., 2009. Pleistocenemegafaunal collapse, novel plant communities, and enhanced fire regimes inNorth America. Science 326, 1100e1103.
Gingerich, J.A.M., 2007a. Shawnee-Minisink Revisited: Re-evaluating the Paleo-indian Occupation (Unpublished M.A. thesis). Department of Anthropology,University of Wyoming, Laramie.
Gingerich, J.A.M., 2007b. Picking up the pieces: new Paleoindian research in theUpper Delaware Valley. Archaeol. East. N. Am. 35, 117e124.
Gingerich, J.A.M., 2011. Down to seeds and stones: a new look at the subsistenceremains from Shawnee-Minisink. Am. Antiq. 76, 127e144.
Goodwin, G.G., 1936. Big game animals in the northeastern United States.J. Mammal. 17, 48e50.
Graham, R.W., Lundelius, E.L., 1984. Coevolutionary disequilibrium and Pleistoceneextinctions. In: Martin, P.S., Klein, R.G. (Eds.), Quaternary Extinctions: A Pre-historic Revolution. University of Arizona Press, Tucson, pp. 223e249.
Graham, R.W., Lundelius, E.L., 2010. FAUNMAP II: New Data for North America witha Temporal Extension for the Blancan, Irvingtonian and Early Rancholabrean.FAUNMAP II Database, Version 1.0. http://www.ucmp.berkeley.edu/neomap/use.html.
Gramly, R.M., 1988. Palaeo-indian sites south of Lake Ontario, western and centralNew York State. In: Laub, R.S., Miller, N.G., Steadman, D.W. (Eds.), Late Pleis-tocene and Early Holocene Paleoecology and Archaeology of the Eastern GreatLakes Region. Bull. Buff. Soc. Natural Sci. 33, 265e280. Buffalo, NY.

M.T. Boulanger, R.L. Lyman / Quaternary Science Reviews 85 (2014) 35e46 45
Gramly, R.M., 2009. Radiocarbon dates from the Vail site 1980e2005. In:Gramly, R.M. (Ed.), Palaeo-Americans and Palaeo-Environment at the Vail Site,Maine. Persimmon Press, North Andover, Mass, pp. 107e109.
Grayson, D.K., 1980. Vicissitudes and overkill: the development of explanations ofPleistocene extinctions. In: Schiffer, M.B. (Ed.), Advances in ArchaeologicalMethod and Theory, vol. 3Academic Press, New York, pp. 357e403.
Grayson, D.K., 1984a. Nineteenth-century explanations of Pleistocene extinctions: areview and analysis. In: Martin, P.S., Klein, R.G. (Eds.), Quaternary Extinctions: APrehistoric Revolution. University of Arizona Press, Tucson, pp. 5e39.
Grayson, D.K., 1984b. Explaining Pleistocene extinctions: thoughts on the structureof the debate. In: Martin, P.S., Klein, R.G. (Eds.), Quaternary Extinctions: APrehistoric Revolution. University of Arizona Press, Tucson, pp. 807e823.
Grayson, D.K., 2006. Late Pleistocene faunal extinctions. In: Ubelaker, D.H. (Ed.),Handbook of North American Indians, Environment, Origins, and Population,vol. 3. Smithsonian Institution, Washington, DC, pp. 208e218.
Grayson, D.K., 2007. Deciphering North American Pleistocene extinctions.J. Anthropol. Res. 63, 185e213.
Grayson, D.K., 2011. The Great Basin: a Natural Prehistory. University of CaliforniaPress, Berkeley.
Grayson, D.K., Meltzer, D.J., 2002. Clovis hunting and large mammal extinction: acritical review of the evidence. J. World Prehist. 16, 313e359.
Grayson, D.K., Meltzer, D.J., 2003. A requiem for North American overkill.J. Archaeol. Sci. 30, 585e593.
Grayson, D.K., Meltzer, D.J., 2004. North American overkill continued? J. Archaeol.Sci. 31, 133e136.
Griggs, C.B., Kromer, B., 2008. Wood macrofossils and dendrochronology of threemastodon sites in upstate New York. Paleontogr. Am. 61, 49e61.
Guilday, J.E., 1968. Archaeological evidence of caribou from New York and Massa-chusetts. J. Mammal. 49, 344e345.
Guthrie, R.D., 1984. Mosaics, allelochemics, and nutrients: an ecological theory oflate Pleistocene megafaunal extinctions. In: Martin, P.S., Klein, R.G. (Eds.),Quaternary Extinctions: A Prehistoric Revolution. University of Arizona Press,Tucson, pp. 259e298.
Guthrie, R.D., 2003. Rapid body size decline in Alaskan Pleistocene horses beforeextinction. Nature 426, 169e171.
Hamilton, M.J., Buchanan, B., 2007. Spatial gradients in Clovis-age radiocarbon datesacross North America suggest rapid colonization from the north. Proc. Natl.Acad. Sci. U.S.A. 104, 15625e15630.
Harington, C.R., 2003. Annotated Bibliography of Quaternary Vertebrates ofNorthern North America with Radiocarbon Dates. University of Toronto Press,Toronto.
Hartnagel, C.A., Bishop, S.C., 1922. The Mastodons, Mammoths and Other Pleisto-cene Mammals of New York State. In: New York State Museum Bulletin, vols.241e242. State University of New York, Albany, pp. 7e105.
Haviland, W.A., Power, M.W., 1994. The Original Vermonters. University Press ofNew England, Hanover.
Haynes, C.V., 2008. Younger Dryas “black mats” and the Rancholabrean terminationin North America. Proc. Natl. Acad. Sci. U.S.A. 105, 6520e6525.
Haynes, C.V., Boerner, J., Domanik, K., Lauretta, D., Ballenger, J., et al., 2010. TheMurray Springs Clovis site, Pleistocene extinction, and the question of extra-terrestrial impact. Proc. Natl. Acad. Sci. U.S.A 107, 4010e4015.
Haynes, C.V., Donahue, D.J., Hall, A.J.T., Zabel, T.H., 1984. Application of acceleratordating to fluted point Paleoindian sites. Archaeol. East. N. Am. 12, 184e191.
Haynes, G., 2002. The Early Settlement of North America: The Clovis Era. CambridgeUniversity Press, Cambridge.
Haynes, G., 2003. Were there mastodon die-offs at the Hiscock site? In: Laub, R.S.(Ed.), The Hiscock Site: Late Pleistocene and Holocene Paleoecology andArchaeology of Western New York State Bull. Buff. Soc. Natural Sci. 37, 100e111.Buffalo, NY.
Haynes, G., 2007. A review of some attacks on the overkill hypothesis, with specialattention to misrepresentation and double talk. Quat. Int. 169e170, 84e94.
Haynes, G., 2009. Introduction to the volume. In: Haynes, G. (Ed.), AmericanMegafaunal Extinctions at the End of the Pleistocene. Springer, Dordrecht,pp. 1e20.
Haynes, G., 2013. Extinctions in North America’s late glacial landscapes. Quat. Int.285, 89e98.
Haynes, G., Stanford, D., 1984. On the possible utilization of Camelops by early manin North America. Quat. Res. 22, 216e230.
Herbstritt, J.T., 1988. A reference for Pennsylvania radiocarbon dates. Paleo.Archaeol. 58 (2), 1e30.
Hill Jr., M.E., Hill, M.G., Widga, C.C., 2008. Late Quaternary Bison diminution on theGreat Plains of North America: evaluating the role of human hunting versusclimate change. Quat. Sci. Rev. 27, 1752e1771.
Hoffman, C., 1988. Radiocarbon dates from Massachusetts: an annotated listing.Bull. Ma. Archaeol. Soc. 49, 21e38.
Johnson, C.N., Bradshaw, C.J.A., Cooper, A., Gillespie, R., Brook, B.W., 2013. Rapidmegafaunal extinction following human arrival throughout the New World.Quat. Int. 308e309, 273e277.
Jordan, D., 1969. Radiocarbon dates for New England archaeology. In: Young, W.R.(Ed.), An Introduction to the Archaeology and History of the Connecticut ValleyIndian. Springfield Museum of Science, pp. 16e18.
Koch, P.L., Barnosky, A.D., 2006. Late Quaternary extinctions: state of the debate.Ann. Rev. Ecol. Evol. Syst. 37, 215e250.
Kuzim, Y.V., Keastes, S.G., 2005. Dates are not just data: Paleolithic settlementpatterns in Siberia derived from radiocarbon records. Am. Antiq. 70, 773e789.
Lake, T.R., 2003. A fluted point from the Walkill River Valley. Bull. J. N.Y. Archaeol.Assoc. 119, 29e39.
Landres, P.B., 1992. Temporal scale perspectivess in managing biological diversity.Trans. N. Am. Wildl. Nat. Resour. Conf. 57, 292e307.
Laub, R.S., 2002. The Paleoindian presence in the Northeast: a view from the His-cock site. In: Carr, K.W., Adovasio, J.M. (Eds.), Ice Age Peoples of Pennsylvania.Pennsylvania Historical and Museum Commission, Harrisburg, pp. 105e121.
Laub, R.S., 2003. The Hiscock site: structure, stratigraphy and chronology. In:Laub, R.S. (Ed.), The Hiscock Site: Late Pleistocene and Holocene Paleoecologyand Archaeology of Western New York State. Bull. Buff. Soc. Natural Sci. 37, 18e38. Buffalo, NY.
Laub, R.S., DeRemer, M.F., Dufort, C.A., 1988. The Hiscock site: a rich late Qua-ternary locality in western New York State. In: Laub, R.S., Miller, N.G.,Steadman, D.W. (Eds.), Late Pleistocene and Early Holocene Paleoecology andArchaeology of the Eastern Great Lakes Region. Bull. Buff. Soc. Natural Sci. 33,67e81. Buffalo, NY.
Lepper, B.T., Meltzer, D.J., 1991. Late Pleistocene human occupation of the easternUnited States. In: Bonnichsen, R., Turnmire, K. (Eds.), Clovis: Origins and Ad-aptations. Center for the Study of the First Americans. Oregon State University,Corvallis, pp. 175e184.
Levine, M.A., 1990. Accomodating age: radiocarbon results and fluted point sites innortheastern North America. Archaeol. East. N. Am. 18, 33e63.
Lima-Ribeiro, M.S., Diniz-Filho, J.A.F., 2013. American megafaunal extinctions andhuman arrival: improved evaluation using a meta-analytical approach. Quat.Int. 299, 38e52.
Lothrop, J.C., Newby, P.E., Spiess, A.E., Bradley, J.W., 2011. Paleoindians and theYounger Dryas in the New England-Maritimes region. Quat. Int. 242, 546e569.
Louderback, L.A., Grayson, D.K., Llobera, M., 2010. Middle-Holocene climates andhuman population densities in the Great Basin, western USA. Holocene 21,366e373.
Lyman, R.L., 2009. The Holocene history of bighorn sheep (Ovis canadensis) ineastern Washington state, northwestern USA. Holocene 19, 143e150.
Lyman, R.L., 2010. Taphonomy, pathology and paleoecology of the terminal Pleis-tocene Marmes Rockshelter (45FR50) “big elk” (Cervus elaphus), southeasternWashington state, USA. Canad. J. Earth Sci. 47, 1367e1382.
Lyman, R.L., O’Brien, M.J., 2005. Within-taxon morphological diversity as a paleo-environmental indicator: late-Quaternary Neotoma in the Bonneville Basin,northwestern Utah. Quat. Res. 63, 274e282.
Lyons, S.K., Smith, F.A., Wagner, P.J., White, E.P., Brown, J.H., 2004. Was a ‘hyper-disease’ responsible for the late Pleistocene megafaunal extinctions? Ecol. Lett.7, 859e868.
MacPhee, R.D.E., Marx, P.A., 1997. The 40,000 year plague: humans, hyperdisease,and first-contact extinctions. In: Goodman, S.M., Patterson, B.D. (Eds.), NaturalChange and Human Impact in Madagascar. Smithsonian Institution, Washing-ton, DC, pp. 169e217.
Marlon, J.R., Bartlein, P.J., Walsh, M.K., Harrison, S.P., Brown, K.J., et al., 2009.Wildfire responses to abrupt climate change in North America. Proc. Natl. Acad.Sci. U.S.A 106, 2519e2524.
Martin, P.S., 1966. Africa and Pleistocene overkill. Nature 212, 339e342.Martin, P.S., 1967. Prehistoric overkill. In: Martin, P.S., Wright, H.E. (Eds.), Pleistocene
Extinctions: The Search for a Cause. Yale University Press, New Haven, CT.,pp. 75e120.
Martin, P.S., 1973. The discovery of America. Sci. 179, 969e974.Martin, P.S., 1974. Palaeolithic players on the American stage: man’s impact on the
Late Pleistocene megafauna. In: Ives, J.D., Barry, R.G. (Eds.), Arctic and AlpineEnvironments. Methuen, London, pp. 669e700.
Martin, P.S., 1986. Refuting late Pleistocene extinction models. In: Elliott, D.K. (Ed.),Dynamics of Extinction. Wiley, New York, pp. 107e130.
Martin, P.S., 2005. Twilight of the Mammoths: Ice Age Extinctions and theRewilding of America. University of California Press, Berkeley.
Martin, P.S., Steadman, D.W., 1999. Prehistoric extinctions on islands and conti-nents. In: MacPhee, R.D.E. (Ed.), Extinctions in Near Time. Kluwer Academic,New York, pp. 17e55.
McAndrews, J.H., 2003. Postglacial ecology of the Hiscock site. In: Laub, R.S. (Ed.),The Hiscock Site: Late Pleistocene and Holocene Paleoecology and Archaeologyof Western New York State. Bull. Buff. Soc. Natural Sci. vol. 37. Buffalo, NY,pp. 190e198.
McNett, C.W., McMillan, B.A., Marshall, S.B., 1977. The ShawneeeMinisink site. In:Newman, W.S., Salwen, B. (Eds.), Amerinds and Their Paleoenvironments. Ann.N. Y. Acad. Sci. 288, 282e296.
McNett, C.W., Dent, R.J., Evans, J., Marshall, S.B., McMillan, B.A., 1985. The UpperDelaware Valley early man project. In: McNett, C.W. (Ed.), Shawnee-Minisink: AStratified Paleoindian-Archaic Site in the Upper Delaware Valley of Pennsyl-vania. Academic Press, Orlando, pp. 3e14.
Mead, J.I., Meltzer, D.J., 1984. North American late Quaternary extinctions and theradiocarbon record. In: Martin, P.S., Klein, R.G. (Eds.), Quaternary Extinctions: APrehistoric Revolution. University of Arizona Press, Tucson, pp. 440e450.
Meltzer, D.J., 1988. Late Pleistocene human adaptations in eastern North America.J. World Prehist. 2, 1e52.
Meltzer, D.J., Mead, J.I., 1983. The timing of Late Pleistocene mammalian extinctionsin North America. Quat. Res. 19, 130e135.
Miller, S.D., Gingerich, J.A.M., 2013. Regional variation in the terminal Pleistoceneand early Holocene radiocarbon record of eastern North America. Quat. Res. 73,175e188.

M.T. Boulanger, R.L. Lyman / Quaternary Science Reviews 85 (2014) 35e4646
Michczy�nska, D.J., Pazdur, A., 2004. A shape analysis of cumulative probabilitydensity function of radiocarbon dates set in the study of climate change in LateGlacial and Holocene. Radiocarbon 46, 733e744.
Morlan, R., 1999. Canadian archaeological radiocarbon database: establishing con-ventional ages. Can. J. Archaeol. 23, 3e10.
Mosimann, J.E., Martin, P.S., 1975. Simulating overkill by Paleoindians. Am. Sci. 63,304e313.
Munoz, S.E., Gajewski, K., Peros, M.C., 2010. Synchronous environmental and cul-tural change in the prehistory of the northeastern United States. Proc. Natl.Acad. Sci. U.S.A. 107, 22008e22013.
Nagaoka, L., 2012. The overkill hypothesis and conservation biology. In:Wolverton, S., Lyman, R.L. (Eds.), Conservation Biology and Applied Paleozo-ology. University of Arizona Press, Tucson, pp. 110e138.
Newby, P.E., Bradley, J.B., Spiess, A.E., Shuman, B., Leduc, P., 2005. A Paleoindianresponse to Younger Dryas climate change. Quat. Sci. Rev. 24, 141e154.
Nikolskiy, P.A., Sulerzhitsky, L.D., Pitulko, V.V., 2011. Last straw versus Blitzkriegoverkill: climate-driven changes in the Arctic Siberian mammoth populationand the Late Pleistocene extinction problem. Quat. Sci. Rev. 30, 2309e2328.
Nogués-Bravo, D., Ohlemüller, R., Batra, P., Araújo, M.B., 2010. Climate predictors oflate Quaternary extinctions. Evolution (N Y) 64, 2442e2449.
Palmer, R.S., 1938. Late records of caribou in Maine. J. Mammal. 19, 37e43.Parker, N.E., Williams, J.W., 2012. Influence of climate, cattle density, and lake
morphology on Sporormiella abundances in modern lake sediments in the USGreat Plains. Holocene 22, 475e483.
Pigati, J.S., Latorre, C., Rech, J.A., Betancourt, J.L., Martínez, K.E., et al., 2012. Accu-mulation of impact markers in desert wetlands and implications for theYounger Dryas impact hypothesis. Proc. Natl. Acad. Sci. U.S.A 109, 7208e7212.
Polyak, V.J., Asmerom, Y., Burns, S.J., Lachniet, M.S., 2012. Climatic backdrop to theterminal Pleistocene extinction of North American mammals. Geology 40,1023e1026.
Public Archaeology Laboratory, 2010. Radiocarbon Results Arranged by Date. On-line document available at: http://www.palinc.com/sites/default/files/PAL_Radiocarbon_by_Date.pdf (Last modified June, 2010).
Putnam, D.E., Putnam, I.E., 2009. Caribou and snapping turtle in an Innu styleshaputuan feature in Aroostook County, Maine. Geol. Soc. Am. Abstr. 41 (3), 23.
Raper, D., Bush, M., 2009. A test of Sporormiella representation as a predictor ofmegaherbivore presence and abundance. Quat. Res. 71, 490e496.
Rayburn, J.A., Franzi, D.A., Knuepfer, P.L.K., 2007. Evidence from the Lake ChamplainValley for a later onset of the Champlain Sea and implications for late glacialmeltwater routing to the North Atlantic. Palaeogeogr. Paleoclimatol. Palaeoecol246, 62e74.
Reeve, S.A., Forgacs, K., 1999. Connecticut radiocarbon dates: a study of prehistoriccultural chronologies and population trends. Bull. Archaeol. Soc. CT 62, 19e66.
Reilly, E.M., 1974. New York elephant hunt. The Conservationist 28, 5e7, 47.Reimer, P.J., Bard, E., Bayliss, A., Beck, J.W., Blackwell, P.G., Bronk Ramsey, C.,
Buck, C.E., Cheng, H., Edwards, R.L., Friedrich, M., Grootes, P.M., Guilderson, T.P.,Haflidason, H., Hajdas, I., Hatté, C., Heaton, T.J., Hoffman, D.L., Hogg, A.G.,Hughen, K.A., Kaiser, K.F., Kromer, B., Manning, S.W., Niu, M., Reimer, R.W.,Richards, D.A., Scott, E.M., Southon, J.R., Staff, R.A., Turney, C.S.M., van derPlicht, J., 2013. IntCal13 and Marine13 radiocarbon age calibration curves 0e50,000 years cal BP. Radiocarbon 55, 1869e1887.
Rick, J.W., 1987. Dates as data: an examination of the Peruvian Preceramic radio-carbon record. Am. Antiq. 52, 55e73.
Ripple, W.J., Van Valkenburgh, B., 2010. Linking top-down forces to the Pleistocenemegafaunal extinctions. Bioscience 60, 516e526.
Ritchie, W.A., Funk, R.E., 1973. Aboriginal Settlement Patterns in the Northeast. In:New York State Museum and Science Service Memoir, vol. 20. New York StateMuseum, Albany.
Robinson, B.S., Ort, J.C., Eldridge, W.A., Burke, A.L., Pelletier, B.G., 2009. Paleoindianaggregation and social context at Bull Brook. Am. Antiq. 74, 423e447.
Robinson, G.S., Burney, D.A., 2008. The Hyde Park mastodon and palynological cluesto megafaunal extinction. Paleontogr. Am. 61, 291e299.
Robinson, G.S., Burney, L.P., Burney, D.A., 2005. Landscape paleoecology andmegafaunal extinction in southeastern New York State. Ecol. Monogr. 75, 295e315.
Schmidt, I., Bradtmöller, M., Kehl, M., Pastoors, A., Tafelmaier, Y., Weninger, B.,Weninger, G.-C., 2012. Rapid climate change and variability of settlement pat-terns in Iberia during the Late Pleistocene. Quat. Int.. http://dx.doi.org/10.1016/j.quaint.2012.01.018.
Shennan, S., Edinborough, K., 2007. Prehistoric population history: from the lateglacial to the late Neolithic in central and northern Europe. J. Archaeol. Sci. 34,1339e1345.
Spiess, A.E., Wilson, D.B., 1987. Michaud: A Paleoindian Site in the New England-Maritimes Region. In: Occasional Publictions in Maine Archaeology, vol. 6.The Maine Historic Society, Augusta.
Spiess, A.E., Wilson, D., Bradley, J.W., 1998. Paleoindian occupation in the NewEngland-Maritimes region: beyond cultural ecology. Archaeol. East. N. Am. 26,201e264.
Steadman, D.W., 1988. Vertebrates from the late Quaternary Hiscock site, GeneseeCounty, New York. In: Laub, R.S., Miller, N.G., Steadman, D.W. (Eds.), LatePleistocene and Early Holocene Paleoecology and Archaeology of the EasternGreat Lakes Region. Bull. Buff. Soc. Natural Sci. 33, 95e113. Buffalo, NY.
Steele, J., 2010. Radiocarbon dates as data: quantitative strategies for estimatingcolonization front speeds and event densities. J. Archaeol. Sci. 37, 2017e2030.
Stuiver, M., Reimer, P.J., 1993. Extended 14C database and revised CALIB radiocarboncalibration program. Radiocarbon 35, 215e230.
Surovell, T.A., 2008. Extinctions of big game. In: Pearsall, D.M. (Ed.), Encyclopedia ofArchaeology. Elsevier, Amsterdam, pp. 1365e1374.
Surovell, T.A., Brantingham, P.J., 2007. A note on the use of temporal frequencydistributions in studies of prehistoric demography. J. Archaeol. Sci. 34, 1868e1877.
Surovell, T.A., Finely, J., Smith, G.M., Brantingham, P.J., Kelly, R.L., 2009a. Correctingtemporal frequency distributions for taphonomic bias. J. Archaeol. Sci. 36, 1715e1724.
Surovell, T.A., Holliday, V.T., Gingerich, J.A., Ketron, C., Haynes, C.V., et al., 2009b. Anindependent evaluation of the Younger Dryas extraterrestrial impact hypoth-esis. Proc. Natl. Acad. Sci. U.S.A 106, 18155e18158.
Surovell, T.A., Waguespack, N.M., 2008. How many elephant kills are 14? Clovismammoth and mastodon kills in context. Quat. Int 191, 82e97.
Surovell, T.A., Waguespack, N.M., 2009. Human prey choice in the late Pleistoceneand its relation to megafaunal extinction. In: Haynes, G. (Ed.), AmericanMegafaunal Extinctions at the End of the Pleistocene. Springer, Dordrecht,pp. 77e105.
Surovell, T.A., Waguespack, N.M., Brantingham, P.J., 2005. Global archaeologicalevidence for proboscidean overkill. Proc. Natl. Acad. Sci. U.S.A 102, 6231e6236.
Tallavaara, M., Pesonen, P., Oinonen, M., 2010. Prehistoric population history ineastern Fennoscandia. J. Archaeol. Sci. 37, 251e260.
Tankersley, K.B., Schlecht, K.D., Laub, R.S., 1998. Fluoride dating of mastodon bonefrom an Early Paleoindian spring site. J. Archaeol. Sci. 25, 805e811.
Tankersley, K.B., Vanderlaan, S., Holland, J.D., Bland, S., 1997. Geochronology of theArc Site: a Paleoindian habitation in the Great Lakes region. Archaeol. East. N.Am. 25, 31e44.
Thompson, L.M., McIntosh, G.C., Allmon, W.D., 2008. Discoveries of the Americanmastodon (Mammut americanum) in New York State: 1922e2007. In:Allmon, W.D., Nester, P.L. (Eds.), Mastodon Paleobiology, Taphonomy, andPaleoenvironment in the Late Pleistocene of New York State: Studies on theHyde Park, Chemung, and North Java Sites. Paleontogr. Am. 61, 49e61.
Tomenchuk, J., 2003. Analysis of Pleistocene bone artifacts from the Hiscock site. In:Laub, R.S. (Ed.), The Hiscock Site: Late Pleistocene and Holocene Paleoecologyand Archaeology of Western New York State. Bull. Buff. Soc. Natural Sci. 37,238e260. Buffalo, NY.
Waters, M.R., Stafford, T.W., 2007. Redefining the age of Clovis: implications for thepeopling of the Americas. Science 315, 1122e1126.
Weninger, B., Jöris, O., 2008. A 14C age calibration curve for the last 60 ka: theGreenland-Hulu U/Th timescale and its impact on understanding the Middle toUpper Paleolithic transition in Western Eurasia. J. Hum. Evol. 55, 772e781.
Weninger, B., Edinborough, K., Clare, L., Jöris, O., 2011. Concepts of probability inradiocarbon analysis. Documen. Praehistor. 38, 1e20.
Wesler, K.W., 1981. Models for Pleistocene extinction. N. Am. Archaeol. 2, 85e100.Will, R., 1999. Radiocarbon dates obtained by Archaeological Research Consultants,
Inc., Ellsworth, Maine, as of December 31, 1999. Mass. Archaeol. Soc. Newsl. 13(Summer/Fall), 2e3.
Williams, A.N., 2012. The use of summed probability distributions in archaeology: areview of methods. J. Archaeol. Sci. 39, 578e589.
Wiseman, F.M., 2001. The Voice of the Dawn: An Autohistory of the Abenaki Nation.University Press of New England, Hanover.
Wolverton, S., Lyman, R.L., Kennedy, J.H., La Point, T.W., 2009. The terminal Pleis-tocene extinctions in North America, hypermorphic evolution, and the dynamicequilibrium model. J. Ethnobiol. 29, 28e63.
Yansa, C.H., Adams, K.M., 2012. Mastodons and Mammoths in the Great Lakes re-gion, USA and Canada: new insights into their diets as they neared extinction.Geog. Compass 6, 175e188.