north west leicestershire local plan annual monitoring ... · case. as a result, the council is...
TRANSCRIPT
North West Leicestershire Local Plan
Annual Monitoring Report ‐ 2010/11
Published December 2011
2
Chapter Page
1. Introduction 3 2. The Localism Act 4 3. Housing 6
o Completions 6 o Permissions 6 o Five Year Housing Land Supply 6 o Design 7 o Affordable Housing 9 o Previously Developed Land / Greenfield Completions 9 o Completion Density 10
4. Employment 11 o Employment Land 11 o Unemployment 12
5. Retail Supplementary Planning Document 13 6. River Mease 14
Appendices
3
Introduction Government has given local authorities the freedom to decide what details they provide in their Annual Monitoring Reports (AMR). As a result, this AMR is greatly pared down from that of previous years, and includes what is considered the most important information. The format of next year’s AMR has yet to be decided. Given the Council’s move to area working, which has seen the creation of three “Community Forum Areas” in the district, it is considered likely that future AMRs will reflect this. We are also keen to receive wider opinions on what should and should not be included in future documents. For the purposes of this AMR, however, the following are considered in turn:
• The Localism Act
• Housing
• Employment
• Retail Supplementary Planning Document
• River Mease This AMR is being prepared after the Council’s Cabinet accepted a report from officers which recommended that (among other things) the Plan period for the emerging Core Strategy should run from 2006 until 2031. This AMR therefore presents historic data from 2006 onwards unless otherwise stated.

4
The Localism Act Having received royal assent during late 2011, it will take some time for the provisions and requirements of the Localism Act to have an impact on the planning system, although some have an immediate effect. The general idea of “localism” has been known for some time and the Council has been preparing to acknowledge it in its planning policies. In addition, many of the Act’s provisions merely give legal weight to practices already taking place in local government. This section outlines the main issues relating to monitoring specifically. For more details on the wider impacts of the Localism Act, a summary is included in the December 2011 Planning Policy Newsletter. The Newsletter is available to view on the Council’s website by clicking here. The Government has also prepared a “Plain English” guide to the Act, which can be viewed here. Regional Strategies The Localism Act will enable the Government to abolish Regional Strategies in accordance with their stated intention in 2010. To this end, the Government has recently published draft assessments of the likely environmental implications that would result from this abolition. Until such time as the Regional Strategies – in the East Midlands, this is the East Midlands Regional Plan – are abolished, they remain part of the development plan and the Council must prepare its planning policies without having regard to the government’s intended abolition. This is not the case with planning applications, where the intended abolition is capable of being a material consideration. The Council is, therefore, obliged to continue monitoring progress against the policies of the Regional Plan. Annual Monitoring Report Government previously advised Councils that the format of their AMRs would now be of their own design, and would not require Councils to respond to the “Core Output Indicators” of previous years. As noted earlier, this abridged AMR is the result of that earlier direction. The Localism Act no longer requires that Councils submit their AMRs to the Secretary of State and, as the Act comes into force on 15th January 2012 and AMRs must be submitted by 31st December, this AMR will be the last North West Leicestershire District Council submits to the Secretary of State.

5
Community Infrastructure Levy The Localism Act requires Councils to move away from Section 106 Agreements to secure “planning gain” – that is, finances or infrastructure required as a result of the implementation of a planning permission – and towards the Community Infrastructure Levy (CIL). CIL is a one‐off payment which is levied to a developer at the level of each new dwelling or 1 hectare (or other threshold as may be specified by a Council). The monies raised via CIL must be used to respond to pre‐determined infrastructure needs in the district. It is expected that work on the development of CIL will commence in 2011 as part of which the Council will consider how best to monitor the money brought in under CIL; previously, we monitored money and infrastructure secured under Section 106 Agreements, differentiated by type of infrastructure. Community Right to Build and Neighbourhood Planning The Act gives groups of local people the power to deliver the development that their local community want. A community organisation, formed by members of the local community, will be able to bring forward development proposals which, providing they meet minimum criteria and can demonstrate local support through a referendum, will be able to go ahead without requiring a separate traditional planning application. Neighbourhood planning will allow communities to come together through a local parish council or neighbourhood forum and say where they think new houses, businesses and shops should go – and what they should look like. Local communities will be able to use neighbourhood planning to grant full or outline planning permission in areas where they most want to see new homes and businesses. The mechanism for this will be the Neighbourhood Plan or the Neighbourhood Development Order. Provided a Neighbourhood Plan is in line with national planning policy, with the strategic vision for the wider area set by the local authority, and with other legal requirements, local people will be able to vote on it in a referendum. If the Plan is approved by a majority of those who vote, then we will adopt it within our Development Plan. It is not immediately clear if we will be able to monitor development approved under the “Community Right to Build” and “Neighbourhood Development Order” arrangements as new development will not need to go through the planning system. Our internal records are maintained with reference to new planning permissions issued, so if the Council does not formally grant planning permission for certain developments it will require an adapted monitoring system.

6
Housing Completions The Plan period runs from 2006/07 until 2030/31. The completions from that year onwards are set out below:
Monitoring Period New Dwellings
2006 / 2007 336
2007 / 2008 354
2008 / 2009 235
2009 / 2010 231
2010 / 2011 187 Table 1: Housing Completions
There is a clear downward trend from 2007/08 onwards. This is as a result of the continuing financial problems faced in the UK and beyond. As noted below, it is considered that the depressed housing market will continue to have an impact for some time, although the situation is not considered likely to worsen. A full housing trajectory, prepared in December 2011, can be found at Appendix One and demonstrates that completions are projected to increase gradually until 2012/13 with a more dramatic increase thereafter. Permissions Significant numbers of dwellings have been granted planning permission during the year but, as Tables 1 and 2 demonstrate, this is not having an immediate impact on the number of builds:
Date Dwellings with
Planning Permission
31st March 2007 673
31st March 2008 786
31st March 2009 652
31st March 2010 1,055
31st March 2011 1,097
30th September 2011 1,057 Table 2: Planning Permissions
Five Year Housing Land Supply Despite the recent increase in planning permissions for dwellings noted above, the Council remains unable to demonstrate a Five Year Housing Land Supply (5YHLS). This situation will not improve in the short‐term, particularly as it is becoming clear that permissions can be granted but that development might not occur.

7
The most recent assessment of 5YHLS (December 2011) projects that 1,651 dwellings will be built between 2012 and 2017 and, taking into account previous low completion rates, this gives the Council 2.67 years of supply when measured against the Regional Plan Target. As noted earlier, the Council must prepare its planning policies to be in general conformity with the Regional Plan unless more recent evidence can demonstrate reasons why this should not be the case. As a result, the Council is considering a different housebuilding target based on work completed late in 2011. This document – “The Leicester and Leicestershire Housing Requirements Study” – considered various projections of housing need, one of which suggested 9,700 new dwellings would be required to ensure 10% employment growth in the district between 2006 and 2031. In October 2010, the Council’s elected members approved officers’ recommendations to proceed with this different target in its Core Strategy as opposed to that of the Regional Plan (10,200 dwellings between 2006 and 2026). Taking this into account, it is considered appropriate to measure 5YHLS supply against both targets. In addition to these two targets, the draft National Planning Policy Framework (NPPF) must be considered. In a very early form, the NPPF recommends that Councils plan an additional 20% of dwelling need for flexibility of supply – in essence, requiring a Six Year Housing Land Supply be deliverable within a five year period. The Planning Inspectorate has advised that the draft NPPF can be a material consideration when determining a planning application. As a result, it is appropriate to measure the Council’s projected completion rates – these, noted above, are 1,651 dwellings between 2012 and 2017 – against both housebuilding targets, and with both increased by 20%:
Housebuilding Target Five Year Land Supply (Years) Period Source Overall Target Annual Target
2006 – 2026 Regional Plan 10,200 510 2.67
Regional Plan + 20%
12,240 612 2.20
2006 – 2031
Emerging Core Strategy
9,700 388 3.84
Emerging Core Strategy + 20%
11,650 466 3.10
Table 3: Five Year Land Supply Figures
Design The Council remains committed to improving the quality of design for new development in the district, particularly so with housing. Since the production of the previous AMR, the Commission for Architecture and the Built Environment (CABE) has been largely disbanded and then subsumed within the Design Council. CABE was the primary supporter of the Building for Life housing design standard (BfL), and the future for Building for Life remains uncertain. However, North West Leicestershire continues to monitor all new housing schemes against the BfL criteria – these can be found at Appendix Two – and the results for this year are encouraging.

8
In addition to BfL, the Council has developed a design initiative known as ourplace™, which takes the BfL criteria and applies a scoring schedule:
16.0 – 20.0 Very Good
14.0 – 15.5 Good
10.0 – 13.5 Average
0.0 – 10.0 Poor
More information on the ourplace™ initiative can be found on its dedicated website. Previous years demonstrated poor performance against the BfL standard by new schemes, primarily due to a lack of national policy support for good design in new dwellings and development generally. Since the appointment of the Council’s Urban Designer, the BfL design standard has become more strictly adhered to and schemes are now being completed having had regard to BfL throughout their design timescale. This year, six schemes were assessed:
Scheme Year Granted No. of DwellingsPercentage Affordable
ourplace™ Rating
David Taylor Close, Heather
2010 11 100 Very Good (17 / 20)
Daybreak, Donington le Heath
2010 8 100 Very Good (17 / 20)
Land at The Huntlands, Long Whatton
2010 9 100 Very Good (16 / 20)
Parkfield Crescent, Appleby Magna
2009 8 100 Very Good (16 / 20)
The Old Biscuit Factory, Ashby
2007 131 35 Poor
(9.5 / 20)
The George Hotel, Belton
2007 10 0 Poor
(8 / 20) Table 4: Design Quality of Schemes Completed During 2010/11
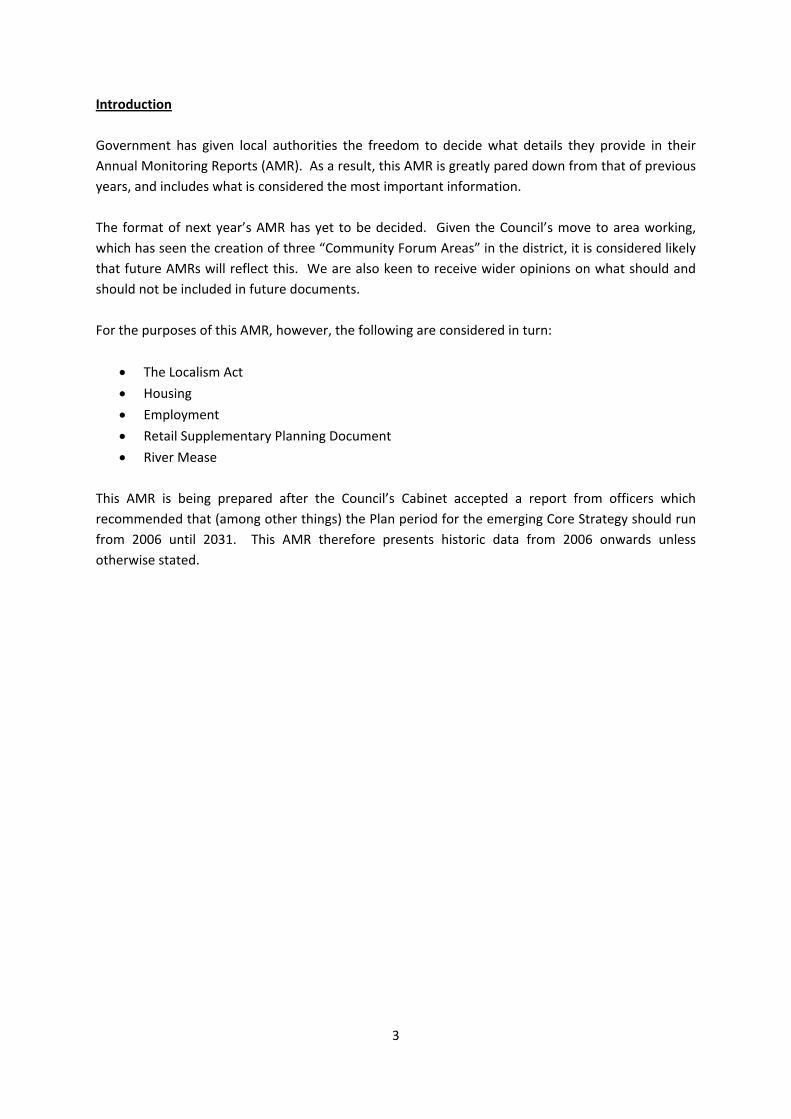
Four of the six schemes achieved a “Very Good” standard under the ourplace™ initiative, with the other two achieving a borderline “Poor”/”Average” score. Each of the Very Good schemes have been through the planning system since urban design became a corporate priority. All of these four were 100% Affordable Housing schemes, one of which – Daybreak – was exclusively for profoundly disabled residents and their carers.
It should be noted that, at the time planning permission was granted for these Affordable Housing schemes, the Homes and Communities Agency (HCA), which provided all the funding for these schemes, required Affordable Housing to meet high environmental standards. These schemes would not have received the HCA funding had they not met these standards, which also resulted in their automatically meeting BfL criterion 5 and sometimes criterion 19. The full BfL criteria can be found in Appendix 2 to this AMR.The two remaining schemes were granted planning permission in 2007. The
9
George Hotel conversion was let down primarily by attention to detail in the craftsmanship, while the redevelopment of the old Biscuit Factory in Ashby represented a missed opportunity, its score of 9.5 reflecting a number of minor concerns more than any major failings.
The average score of 14.0 out of 20 compares favourably with last year’s average of 9.9 out of 201.
Figure 1 (left): David Taylor Close, Heather
Figure 2 (above): Daybreak, Donington le Heath
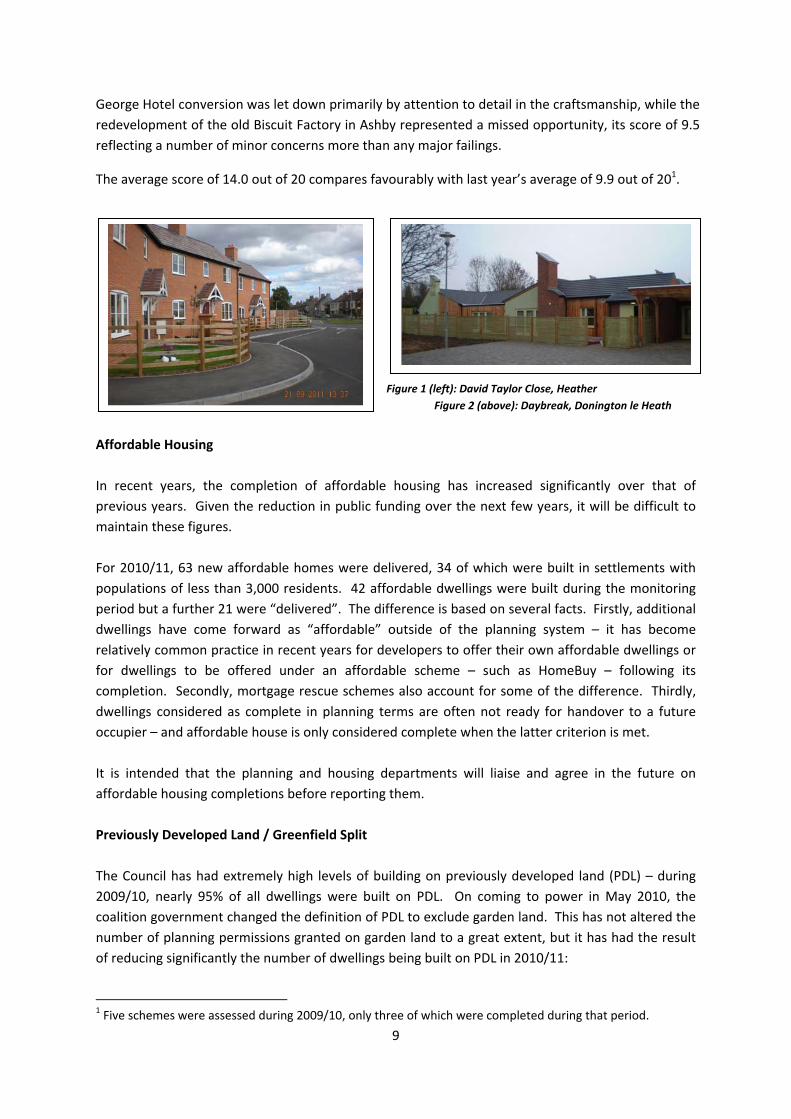
Affordable Housing In recent years, the completion of affordable housing has increased significantly over that of previous years. Given the reduction in public funding over the next few years, it will be difficult to maintain these figures. For 2010/11, 63 new affordable homes were delivered, 34 of which were built in settlements with populations of less than 3,000 residents. 42 affordable dwellings were built during the monitoring period but a further 21 were “delivered”. The difference is based on several facts. Firstly, additional dwellings have come forward as “affordable” outside of the planning system – it has become relatively common practice in recent years for developers to offer their own affordable dwellings or for dwellings to be offered under an affordable scheme – such as HomeBuy – following its completion. Secondly, mortgage rescue schemes also account for some of the difference. Thirdly, dwellings considered as complete in planning terms are often not ready for handover to a future occupier – and affordable house is only considered complete when the latter criterion is met. It is intended that the planning and housing departments will liaise and agree in the future on affordable housing completions before reporting them. Previously Developed Land / Greenfield Split The Council has had extremely high levels of building on previously developed land (PDL) – during 2009/10, nearly 95% of all dwellings were built on PDL. On coming to power in May 2010, the coalition government changed the definition of PDL to exclude garden land. This has not altered the number of planning permissions granted on garden land to a great extent, but it has had the result of reducing significantly the number of dwellings being built on PDL in 2010/11: 1 Five schemes were assessed during 2009/10, only three of which were completed during that period.
10
Previously
Developed Land Greenfield Land
Percentage on PDL
Completions (2010 / 2011)
131 67 66.16%
Under Construction (as at 31st March 2011)
96 35 73.28%
Planning Permission (as at 31st March 2011)
642 455 58.52%
Table 5: Previously Developed Land / Greenfield Split
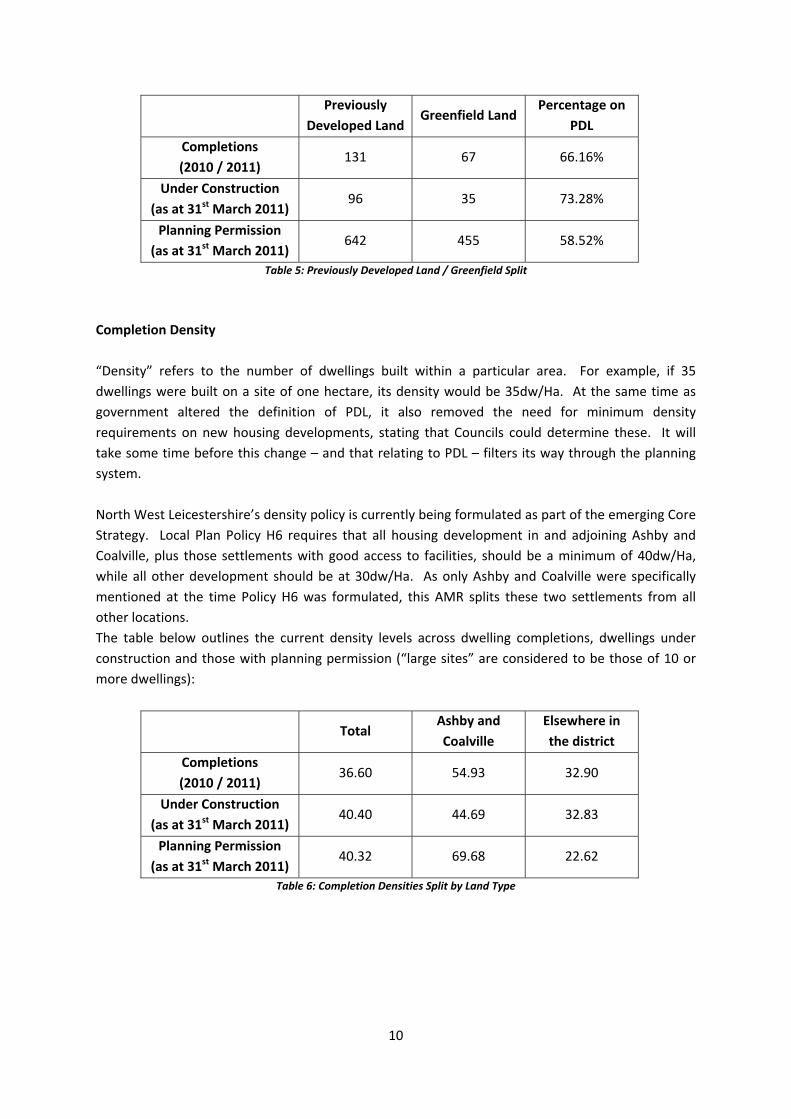
Completion Density “Density” refers to the number of dwellings built within a particular area. For example, if 35 dwellings were built on a site of one hectare, its density would be 35dw/Ha. At the same time as government altered the definition of PDL, it also removed the need for minimum density requirements on new housing developments, stating that Councils could determine these. It will take some time before this change – and that relating to PDL – filters its way through the planning system. North West Leicestershire’s density policy is currently being formulated as part of the emerging Core Strategy. Local Plan Policy H6 requires that all housing development in and adjoining Ashby and Coalville, plus those settlements with good access to facilities, should be a minimum of 40dw/Ha, while all other development should be at 30dw/Ha. As only Ashby and Coalville were specifically mentioned at the time Policy H6 was formulated, this AMR splits these two settlements from all other locations. The table below outlines the current density levels across dwelling completions, dwellings under construction and those with planning permission (“large sites” are considered to be those of 10 or more dwellings):
Total Ashby and Coalville
Elsewhere in the district
Completions (2010 / 2011)
36.60 54.93 32.90
Under Construction (as at 31st March 2011)
40.40 44.69 32.83
Planning Permission (as at 31st March 2011)
40.32 69.68 22.62
Table 6: Completion Densities Split by Land Type

11
Employment Employment Land
Use Class Planning Permission
(Hectares)
B1 20.18
B12 4.42
B128 29.47
B18 3.47
B2 0.00
B8 30.06
Total 87.60 Table 7: Employment Land Commitments by Type
It is common for developers to seek permission for a range of uses which fall within the B Use Class. This is reflected in the figures above. The open‐ended nature of these commitments makes it difficult to assess whether there is a balance of employment uses in the district. A large total of all the available employment land is on the site of the former Castle Donington Power Station which is being redeveloped as a Regional Storage and Distribution Centre. Within the monitoring period a significant amount of employment land (100,891 square metres on a 15.90Ha plot) has been started at the Regional Storage and Distribution Centre. This is a single B8 unit, with Marks and Spencer as the end‐user.
Use Class Planning Permission (Square Metres)
B1
B12
B128
B18
B2
B8 100,891
Total 100,891 Table 8: Employment Land Started by Type
While the amount of employment land started has increased dramatically compared to last year’s figures, this increase is, as noted above, attributable to one development. This lack of development reflects a fragile national and international economy
12
Unemployment: April 2010 to March 2011
0.0
0.5
1.0
1.5
2.0
2.5
3.0
3.5
4.0
Apr-10
May-10
Jun-10
Jul-10
Aug-10
Sep-10
Oct-10
Nov-10
Dec-10
Jan-11
Feb-11
Mar-11
Perc
enta
ge o
f Wor
king
Age
Pop
ulat
ion
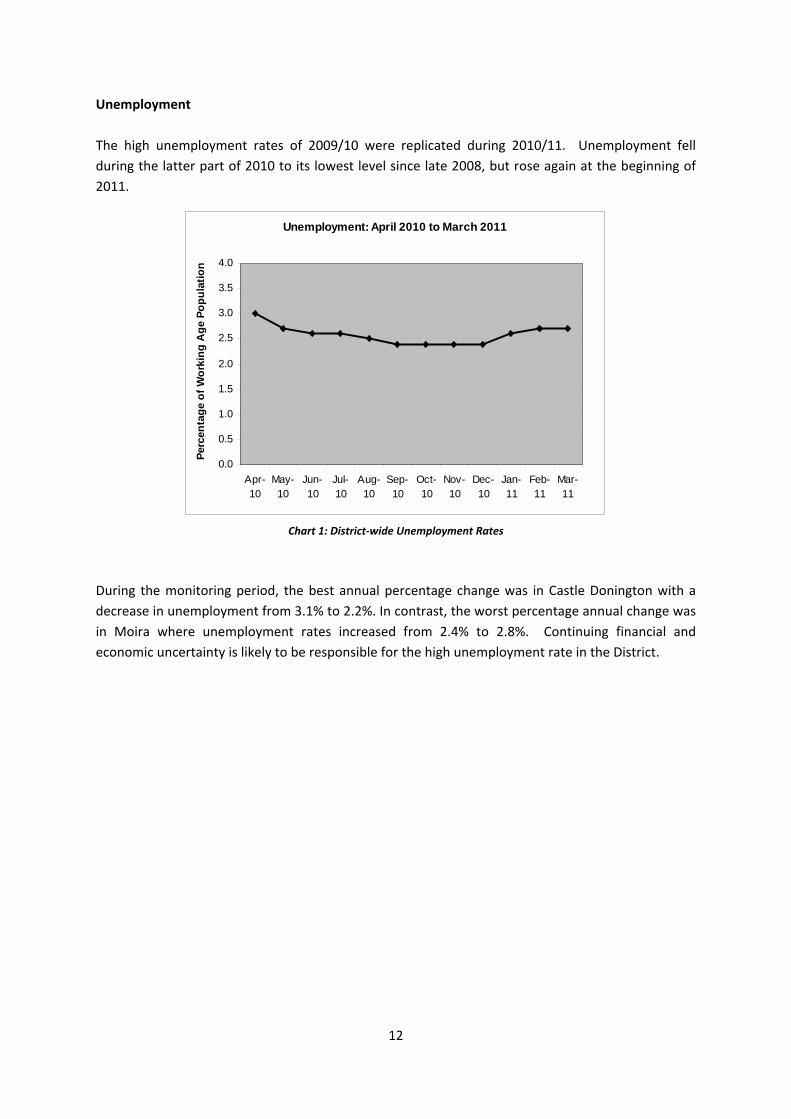
Unemployment The high unemployment rates of 2009/10 were replicated during 2010/11. Unemployment fell during the latter part of 2010 to its lowest level since late 2008, but rose again at the beginning of 2011.
Chart 1: District‐wide Unemployment Rates
During the monitoring period, the best annual percentage change was in Castle Donington with a decrease in unemployment from 3.1% to 2.2%. In contrast, the worst percentage annual change was in Moira where unemployment rates increased from 2.4% to 2.8%. Continuing financial and economic uncertainty is likely to be responsible for the high unemployment rate in the District.

13
Retail Supplementary Planning Document As a result of recent work conducted during the preparation of the Retail SPD, it is possible to report on a comprehensive assessment of the uses in the District’s Town and Local Centres. The Retail SPD proposes keeping shopping use as no less than 50% of all uses in any town or local centre. It also proposes that no more than 10% of units should be hot food takeaways (A5 use). There are further recommendations to prevent the coalescence of A5 uses along Market Street in Ashby and to prevent the rise of A5 uses in Ibstock (currently 19% of all commercial uses). The Retail SPD was adopted in January 2011, and the Council monitors these uses, and any other specific and general issues that may arise from the SPD’s adoption. Kegworth falls short of the 50% retail proportion but not significantly enough for concern. Within the last year change of uses have included the loss of a restaurant use (located on the outer periphery of the village centre) to a residential use, and the relocation of financial and professional services and replacement with a café use. It is considered that these changes have not detracted from the vitality and viability of this local centre. In Ashby town centre there has be no change in the mix of uses, nor has there been a change in the balance of uses in Measham. Within Ibstock, a previous retail use has been granted permission for an estate agent use which has now been implemented. In addition, a new retail unit has opened up on the High Street and is in use as a Barbershop. These changes are not considered to detract from the retail character of the centre. There have been no applications seeking additional take away (A5) uses within Ibstock. Two previous vacant units within Castle Donington are now occupied by retail uses and two other units are now operating as retail following their change of use. There has also been the loss of a retail use to a financial and professional service use. However, the retail vitality and viability of this local centre remains strong at approximately 60% of the overall uses.

14
River Mease
Figure 3: River Mease Special Area of Conservation Catchment
Over two years ago, the Environment Agency and Natural England advised the District Council that there were water quality issues which were affecting the River Mease. This meant that the Council was unable to approve many new developments in the River Mease catchment area as they may have led to high levels of chemicals in the river. However, the Council, the Environment Agency and Natural England have worked together to agree a Water Quality Management Plan. As a result, some development can now go ahead under certain conditions and developments of 9 dwellings or under can now be considered for approval. In addition, two large housing developments have been granted planning permission (subject to the satisfactory signing of a section 106 legal agreement) in Ashby, totalling some 383 dwellings. The Council is working in partnership with the Environment Agency and Natural England to prepare a plan to identify ways in which larger developments will be required to make a financial contribution towards making improvements to the Special Area of Conservation.

15
Appendix One Housing Trajectory showing projected completions from 2006 to 2031

16
SITE 2006/07
to 2011/12
(projected)
2012
/13
2013
/14
2014
/15
2015
/16
2016
/17
2017
/18
2018
/19
2019
/20
2020
/21
2021
/22
2022
/23
2023
/24
2024
/25
2025
/26
2026
/27
2027
/28
2028
/29
2029
/30
2030
/31
TOTA
L
1 2 3 4 5
SMALL SITE ALLOWANCE 62 62 62 62 62 62 62 62 62 62 62 62 62 62 62 62 62 62 62 1,178
WHITEHOLME, 63 ASHBY ROAD, KEGWORTH 2 2
MINNESOTA'S, BROOM LEYS ROAD, COALVILLE 20 20
138-148 ASHBY ROAD, COALVILLE 16 16
BATTLEFLAT DRIVE, ELLISTOWN 5 5
SNIBSTON DISCOVERY PARK, ASHBY ROAD, COALVILLE 19 19 38
STEPHENSON COLLEGE BRIDGE, COALVILLE 7 7 14
OFF ASHBY ROAD, IBSTOCK 30 35 35 35 35 13 183
REAR OF ORCHARD WAY, MEASHAM 9 9 6 24
NORTH OF 112 PARK LANE, CASTLE DONINGTON 20 25 30 35 35 35 35 35 20 270
SMISBY ROAD, ASHBY 25 25 25 25 25 25 150
LOUNT WORKS, NOTTINGHAM ROAD, LOUNT 15 15 30
CITRUS GROVE, KEGWORTH 20 20 20 20 80
LEICESTER ROAD, ASHBY 25 25 25 25 25 25 25 25 25 25 8 258
MALVERN CRESCENT, ASHBY 26 26
BARDON GRANGE, COALVILLE (LOCAL PLAN ALLOCATION) 60 60 60 60 60 60 60 60 60 60 60 60 60 60 60 60 60 1,020
COMPUTER CENTRE, DERBY ROAD, KEGWORTH 25 25 25 29 104
SOUTH OF GRANGE ROAD, COALVILLE 60 60 120 120 120 120 120 120 120 120 120 120 120 120 120 120 1,800
WOODVILLE WOODLANDS 30 30 30 30 37 157
KANE CLOSE, COALVILLE 10 11 21
HOLYWELL MILL, BURTON ROAD, ASHBY 22 22 44
COUNCIL DEPOT, HIGHFIELD ROAD, COALVILLE 13 13 26
FORD GARAGE SITE, HOTEL STREET, COALVILLE 20 20
Past Completions 1,343 1,343 Projected Completions 192 215 242 329 422 443 399 332 339 287 267 267 250 242 242 242 242 242 242 242 5,678 Cumulative Completions 1,535 1,750 1,992 2,321 2,743 3,186 3,585 3,917 4,256 4,543 4,810 5,077 5,327 5,569 5,811 6,053 6,295 6,537 6,779 7,021

17
Appendix Two Building for Life design criteria

18
Environment and Community
1 Does the development provide (or is it close to) community facilities, such as a school, parks, play areas, shops, pubs or cafes?
2 Is there an accommodation mix that reflects the needs and aspirations of the local community?
3 Is there a tenure mix that reflects the needs of the local community?
4 Does the development have easy access to public transport?
5 Does the development have any features that reduce its environmental impact?
Character
6 Is the design specific to the scheme?
7 Does the scheme exploit existing buildings, landscape and topography?
8 Does the scheme feel like a place with a distinctive character?
9 Do the buildings and layout make it easy to find your way around?
10 Are streets defined by a well-structured layout?
Streets, Parking and Pedestrianisation
11 Does the buildings layout take priority over the roads and car parking, so that the highways do not dominate?
12 Is the car parking well-integrated and situated so it supports the street scene?
13 Are the streets pedestrian, cycle and vehicle friendly?
14 Does the scheme integrate with existing roads, paths and surrounding development?
15 Are public spaces and pedestrian routes overlooked and do they feel safe?
Design & Construction
16 Is public space well-designed and does it have suitable management arrangements in place?
17 Do buildings exhibit architectural quality?
18 Do internal spaces and layout allow for adaptation, conversion or extension?
19 Has the scheme made use of advances in construction or technology that enhances its performance, quality and attractiveness?
20 Do buildings or spaces outperform statutory minima, such as building regulations?