north west estuaries processes reports
TRANSCRIPT

Nor th Wes t Es tua r i es P rocesses Repo r t s
Ribble Estuary
Prepared for Sefton Council
December 2013
22 Lendal
York YO1 8AA
GB +44 (0) 1904 559 900


COPYRIGHT 2013 HALCROW GROUP LTD I RIBBLE_ESTUARY_PROCESSES_REPORT_FINAL.DOCX
Metadata Addressee Sefton Council
Audience Coastal/Environmental Engineers
Contributor(s) CH2M Hill, Kenneth Pye Associates Ltd
Coverage North West estuaries
Creator Halcrow Group Ltd, a CH2M Hill Company
Date December 2013
Description Review of coastal processes knowledge and issues in Ribble Estuary
Format Text
Identifier V3.0 December 2013
Keyword Estuary, Strategic, Coastal, Processes
Language English
Location Ribble Estuary
Mandate CERMS Regional Monitoring Framework
Publisher Sefton Council
Status Final
Subject Coastal and estuarine processes
Title North West Estuaries Processes Reports – Ribble Estuary
Type Text/report
Date of metadata update
17 December 2013

COPYRIGHT 2013 HALCROW GROUP LTD II RIBBLE_ESTUARY_PROCESSES_REPORT_FINAL.DOCX
Document History North West Estuaries Processes Report
Ribble Estuary
Sefton Council
This document has been issued and amended as follows:
version Date Description Created By Verified By Approved By
1.0 28/03/13 Internal Draft Emma Allan, Nigel Pontee, Ken Pye
A Parsons N/A
2.0 15/10/13 Draft for client comment A Parsons, K Pye A Parsons
3.0 17/12/13 Finalised following client comments, updated formatting and minor amends from internal review.
A Parsons K Pye A Parsons
Halcrow Group Limited is a CH2M HILL company
Halcrow Group Limited has prepared this report in accordance with the instructions of client Sefton Council for the client’s sole and specific use.
Any other persons who use any information contained herein do so at their own risk.

COPYRIGHT 2013 HALCROW GROUP LTD III
Contents
Metadata ..................................................................................................................................................... i
Document History ....................................................................................................................................... ii
Contents .................................................................................................................................................... iii
Glossary ...................................................................................................................................................... v
Executive summary ..................................................................................................................................... x
1 Introduction ................................................................................................................................... 1
2 Coastal Setting ................................................................................................................................ 2
3 Estuary Review ............................................................................................................................... 4 3.1 Description ................................................................................................................................. 4 3.2 Coastal Processes ....................................................................................................................... 6 3.3 Past Changes............................................................................................................................. 10 3.4 Future behaviour ...................................................................................................................... 11 3.5 Conceptual Model of Estuary Behaviour .................................................................................. 12 3.6 Coastal Defences and SMP policies .......................................................................................... 15 3.7 Existing Monitoring Data .......................................................................................................... 20 3.8 Gaps in Understanding ............................................................................................................. 22
5 References .................................................................................................................................... 28
Appendix A Coastal Defences in the Ribble Estuary ................................................................................... 33
Appendix B: Recommendations for further studies in the Ribble Estuary .................................................. 47
Tables Table 3.1 Tidal levels (mOD) at Secondary Ports in and near the Ribble Estuary. Source: Admiralty Tide Tables (2012) ...................................................................................................................................................................6 Table 3.2 Existing monitoring data collected and value assessment. .............................................................. 20 Table 3.3 Data gaps and recommendations ...................................................................................................... 23
Figures
Figure 1.1 The location of the Ribble Estuary. ......................................................................................................1 Figure 2.1 Overview of Cell 11 study area, showing SMP2 sub-cell frontages (source: Halcrow, 2010c). ..........2 Figure 2.2 The River Ribble catchment, showing the main urban areas and general extent of the intertidal zone. Source: adapted from Ordnance Survey Open Data, after Pye & Blott (2013). .........................................3 Figure 3.1 Limits of the Ribble Estuary and SMP Policy Unit 11b.1......................................................................5 Figure 3.2 Nature conservation designations and reserves in and surrounding the Ribble Estuary. ..................6 Figure 3.3 Map showing sediment transport in the vicinity of the Ribble Estuary (source: Halcrow, 2010c). ....8 Figure 3.4. Gravel-Sand-Mud and Sand-Silt-Clay trigons, based on the classification of Blott & Pye (2012), for sediment samples collected within the Ribble Estuary in 2009-10 (data from Pye et al., 2010). ........................9 Figure 3.5 A simple conceptual model for the Cell 11b area (source: Halcrow, 2010d) ................................... 14

COPYRIGHT 2013 HALCROW GROUP LTD IV
Figure 3.6. Conceptual diagram showing the main sediment sources, geomorphological features and engineering structures which influence the morphology of the Ribble Estuary. .............................................. 15 Figure 3.7 Shoreline Management Plan (SMP2) Policy Units and adopted policies (Halcrow 2010a) .............. 19 Figure 3.8 Summary of available monitoring data for the Ribble Estuary. Tide gauges located at: (1) Crossens; (2) Penwortham; and (3) Dock Bridges (all operated by the EA). ..................................................................... 21
COPYRIGHT 2013 HALCROW GROUP LTD V
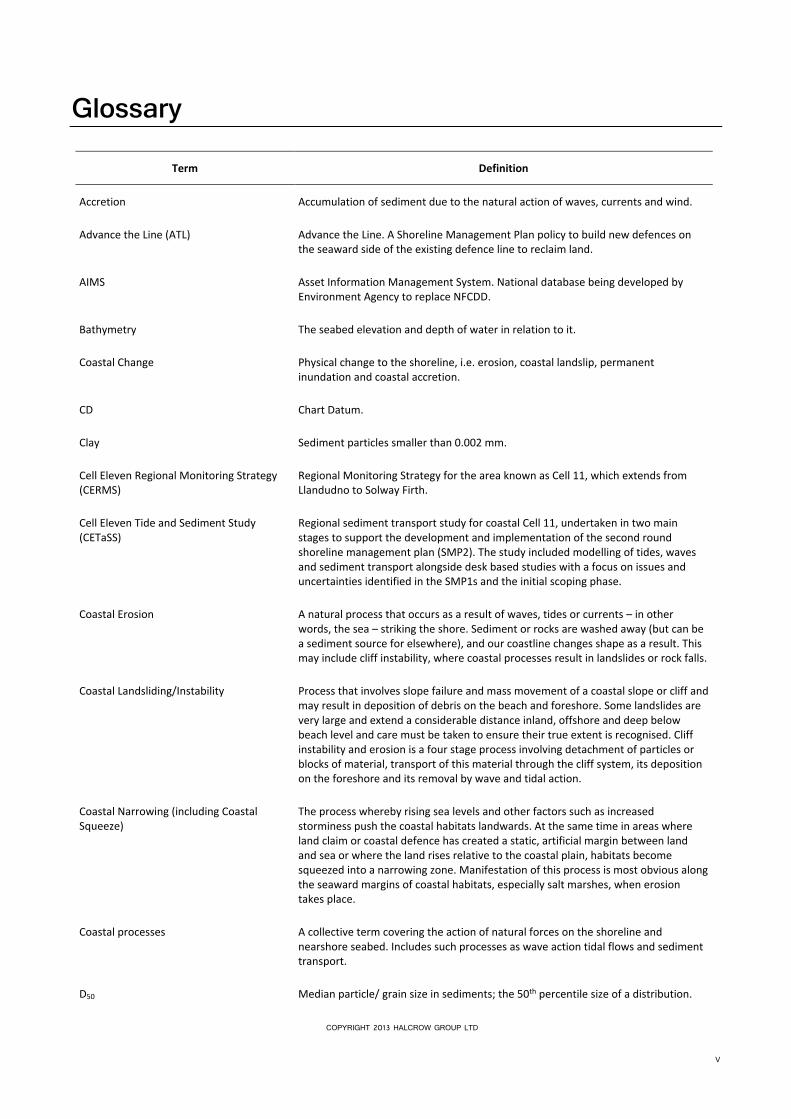
Glossary Term Definition
Accretion Accumulation of sediment due to the natural action of waves, currents and wind.
Advance the Line (ATL) Advance the Line. A Shoreline Management Plan policy to build new defences on the seaward side of the existing defence line to reclaim land.
AIMS Asset Information Management System. National database being developed by Environment Agency to replace NFCDD.
Bathymetry The seabed elevation and depth of water in relation to it.
Coastal Change Physical change to the shoreline, i.e. erosion, coastal landslip, permanent inundation and coastal accretion.
CD Chart Datum.
Clay Sediment particles smaller than 0.002 mm.
Cell Eleven Regional Monitoring Strategy (CERMS)
Regional Monitoring Strategy for the area known as Cell 11, which extends from Llandudno to Solway Firth.
Cell Eleven Tide and Sediment Study (CETaSS)
Regional sediment transport study for coastal Cell 11, undertaken in two main stages to support the development and implementation of the second round shoreline management plan (SMP2). The study included modelling of tides, waves and sediment transport alongside desk based studies with a focus on issues and uncertainties identified in the SMP1s and the initial scoping phase.
Coastal Erosion A natural process that occurs as a result of waves, tides or currents – in other words, the sea – striking the shore. Sediment or rocks are washed away (but can be a sediment source for elsewhere), and our coastline changes shape as a result. This may include cliff instability, where coastal processes result in landslides or rock falls.
Coastal Landsliding/Instability Process that involves slope failure and mass movement of a coastal slope or cliff and may result in deposition of debris on the beach and foreshore. Some landslides are very large and extend a considerable distance inland, offshore and deep below beach level and care must be taken to ensure their true extent is recognised. Cliff instability and erosion is a four stage process involving detachment of particles or blocks of material, transport of this material through the cliff system, its deposition on the foreshore and its removal by wave and tidal action.
Coastal Narrowing (including Coastal Squeeze)
The process whereby rising sea levels and other factors such as increased storminess push the coastal habitats landwards. At the same time in areas where land claim or coastal defence has created a static, artificial margin between land and sea or where the land rises relative to the coastal plain, habitats become squeezed into a narrowing zone. Manifestation of this process is most obvious along the seaward margins of coastal habitats, especially salt marshes, when erosion takes place.
Coastal processes A collective term covering the action of natural forces on the shoreline and nearshore seabed. Includes such processes as wave action tidal flows and sediment transport.
D50 Median particle/ grain size in sediments; the 50th percentile size of a distribution.

COPYRIGHT 2013 HALCROW GROUP LTD VI
Term Definition
EA Environment Agency.
Ebb dominant Stronger current on ebb tide than flood tide. Coarser sediments may be moved more by ebb direction currents than flood. The balance of net sediment transport depends on the relative strength and duration of ebb and flood currents.
Ebb-tide The falling tide. Part of the tidal cycle between high water and the next low water.
Estuary A semi-enclosed coastal body of water which has a free connection to the open sea and where freshwater mixes with saltwater.
Fetch Distance over which a wind acts to produce waves - also termed fetch length.
Flood and Coastal Erosion Risk Management (FCERM)
Flood and coastal erosion risk management addresses the scientific and engineering issues of rainfall, runoff, rivers and flood inundation, and coastal erosion, as well as the human and socio-economic issues of planning, development and management.
Flood Defence Grant in Aid (FDGiA) The mechanism by which most of the funding for flood and coastal defence works in England is provided by the Government. The grants are used to cover our operating costs and to fund capital projects.
Flood dominant Stronger current on flood tide than ebb tide. Coarser sediments may be moved more by flood direction currents than ebb. The balance of net sediment transport depends on the relative strength and duration of ebb and flood currents.
Fluvial Belonging to rivers streams or ponds. e.g. Fluvial flooding, fluvial plants.
Geomorphology/ Morphology The form of the earth’s surface including the distribution of the land and water and the processes responsible for their movement.
Hard structure of rock outcrop (Hard point) Man-made feature or natural rock outcrop which acts to locally limit the natural movement of the shoreline e.g. sea wall, rock groyne.
HAT Highest Astronomical Tide. See Tide Levels.
Headland Hard feature (natural or artificial) forming local limit of longshore extent of a beach.
Hinterland The area landward of flood or coastal defences.
Hold the Line (HTL) Hold the Line. A Shoreline Management Plan policy to maintain or change the level of protection provided by defences in their present location.
Holocene An epoch of the Quaternary period, spanning the time from the end of the Pleistocene (10,000 years ago) to the present.
Hydrographic Survey A field survey carried out to map the sea bed features which affect maritime navigation, marine construction, dredging, offshore oil exploration/drilling and related disciplines.
Infrastructure The basic facilities and equipment for the functioning of the country or area, such as roads, rail lines, pipelines and power lines.
Intertidal zone The zone between the high and low water marks.
LAT Lowest Astronomical Tide. See Tide Levels.

COPYRIGHT 2013 HALCROW GROUP LTD VII
Term Definition
LiDAR Light Detection and Ranging – a method of measuring land elevations using a laser, often from a light aeroplane.
Littoral transport (drift) The movement of beach material in the littoral zone by waves and currents. Includes movement parallel (longshore drift) and perpendicular (cross-shore transport) to the shore.
LLFA Lead Local Flood Authority. Responsible body for local flood risk management in accordance with the Flood and Water Management Act (FWMA) (2010).
Managed Realignment (MR) A Shoreline Management Plan policy that allows the shoreline position to move backwards (or forwards) with management to control or limit movement.
MHWS Mean High Water Springs. See Tide Levels.
MHWN Mean High Water Neaps. See Tide Levels.
MLWN Mean Low Water Neaps. See Tide Levels.
MLWS Mean Low Water Springs. See Tide Levels.
MSL Mean Sea Level. See Tide Levels.
Mud A type of sediment containing more than 50% silt and clay size particles; may also contain sand and/or gravel and be described as sandy mud, gravelly mud etc.
Mudflats Expanses of mud which are periodically exposed at low tide, often found adjacent to saltmarshes.
NFCDD National Flood and Costal Defence Database. Database of flood defence assets developed by EA. Now being superseded by AIMS.
NTL Normal Tidal Limit. The point to which the tide reaches in an estuary, under normal conditions i.e. in absence of storm surge and with typical river flow.
Neap tide Tides over a 14 day period with lowest tidal range between high and low water.
No Active Intervention (NAI) A Shoreline Management Plan policy that assumes that existing defences are no longer maintained and will fail over time or undefended frontages will be allowed to evolve naturally.
OD Ordnance Datum - the standard reference level for Ordnance Survey maps throughout the UK from which the height of the land is measured. Currently based on mean sea level at Newlyn in Cornwall.
Partnership Funding Funding contributions for flood and coastal erosion risk management from beyond traditional flood and coastal erosion risk management budgets (e.g. Flood Defence Grant in Aid (FDGiA); the grant by which government funds its share of the costs of FCERM projects in England).
Policy Unit (PU) Sections of coastline for which a certain coastal defence management policy has been defined in the Shoreline Management Plan – see SMP.
Progradation Seaward movement of the shoreline (mean high water mark) due to sediment accumulation on a beach, dunes, delta etc.

COPYRIGHT 2013 HALCROW GROUP LTD VIII
Term Definition
Ramsar Ramsar sites are wetlands of international importance, designated under the Ramsar Convention of 1971.
Regression A seaward movement of the shoreline due to a fall in sea level.
Risk A combination of both the probability of an event occurring and the expected consequences if it does occur.
In the case of coastal change adaptation planning, risk relates to the impact and consequences of a hazard, which may be coastal erosion, coastal landsliding, coastal accretion or coastal flooding resulting in regular or permanent inundation.
Risk Management Authorities Organisations that have a key role in flood and coastal erosion risk management as defined by the Flood and Water Management Act (2010). These are the Environment Agency, lead local flood authorities, district councils where there is no unitary authority, internal drainage boards, water companies, and highways authorities.
SAC Special Area of Conservation. An area which has been given special protection under the European Union’s Habitats Directive.
Sand Sediment particles, often mainly of quartz, with a diameter of between 0.063mm and 2mm, generally classified as `fine', `medium', `coarse' or `very coarse'.
Saltmarshes An ecosystem in the mid- to high intertidal zone which is vegetated by salt-tolerant plants.
Sediment sink An area in which transported sediment is deposited and accumulates over time.
Sediment source An area from which sediment is derived and becomes available for transport to a sediment sink.
Shoreline Management Plan (SMP) A plan providing a large-scale assessment of the risk to people and to the developed, historic and natural environment associated with coastal processes. SMP2 refers specifically to the second generation SMP.
Silt Sediment particles with a grain size between 0.002mm and 0.063mm, i.e. coarser than clay particles but finer than sand.
SPA Special Protection Area. An area of land, water or sea which has been identified as being of international importance for the breeding, feeding, wintering or the migration of rare and vulnerable species of birds found within the European Union.
Spring tide Tides over a 14 day period with highest tidal range between high and low water.
SSSI Site of Special Scientific Interest (SSSI) National conservation designation given to sites of biological or geological interest in England, Wales and Scotland.
Storm surge The local change in sea level associated with a change in atmospheric pressure and/ or onshore winds. Surges may be either positive (higher than predicted astronomical sea level) or negative (lower than predicted), and typically have a duration of a few hours to a few days.

COPYRIGHT 2013 HALCROW GROUP LTD IX
Term Definition
Strategy Plan A long term documented plan for coastal management, including all necessary work to meet defined flood or coastal defence objectives for the target area. It is designed to provide the basis for decision making and action related to the provision and management of flood or coastal defences. Strategy Plans develop the policies recommended in SMPs by defining the preferred approach to shoreline management requirements over a 100 year period.
Tidal range Microtidal < 2m; Mesotidal 2m - 4m; Macrotidal >4m; Hypertidal > 8m.
Tide The rise and fall of the sea caused by the gravitational pull of the moon and sun.
Tide levels (1) High astronomical tide (HAT), lowest astronomical tide (LAT): the highest and lowest tidal levels, respectively, which can be predicted to occur under average meteorological conditions.
(2) Mean high water springs (MHWS): the height of mean high water springs is the average throughout a year of the heights of two successive high waters during those periods of 24 hours (approximately once a fortnight) when the range of the tide is greatest.
(3) Mean low water springs (MLWS): the height of mean low water springs is the average height obtained by the two successive low waters during the same periods.
(4) Mean high water neaps (MHWN): the height of mean high water neaps is the average of the heights throughout the year of two successive high waters during those periods of 24 hours (approximately once a fortnight) when the range of the tide is least.
(5) Mean low water neaps (MLWN): the height of mean low water neaps is the average height obtained by the two successive low waters during the same periods.
(6) Mean high water (MHW), mean low water (MLW): mean high/low water, as shown on Ordnance Survey Maps, is defined as the arithmetic mean of the published values of mean high/low water springs and mean high/low water neaps.
Tidal prism Volume of water entering and leaving an estuary during each tide, i.e. the difference between low water volume and high water volume.
Training walls A wall typically constructed of rubble or masonry to constrain or guide the movement of an intertidal or sub-tidal channel.
Transgression A rise in mean sea level responsible for landward movement of the shoreline.
Turbidity maximum Location of high concentration of suspended sediment in an estuary; associated with fresh / seawater mixing with vertical and horizontal salinity gradient resulting in residual vertical circulation and flocculation of suspended sediment. Location varies during the tide and with variations in river flow.
Up-drift Longshore drift is the movement of beach materials along the shore, if a location is described as up-drift; it is located further up the sediment pathway (closer to the sediment source) than an alternative area; the opposite of down-drift.
Wave Height The vertical distance between a wave crest and the next trough.
COPYRIGHT 2013 HALCROW GROUP LTD X
Executive summary The Ribble Estuary is located within Sub-cell 11b on the east side of Liverpool Bay between Southport and the Fylde Peninsula. The River Ribble rises in the Yorkshire Pennines and has a length of approximately 70 miles. It has three main tributaries (the Hodder, Calder and Darwen) upstream of the normal tidal limit and two further tributaries (the Douglas and Crossens) enter the estuary downstream of the tidal limit. The total catchment area above the mean low water mark is approximately 2,500 km2. The upper Ribble and Hodder sub-catchments are mainly rural, but the Calder, Darwen, Douglas and lower Ribble sub-catchments contain significant urban areas, including the towns of Burnley, Blackburn, Wigan and Preston.
The estuary is broadly funnel-shaped in plan, although the funnel form has been truncated towards the head by embanking and reclamation, with the result that the inner estuary has a narrow, channel-like form. It is underlain by Triassic Mercia Mudstone which is overlain by a variable thickness of Pleistocene Glacial Drift and Holocene sediments. Much of the area surrounding the Ribble Estuary consists of low hills and ridges composed of glacial till and/ or outwash sand and gravel and intervening depressions filled by alluvium, lacustrine deposits, and peat. The estuary and its extensive sand flats, mud flats and salt marshes is internationally important for migratory birds and has been designated in whole or in part as an SPA, SAC, Ramsar site, SSSI and NNR.
The tidal flats of the outer estuary are predominantly sandy, with localised accumulations of gravel (including shell material) and slightly muddy sand. Active salt marshes are extensive on both sides of the estuary and are backed by an even larger area of reclaimed marshland. Several locations have been identified as potential sites for managed realignment. One such scheme (Hesketh Out Marsh West) has been completed and covers c. 146ha. Realignment of Hesketh Out Marsh East is presently being planned.
During the last 5,000 years sea level within Liverpool Bay has been relatively stable (within +/- 1m of present). The Ribble has undergone infilling throughout the Holocene as a result of onshore transport of material within Liverpool Bay, alongshore transport towards the estuary from the adjacent open coast and pronounced flood tidal asymmetry within the estuary. A number of human modifications have exacerbated this natural tendency for infilling, including reclamation training wall construction (from the 1840s) dredge spoil dumping in the Ribble in-draught and planting and subsequent spread of Spartina. Other human interventions which have affected the estuary include sand extraction and managed realignment.
Prior to the 19th century, low water channels were largely free to migrate across the full width of the estuary. Embanking and reclamation in the inner estuary occurred as early as the 16th century, and there were further small reclamations up to 1850. Between 1850 and 1890 very large areas were reclaimed on both banks of the estuary, leading to a large reduction in tidal volume. Training walls were built in the inner estuary between 1840 and 1847 and were subsequently extended seawards, reaching Salter's Spit in the period 1932-37. This constrained the ebb flow in the main navigation channel, to create greater flood-dominant conditions on either side, and to enhance the natural tendency for the estuary to import sediment. Although the supply of sediment from the glacial till cliffs at Blackpool ceased after 1870, new sources of sand were provided after 1890 – 1900 by the onset of dune erosion at Formby Point and dumping of Mersey dredge near the Ribble in-draught. Sediment accumulation in the navigation channel presented a significant problem throughout the 20th century, especially in the outer estuary near Salter's Bank and near Preston Docks. Dredging peaked in the early 1960s and ceased shortly before the closure of the Port of Preston in 1981. Since that time the seaward end of the Navigation Channel has become blocked by movement of Salter's Bank, breaches have been created in the training walls, and ebb flows have begun to enlarge the South Gut. Left to their own devices, the banks and channels in the estuary are highly dynamic.
Sand has been extracted from the outer Ribble Estuary since at least the 1960s. Extraction from Horse Bank ceased in 2005 for commercial reasons but operations continue at Lytham.

COPYRIGHT 2013 HALCROW GROUP LTD XI
GIS analysis of marine charts and other topographic data up to 1994 has indicated that the rate of sediment infilling of the estuary between 1847 and 1904 was higher than during later periods. Virtually all of the gain in sediment occurred above LAT, and mainly between MLWN and MHWN. There was a corresponding reduction in tidal volume. No comparable assessment has been undertaken for the period since 1994, but topographic profile surveys and aerial photography suggest that the rate of sediment accretion has slowed further. This may be due to a reduction in sediment supply to the mouth of the estuary from offshore, trapping of more sediment on the open coast shore between Ainsdale and Southport, the re-establishment of larger, mobile low water channels following the cessation of dredging the closure of Albert Edward Dock at Preston in 1980; and / or the partial breakdown of the training walls which ceased to be maintained in 1969. A further sediment volumetric change study is required, using the most recent LiDAR and bathymetric data, to fully assess these changes and their possible causes.
As long as erosion of the dune frontage at Formby Point continues, there is likely to be continued longshore transport of sand towards the Ribble Estuary. Continued lowering of the foreshore south of Blackpool is also likely to be accompanied by southward littoral drift along the St Anne's frontage towards the estuary. However, the major source of sandy sediment at present appears to be the eastern Irish Sea, with a subsidiary contribution of fine sediment from the River Ribble. There are currently no grounds to believe that these sources will diminish significantly over the next 100 years but a better quantification of transport pathways and fluxes is required.
Modelling of the impacts of sea level rise within the CETaSS study indicated a general potential for increase in flood dominance and increased potential onshore transport across Cell 11, including transport towards the Fylde shoreline and Formby Point. Modelling of the impacts of sea level rise on tidal range showed amplification of the tidal range in the major estuaries. Increasing mean sea level by 0.5m resulted in maximum water levels in the inner Ribble estuary increasing by over 0.6m. While the larger tidal range would potentially increase intertidal areas, increased flood dominance with sea level rise provides a mechanism for import of additional sediment and so accretion of bed levels may negate gains from increased tidal range.
Within the Ribble estuary the long term plan in the SMP2 is to establish a balance between protection of property, key infrastructure and industries, while creating more accommodation space to allow estuarine habitats to adapt to sea level rise and climate change. The recommendation is for many existing flood defences to be maintained, but opportunities for managed realignment of present defence lines will be investigated. This may result in some loss of properties and agricultural land but this is balanced against reducing flood levels to larger communities and the need to provide compensatory natural habitats in the long term.
The SMP2 estimated that there would be around 12,200 residential and 700 non-residential properties along with 10,300ha of agricultural land at risk in the long term for a No Active Intervention (Do Nothing) approach to flood and erosion risk management. There are also industrial sites and regional critical infrastructure within the flood risk area. Within the context of flood and coastal erosion risk management across the Cell 11 estuaries, the Ribble estuary has the second highest number of properties (after the Wyre) and largest area of land at tidal flood risk, giving the estuary high priority for monitoring and further studies to inform flood risk management.

COPYRIGHT 2013 HALCROW GROUP LTD 1
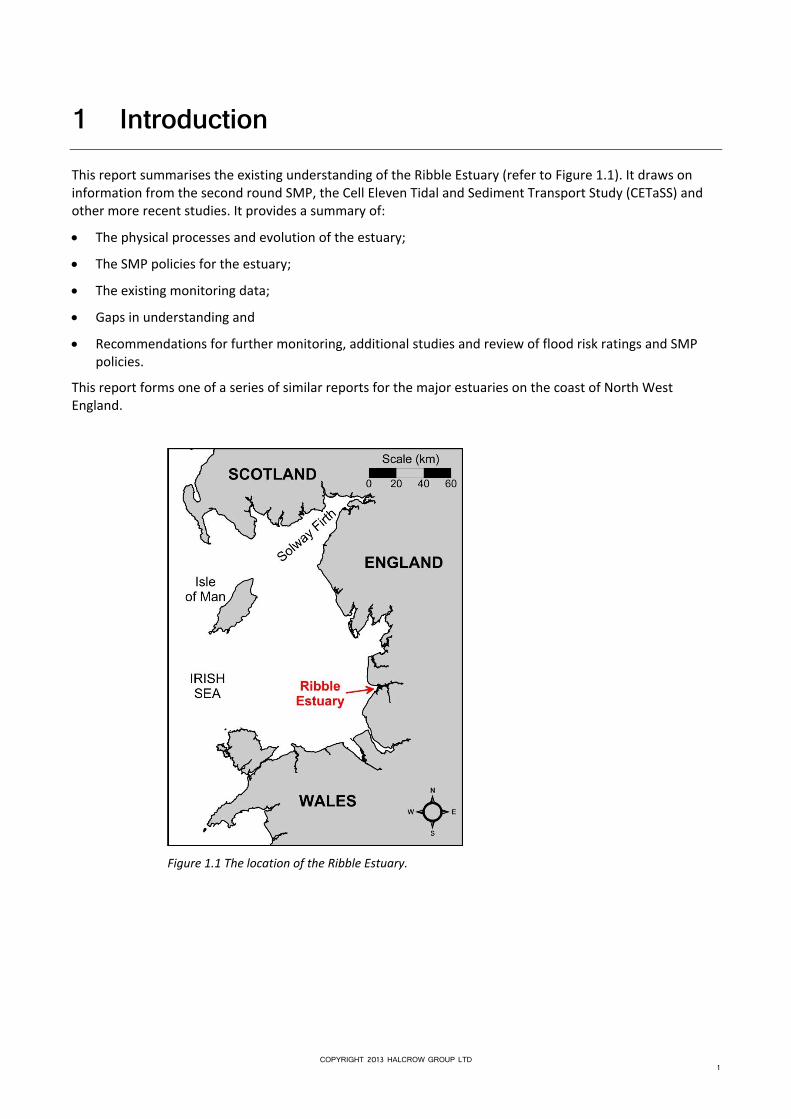
1 Introduction This report summarises the existing understanding of the Ribble Estuary (refer to Figure 1.1). It draws on information from the second round SMP, the Cell Eleven Tidal and Sediment Transport Study (CETaSS) and other more recent studies. It provides a summary of:
The physical processes and evolution of the estuary;
The SMP policies for the estuary;
The existing monitoring data;
Gaps in understanding and
Recommendations for further monitoring, additional studies and review of flood risk ratings and SMP policies.
This report forms one of a series of similar reports for the major estuaries on the coast of North West England.
Figure 1.1 The location of the Ribble Estuary.

COPYRIGHT 2013 HALCROW GROUP LTD 2
2 Coastal Setting The Ribble Estuary is located within Sub-cell 11b within Liverpool Bay and is flanked by Southport and the West Lancashire Plain to the south and Lytham St Anne’s, Blackpool and the Fylde Peninsula to the north (Figure 2.1).
Figure 2.1 Overview of Cell 11 study area, showing SMP2 sub-cell frontages (source: Halcrow, 2010c).
Ribble Estuary

COPYRIGHT 2013 HALCROW GROUP LTD 3
The River Ribble rises in the Yorkshire Pennines and has a length of approximately 70 miles (Figure 2.2). It has three main tributaries (the Hodder, Calder and Darwen) upstream of the normal tidal limit and two further tributaries (the Douglas and Crossens) enter the estuary downstream of the tidal limit. The total catchment area above the mean low water mark is approximately 2,500 km2. The upper Ribble and Hodder sub-catchments are mainly rural, but the Calder, Darwen, Douglas and lower Ribble sub-catchments contain significant urban areas, including the towns of Burnley, Blackburn, Wigan and Preston. The Ribble catchment served as the pilot basin for the development of integrated management plans in the UK within the EU Water Framework Directive (Environment Agency, 2007).
Figure 2.2 The River Ribble catchment, showing the main urban areas and general extent of the intertidal zone. Source: adapted from Ordnance Survey Open Data, after Pye & Blott (2013).

COPYRIGHT 2013 HALCROW GROUP LTD 4
3 Estuary Review
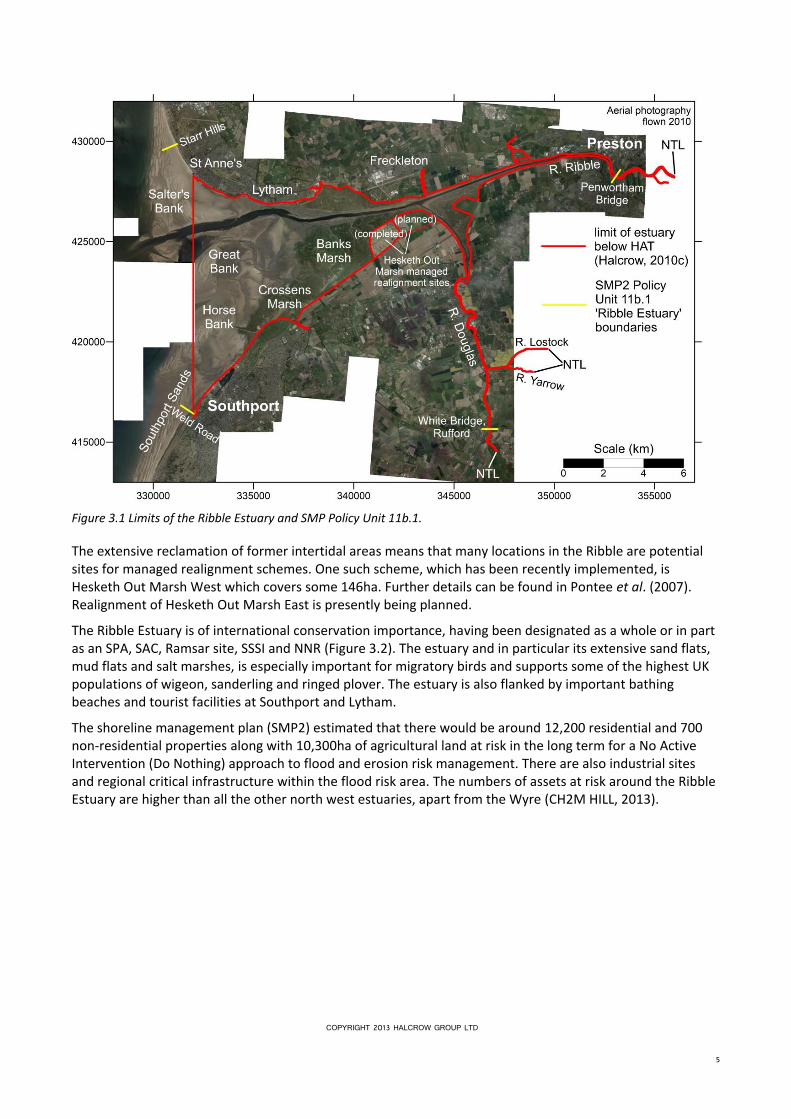
3.1 Description The Ribble estuary is broadly funnel-shaped in plan, although the funnel form has been truncated towards the head by embanking and reclamation, with the result that the inner estuary has a narrow, channel-like form. For the purposes of SMP2 policy development the estuary limits were defined by a line extending between Weld Road, Southport and Starr Hills, north of Fairhaven Lake at Lytham at the estuary mouth to the normal tidal limits near Penwortham Bridge on the River Ribble and White Bridge at Rufford on the River Douglas (Halcrow, 2010d; Figure 3.1). Due to LiDAR data limitations, slightly different boundaries were defined in the CETaSS sea level and sediment demand study (Halcrow, 2010c). At its mouth, the estuary is around 16km wide at the high water mark but narrows fairly rapidly to around 700m at Banks Marsh, after which it decreases more gradually.
The Ribble estuary is mainly underlain by Mercia Mudstone of Triassic age which is overlain by a variable thickness of Pleistocene Glacial Drift and Holocene sediments. Much of the area surrounding the Ribble Estuary is relatively low lying, consisting of low hills and ridges composed of glacial till and/ or outwash sand and gravel and intervening depressions filled by alluvium, lacustrine deposits, and peat. On the north side of the estuary is the Kirkham Moraine, a terminal moraine complex formed towards the end of the Last Glacial period. To the south of the estuary glacial drift of earlier Devensian age drapes the underlying bedrock, forming a low ridge between Banks and Hesketh Bank on the west side of the River Douglas, and continuing east of the Douglas towards Penwortham. Near Southport the glacial deposits are generally only 5-10 m thick, mostly buried below sea level and are covered by several metres of marine and estuarine alluvium, blown sand and peat. A similar Flandrian sedimentary sequence is found on the north side of the estuary in the Lytham area (Halcrow, 2010d).
The tidal flats of the outer estuary are predominantly sandy, with localised accumulations of gravel (including shell material) and slightly muddy sand. The northern shore of the outer estuary was once characterised by the development of gravel ridges, known locally as 'stanners'. Active salt marshes are extensive on both sides of the estuary and are backed by an even larger area of reclaimed marshland (Hansom et al., 1993). Marshes also extend up the River Douglas to a point just upstream of Rufford (Halcrow, 2010d).
COPYRIGHT 2013 HALCROW GROUP LTD 5
Figure 3.1 Limits of the Ribble Estuary and SMP Policy Unit 11b.1.
The extensive reclamation of former intertidal areas means that many locations in the Ribble are potential sites for managed realignment schemes. One such scheme, which has been recently implemented, is Hesketh Out Marsh West which covers some 146ha. Further details can be found in Pontee et al. (2007). Realignment of Hesketh Out Marsh East is presently being planned.
The Ribble Estuary is of international conservation importance, having been designated as a whole or in part as an SPA, SAC, Ramsar site, SSSI and NNR (Figure 3.2). The estuary and in particular its extensive sand flats, mud flats and salt marshes, is especially important for migratory birds and supports some of the highest UK populations of wigeon, sanderling and ringed plover. The estuary is also flanked by important bathing beaches and tourist facilities at Southport and Lytham.
The shoreline management plan (SMP2) estimated that there would be around 12,200 residential and 700 non-residential properties along with 10,300ha of agricultural land at risk in the long term for a No Active Intervention (Do Nothing) approach to flood and erosion risk management. There are also industrial sites and regional critical infrastructure within the flood risk area. The numbers of assets at risk around the Ribble Estuary are higher than all the other north west estuaries, apart from the Wyre (CH2M HILL, 2013).

COPYRIGHT 2013 HALCROW GROUP LTD 6
Figure 3.2 Nature conservation designations and reserves in and surrounding the Ribble Estuary.
3.2 Coastal Processes The Ribble Estuary and adjoining parts of Liverpool Bay are macrotidal, with a mean spring tidal range of approximately 8 metres (Table 3.1). Flood tidal streams approach the estuary from the southwest, while the ebb flow leaves in a more westerly direction before being deflected northwards to pass between Walney Island and the Isle of Man.
Table 3.1 Tidal levels (mOD) at Secondary Ports in and near the Ribble Estuary. Source: Admiralty Tide Tables (2012)
LAT MLWS MLWN MSL MHWN MHWS HAT
Formby nd -3.93 -2.03 0.22 2.37 4.07 4.97
Southport nd nd nd nd 2.20 4.10 5.10
Preston nd -0.80 -0.80 nd 2.40 4.40 5.40
Blackpool nd -3.90 -2.10 nd 2.10 4.00 5.00
Liverpool Bay is a shallow macro-tidal embayment with a mean spring tidal range of over 6m, which generates strong tidal currents in some areas. Liverpool Bay is characterised by onshore directed tidal residuals which drive a net onshore transport of sea bed material. This process is also thought to have occurred throughout the Holocene period and has provided material for accumulation within the various estuaries, including the Dee, Mersey and Ribble, all of which act as major sinks for both mud and sand (Halcrow, 2010b).
Sand-sized sediment is also supplied to the Ribble Estuary from the coasts to the north and south by alongshore transport (Halcrow, 2004). While some of the sand eroded from Formby Point since about 1900

COPYRIGHT 2013 HALCROW GROUP LTD 7
has found its way southwards into the Mersey Estuary, a high proportion has moved northwards and added to accretion in the Ribble Estuary (Sefton Council, 2004). However, the contribution of sediment from erosion around Formby Point to the estuary infilling is minor when compared to the total volume of material entering the estuary from the bed of the Irish Sea (van der Wal et al., 2002).
The River Ribble also carries silt and clay-size sediment in suspension into the estuary, and this settles out on the northern beaches of the Sefton coast, where there are sheltered conditions (Sefton Council, 2007).
The banks and channels of the outer estuary are a key influence on the adjacent Sefton and Fylde shorelines. The offshore banks afford protection to the adjacent open coastline, due to wave attenuation; whilst the movement of channels close to the shorelines can result in shoreline erosion. Since the cessation of dredging of the main low water estuary channel in 1979 it has become partly filled with sediment, reducing the ebb current discharge through the channel, while the former Penfold Channel has shown some enlargement, possible due to enhanced ebb flows in this area. It would be useful to do some comparative detailed modelling of the tidal flow regime using pre 1979 bathymetry and the most recent bathymetry to quantify the changes which have taken place.
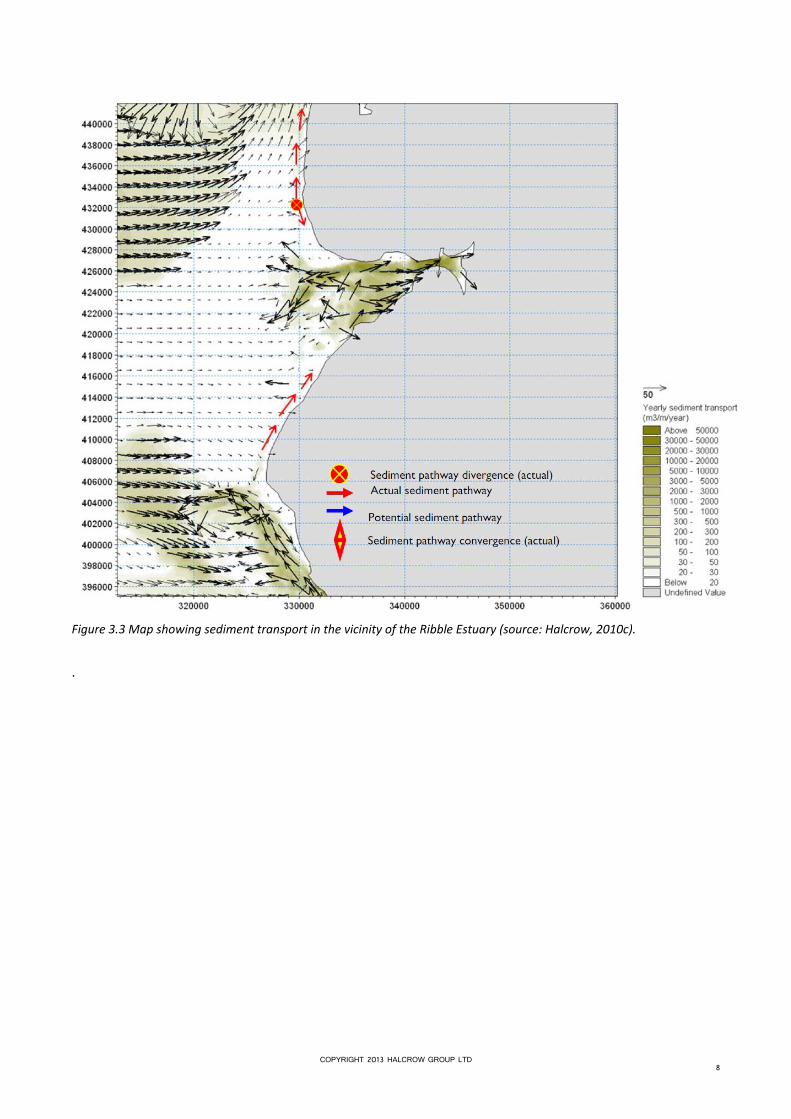
Littoral and sub-tidal annual average transport vectors based on numerical modelling are shown in Figure 3.3 (Halcrow, 2010c). The Ribble Estuary dominates nearshore sediment transport and modelling shows a general onshore transport towards the estuary mouth, reducing in magnitude from offshore to inshore. There is a potential onshore transport from the north east Irish Sea to the coast between Formby Point and Blackpool. North of Blackpool the tidally driven sediment transport is directed more parallel to the coast of the Fylde Peninsula towards Morecambe Bay (Halcrow, 2010d).
Along the Formby and Ainsdale coast, wave-driven alongshore sediment transport is directed into the Ribble Estuary as it is on the northern shore at Lytham. There is a net littoral drift divide between Lytham and Blackpool South (location varies depending on annual wave climate), from where the net littoral transport is directed north towards Cleveleys and Fleetwood. South of the drift divide the net littoral transport is directed into the Ribble Estuary (Halcrow, 2010d).
Sediment samples were collected along topographic monitoring profiles in the outer and mid estuary as part of the CERMS survey campaign 2009-10 (Figure 3.4). Most of the samples were from areas of saltmarsh and are classified as sandy silts or slightly sandy silts (Pye et al., 2010).
COPYRIGHT 2013 HALCROW GROUP LTD 8
Figure 3.3 Map showing sediment transport in the vicinity of the Ribble Estuary (source: Halcrow, 2010c).
.

COPYRIGHT 2013 HALCROW GROUP LTD 9
Figure 3.4. Gravel-Sand-Mud and Sand-Silt-Clay trigons, based on the classification of Blott & Pye (2012), for sediment samples collected within the Ribble Estuary in 2009-10 (data from Pye et al., 2010).
Ribble Estuary
% mud
30
20
10
0
40
50
60
70
80
90
100
(s)mG (m)sG
(s)gM (m)gS
smG
gsM gmS
(vg)(m)S(vg)mS(vg)sM(vg)(s)M
(g)(s)M (g)sM (g)mS (g)(m)S
gSgM
SM (vm)S
(vg)(vm)S
(vg)S
(m)SmS
(g)M
(vg)(vs)M
(vg)M
(vs)M (s)M sM
G
(s)(m)G
sGmG
(m)G (s)G
(vs)G
(vm)G (vs)(vm)G
GSM
gravelsandmud
gravellysandymuddy
gsm
(g)(s)(m)
slightly gravellyslightly sandyslightly muddy
(vg)(vs)(vm)
very slightly gravellyvery slightly sandyvery slightly muddy
Ribble Estuary
% sand
30
20
10
0
40
50
60
70
80
90
100
(si)sC (s)siC
(si)cS (s)cSI
ssiC
sicS scSI
(vc)(s)SI(vc)sSI(vc)siS(vc)(si)S
(si)(c)S (c)siS (c)sSI (s)(c)SI
cSIcS
SIS (vs)SI
(vs)(vc)SI
(vc)SI
(s)SIsSI
(c)S
(vsi)(vc)S
(vc)S
(vsi)S (si)S siS
C
(s)(si)C
siCsC
(s)C (si)C
(vsi)C
(vs)C (vs)(vsi)C
SSIC
sandsiltclay
sandysiltyclayey
ssic
(s)(si)(c)
slightly sandyslightly siltyslightly clayey
(vs)(vsi)(vc)
very slightly sandyvery slightly siltyvery slightly clayey
COPYRIGHT 2013 HALCROW GROUP LTD 10
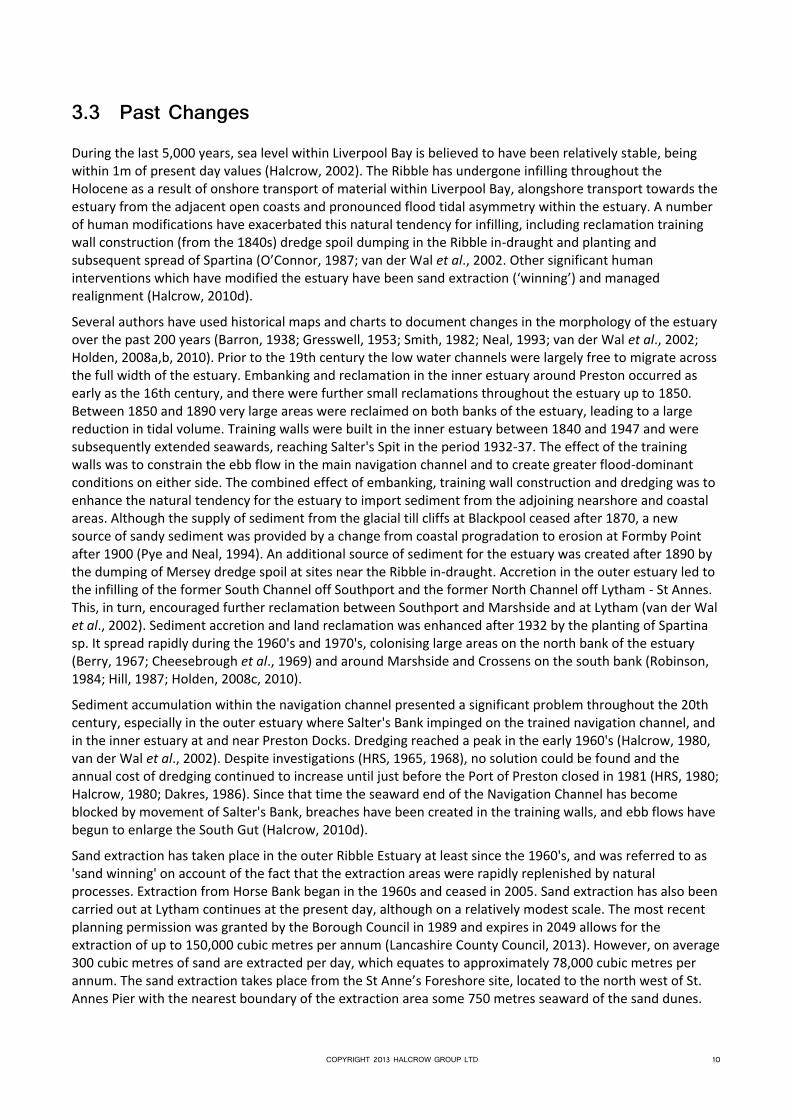
3.3 Past Changes During the last 5,000 years, sea level within Liverpool Bay is believed to have been relatively stable, being within 1m of present day values (Halcrow, 2002). The Ribble has undergone infilling throughout the Holocene as a result of onshore transport of material within Liverpool Bay, alongshore transport towards the estuary from the adjacent open coasts and pronounced flood tidal asymmetry within the estuary. A number of human modifications have exacerbated this natural tendency for infilling, including reclamation training wall construction (from the 1840s) dredge spoil dumping in the Ribble in-draught and planting and subsequent spread of Spartina (O’Connor, 1987; van der Wal et al., 2002. Other significant human interventions which have modified the estuary have been sand extraction (‘winning’) and managed realignment (Halcrow, 2010d).
Several authors have used historical maps and charts to document changes in the morphology of the estuary over the past 200 years (Barron, 1938; Gresswell, 1953; Smith, 1982; Neal, 1993; van der Wal et al., 2002; Holden, 2008a,b, 2010). Prior to the 19th century the low water channels were largely free to migrate across the full width of the estuary. Embanking and reclamation in the inner estuary around Preston occurred as early as the 16th century, and there were further small reclamations throughout the estuary up to 1850. Between 1850 and 1890 very large areas were reclaimed on both banks of the estuary, leading to a large reduction in tidal volume. Training walls were built in the inner estuary between 1840 and 1947 and were subsequently extended seawards, reaching Salter's Spit in the period 1932-37. The effect of the training walls was to constrain the ebb flow in the main navigation channel and to create greater flood-dominant conditions on either side. The combined effect of embanking, training wall construction and dredging was to enhance the natural tendency for the estuary to import sediment from the adjoining nearshore and coastal areas. Although the supply of sediment from the glacial till cliffs at Blackpool ceased after 1870, a new source of sandy sediment was provided by a change from coastal progradation to erosion at Formby Point after 1900 (Pye and Neal, 1994). An additional source of sediment for the estuary was created after 1890 by the dumping of Mersey dredge spoil at sites near the Ribble in-draught. Accretion in the outer estuary led to the infilling of the former South Channel off Southport and the former North Channel off Lytham - St Annes. This, in turn, encouraged further reclamation between Southport and Marshside and at Lytham (van der Wal et al., 2002). Sediment accretion and land reclamation was enhanced after 1932 by the planting of Spartina sp. It spread rapidly during the 1960's and 1970's, colonising large areas on the north bank of the estuary (Berry, 1967; Cheesebrough et al., 1969) and around Marshside and Crossens on the south bank (Robinson, 1984; Hill, 1987; Holden, 2008c, 2010).
Sediment accumulation within the navigation channel presented a significant problem throughout the 20th century, especially in the outer estuary where Salter's Bank impinged on the trained navigation channel, and in the inner estuary at and near Preston Docks. Dredging reached a peak in the early 1960's (Halcrow, 1980, van der Wal et al., 2002). Despite investigations (HRS, 1965, 1968), no solution could be found and the annual cost of dredging continued to increase until just before the Port of Preston closed in 1981 (HRS, 1980; Halcrow, 1980; Dakres, 1986). Since that time the seaward end of the Navigation Channel has become blocked by movement of Salter's Bank, breaches have been created in the training walls, and ebb flows have begun to enlarge the South Gut (Halcrow, 2010d).
Sand extraction has taken place in the outer Ribble Estuary at least since the 1960's, and was referred to as 'sand winning' on account of the fact that the extraction areas were rapidly replenished by natural processes. Extraction from Horse Bank began in the 1960s and ceased in 2005. Sand extraction has also been carried out at Lytham continues at the present day, although on a relatively modest scale. The most recent planning permission was granted by the Borough Council in 1989 and expires in 2049 allows for the extraction of up to 150,000 cubic metres per annum (Lancashire County Council, 2013). However, on average 300 cubic metres of sand are extracted per day, which equates to approximately 78,000 cubic metres per annum. The sand extraction takes place from the St Anne’s Foreshore site, located to the north west of St. Annes Pier with the nearest boundary of the extraction area some 750 metres seaward of the sand dunes.

COPYRIGHT 2013 HALCROW GROUP LTD 11
Access to the site is from a compound and storage area at Clifton Drive, St. Annes. Although the total amount of sand removed from the Ribble is significant, it has not not stopped the trend for estuary infilling (Halcrow, 2010d).
Based on quantitative assessment of marine charts and other topographic data using GIS, van der Wal et al. (2002) concluded that the rate of sediment infilling of the estuary between 1847 and 1904 was higher than during later periods. Virtually all of the gain in sediment occurred above the level of LAT, and mainly between MLWN and MHWN. There was a corresponding reduction in tidal volume, notably between 1847 and 1904. No comparable assessment has been undertaken for the period since 1994, but there is some evidence from topographic profiles and aerial photography that the rate of sediment accretion has slowed further. The reasons for this are uncertain, but could include:
a reduction in sediment supply to the mouth of the estuary from offshore
trapping of more sediment on the open coast shore between Ainsdale and Southport
the re-establishment of larger, mobile low water channels following the cessation of dredging the closure of Albert Edward Dock at Preston in 1980; and
the partial breakdown of the training walls which ceased to be maintained in 1969
Evidence from topographic surveys and analysis of sediment cores indicates that rates of vertical accretion on individual marshes in the Ribble have historically been high (Halcrow, 2010d), and rapid vertical accretion continues to occur on the younger marshes which are still relatively low within the tidal frame.
A priority for new research should be to carry out a new sediment volumetric change study using the most recent LiDAR and bathymetry, and to compare the results with the last assessment; the study should also consider the causes of change. Analysis should also be undertaken to update the sediment accretion estimates for the marshes and intertidal areas using the most recent bathymetric survey and LiDAR data.
3.4 Future behaviour As long as erosion of the dune frontage at Formby Point continues there is likely to be continued longshore transport of sand north towards Southport and the Ribble Estuary. Continued lowering of the foreshore south of Blackpool is also likely to be accompanied by southward littoral drift along the St Anne's frontage towards the mouth of the estuary. However, the major source of sandy sediment at present appears to be the sea bed of the eastern Irish Sea, and the main source of mud is provided by the suspension load of Irish Sea waters, with a subsidiary contribution from the River Ribble and its tributaries. There are currently no grounds to believe that these sources will diminish significantly over the next 100 years (Halcrow, 2010d).
Modelling of the impacts of sea level rise within the CETaSS study (Halcrow, 2010i) indicated a general potential for increase in flood dominance and increased potential onshore transport across Cell 11, including transport towards the Fylde shoreline and Formby Point. Modelling of the impacts of sea level rise on tidal range also reported in Halcrow (2010i) showed amplification of the tidal range in the major estuaries. Increasing mean sea level by 0.5m resulted in maximum water levels in the inner Ribble Estuary increasing by over 0.6m. While the larger tidal range would potentially increase intertidal areas, increased flood dominance with sea level rise provides a mechanism for import of additional sediment and so accretion of bed levels may negate gains from increased tidal range.

COPYRIGHT 2013 HALCROW GROUP LTD 12
3.5 Conceptual Model of Estuary Behaviour A simple conceptual model for the Cell 11a area, showing sediment transport pathways, control features and sediment sources and stores is provided in Figure 3.5. A more detailed diagram has been developed for the Ribble Estuary and is shown in Figure 3.6.
The estuary is strongly flood-dominant and this explains the net import of sediment that has occurred over time (Halcrow, 2010b). There is a tendency for the flood and ebb flows to favour discrete channels, with the flood flow occurring preferentially in the Penfold Channel on the southern side of the estuary and the ebb flow occurring preferentially in the former Navigation Channel and South Gut towards the north side of the estuary. Previous studies have suggested that tidal pumping, especially during high storm surges, is the most import process by which sediment is introduced into the estuary (e.g. Lyons, 1997).
The orientation of the estuary mouth is such that waves are able to propagate into the estuary; however, the presence of the sand banks helps attenuate waves. Wave action is therefore most significant in the wider outer reaches of the estuary, and less significant in the narrow, more sheltered inner reaches (Pye and van der Wal, 2000a). Van der Wal et al. (2002) suggested that storm conditions may enhance sedimentation rates within the estuary. The estuary is susceptible to storm surges induced by low pressure atmospheric systems. Surges are capable of significantly increasing current speeds by up to 0.6m/s (ABP Research, 2001; Halcrow, 2010b). Modelling of the January 2007 storm surge in the CETaSS project (Halcrow, 2010i) found that the surge tended to enhance the general onshore transport of sediment experienced when compared with the case without a surge. This is due to a combination of increased bed shear stresses due to larger currents as well as a larger volume of water entering the estuaries during the surge. Additionally it was shown that the effect of strong storm winds upon the water surface can provide a northerly directed flow and associated transport across the mouth of the Ribble Estuary. This could potentially provide an additional mechanism for providing sediment to the Blackpool frontage.
Like other nearby estuaries, the low water channels in the Ribble display a natural tendency to meander. These channels have been heavily trained since the 1840s to limit this meandering and improve navigability. Construction of the training walls along both sides of the main navigation channel s created an almost straight low water channel all the way up the estuary (Barron, 1983).. The Douglas tributary has also been trained, and other than a very slight curvature, is again almost straight from the confluence with the Ribble south to Beconsall Marsh (Halcrow, 2010b).
The Ribble Estuary receives fresh water inputs from the Rivers Ribble, Darwen and Douglas; the freshwater inputs are strongly seasonal and are small compared to the average tidal inflow of 12,000m3/s on a spring tide (Shaw, 1975; cited in van der Wal et al., 2002). However, these freshwater flows may be more important in the upper reaches of the estuary where extreme freshwater discharges can exceed the tidal prism locally (Halcrow, 2010c). There is a turbidity maximum between the Douglas / Ribble confluence and Penwortham.
Halcrow (2010e) undertook detailed hydrodynamic and sediment transport modelling of the Ribble Estuary. The work showed that the impact of the estuary upon tidal flows is felt approximately 5km offshore from the mouth due to the large volume which ebbs and floods into it. The hydrodynamic modelling in this study indicated that maximum high water levels increase slightly between the estuary mouth and Warton Bank, then decrease slightly up to the confluence of the Douglas and the Ribble before increasing sharply again within the narrow channelized section of the inner estuary, reaching a maximum elevation near Penwortham Bridge. However, comparison with synoptic measurements at EA tide gauges within the estuary were not made in this study.
The modelling work also showed that the mouth of the estuary behaves as a sink for sand sized sediment due to the convergence of sediment pathways from two sources: (1) from offshore in the north east Irish Sea the net potential sediment transport is directed onshore, into the Ribble; and (2) from within the middle reaches of the estuary the net potential transport for coarser, non-cohesive sediment is directed out of the estuary. This modelling shows the mechanism for formation of sand banks at the mouth, but actual sand

COPYRIGHT 2013 HALCROW GROUP LTD 13
sized sediment transport seaward from the middle estuary will in practice be limited by supply. The modelling did not investigate fine or cohesive sediment transport or the impact of salinity driven gravitational circulation on the import of sediment.
There is a small volume of sediment transported towards the estuary from the north and south in the littoral zone. These pathways all converge in the mouth of the Ribble where there are large areas of intertidal sand banks. There is believed to be little sediment bypassing the estuary as the mouth acts as a strong sink. However, modelling of the 2007 surge (Halcrow, 2010i) indicated that sediment could be moved northwards across the mouth under particular storm conditions. Within the estuary the main channel west of the Douglas is ebb dominant in terms of the net potential transport of sand-sized sediment (but flood dominant in terms of current speed); this changes upstream of the confluence with the Douglas where the inner estuary becomes flood dominant (in terms of net potential transport direction and current speed) and imports sand-sized sediment (Halcrow, 2010e).
The tendency for net movement of sediment into the estuary from Liverpool Bay has been supported by recent studies of particle size trends (Pye et al., 2010a,b), and by airborne remote sensing investigations over flood and ebb tidal cycles (Wakefield et al., 2011). Preliminary work to identify sediment source –sink linkages in the Liverpool Bay - Ribble Estuary area using mineral magnetic signatures has been reported by Holden et al. (2011), but the results are inconclusive.
The outer and middle Ribble Estuary is sand dominated, especially in the mid and lower intertidal zone and in the sub-tidal zone. The higher intertidal zone is also sand dominated between Southport and Marshside, and between Starr Hills and Lytham, but becomes increasingly muddy further into the estuary. Localised accumulations of gravel occur on the upper beach at Lytham and gravel-sized shell deposits occur on the upper beach between Southport pier and Marshside.

COPYRIGHT 2013 HALCROW GROUP LTD 14
Figure 3.5 A simple conceptual model for the Cell 11b area (source: Halcrow, 2010d)

COPYRIGHT 2013 HALCROW GROUP LTD 15
Figure 3.6. Conceptual diagram showing the main sediment sources, geomorphological features and engineering structures which influence the morphology of the Ribble Estuary.
3.6 Coastal Defences and SMP policies A list of the coastal defences in the Ribble Estuary from the SMP2 is provided in Appendix A (Halcrow, 2010a). The long term vision for the areas at the mouth of the estuary, Southport to the south and Lytham to the north, is to continue to manage risks to the towns and their associated facilities, but achieving this as far as possible through maintaining the naturally functioning systems with minimal interventions. The nature of these systems suggests that this approach can be justified on social, economic and environmental grounds (Halcrow, 2010a).

COPYRIGHT 2013 HALCROW GROUP LTD 16
Within the Ribble and Douglas estuaries the long term plan is to establish a balance between protection of property, key infrastructure and industries, while creating more accommodation space where possible within the estuary systems. Consequently the recommended plan is for many existing flood defences to be maintained, but opportunities for managed realignment of present defence lines will be investigated. This may result in some loss of properties and agricultural land but this is balanced against reducing flood levels to larger communities and the need to provide compensatory natural habitats in the long term (Halcrow, 2010a).
The adopted SMP2 policies are shown on the maps in Figure 3.7.

COPYRIGHT 2013 HALCROW GROUP LTD 17

COPYRIGHT 2013 HALCROW GROUP LTD 18

COPYRIGHT 2013 HALCROW GROUP LTD 19
Figure 3.7 Shoreline Management Plan (SMP2) Policy Units and adopted policies (Halcrow 2010a)
COPYRIGHT 2013 HALCROW GROUP LTD 20
3.7 Existing Monitoring Data Details of the monitoring data being collected for the Ribble Estuary and an assessment of the value that this data brings are summarised in Table 3.2. The map in Figure 3.8 shows the location of beach profiles and data collection stations in the Ribble. Table 3.2 Existing monitoring data collected and value assessment.
Description of monitoring data collected Assessment of value of data collection Reference to further information
LiDAR data. The Cell 11 coastline was flown during 2008 to 2010, with additional datasets collected during 2010/2011 which focused on sand banks around the Ribble Estuary.
Useful for monitoring changes in the estuary coastline and sandbanks overtime. Particularly important to asses sediment movements and these contribute to coastal change. This information can be used to inform coastal management decision making.
CERMS Update Report, Section 2.3.3 (Halcrow, 2010g).
Blackpool & Fylde Local Coastal Processes Report 2009/2010 (Capita Symonds, 2011).
Beach profile data. Beach profiles cover the north and south banks of the Ribble Estuary close to the mouth.
Beach monitoring ensures that coastal managers have an understanding of the changes occurring on the coastline and can take pro-active rather than re-active approaches to management.
CERMS Update Report, Section 2.4.2 (Halcrow, 2010g).
Blackpool & Fylde Coastal Process Report
2012 Update (Capita Symonds, 2012).
Blackpool & Fylde Local Coastal Processes Report 2009/2010 (Capita Symonds, 2011).
Hydrographic surveys (MLWN to 3km offshore). In 2010 12 hydrographic lines were scanned using a swath scanner across the mouth of the Ribble Estuary.
Inter-tidal profiles help to inform beach monitoring, bringing an understanding of cross-shore processes and sediment movement.
CERMS Update Report, Section 2.3.7 (Halcrow, 2010g).
Blackpool & Fylde Coastal Process Report
2012 Update (Capita Symonds, 2012).
Blackpool & Fylde Local Coastal Processes Report 2009/2010 (Capita Symonds, 2011).
Bathymetric Survey Report (Halcrow, 2011).
Tide gauge 1 (Crossens PS), located on the south bank towards the mouth of the estuary.
Owned by Environment Agency NW.
Captures pressure.
Digital data is available from 11/07/2003 04/08/2009.
Useful, in combination with the other gauges for looking at within estuary variations in water levels, with and without storm surges; for comparison with water levels at the Class A gauges; for calibrating and verifying mathematical models; and for feeding real time data into flood forecasting models.
CERMS Tide Gauge Review (Halcrow, 2010h).

COPYRIGHT 2013 HALCROW GROUP LTD 21
Description of monitoring data collected Assessment of value of data collection Reference to further information
Tide gauge 2 (Dock Bridges PS), located on the south bank towards the mouth of the estuary.
Owned by Environment Agency NW.
Captures pressure.
The period of data availability is unknown.
Useful, in combination with the other gauges for looking at within estuary variations in water levels, with and without storm surges; for comparison with water levels at the Class A gauges; for calibrating and verifying mathematical models; and for feeding real time data into flood forecasting models.
CERMS Tide Gauge Review (Halcrow, 2010h).
Tide gauge 3 at Penwortham (near Preston), located upstream in the estuary operated by Environment Agency NW.
Captures water level, however, it should be noted that the gauge goes dry or nearly dry at times of low tide and low flow. Therefore it only measures high / extreme tide levels, so the data cannot be used to look at low tide levels or mean sea level.
Data collection from this gauge is available from July 2003 to present.
Useful for monitoring long-term trends in water level (particularly extreme water levels and any sea level rise) and use in hydrodynamic modelling and overtopping calculations, which can then be used for the purpose of flood forecasting.
CERMS Update Report, Section 2.4.2 (Halcrow, 2010g).
CERMS Tide Gauge Review (Halcrow, 2010h).
Environment Agency website:
Figure 3.8 Summary of available monitoring data for the Ribble Estuary. Tide gauges located at: (1) Crossens; (2) Penwortham; and (3) Dock Bridges (all operated by the EA).

COPYRIGHT 2013 HALCROW GROUP LTD 22
3.8 Gaps in Understanding In Cell 11 a number of previous reports have identified gaps in understanding, including issues and uncertainties related to coastal and estuarine processes and shoreline management. Some of the uncertainties identified in the earlier studies (e.g. SMP1, Futurecoast) were subsequently addressed by the later studies (e.g. CETaSS, SMP2, CERMS; EA, 2011). The CERMS regional baseline understanding report (Halcrow, 2010b) provided a full listing of previous uncertainties in the Cell 11 area.
For the present report we have reviewed the list of uncertainties previously identified for the Ribble Estuary and have identified the most important areas where future studies/monitoring are required (Table 3.3). We have organised these by thematic areas:
Flood and coastal defences
Habitat losses and creation
Coastal and estuary morphodynamics
Port developments
Water quality
Data collation
In the context of the other estuaries in Cell 11, the Ribble has been studied in more detail and more recently than most of the others.
Due to the strong linkages between coastal processes in the whole of Liverpool Bay and the Ribble Estuary, the issues and recommendations listed below should be considered alongside the wider issues and generic recommendations for the other Cell 11 estuaries. This is considered within the main overarching report (CH2M Hill, 2013).
In Appendix B further information is provided on the outline scope of recommended studies and monitoring. We have also noted where these actions might be best undertaken by the CERMS group or by other parties.
The generic gaps and recommendations considered in the accompanying overview report for the NW estuaries (CH2M Hill, 2013) should also be considered alongside those described below in Table 3.3.

COPYRIGHT 2013 HALCROW GROUP LTD 23
Table 3.3 Data gaps and recommendations
Issue Location Comments Recommendations
Flood and coastal defences
Defence condition, ownership and maintenance data require review. (SMP Action Plan ref 5.1)
Whole estuary The defence data in Appendix A is taken from the SMP2 and was based on a number of previous studies of the estuary.
1. Update defence database to have a consistent data set to inform estuary strategy and next SMP review. (see item 1 in Appendix B)
Urgency – high
Importance – medium
Difficulty – low
Overall Priority - high
Flood and coastal defences
Management of defences and delivery of SMP2 policies. (SMP Action Plan ref 1.1, 2.5, 2.7, 2.8, 3.1)
Whole estuary, with focus on 11b1.3 to 11b1.13 (Crossens to Naze Point)
The SMP2 Action Plan recommends undertaking estuary wide studies to investigate various Managed Realignment opportunities and constraints in line with medium to long term policy and to develop a strategy plan for the implementation of MR where practicable to create a more sustainable defence alignment. The strategy will need a coastal processes and habitats study; stakeholder consultation, more detailed economic appraisal; consideration of options for adapting paths and rights of way to coastal change.
2. In order to progress the strategy development studies in accordance with SMP2 action plan the morphodynamics studies of sediment provenance and modelling (see item 7 in Appendix B) need to be completed first.
Urgency – medium
Importance – medium
Difficulty – high
Overall Priority - medium
Flood and coastal defences
Land drainage outfalls fronted by accreting saltmarsh.
Whole estuary There is a need to assess options for intervention to manage land drainage in areas where saltmarsh accretion causes problems at outfalls that are in the environmentally designated sites. This is also an issue for locations in other estuaries and Morecambe Bay.
3. A study of options including consultation with Natural England to develop consistent approaches and best practice techniques. As the problem exists in many estuaries in the NW it should be progressed as a regional rather than estuary specific study. (see item 3 in Appendix B)
Urgency – high
Importance – high
Difficulty – high
Overall Priority - high
Flood and coastal defences
Tidal levels, including extreme water levels and flood forecasting
Tide gauges at Crossens, Dock Bridge and Penwortham
There was limited data available for the previous tide gauge review in 2009 and concurrent data were not available to calibrate the CETaSS models in the Ribble.
4. Analysis of available data from the 3 tide gauges should be undertaken to determine reliability and value, including confirmation of suspected variations in high water levels along the estuary. (item 4 in Appendix B)
Urgency – medium

COPYRIGHT 2013 HALCROW GROUP LTD 24
Issue Location Comments Recommendations
Importance – high
Difficulty – low
Overall Priority - high
Coastal and estuary morphodynamics
Swath bathymetry and LiDAR surveys.
Estuary and adjacent coast
The outer Ribble Estuary is relatively well covered by topographic and bathymetric survey lines but there are currently no profiles in most of the middle and inner estuary (Figure 3.8). The intertidal zone above mean sea level has good LiDAR coverage, but the lower parts of the outer estuary have been missed in previous surveys. No recent bathymetric data for the low water channel within the estuary are available.
5. Undertake detailed swath bathymetric survey to provide good baseline. Survey should be accompanied by near concurrent LiDAR survey extending to low water.
Repeating LiDAR surveys every 3 years is probably adequate. They should be carried out on low spring tides to ensure that as much of the intertidal zone is covered as possible, and should extend from the mouth of the estuary to the tidal limits, ensuring that all potential MR areas are included.
The frequency for repeat bathymetry surveys should be reviewed in future; 5 to 10 years may be sufficient with erosion or accretion hot spots more frequent than more stable sections. (See item 5 in Appendix B)
Urgency – high
Importance – medium
Difficulty – medium
Overall Priority - high
Coastal and estuary morphodynamics
Topographic and bathymetric profiles
Outer estuary There is incomplete coverage of the area – survey area needs extending to include gaps. Swath bathymetry and LiDAR would be better than profiles as they allow more accurate analysis and comparisons. However, profiles may be a cheaper and adequate alternative for monitoring hotspots in between less frequent full surveys.
6. Once the full swath bathymetry and LiDAR baseline survey in above item has been completed, review data for previous survey profiles against LiDAR and prioritise the need for and frequency of future profile surveys. (See item 6 in Appendix B)
Urgency – low
Importance – medium
Difficulty – low
Overall Priority - low
(undertake after item 4)
Coastal and estuary morphodynamics
Sediment data gaps and analysis of data for sediment source – sink linkages confirmation.
Whole estuary Sediment data are available for the higher intertidal areas in the outer estuary but the mid-intertidal, lower intertidal and sub-tidal areas have not been sampled as part of CERMS. There is also a lack of information for the mid and inner estuary (both intertidal and subtidal).
A fuller coverage of data will enable comparative analysis of samples to confirm sediment pathways. One
7. Undertake sediment sampling to gather and analyse baseline data. Analysis to include mineralogical and chemical fingerprinting The new data will allow analysis to identify / confirm the sediment source – sink linkages and inform future predictions of response to sea level rise and FCERM management changes.
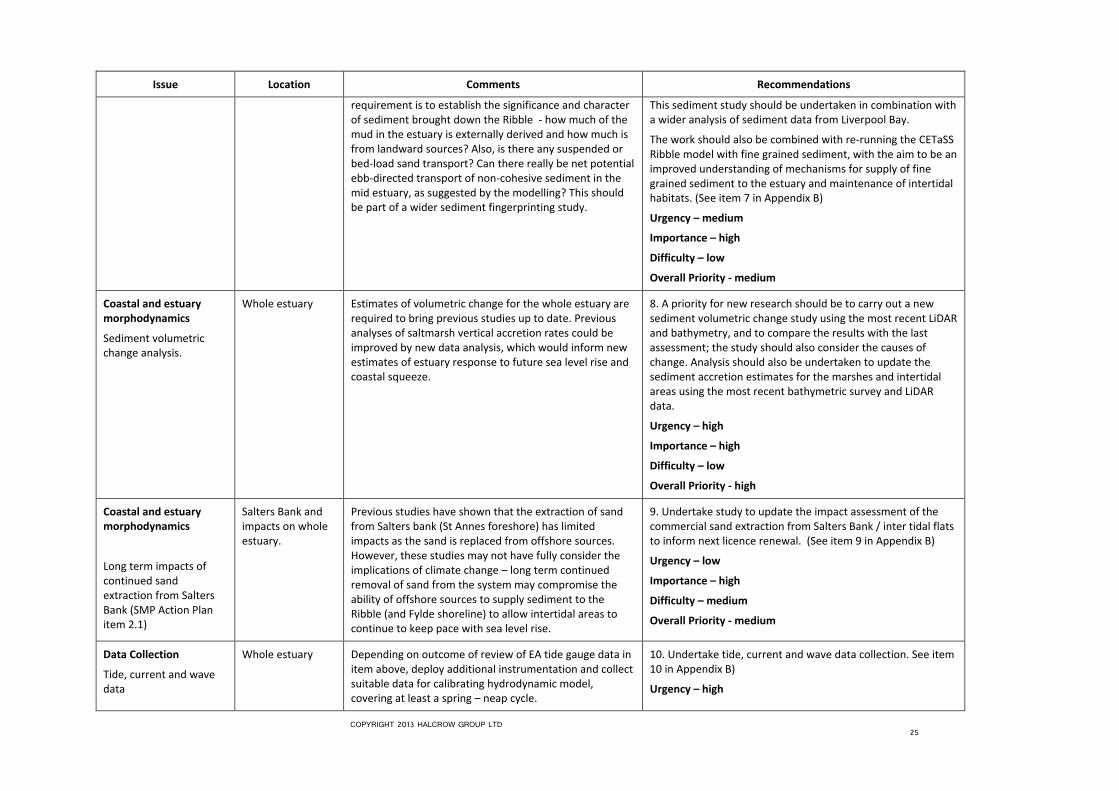
COPYRIGHT 2013 HALCROW GROUP LTD 25
Issue Location Comments Recommendations
requirement is to establish the significance and character of sediment brought down the Ribble - how much of the mud in the estuary is externally derived and how much is from landward sources? Also, is there any suspended or bed-load sand transport? Can there really be net potential ebb-directed transport of non-cohesive sediment in the mid estuary, as suggested by the modelling? This should be part of a wider sediment fingerprinting study.
This sediment study should be undertaken in combination with a wider analysis of sediment data from Liverpool Bay.
The work should also be combined with re-running the CETaSS Ribble model with fine grained sediment, with the aim to be an improved understanding of mechanisms for supply of fine grained sediment to the estuary and maintenance of intertidal habitats. (See item 7 in Appendix B)
Urgency – medium
Importance – high
Difficulty – low
Overall Priority - medium
Coastal and estuary morphodynamics
Sediment volumetric change analysis.
Whole estuary Estimates of volumetric change for the whole estuary are required to bring previous studies up to date. Previous analyses of saltmarsh vertical accretion rates could be improved by new data analysis, which would inform new estimates of estuary response to future sea level rise and coastal squeeze.
8. A priority for new research should be to carry out a new sediment volumetric change study using the most recent LiDAR and bathymetry, and to compare the results with the last assessment; the study should also consider the causes of change. Analysis should also be undertaken to update the sediment accretion estimates for the marshes and intertidal areas using the most recent bathymetric survey and LiDAR data.
Urgency – high
Importance – high
Difficulty – low
Overall Priority - high
Coastal and estuary morphodynamics
Long term impacts of continued sand extraction from Salters Bank (SMP Action Plan item 2.1)
Salters Bank and impacts on whole estuary.
Previous studies have shown that the extraction of sand from Salters bank (St Annes foreshore) has limited impacts as the sand is replaced from offshore sources. However, these studies may not have fully consider the implications of climate change – long term continued removal of sand from the system may compromise the ability of offshore sources to supply sediment to the Ribble (and Fylde shoreline) to allow intertidal areas to continue to keep pace with sea level rise.
9. Undertake study to update the impact assessment of the commercial sand extraction from Salters Bank / inter tidal flats to inform next licence renewal. (See item 9 in Appendix B)
Urgency – low
Importance – high
Difficulty – medium
Overall Priority - medium
Data Collection
Tide, current and wave data
Whole estuary Depending on outcome of review of EA tide gauge data in item above, deploy additional instrumentation and collect suitable data for calibrating hydrodynamic model, covering at least a spring – neap cycle.
10. Undertake tide, current and wave data collection. See item 10 in Appendix B)
Urgency – high
COPYRIGHT 2013 HALCROW GROUP LTD 26
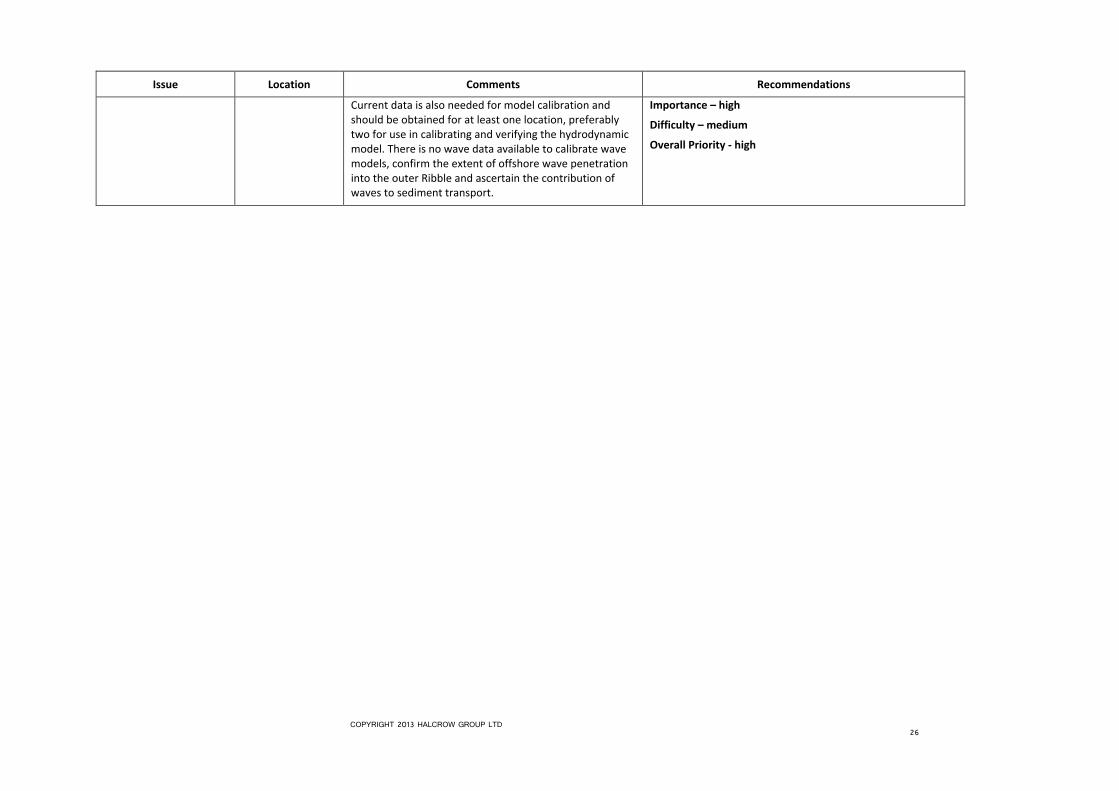
Issue Location Comments Recommendations
Current data is also needed for model calibration and should be obtained for at least one location, preferably two for use in calibrating and verifying the hydrodynamic model. There is no wave data available to calibrate wave models, confirm the extent of offshore wave penetration into the outer Ribble and ascertain the contribution of waves to sediment transport.
Importance – high
Difficulty – medium
Overall Priority - high

COPYRIGHT 2013 HALCROW GROUP LTD 27
4 Discussion and Conclusions Within the context of flood and coastal erosion risk management across the Cell 11 estuaries, the Ribble Estuary has the second highest number of properties and highest area of land at tidal flood risk, giving the estuary high priority for monitoring and further studies to inform flood risk management.
Fylde Borough Council, in association with Blackpool Council and the Environment Agency has recently put a strategy in place for managing tidal flood risk on the north bank of the outer estuary, from Starr Hills sand dunes through to Naze Point near Warton. There is no formal strategy covering management of defences in the rest of the estuary and the SMP2 Action Plan recommends that one is developed.
The SMP2 long term policies for the Ribble anticipate managed realignment to significant lengths of defences over the short, medium and long term. Delivery of these policies poses risks related to uncertainty in coastal and estuarine processes with potential for impacts on the wider estuary morphology, the important conservation sites and the overall management of flood risk to the properties and land around the estuary. In order to manage the risks and deliver the policies in a managed way the SMP2 Action Plan proposes the development of a strategy for the estuary, supported by a number of specific studies for particular frontages or known issues. Most of these studies will require new or improved coastal process and monitoring data. This review of estuary processes and available data has therefore recommended a number of further studies building on recommendations in the SMP2 action plan. A number of additional studies are recommended to address the gaps in understanding identified or uncertainties in the conceptual understanding. Details of the issue/ uncertainty, the source, nature and purpose of recommended studies, including their priority, are presented in Table 3.3. Further details on specific recommendations are given in Appendix B. These recommendations should also be considered alongside the generic recommendations made in the overview report (CH2M Hill, 2013).
It is important to note that there is significant dependency between some of the recommended studies and so they need to be undertaken in a managed and ordered way. For example the LiDAR and bathymetry surveys need to be specified to ensure full coverage without gaps. The single digital ground model from these surveys can then be used to update the numerical models.

COPYRIGHT 2013 HALCROW GROUP LTD 28
5 References ABP Research, 2001. Futurecoast – West coast process review, Start Point to River Eden. Report produced for Halcrow as part of the Futurecoast Study.
Barron, J., 1983. History of the Ribble Navigation from Preston to the Sea. Corporation of Preston. Published by Guardian Press, Fishergate.
Berry, W.G., 1967. Saltmarsh development in the Ribble Estuary. In Steel, R.W. & Lawton, R. (eds.) Liverpool Essays in Geography - A Jubilee Collection. Longmans, London, 122-135pp.
Blott, S.J. and Pye, K., 2012. Particle size scales and classification of sediment types based on size distributions: review and recommended procedures. Sedimentology 59, 2071-2096.
Capita Symonds, 2012. Blackpool & Fylde Coastal Process Report. 2012 Update. Report produced by Capita Symonds for Blackpool Council, Fylde Council, March 2013.
Capita Symonds, 2011. Blackpool & Fylde Local Coastal Processes Report 2009/2010. Report produced by Capita Symonds for Blackpool Borough Council, April 2011.
Cheesebrough, C.E., Oldfield., F. and Pringle, A.W., 1969. The Lytham St Anne's Foreshore. Report to Lytham St Anne's Corporation by the Department of Environmental Sciences, Lancaster University.
Dakres, J., 1986. The Last Tide. A History of the Port of Preston 1806-1981. Carnegie Press, Preston, 326pp.
Environment Agency, 200.7.Managing the Water Environment Together. Integrated Catchment Plan for the Ribble. Environment Agency, South Preston.
Gresswell, R.K., 1937. The geomorphology of the South-west Lancashire coastline. Geographical Journal 40, 335-349pp.
Halcrow, 1980. Effects of Proposed Cessation of Maintenance Dredging in the Navigation Channel of the River Ribble. Report produced by Sir William Halcrow & Partners for Preston Borough Council.
Halcrow, 2002. Futurecoast. CD produced as part of the Futurecoast project for Defra.
Halcrow, 2003a. Ribble Estuary Study. Ribble Natural Processes Baseline and Condition of Defences Report. Report produced by Halcrow for the Environment Agency, May 2003, 55pp + Figures.
Halcrow, 2003b. Ribble Estuary Study. Technical Modelling Report. Report produced by Halcrow for the Environment Agency.
Halcrow, 2003c. Ribble Estuary Study. Upper Ribble Estuary Shoreline Management Plan. Report produced by Halcrow for the Environment Agency.
Halcrow, 2004. Ribble Estuary Managed Realignment Study. Report produced by Halcrow for the Environment Agency, July 2004, 69pp + Figures.
Halcrow, 2010a. North West England and North Wales Shoreline Management Plan SMP2. Annex 1 - Policy Statements – Ribble Estuary. Report prepared by Halcrow Group Ltd for the North West and North Wales Coastal Group, February 2011, 13pp.
Halcrow, 2010b. North West England and North Wales Shoreline Management Plan SMP2. Appendix C – Baseline Process Understanding. Report prepared by Halcrow Group Ltd for the North West and North Wales Coastal Group, February 2011, 58pp + Tables + Figures.
Halcrow, 2010c. North West England and North Wales Shoreline Management Plan SMP2. Supporting Studies. Cell Eleven Tide and Sediment Transport Study (CETaSS) Phase 2 (ii). Main Report – Summary of

COPYRIGHT 2013 HALCROW GROUP LTD 29
Findings. Report prepared by Halcrow Group Ltd for the North West and North Wales Coastal Group, September 2010, 152pp.
Halcrow, 2010d. North West England and North Wales Shoreline Management Plan SMP2. Supporting Studies. Cell Eleven Tide and Sediment transport Study (CETaSS) Phase 2 (ii). Appendix E - Potential Implications of Future Sea Level Rise for Estuarine Sediment Budgets and Morphology in Northwest England and North Wales. Report prepared by K. Pye and S. Blott for Halcrow Group Ltd for the North West and North Wales Coastal Group, October 2009, 102pp + Tables + Figures.
Halcrow, 2010e. North West England and North Wales Shoreline Management Plan SMP2. Supporting Studies. Cell Eleven Tide and Sediment transport Study (CETaSS) Phase 2 (ii). Appendix F - Modelling studies for the Ribble. Report prepared by Halcrow Group Ltd for the North West and North Wales Coastal Group, 2010, 117pp.
Halcrow, 2010f. Cell 11 Regional Monitoring Strategy (CERMS). 2009 Baseline Reporting. Report prepared by Halcrow Group Ltd for the North West and North Wales Coastal Group, April 2010, 143pp + Apps.
Halcrow, 2010g. Cell 11 Regional Monitoring Strategy (CERMS). 2010 Monitoring Update Report. Report prepared by Halcrow Group Ltd for the North West and North Wales Coastal Group, last updated October 2012, 195 + Tables + Figures + Apps.
Halcrow, 2010h. Cell 11 Regional Monitoring Strategy (CERMS). Tide Gauge Review. Report prepared by Halcrow Group Ltd for the North West and North Wales Coastal Group, last updated January 2010, 124pp + Tables + Figures + Apps.
Halcrow, 2010i. North West England and North Wales Shoreline Management Plan SMP2. Supporting Studies. Cell Eleven Tide and Sediment transport Study (CETaSS) Phase 2 (ii). Appendix A - Regional tidal and sediment modelling studies. Report prepared by Halcrow Group Ltd for the North West and North Wales Coastal Group, 2010, 135pp.
Halcrow, 2011. Bathymetric Survey. North-West Regional Coastal Monitoring Programme. Report produced by Halcrow for Sefton Council, July 2011.
Halcrow, 2013. Wyre B.C. Beach Modelling Studies, Coastal Area Modelling, Document: 110 Version: 2.0. Report produced by Halcrow Group Ltd for Wyre Borough Council, January 2013.
Hansom, J.D., Comber, D.P.M. and Fahy, F.M., 1993. Estuaries Management Plans.
Hill, M.A., 1987. Vegetation Change in Communities of Spartina anglica C.E. Hubbard in Salt Marshes of Northwest England. Contract Surveys No. 9, Nature Conservancy Council, Peterborough.
Holden, V.J.C., 2008a. Report on the Evolution of the Ribble Estuary, With Particular Reference to the north Sefton Coast. Report to Sefton Council.
Holden, V.J.C., 2008b. Sedimentary Accretion on the North Sefton Coast. PhD Thesis, University of Lancaster (Edge Hill University).
Holden, V.J.C., 2008c. Report on the Saltmarshes at Marshside, Southport. Prepared for Sefton Council.
Holden, V.J.C. (2010). The historic development of the north Sefton coast. In Worsley, A.T., Lymbery, G., Holden, V.J.C. & Newton, M. (eds.) Sefton’s Dynamic Coast. Coastal Defence, Sefton MBC Technical Services Department, Ainsdale-on-Sea, 55-82.
Holden, V.J.C., Worsley, A.T., Booth, C.A. and Lymbery, G., 2011. Characterisation and sediment-source linkages of intertidal sediment of the UK’s north Sefton Coast using magnetic and textural properties: findings and limitations. Ocean Dynamics 61, 2157-2179.
HR Wallingford, 2001. Sediment transport and the effects of sand extraction. Fylde Shoreline, Lancashire. Stage 3: Modelling Phase II. Report EX4352.
COPYRIGHT 2013 HALCROW GROUP LTD 30
HRS, 1965. Investigation of Siltation in the Estuary of the River Ribble. Report EX281, Hydraulics Research Station, Wallingford.
HRS, 1968. Notes in Engineering Works to Reduce Dredging in the Ribble Estuary. Report 391, Hydraulics Research Station, Wallingford.
HRS, 1980. River Ribble Cessation of Dredging. Report EX948, Hydraulics Research Station, Wallingford.
Inglis, C. C. and Kestner, F., J., T., 1958. The long-term effects of training walls, reclamation, and dredging on Estuaries. ICE proceedings paper no. 6268, 193-215pp.
Lancashire County Council, 2013. Minerals and Waste Sites in Fylde. http://www.lancashire.gov.uk/corporate/web/view.asp?siteid=3087&pageid=7180&e=e#anchor37868, Accessed 20.05.2013.
Lyons, M., 1997. The dynamics of suspended sediment transport in the Ribble Estuary. Water, Air and Soil Pollution 99, 141pp.
Neal, A., 1993. Sedimentology and Morphodynamics of a Holocene Coastal Dune Barrier Complex, Northwest England. PhD Thesis, University of Reading.
O’Connor, B.A. (1987) Short and long-term changes in estuary capacity. Journal of the Geological Society, London 144, 187-195.
Pontee, N., Harvey, R., Tovey, E., Brown, T, Osment, J., Bowell, H., and Nickson, D., 2007. Large, innovative and realigned: Hesketh Out Marsh West. 42nd DEFRA Conference of River and Coastal Engineers, York, UK, 2007.
Pye, K. and Neal, A., 1994. Coastal dune erosion at Formby Point, north Merseyside: causes and mechanisms. Marine Geology 119, 39-56pp.
Pye, K. and van der Wal, D., 2000a. Historical Trends Analysis (HTA) as a tool for long-term morphological prediction in estuaries. In: Estuaries research Programme, Phase 1 – Emphasys Consortium. Modelling Morphology and Process. Final Report. MAFF Contract CSA 4938, MAFF Project FD1401. Paper 14.
Pye, K. and van der Wal, D., 2000b. Expert geomorphological assessment (EGA) as a tool for long-term morphological prediction in estuaries. In: Estuaries research Programme, Phase 1 – Emphasys Consortium. Modelling Morphology and Process. Final Report. MAFF Contract CSA 4938, MAFF Project FD1401. Paper 15.
Pye, K. and Blott, S.J., 2013. The Coast and Estuaries of Northwest England. Internal Research Report 1247, Kenneth Pye Associates Ltd, Solihull.
Pye, K. Blott, S.J., Witton, S.J. and Pye, A.L. (2010). Cell 11 Regional Monitoring Strategy- Results of Particle Size Analysis: Liverpool Bay. Kenneth Pye Associates Ltd External Investigation Report EX1219 prepared for Sefton Council.
Robinson, N.A., 1984. The history of Spartina anglica in the Ribble Estuary. In Doody, J.P. (ed.) Spartina anglica in Great Britain. Focus on Nature Conservation No. 5, Nature Conservancy Council, Peterborough, 27-29pp.
Sefton Council 2004. Sefton Coastal Process Monitoring Report 2000 to 2004 – Mersey Estuary Summary. Report published December 2004, 2pp. Available online: http://www.sefton.gov.uk/pdf/TS_cdef_area_mersey_summary.pdf. [Date accessed: 29/08/08]
Sefton Council 2007 Coastal defence: Report on Coastal Erosion predictions for Formby Point, Formby, Merseyside. Parts 1 and 2. July 2007. Report prepared by G., Lymbery, P., Wisse and M., Newton.
Shaw, D., 1975. Water Inputs to Liverpool Bay. In NERC, Liverpool Bay Study Group. NERC Publ., series C, 14.

COPYRIGHT 2013 HALCROW GROUP LTD 31
Smith, T.J., Parker, W.R. & Kirby, R., 1980. Sedimentation Studies Relevant to Low Level Radioactive Effluent Dispersal in the Irish Sea. Part 1. Radionuclides in Marine Sediments. Institute of Oceanographic Sciences Report 110, pp87.
Tooley, MJ. (1978) Sea Level Changes in Northwest England During the Flandrian Stage. Clarendon Press, Oxford, 237pp.
van der Wal D, Pye K and Neal A., 2002. Long-term morphological change in the Ribble Estuary, north west England. Marine Geology, 189, 249-266pp.
Wakefield, R., Tyler, A.N., McDonald, P., Atkin, P.A., Gleizon, P. & Gilvear, D, 2011. Estimating sediment and caesium-137 fluxes in the Ribble Estuary through time series airborne remote sensing. Journal of Environmental Radioactivity 102, 252-261.

COPYRIGHT 2013 HALCROW GROUP LTD 32
Appendix A
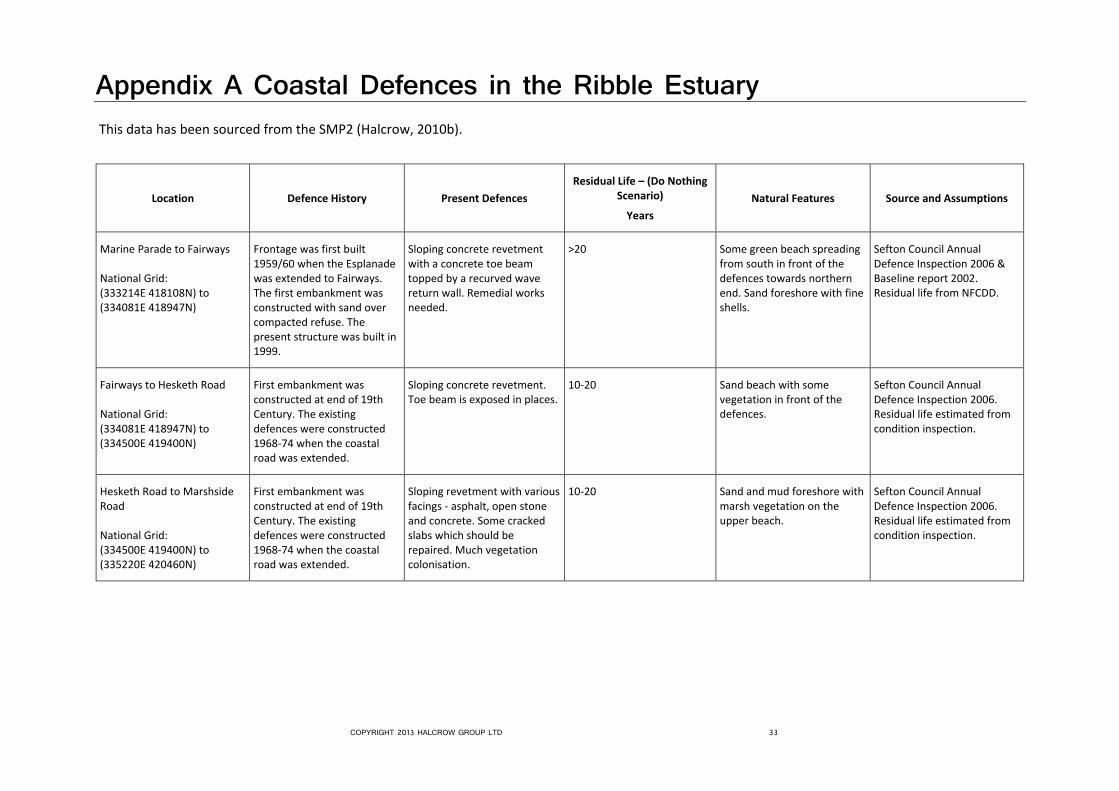
COPYRIGHT 2013 HALCROW GROUP LTD 33
Appendix A Coastal Defences in the Ribble Estuary This data has been sourced from the SMP2 (Halcrow, 2010b).
Location Defence History Present Defences
Residual Life – (Do Nothing Scenario)
Years
Natural Features Source and Assumptions
Marine Parade to Fairways National Grid: (333214E 418108N) to (334081E 418947N)
Frontage was first built 1959/60 when the Esplanade was extended to Fairways. The first embankment was constructed with sand over compacted refuse. The present structure was built in 1999.
Sloping concrete revetment with a concrete toe beam topped by a recurved wave return wall. Remedial works needed.
>20 Some green beach spreading from south in front of the defences towards northern end. Sand foreshore with fine shells.
Sefton Council Annual Defence Inspection 2006 & Baseline report 2002. Residual life from NFCDD.
Fairways to Hesketh Road National Grid: (334081E 418947N) to (334500E 419400N)
First embankment was constructed at end of 19th Century. The existing defences were constructed 1968-74 when the coastal road was extended.
Sloping concrete revetment. Toe beam is exposed in places.
10-20 Sand beach with some vegetation in front of the defences.
Sefton Council Annual Defence Inspection 2006. Residual life estimated from condition inspection.
Hesketh Road to Marshside Road National Grid: (334500E 419400N) to (335220E 420460N)
First embankment was constructed at end of 19th Century. The existing defences were constructed 1968-74 when the coastal road was extended.
Sloping revetment with various facings - asphalt, open stone and concrete. Some cracked slabs which should be repaired. Much vegetation colonisation.
10-20 Sand and mud foreshore with marsh vegetation on the upper beach.
Sefton Council Annual Defence Inspection 2006. Residual life estimated from condition inspection.

COPYRIGHT 2013 HALCROW GROUP LTD 34
Location Defence History Present Defences
Residual Life – (Do Nothing Scenario)
Years
Natural Features Source and Assumptions
Marshside National Grid: (335220E 420460N) to (335400E 420657N)
First embankment was constructed at end of 19th Century. The existing defences were constructed 1968-74 when the coastal road was extended. Foreshore in front of embankment reclaimed by Rainford's site compound.
Sand/earth fill reclamation. Embankment buried.
>20 Sand and mud lower beach, vegetated upper beach.
Sefton Council Annual Defence Inspection 2006 & Baseline report 2002. Residual life from NFCDD.
Marshside Road to Millars Pace National Grid: (335400E 420657N) to (336173E 421141N)
First embankment was constructed at end of 19th Century. The existing defences were constructed 1968-74 when the coastal road was extended.
Sloping concrete revetment with top and mid-slope kerb edging. Much of the defences colonised by vegetation.
<10 Marsh sediment upper beach with sand and mud lower beach.
Sefton Council Annual Defence Inspection 2006. Residual life estimated from condition inspection.
Millars Pace to Bank End National Grid: (336173E 421141N) to (337199E 420387N)
Earth bank facing constructed 1968-74.
Saltings provide primary defence. Earth embankment with rubble core, faced with beach sand - only provides defence in spring tides or storm events.
11-20 Large area of saltings. Marsh vegetation upper beach, sand and mud lower beach.
Sefton Council Annual Defence Inspection 2006 & Baseline report 2002. Residual life from NFCDD.
Bank End to Crossens Pumping Station National Grid: (337199E 420387N) to (337670E 420650N)
Earth bank constructed 1968-74.
Earth embankment with sheet steel piling.
20-50 Marsh/green beach. Sefton Council Annual Defence Inspection 2006. Residual life estimated from condition inspection.
Crossens Pumping Station to SC/WLDC boundary. National Grid: (337713E 420722N) to (337550E 421700N)
Bank was originally built in 1883 to reclaim land from the sea for agriculture. Refurbished in 1950 and 1970.
Trapezoidal earth bank with turf crest and sides.
>20 Marsh sediment upper beach with sand and mud lower beach.
Sefton Council Annual Defence Inspection 2006 & Baseline report 2002. Residual life from NFCDD.
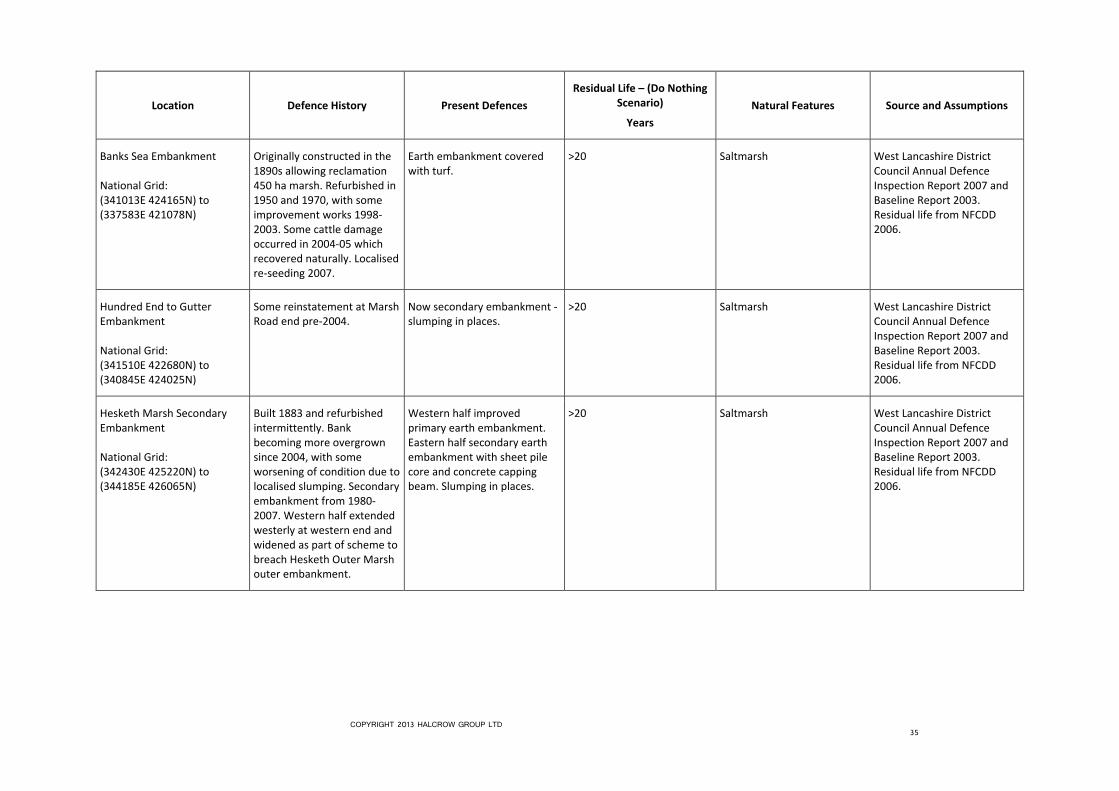
COPYRIGHT 2013 HALCROW GROUP LTD 35
Location Defence History Present Defences
Residual Life – (Do Nothing Scenario)
Years
Natural Features Source and Assumptions
Banks Sea Embankment National Grid: (341013E 424165N) to (337583E 421078N)
Originally constructed in the 1890s allowing reclamation 450 ha marsh. Refurbished in 1950 and 1970, with some improvement works 1998-2003. Some cattle damage occurred in 2004-05 which recovered naturally. Localised re-seeding 2007.
Earth embankment covered with turf.
>20 Saltmarsh West Lancashire District Council Annual Defence Inspection Report 2007 and Baseline Report 2003. Residual life from NFCDD 2006.
Hundred End to Gutter Embankment National Grid: (341510E 422680N) to (340845E 424025N)
Some reinstatement at Marsh Road end pre-2004.
Now secondary embankment - slumping in places.
>20 Saltmarsh West Lancashire District Council Annual Defence Inspection Report 2007 and Baseline Report 2003. Residual life from NFCDD 2006.
Hesketh Marsh Secondary Embankment National Grid: (342430E 425220N) to (344185E 426065N)
Built 1883 and refurbished intermittently. Bank becoming more overgrown since 2004, with some worsening of condition due to localised slumping. Secondary embankment from 1980-2007. Western half extended westerly at western end and widened as part of scheme to breach Hesketh Outer Marsh outer embankment.
Western half improved primary earth embankment. Eastern half secondary earth embankment with sheet pile core and concrete capping beam. Slumping in places.
>20 Saltmarsh West Lancashire District Council Annual Defence Inspection Report 2007 and Baseline Report 2003. Residual life from NFCDD 2006.

COPYRIGHT 2013 HALCROW GROUP LTD 36
Location Defence History Present Defences
Residual Life – (Do Nothing Scenario)
Years
Natural Features Source and Assumptions
Hesketh Outer Marsh Embankment (West) National Grid: (341875E 426083N) to (341013E 424165N)
Originally constructed 1980 to reclaim 350 hectares marshland and refurbished intermittently. New cross-shore embankment built in 2007. Due to be intermittently breached summer 2008.
Earth embankment with intermittent breaches
>20 Saltmarsh West Lancashire District Council Annual Defence Inspection Report 2007 and Baseline Report 2003. Residual life from NFCDD 2006.
Hesketh Outer Marsh Embankment (East) National Grid: (344225E 426068N) to (341875E 426083N)
Constructed 1980 to reclaim 350 hectares marshland and refurbished intermittently.
Earth embankment >20 Saltmarsh West Lancashire District Council Annual Defence Inspection Report 2007 and Baseline Report 2003. Residual life from NFCDD 2006.
Hesketh New Marsh to Hesketh Bank sewage works - River Douglas National Grid: (344225E 426068N) to (345491E 423970N)
Unknown Earth embankment and some unworked stone on channel side of drain to landward. Position of channel varies.
>20 Saltmarsh NFCDD 2008.
Hesketh Bank sewage works to Douglas Farm - River Douglas National Grid: (345491E 423970N) to (345249E 423169N)
Unknown Earth embankment and some unworked stone on channel side of drain to landward.
>20 Saltmarsh NFCDD 2008.

COPYRIGHT 2013 HALCROW GROUP LTD 37
Location Defence History Present Defences
Residual Life – (Do Nothing Scenario)
Years
Natural Features Source and Assumptions
Douglas Farm to Douglas Avenue, Becconsall - River Douglas National Grid: (345249E 423169N) to (345125E 422289N)
N/A Natural embankment. Slips on channel sides in places.
>20 River channel NFCDD
Douglas Avenue to Spencers Drive Tarleton - River Douglas National Grid: (345125E 422289N) to (345329E 421850N)
Unknown Earth embankment >20 River channel with saltmarsh vegetation
NFCDD
Carr House Bridge to Much Hoole Marsh - River Douglas National Grid: (346010E 421543N) to (345285E 422295N)
Unknown Earth embankment >20 River channel with saltmarsh vegetation
NFCDD
Much Hoole Marsh - River Douglas National Grid: (345285E 422295N) to (345575E 422886N)
Unknown Earth embankment. Crest levels are uneven.
>20 River channel with saltmarsh vegetation
NFCDD
End of tip to end of Haunders Lane - River Douglas National Grid: (345575E 422886N) to (345884E 423820N)
Unknown Earth embankment - some erosion on channel side.
>20 River channel with saltmarsh vegetation
NFCDD

COPYRIGHT 2013 HALCROW GROUP LTD 38
Location Defence History Present Defences
Residual Life – (Do Nothing Scenario)
Years
Natural Features Source and Assumptions
Little Hoole Marsh - River Douglas National Grid: (345884E 423820N) to (345718E 424789N)
Unknown Earth embankment >20 River channel with saltmarsh vegetation
NFCDD
Longton Marsh - River Douglas National Grid: (345718E 424789N) to (345816E 426365N)
Unknown Earth embankment >20 River channel with saltmarsh vegetation
NFCDD
Longton Embankment to Heskeths Farm access road National Grid: (345816E 426365N) to (346217E 427035N)
Unknown Earth embankment acting as secondary defence. Uninspected private defence is primary. Loss of crest height and embankment width in places.
1-5 River channel with saltmarsh vegetation
NFCDD
Westlands Farm frontage National Grid: (346217E 427035N) to (346534E 427956N)
Unknown Earth embankment acting as secondary defence. Uninspected private defence is primary. Loss of crest height and embankment width in places.
1-5 River channel with saltmarsh vegetation
NFCDD
Old sewage works to opposite Savick Brook, Bottom of Hutton National Grid: (346534E 427956N) to (348171E 428626N)
Constructed from Preston Dock dredgings
Earth embankment. Some erosion inward face
6-10 River channel with saltmarsh vegetation
NFCDD
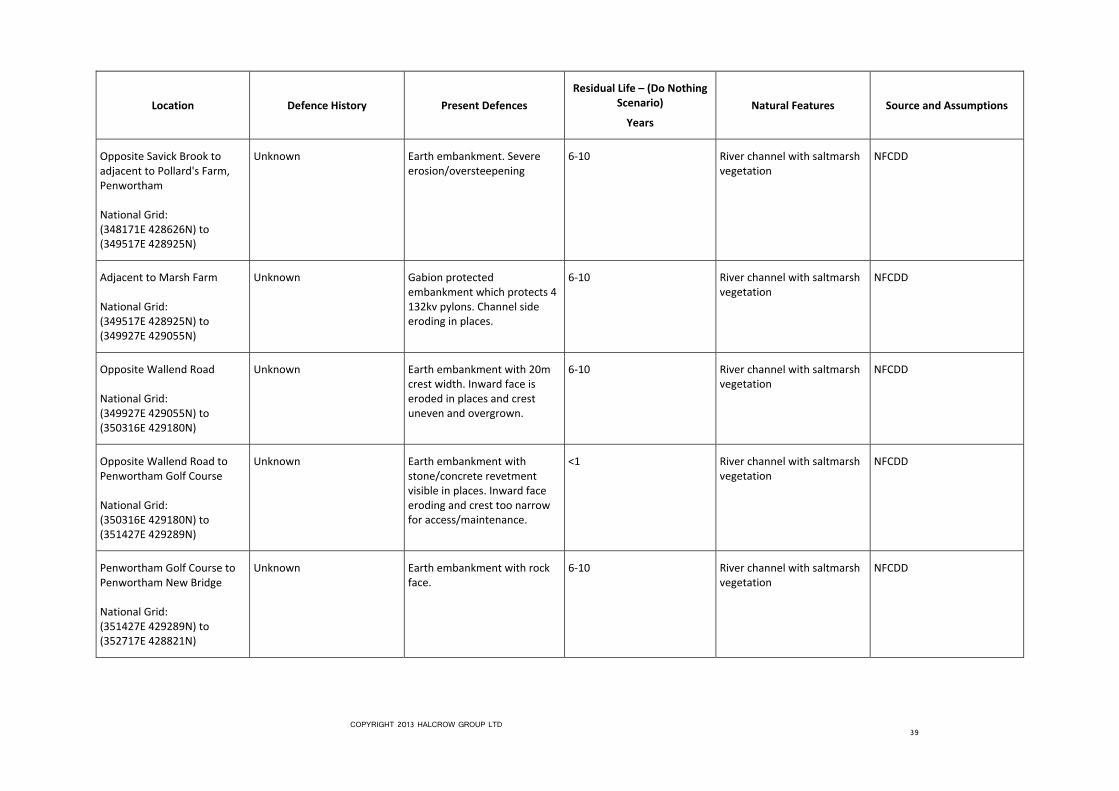
COPYRIGHT 2013 HALCROW GROUP LTD 39
Location Defence History Present Defences
Residual Life – (Do Nothing Scenario)
Years
Natural Features Source and Assumptions
Opposite Savick Brook to adjacent to Pollard's Farm, Penwortham National Grid: (348171E 428626N) to (349517E 428925N)
Unknown Earth embankment. Severe erosion/oversteepening
6-10 River channel with saltmarsh vegetation
NFCDD
Adjacent to Marsh Farm National Grid: (349517E 428925N) to (349927E 429055N)
Unknown Gabion protected embankment which protects 4 132kv pylons. Channel side eroding in places.
6-10 River channel with saltmarsh vegetation
NFCDD
Opposite Wallend Road National Grid: (349927E 429055N) to (350316E 429180N)
Unknown Earth embankment with 20m crest width. Inward face is eroded in places and crest uneven and overgrown.
6-10 River channel with saltmarsh vegetation
NFCDD
Opposite Wallend Road to Penwortham Golf Course National Grid: (350316E 429180N) to (351427E 429289N)
Unknown Earth embankment with stone/concrete revetment visible in places. Inward face eroding and crest too narrow for access/maintenance.
<1 River channel with saltmarsh vegetation
NFCDD
Penwortham Golf Course to Penwortham New Bridge National Grid: (351427E 429289N) to (352717E 428821N)
Unknown Earth embankment with rock face.
6-10 River channel with saltmarsh vegetation
NFCDD

COPYRIGHT 2013 HALCROW GROUP LTD 40
Location Defence History Present Defences
Residual Life – (Do Nothing Scenario)
Years
Natural Features Source and Assumptions
Penwortham New Bridge to Fish House Bridge National Grid: (352717E 428821N) to (352831E 428360N)
Unknown Earth embankment with granulated stone crest. Liable to flooding.
<1 River channel with saltmarsh vegetation
NFCDD
Penwortham Bridge to Penwortham New Bridge National Grid: (352992E 428349N) to (352815E 428852N)
Unknown Masonry flood wall. Some missing joints on coping stones.
<1 River channel with saltmarsh vegetation
NFCDD
Penwortham New Bridge to Junction Road National Grid: (352815E 428852N) to (352575E 429204N)
Unknown Earth embankment with rock armour protection. Embankment sides oversteep and overgrown.
<1 River channel with saltmarsh vegetation
NFCDD
Junction Road to New Diversion Quay, Preston National Grid: (352575E 429204N) to (352448E 429247N)
Unknown Earth embankment with masonry facing. Some trees need removing.
<1 River channel with saltmarsh vegetation
NFCDD
New Diversion Quay, Preston National Grid: (352448E 429247N) to (352011E 429367N)
Unknown Vertical dock walls backed by earth embankment. Vegetation needs controlling on embankment.
6-10 River channel NFCDD

COPYRIGHT 2013 HALCROW GROUP LTD 41
Location Defence History Present Defences
Residual Life – (Do Nothing Scenario)
Years
Natural Features Source and Assumptions
Britannia Drive, Preston National Grid: (352011E 429367N) to (351777E 429384N)
Unknown Earth embankment with stone on facing and crest. In poor condition due to tree growth.
<1 River channel NFCDD
Navigation Way, Preston National Grid: (351777E 429384N) to (351150E 429374N)
Unknown Earth embankment with stone facing in places.
6-10 River channel NFCDD
Freedom Centre, Preston National Grid: (351150E 429374N) to (351014E 429368N)
Unknown Earth embankment topped by concrete revetment. Channel lined with gabion baskets in places.
6-10 River channel NFCDD
Maritime Way, Preston National Grid: (351014E 429368N) to (350753E 429340N)
Unknown Earth embankment with worked stone face. Channel side mix of rock armour and gabion baskets.
6-10 River channel NFCDD
Dock Basin National Grid: (350753E 429340N) to (350668E 429334N)
Unknown Vertical dock wall backed by gently sloping masonry revetment and earth embankment.
6-10 River channel NFCDD
Dock Basin (2) National Grid: (350668E 429334N) to (350613E 429331N)
Unknown Earth embankment with masonry facing and unworked stone crest
6-10 River channel NFCDD

COPYRIGHT 2013 HALCROW GROUP LTD 42
Location Defence History Present Defences
Residual Life – (Do Nothing Scenario)
Years
Natural Features Source and Assumptions
Bull Nose National Grid: (350613E 429331N) to (350646E 429370N)
Unknown Earth embankment with masonry facing
6-10 River channel NFCDD
Entrance doors to Preston Dock National Grid: (350646E 429370N) to (350644E 429393N)
Unknown Timber dock gates 6-10 River channel NFCDD
Carpark to Boat Yard National Grid: (350644E 429393N) to (350492E 429371N)
Unknown Vertical quay walls 6-10 River channel NFCDD
Wallend Road National Grid: (350492E 429371N) to (349708E 429182N)
Unknown Earth embankment with granulated stone crest. Inward face has eroded close to footpath in several locations.
<1 Saltmarsh vegetation and river channel
NFCDD
Lea Marsh and motor racing circuit National Grid: (349708E 429182N) to (348137E 428847N)
Unknown Earth embankment with berm and gabions on inward face above the berm in places. Rubble in places at bank toe.
1-5 River channel NFCDD

COPYRIGHT 2013 HALCROW GROUP LTD 43
Location Defence History Present Defences
Residual Life – (Do Nothing Scenario)
Years
Natural Features Source and Assumptions
Savick Brook to sewage works National Grid: (348137E 428847N) to (345810E 428289N)
N/A Natural high ground N/A River channel NFCDD
Sewage works National Grid: (345810E 428289N) to (345675E 428026N)
Unknown Earth embankment protecting sewage works. Soil creep and stock damage on inward face.
6-10 Saltmarsh and river channel NFCDD
Sewage works (2) National Grid: (345675E 428026N) to (345511E 427971N)
Unknown Earth embankment with concrete wall on crest. Soil creep and stock damage to inward face.
6-10 Saltmarsh and river channel NFCDD
Sewage works (3) National Grid: (345511E 427971N) to (345221E 427877N)
Unknown Earth embankment 6-10 Saltmarsh and river channel NFCDD
Sewage works to Grange Farm access track National Grid: (345221E 427877N) to (344405E 427606N)
Unknown Earth embankment with some masonry revetment on inward face.
6-10 Saltmarsh and river channel NFCDD

COPYRIGHT 2013 HALCROW GROUP LTD 44
Location Defence History Present Defences
Residual Life – (Do Nothing Scenario)
Years
Natural Features Source and Assumptions
Grange Farm access track to Freckleton Pool National Grid: (344405E 427606N) to (343692E 427373N)
Unknown Earth embankment with some masonry revetment on inward face.
6-10 Saltmarsh and river channel NFCDD
Pool Stream to The Naze National Grid: (343400E 427193N) to (342304E 427060N)
Unknown Stone revetment in two sections
>5 Saltmarsh with wooded earth cliff.
Fylde Borough Council Annual Defence Inspection Report 2005
Warton Bank to Pool Stream National Grid: (342304E 427060N) to (340292E 427457N)
N/A Natural earth bank N/A Saltmarsh backed by wooded embankment.
Fylde Borough Council Annual Defence Inspection Report 2005
Lytham Dock to Warton Bank National Grid: (340292E 427457N) to (337790E 427649N)
Built in 1880 and refurbished in the 1990s.
Earth embankments with concrete reinforcement in places.
>10 Saltmarsh, sand and mud deposits flanking river channels.
Fylde Borough Council Annual Defence Inspection Report 2005
Lytham Land Registry to Liggard Brook National Grid: (338101E 427397N) to (337690E 427098N)
Unknown Ad-hoc rubble revetment comprising lumps of quarried rock, stones, broken concrete and hardcore fronting natural/artificial cliff. New development immediately to landward.
<10 Saltmarsh Fylde Borough Council Annual Defence Inspection Report 2005 and 2004 Baseline Report.

COPYRIGHT 2013 HALCROW GROUP LTD 45
Location Defence History Present Defences
Residual Life – (Do Nothing Scenario)
Years
Natural Features Source and Assumptions
Lytham Land Registry National Grid: (337690E 427098N) to (337602E 427147N)
Built post-1950s. Sloping revetment backed by vertical wall
>10 Saltmarsh Fylde Borough Council Annual Defence Inspection Report 2005 and 2004 Baseline Report.

46
Appendix B

47
Appendix B: Recommendations for further studies in the Ribble Estuary Recommended study
(See Table 3.3)
Outline scope Outline cost estimate and priority
1. Update of flood and coastal defence database.
Study could be led by either EA or Sefton Council.
Review and update overall Ribble estuary data set in Appendix A, checking latest data held by EA on their Asset Information Management System (AIMS); the LLFA in their FWMA S21 register; Sefton Council and Fylde Council for their latest coastal defence data. Review data and prioritise site visits to bring the dataset up to date using latest aerial photography from coastal group. Undertake walkover inspections for selected defences including photography of each defence length and significant defects. Update database.
Estimated cost £15k - £25k; if packaged with other similar work on other estuaries or the open coast.
Priority – rated as high in Table 3.2, as needed to feed into estuary strategy and managed realignment studies before the next SMP review.
2. Estuary wide Managed realignment studies and strategy development.
Developing scope for the studies recommended in the SMP2 11b1 Action Plan (e.g. items 1.1, 2.5, 2.7, 2.8 and 3.1) to develop a long term strategy focusing on managed realignment are beyond the scope of this study which is focussing on estuary processes and monitoring. However, the processes and monitoring actions below need to be progressed first in order to inform this strategy study.
It is recommended that a scoping study is undertaken to develop the detailed scope for the MR studies and strategy study.
SMP Action Plan gives an estimated cost for the series of MR studies and the strategy development of about £375k.
Estimated cost for scoping study £20k.
Priority – SMP Action Plan indicated start during 2015/16 and medium priority. Therefore scoping study should have high priority.
3. Land drainage issues at outfalls fronted by accreting saltmarsh.
See Overview report. See Overview report.
4. Analysis of water level data from tide gauges for verification of models
Undertake analysis and quality control of available data from the 3 EA tide gauges to determine reliability and value of the data and any recommendations for improvement. Use QC’d data to compare to modelled high water profiles from existing models, including the 2D and 1D models developed in CETaSS and the models used for flood warning and assessment of Areas Benefiting from Defences (ABD).
If necessary refine calibration of existing 1D and 2D models for subsequent use in estuary strategy development, assessing impacts of MR / flood storage on extreme water levels in the inner estuary and also to improve flood warning.
Estimated cost £10 to £15k. (not including modelling)
Priority high - needed to inform modelling.
5. Near concurrent swath bathymetry and LiDAR surveys of whole estuary and adjacent potential MR sites in flood plain.
The LiDAR survey should be undertaken on low spring tides in order to cover as much intertidal area as possible and as much overlap with bathymetry survey as possible. The bathymetry survey should cove the whole estuary and be optimised to overlap, where possible with the LiDAR. The surveys should include the whole estuary, including the Douglas, extending from the mouth (Southport to Starr Hills) to above the normal tidal limits.
Estimated cost –~£100k.
Priority high as needed to inform modelling studies that will feed into the strategy development.
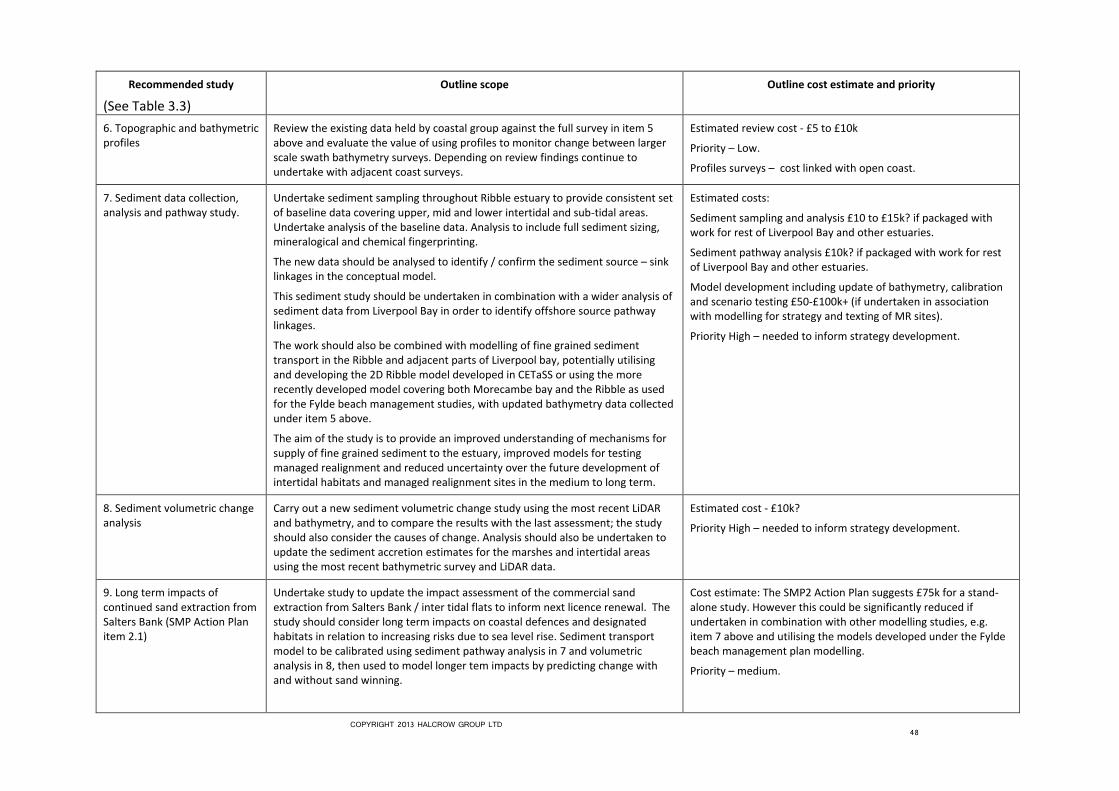
COPYRIGHT 2013 HALCROW GROUP LTD 48
Recommended study
(See Table 3.3)
Outline scope Outline cost estimate and priority
6. Topographic and bathymetric profiles
Review the existing data held by coastal group against the full survey in item 5 above and evaluate the value of using profiles to monitor change between larger scale swath bathymetry surveys. Depending on review findings continue to undertake with adjacent coast surveys.
Estimated review cost - £5 to £10k
Priority – Low.
Profiles surveys – cost linked with open coast.
7. Sediment data collection, analysis and pathway study.
Undertake sediment sampling throughout Ribble estuary to provide consistent set of baseline data covering upper, mid and lower intertidal and sub-tidal areas. Undertake analysis of the baseline data. Analysis to include full sediment sizing, mineralogical and chemical fingerprinting.
The new data should be analysed to identify / confirm the sediment source – sink linkages in the conceptual model.
This sediment study should be undertaken in combination with a wider analysis of sediment data from Liverpool Bay in order to identify offshore source pathway linkages.
The work should also be combined with modelling of fine grained sediment transport in the Ribble and adjacent parts of Liverpool bay, potentially utilising and developing the 2D Ribble model developed in CETaSS or using the more recently developed model covering both Morecambe bay and the Ribble as used for the Fylde beach management studies, with updated bathymetry data collected under item 5 above.
The aim of the study is to provide an improved understanding of mechanisms for supply of fine grained sediment to the estuary, improved models for testing managed realignment and reduced uncertainty over the future development of intertidal habitats and managed realignment sites in the medium to long term.
Estimated costs:
Sediment sampling and analysis £10 to £15k? if packaged with work for rest of Liverpool Bay and other estuaries.
Sediment pathway analysis £10k? if packaged with work for rest of Liverpool Bay and other estuaries.
Model development including update of bathymetry, calibration and scenario testing £50-£100k+ (if undertaken in association with modelling for strategy and texting of MR sites).
Priority High – needed to inform strategy development.
8. Sediment volumetric change analysis
Carry out a new sediment volumetric change study using the most recent LiDAR and bathymetry, and to compare the results with the last assessment; the study should also consider the causes of change. Analysis should also be undertaken to update the sediment accretion estimates for the marshes and intertidal areas using the most recent bathymetric survey and LiDAR data.
Estimated cost - £10k?
Priority High – needed to inform strategy development.
9. Long term impacts of continued sand extraction from Salters Bank (SMP Action Plan item 2.1)
Undertake study to update the impact assessment of the commercial sand extraction from Salters Bank / inter tidal flats to inform next licence renewal. The study should consider long term impacts on coastal defences and designated habitats in relation to increasing risks due to sea level rise. Sediment transport model to be calibrated using sediment pathway analysis in 7 and volumetric analysis in 8, then used to model longer tem impacts by predicting change with and without sand winning.
Cost estimate: The SMP2 Action Plan suggests £75k for a stand-alone study. However this could be significantly reduced if undertaken in combination with other modelling studies, e.g. item 7 above and utilising the models developed under the Fylde beach management plan modelling.
Priority – medium.

49
Recommended study
(See Table 3.3)
Outline scope Outline cost estimate and priority
10. Collection of water level, tidal current and wave data.
Depending on review of EA tide gauge data under item 4 it may be necessary to collect new tide data at two or more locations for model calibration.
Tidal current and wave data should be collected from at least one location in the outer Ribble, using a bed mounted instrument deployed for a spring neap cycle, preferably concurrent with LiDAR and / or bathymetry surveys.
Current and wave data collection could be undertaken with one of the (S4?) instruments in use for nearshore wave data collection as part of regional monitoring, or a separate deployment alongside the bathymetry survey.
Urgency – high – needed to inform numerical modelling and confirm conceptual understanding.
Estimated cost - £15k to £20k if undertaken packaged with other work in regional monitoring.