north sumatra – mergui basin cross border … · north sumatra – mergui basin . cross border...
TRANSCRIPT
INDONESIAN PROGRESS REVIEW
NORTH SUMATRA – MERGUI BASIN CROSS BORDER CASE STUDY
EPPM-CCOP
PIW6
By Indonesian Team :
Jonathan Setyoko Panuju Julikah
Jakson Anwari Herru Lastiadi
Tri Muji Susantoro
• INTRODUCTION
• PREVIOUS PROGRESS
• P1W6 PROGRESS
• SUMMARY
OUTLINES
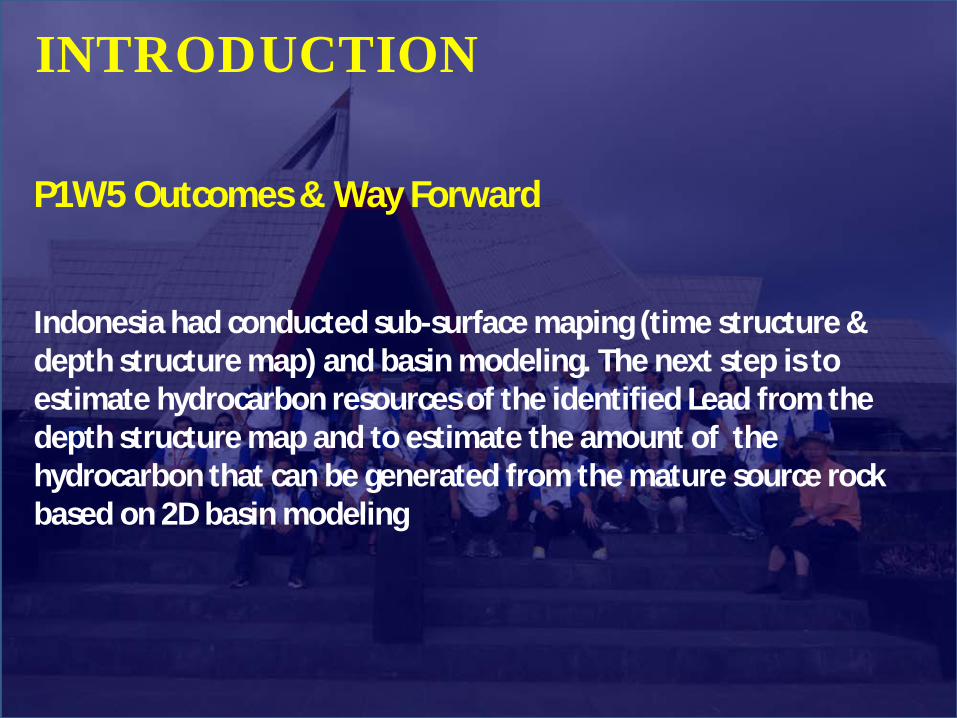
INTRODUCTION
P1W5 Outcomes & Way Forward Indonesia had conducted sub-surface maping (time structure & depth structure map) and basin modeling. The next step is to estimate hydrocarbon resources of the identified Lead from the depth structure map and to estimate the amount of the hydrocarbon that can be generated from the mature source rock based on 2D basin modeling

PREVIOUS RESULTS
Ø SUB SURFACE MAPPING Ø BASIN MODELING

TIME STRUCTURE MAP BASEMENT
TIME STRUCTURE MAP BAONG Fm.
C.I. : 50 ms 100 KM
N
TIME STRUCTURE MAP PEUTU Fm.
C.I. : 50 ms 100 KM C.I. : 50 ms 100 KM
TIME STRUCTURE MAP KEUTAPANG Fm.
C.I. : 50 ms 100 KM
TIME STRUCTURE MAP SEA BED
C.I. : 25 ms 100 KM
ISOCHRONE MAP BASEMENT-SEA BED
100 KM C.I. : 100 ms
N N
N N N
SUBSURFACE MAPPING
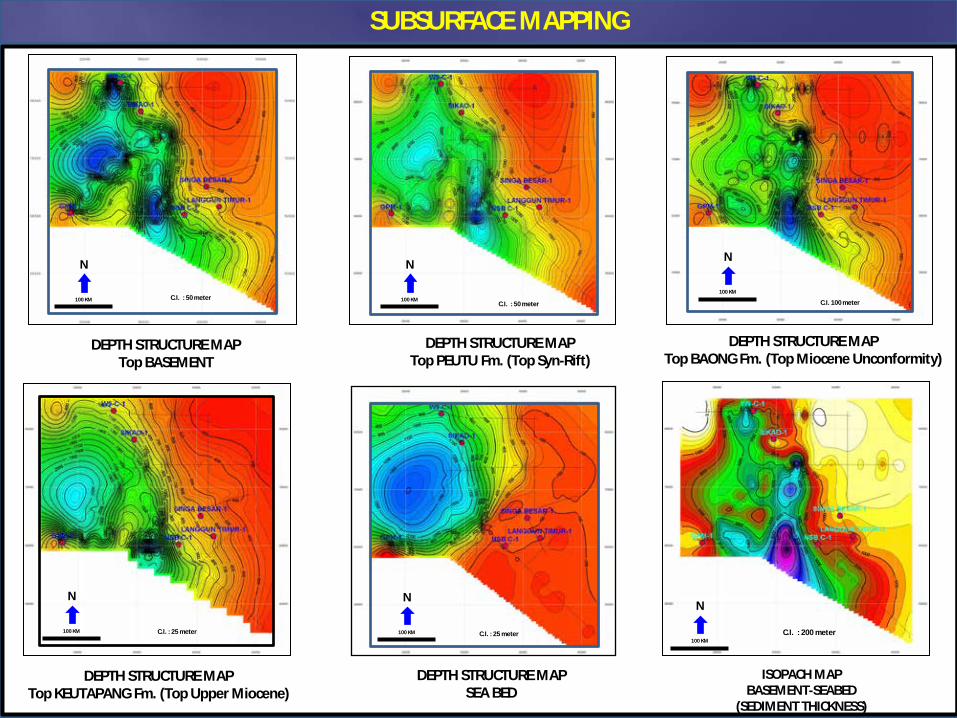
DEPTH STRUCTURE MAP Top BASEMENT
C.I. : 50 meter
ISOPACH MAP BASEMENT-SEABED
(SEDIMENT THICKNESS)
C.I. : 200 meter
100 KM
N
DEPTH STRUCTURE MAP Top PEUTU Fm. (Top Syn-Rift)
C.I. : 50 meter
DEPTH STRUCTURE MAP Top BAONG Fm. (Top Miocene Unconformity)
C.I. 100 meter
DEPTH STRUCTURE MAP Top KEUTAPANG Fm. (Top Upper Miocene)
C.I. : 25 meter
DEPTH STRUCTURE MAP SEA BED
C.I. : 25 meter
100 KM
N
100 KM
N
100 KM
N
100 KM
N
100 KM
N
SUBSURFACE MAPPING
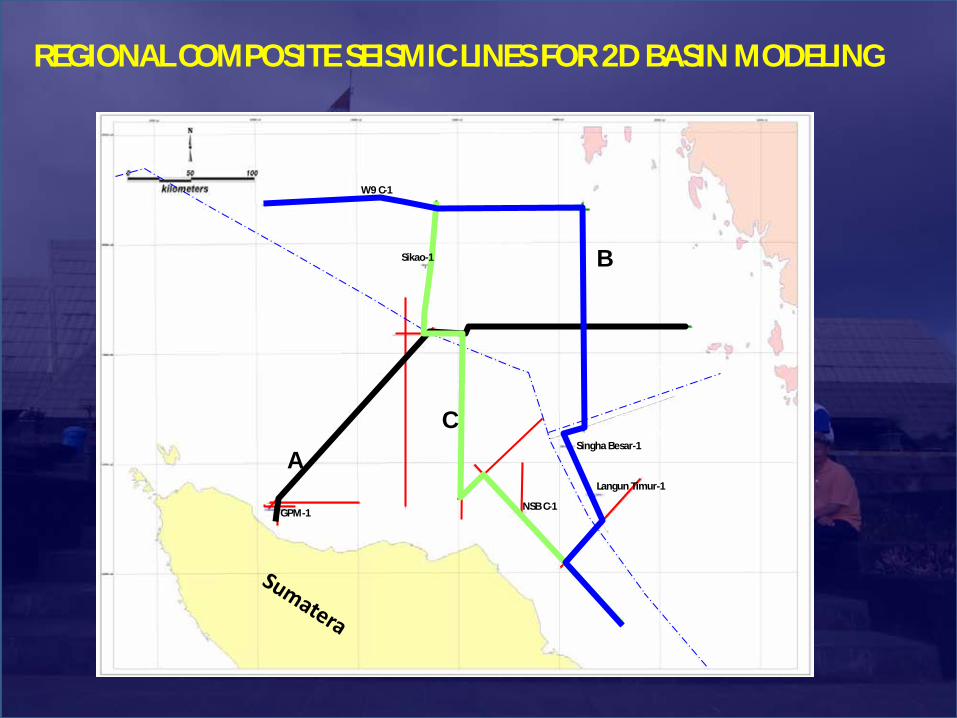
REGIONAL COMPOSITE SEISMIC LINES FOR 2D BASIN MODELING
A
C
B
GPM-1
Sikao-1
Langun Timur-1
Singha Besar-1
W9 C-1
NSB C-1
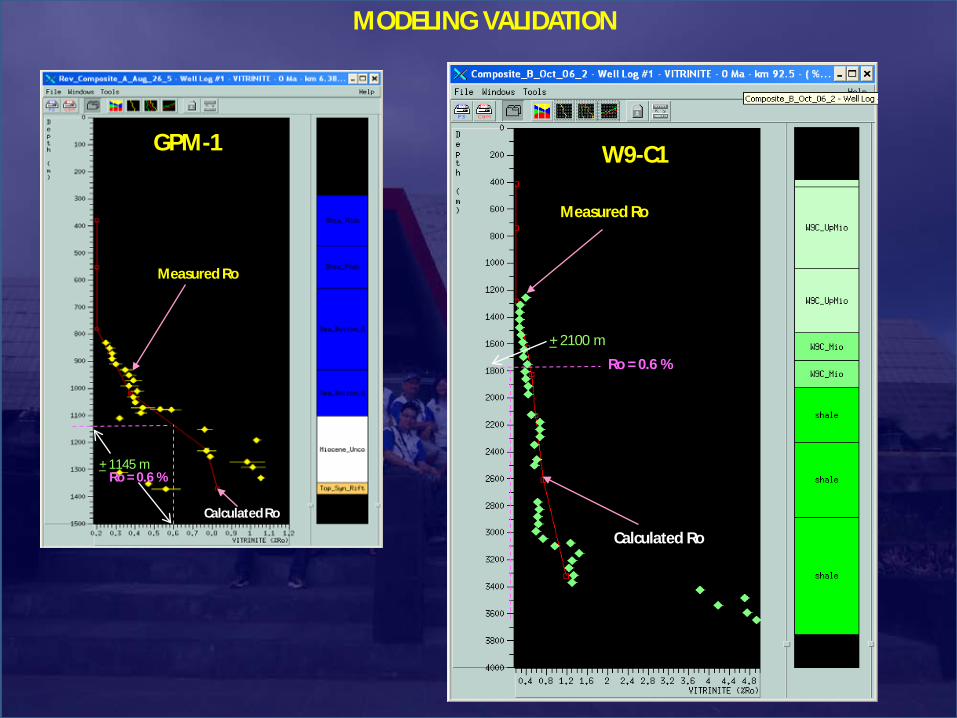
MODELING VALIDATION
Measured Ro
Calculated Ro
Ro = 0.6 % + 1145 m
GPM-1 W9-C1
Measured Ro
Calculated Ro
Ro = 0.6 %
+ 2100 m
Ro = 0.6 %
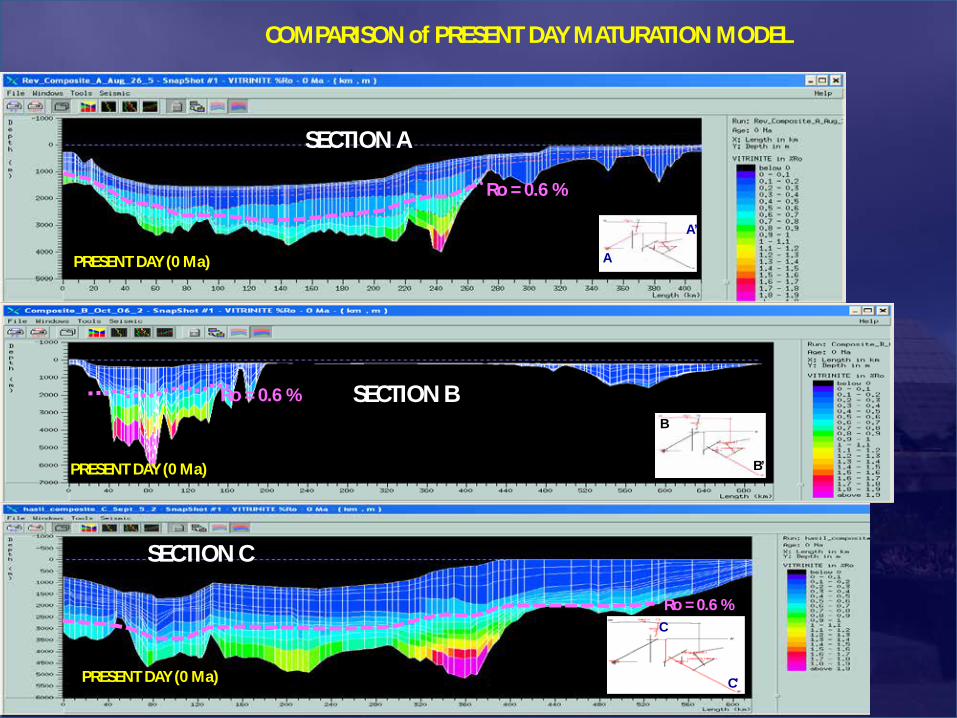
PRESENT DAY (0 Ma)
Ro = 0.6 %
PRESENT DAY (0 Ma)
PRESENT DAY (0 Ma)
Ro = 0.6 %
COMPARISON of PRESENT DAY MATURATION MODEL
SECTION A
SECTION B
SECTION C
A
A’
B
B’
C
C’
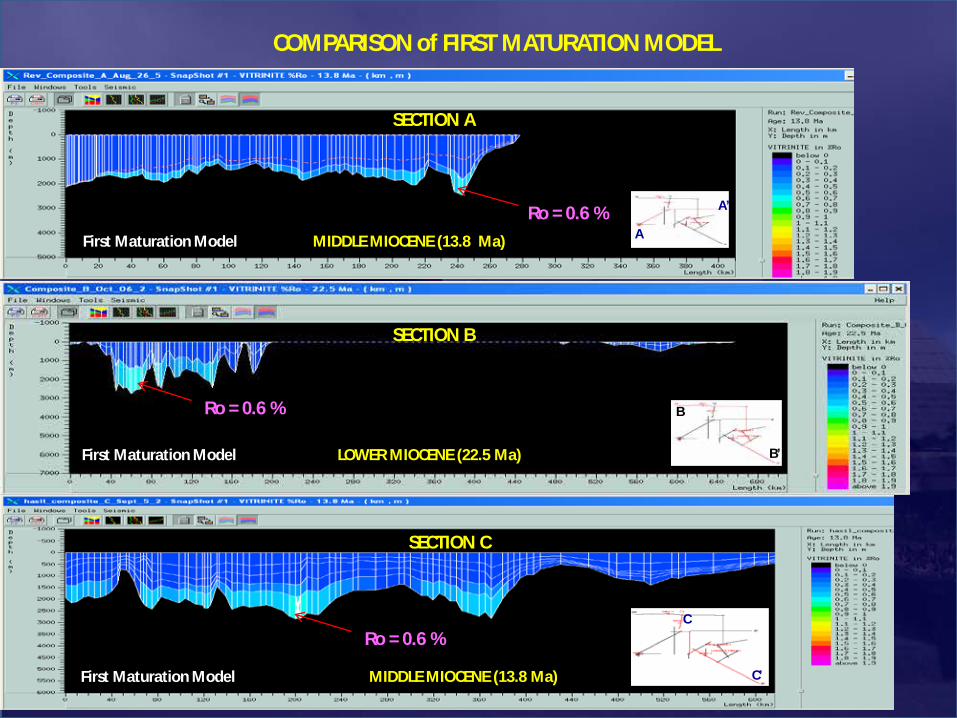
Ro = 0.6 % MIDDLE MIOCENE (13.8 Ma) First Maturation Model
Ro = 0.6 %
LOWER MIOCENE (22.5 Ma) First Maturation Model
MIDDLE MIOCENE (13.8 Ma) First Maturation Model
Ro = 0.6 %
COMPARISON of FIRST MATURATION MODEL
SECTION A
SECTION C
SECTION B
A
A’
B
B’
C
C’
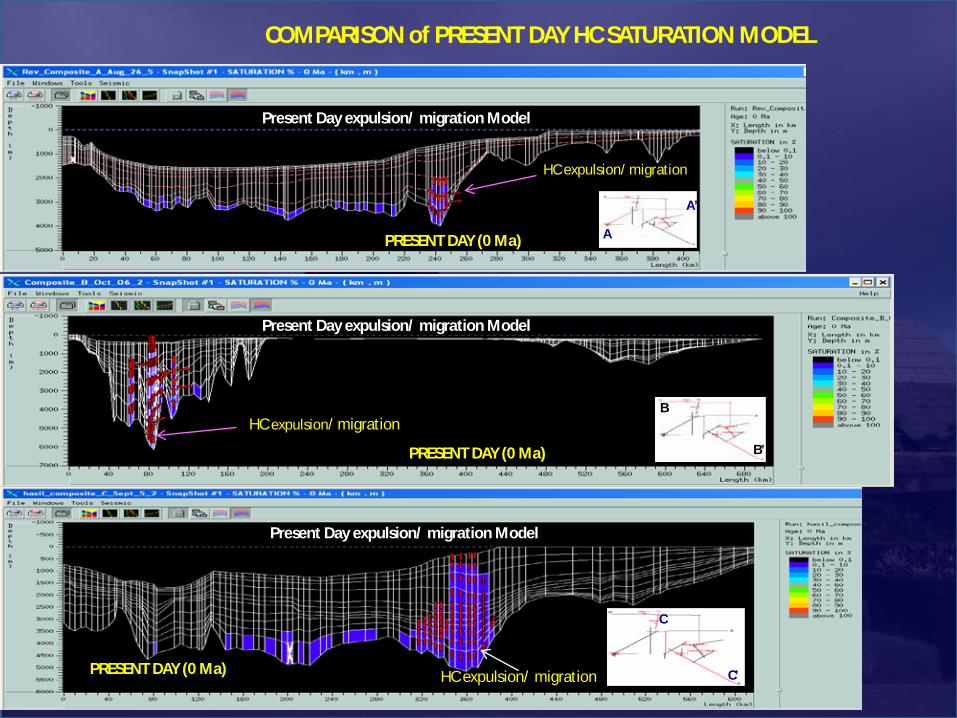
HC expulsion/ migration
PRESENT DAY (0 Ma)
Present Day expulsion/ migration Model
HC expulsion/ migration
PRESENT DAY (0 Ma)
Present Day expulsion/ migration Model
HC expulsion/ migration PRESENT DAY (0 Ma)
Present Day expulsion/ migration Model
COMPARISON of PRESENT DAY HC SATURATION MODEL
A
A’
B
B’
C
C’
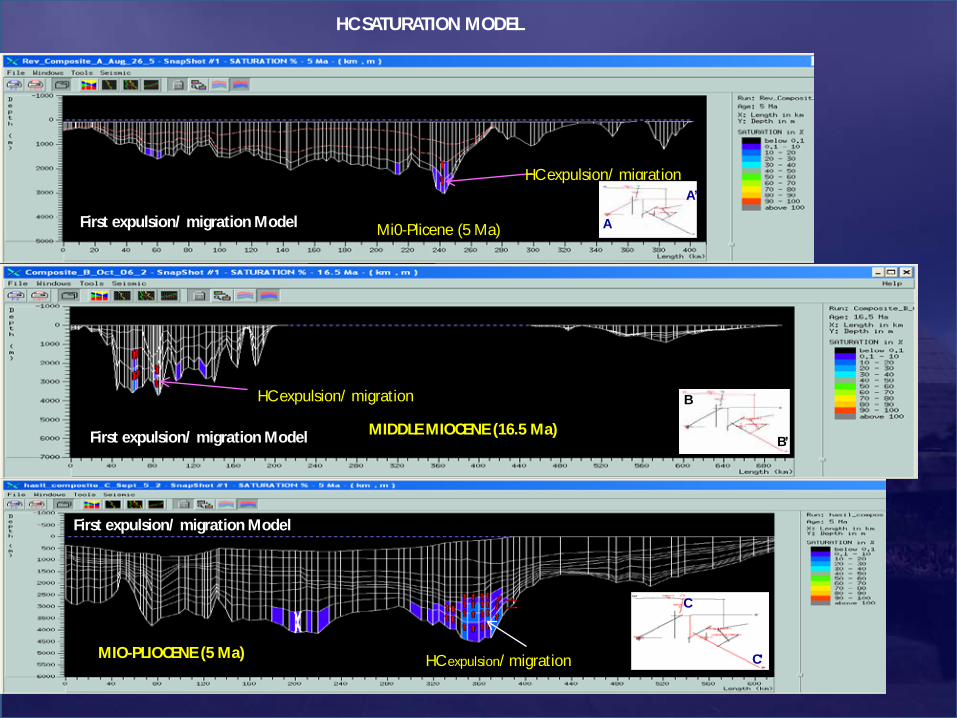
HC SATURATION MODEL
Mi0-Plicene (5 Ma) First expulsion/ migration Model
HC expulsion/ migration
MIDDLE MIOCENE (16.5 Ma) First expulsion/ migration Model
HC expulsion/ migration
MIO-PLIOCENE (5 Ma)
First expulsion/ migration Model
HC expulsion/ migration
A
A’
B
B’
C
C’

P1W6 PROGRESS
Ø VOLUMETRIC CALCULATION Ø HYDROCARBON GENERATION
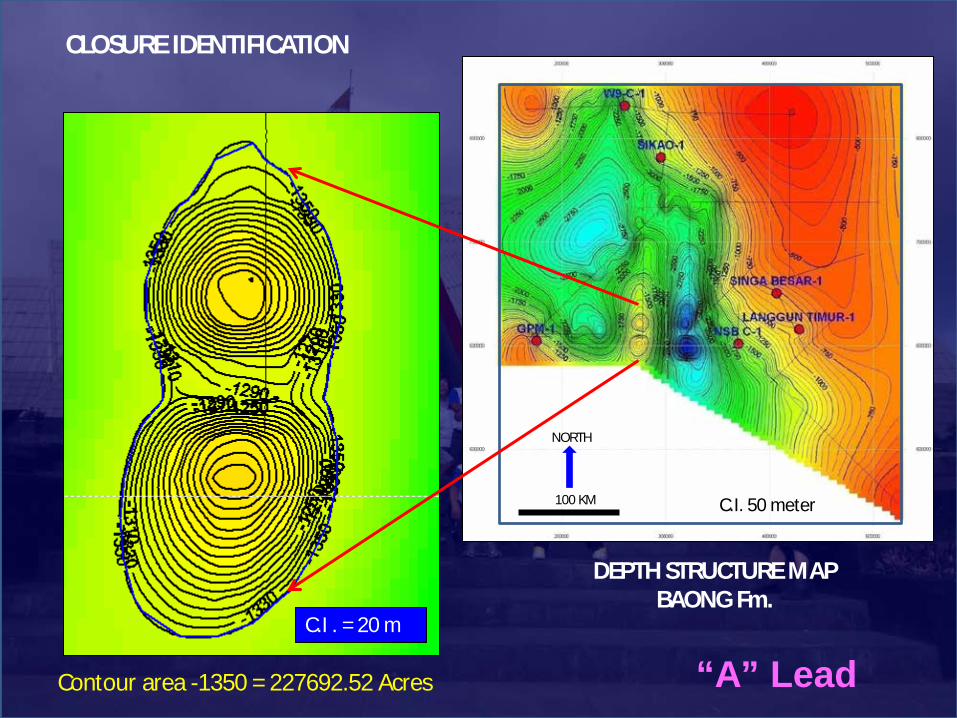
C.I. 50 meter 100 KM
NORTH
Contour area -1350 = 227692.52 Acres
C.I . = 20 m
DEPTH STRUCTURE MAP BAONG Fm.
CLOSURE IDENTIFICATION
“A” Lead
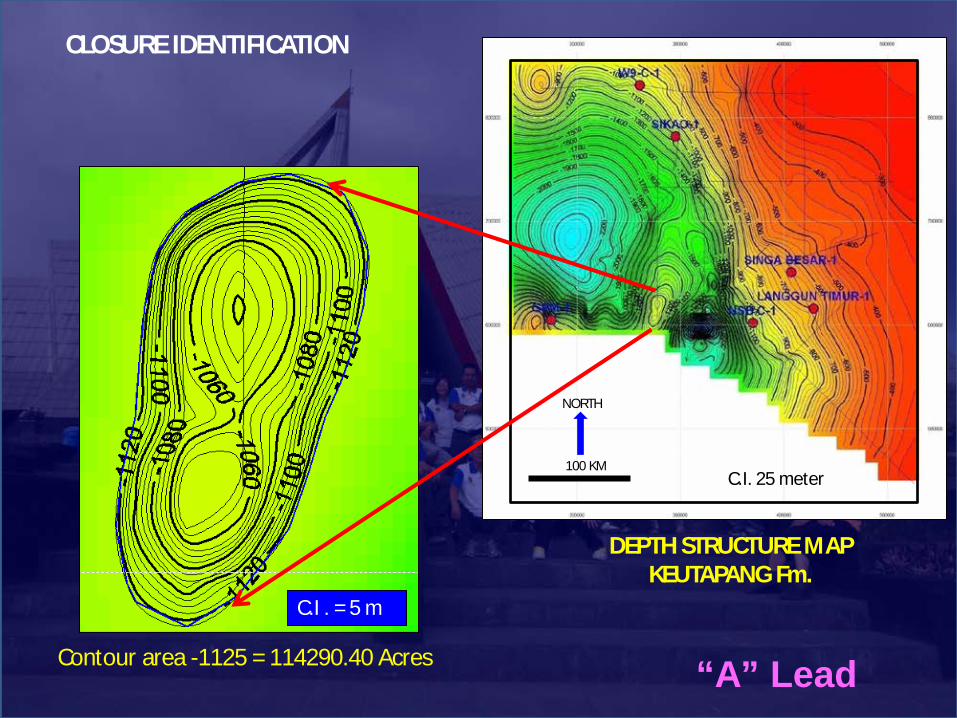
DEPTH STRUCTURE MAP KEUTAPANG Fm.
100 KM
NORTH
C.I. 25 meter
C.I . = 5 m
Contour area -1125 = 114290.40 Acres
CLOSURE IDENTIFICATION
“A” Lead
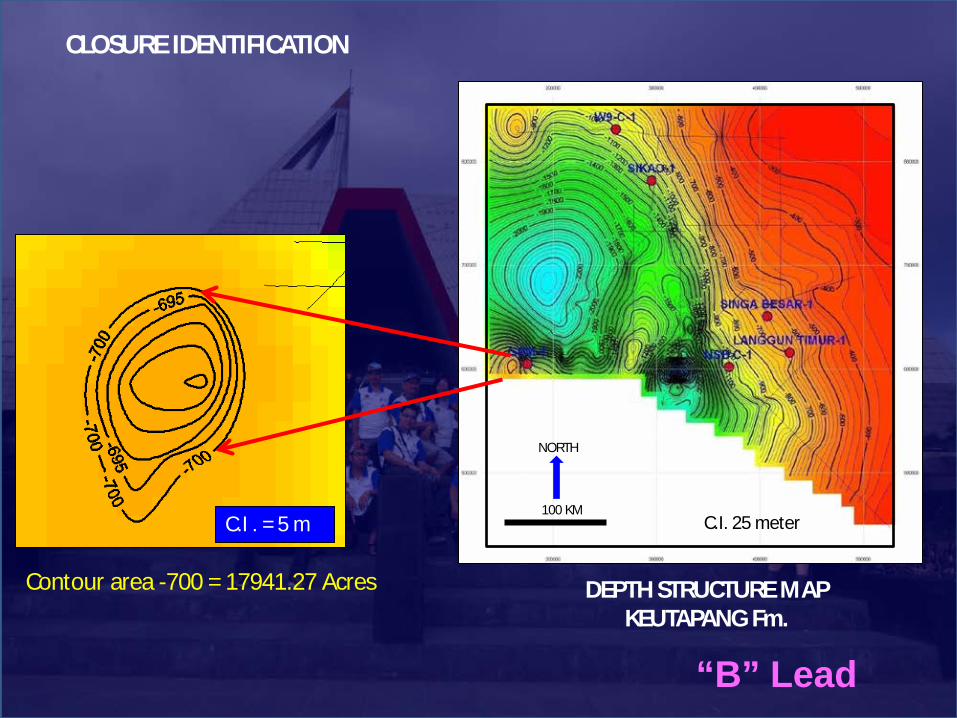
DEPTH STRUCTURE MAP KEUTAPANG Fm.
100 KM
NORTH
C.I. 25 meter C.I . = 5 m
Contour area -700 = 17941.27 Acres
CLOSURE IDENTIFICATION
“B” Lead
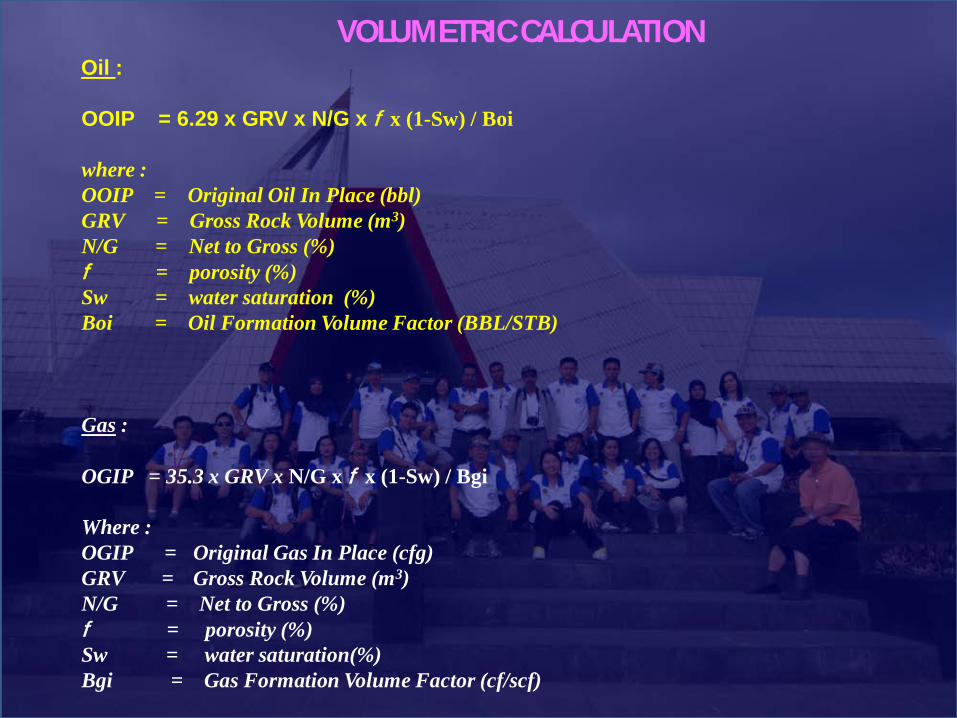
Oil : OOIP = 6.29 x GRV x N/G x f x (1-Sw) / Boi where : OOIP = Original Oil In Place (bbl) GRV = Gross Rock Volume (m3) N/G = Net to Gross (%) f = porosity (%) Sw = water saturation (%) Boi = Oil Formation Volume Factor (BBL/STB) Gas : OGIP = 35.3 x GRV x N/G x f x (1-Sw) / Bgi Where : OGIP = Original Gas In Place (cfg) GRV = Gross Rock Volume (m3) N/G = Net to Gross (%) f = porosity (%) Sw = water saturation(%) Bgi = Gas Formation Volume Factor (cf/scf)
VOLUMETRIC CALCULATION
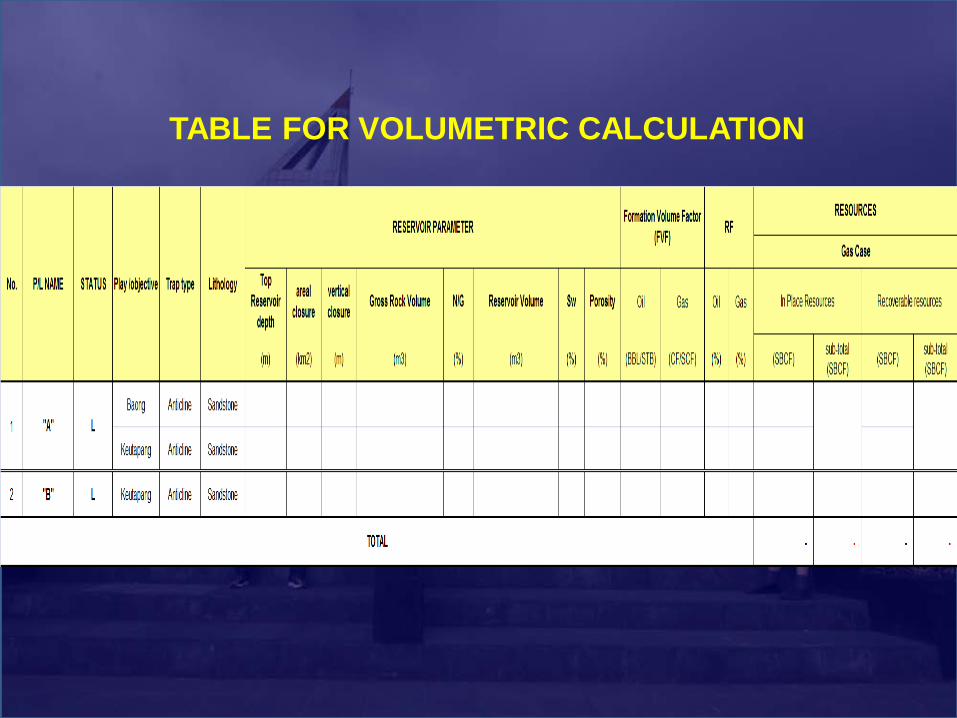
TABLE FOR VOLUMETRIC CALCULATION
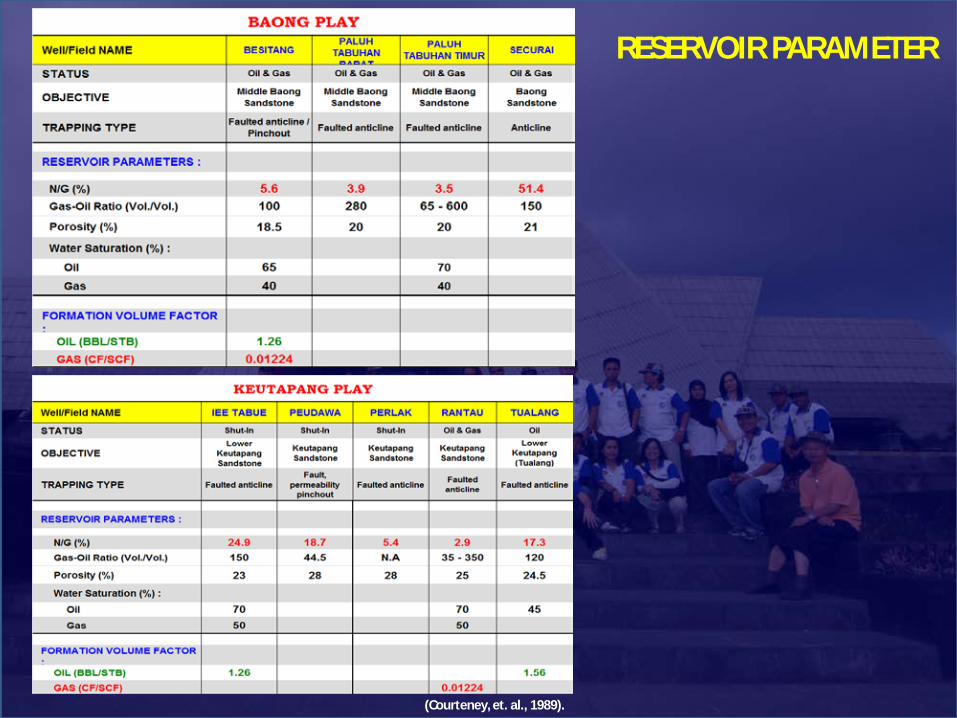
RESERVOIR PARAMETER
(Courteney, et. al., 1989).
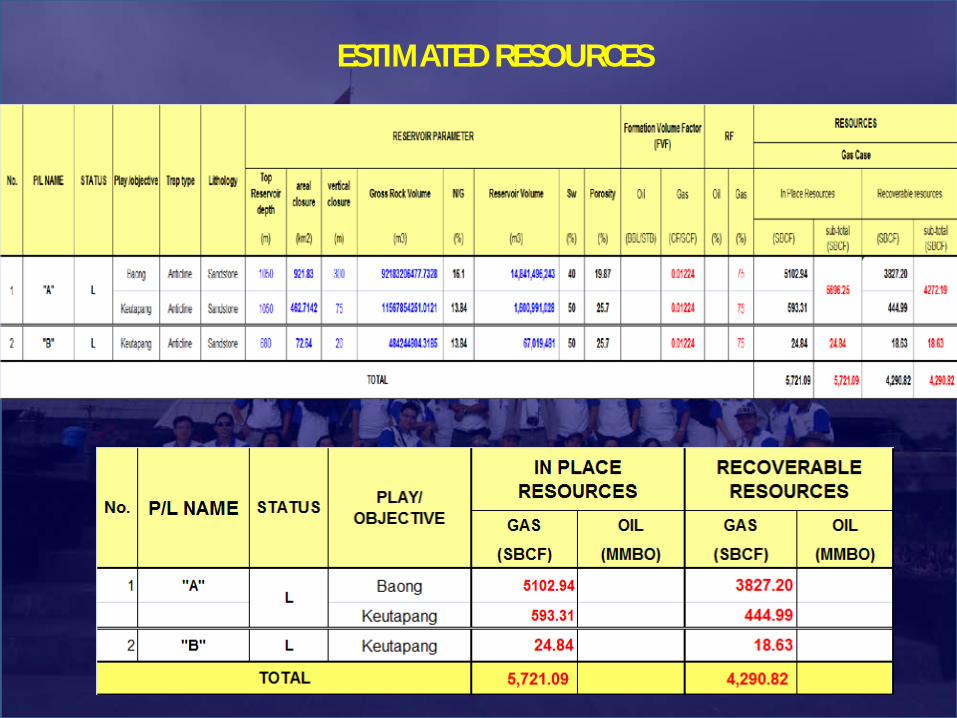
ESTIMATED RESOURCES
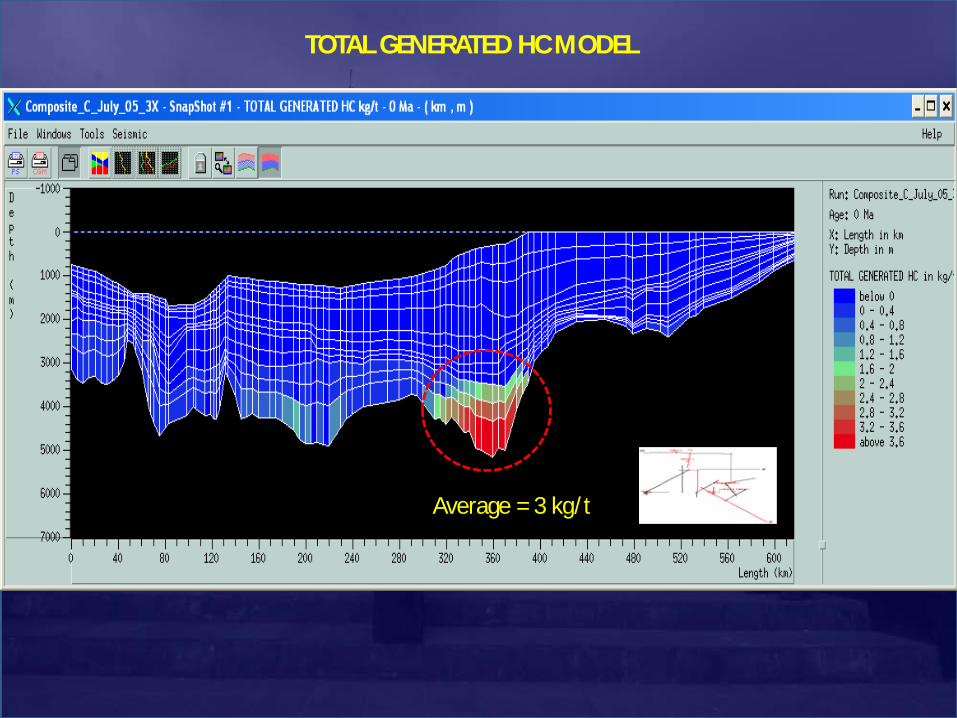
Average = 3 kg/t
TOTAL GENERATED HC MODEL
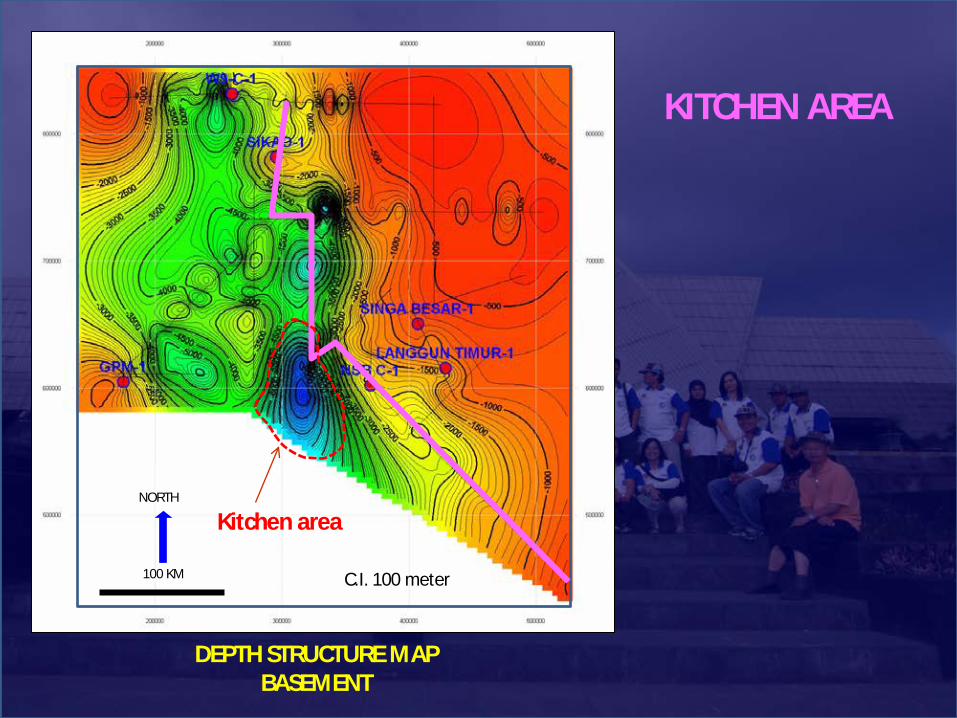
DEPTH STRUCTURE MAP BASEMENT
C.I. 100 meter 100 KM
NORTH
Kitchen area
KITCHEN AREA

ESTIMATED HYDROCARBON GENERATED FROM THE SOURCE ROCK
LITHOLOGY PROPERTIES FROM GPM-1
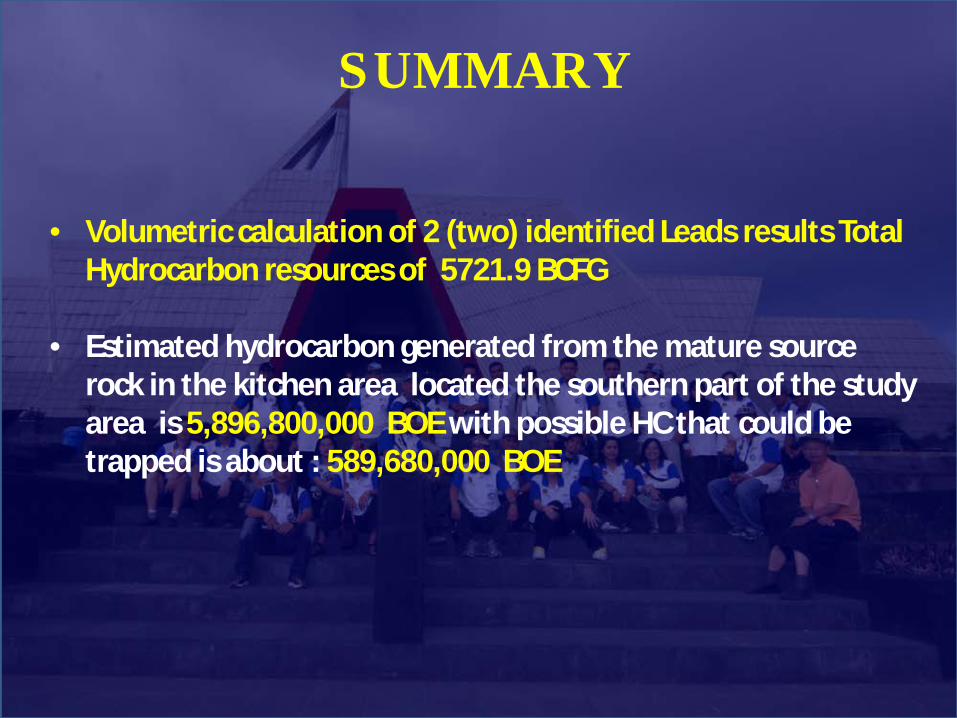
SUMMARY
• Volumetric calculation of 2 (two) identified Leads results Total Hydrocarbon resources of 5721.9 BCFG
• Estimated hydrocarbon generated from the mature source
rock in the kitchen area located the southern part of the study area is 5,896,800,000 BOE with possible HC that could be trapped is about : 589,680,000 BOE
TERIMA KASIH THANK YOU