north-south asymmetry in the solar flare index
TRANSCRIPT

NORTH-SOUTH ASYMMETRY IN THE SOLAR FLARE INDEX
TAMER ATA~ and ATiLA 0ZG0~ Kandilli Observatory, Bo~azifi University, ~engelkOy, 81220 Istanbul, Turkey
(Received 30 April, 1995; in revised form 21 November, 1995)
Abstract. This paper reports the results of a study of the N - S asymmetry in the flare index using the results of Knogka (1985) combined with our results for the solar cycles 17 to the current cycle 22. By comparing the time-variation of the asymmetry curve with the solar activity variation of the 11-year cycle, we have found that the flare index asymmetry curve is not in phase with the solar cycle and that the asymmetry peaks during solar minimum. A periodic behaviour in the N - S asymmetry appears: the activity in one hemisphere is more important during the ascending part of the cycle whereas during the descending part the activity becomes more important in the other hemisphere. The dominance of flare activity in the southern hemisphere continues during cycle 22 and, according to our findings, this dominance will increase gradually during the following cycle 23.
1. Introduction
Several solar activity indicators do not occur uniformly on the solar disk. Many authors have used different features of solar activity to study its N-S asymmetry. Using the asymmetry of major flare events from 1955 to 1974, covering cycles 19 and 20, Roy (1977) concluded that there is an asymmetry favouring the northern hemisphere and noted that the asymmetry is more pronounced during solar cycle minimum, adding that the asymmetry does not appear to be connected with the solar cycle. Yadav and Badruddin (1980) pointed out that during 1957-1970 flares of different importance on the northern hemisphere were clearly dominant, while after 1970 this behaviour was reversed. Knogka (1985) studied the asymmetry of the flare index (Kleczek, 1952, 1953) during the period 1936-1976 and found no unique relationship between the asymmetry of flare activity and the eleven year solar cycle. Using the combined data of relative sunspot numbers and sunspot areas, covering 10 solar cycles, Swinson, Koyoma, and Saito (1986) showed that, in general, the activity in the northern hemisphere peaks about two years after sunspot minimum. This peak is greater during even cycles, pointing to a 22-year periodicity in the north-south asymmetry of solar activity, suggesting that the asymmetry is related to the 22-year solar magnetic cycle.
Vizoso and Ballester (1987) have presented the results of a study of the N-S asymmetry in sudden disappearances of solar prominences during solar cycles 18- 21. One can see from their investigation that the asymmetry reverses in sign during the solar maximum, and that this change of sign coincides with the reversal of the Sun's magnetic dipole. Verma (1987) and Verma, Pande, and Uddin (1987), in their studies of cycles 19, 20, and 21, investigated the north-south asymmetry for major flares, type II radio bursts, white-light flares, gamma-ray bursts, hard X-ray
Solar Physics 166: 201-208, 1996. (~) 1996 Kluwer Academic Publishers. Printed in Belgium.

202 TAMER ATA(~ AND ATiLA 6ZGU~
bursts and coronal mass ejections. They found that for solar cycles 19 and 20 the northern hemisphere has been more active but during solar cycle 21 the activity was greater in the southern hemisphere. They concluded that after cycles 19 and 20, the asymmetry shifted from the northern hemisphere to the southern. Vizoso and Ballester (1990) have made an exhaustive study of the N-S asymmetry of sunspots areas during the period 1874-1976. They obtained several interesting results. According to them, the N -S asymmetry of the yearly values of sunspot areas is statistically significant. They also pointed out that the asymmetry at the minimum of the cycles is statistically significant, which implies that the asymmetry is not in phase with the solar cycle. Garcia (1990) has studied the spatial distribution of large flares from 1969 to 1988. He found that the pattern of occurrence is that large flares concentrate in north heliographic latitudes soon after solar minimum and then migrate gradually southward as the cycle progress. By the end of the cycle, most large flares occur in the south. He added that the degree of N - S asymmetry appears to be a function of the intensity of the flare: the most intense flares show the largest amount of N -S asymmetry. Verma (1993) reported a study of various solar phenomena occurring in both northern and southern hemispheres of the Sun for solar cycles 8-22. That study indicates that the N-S asymmetry has a trend of a long-term characteristic time scale of about 110 years. Carbonell, Oliver, and Ballester (1993) have studied the north-south asymmetry of sunspot areas, from 1874 till 1989, using classical and modern quantitative techniques. They showed that in most cases the north-south asymmetry is statistically highly significant. Finally, Oliver and Ballester (1994) have shown that the dominance of solar activity has started to shift during the current cycle from the northern hemisphere to the southern.
In the present paper, the N -S asymmetry of flare activity is investigated with the aid of the daily flare index, q, introduced by Kleczek (1952) and extended by the authors up to the present. This diurnal flare index takes into account the duration
(in minutes), the importance, i, and position of all flares on the solar disk. It is given by
q = i t . (1)
For this study, flare index values for the interval 1936-1993 were compiled from the papers of Kleczek (1952, 1953), Knogka and Letfus (unpublished), Kno~ka and Petr~sek (1984) and Ataq (1987).
2. The Analysis of the North-South Asymmetry of the Flare Index
Long-term observations of solar activity indicate that the behaviour of solar activity is asymmetric. For a long time it has been known that the occurrence of different features on the northern and southern part of the solar disk is not uniform, and that

NORTH-SOUTH ASYMMETRY IN THE SOLAR FLARE INDEX 203
TABLE I
The asymmetry (AFI) in the flare index of solar flares
Year AFI Year AFI Year AFI
1936 -0.13 1956 0.02 1976 1937 0.40Ms 1957 -0 .01Ms 1977 1938 -0 .01Mf 1958 -0 .09Mf 1978 1939 -0.20 1959 0.57 1979 1940 -0.08 1960 0.42 1980 1941 0.29 1961 0.28 1981 1942 -0.03 1962 0.33 1982 1943 0.77 1963 0.70 1983 1944 - 0 . 4 9 m s f 1964 0.67msf 1984 1945 -0.57 1965 0.78 1985 1946 0.48 1966 0.89 1986 1947 -0 .06Ms 1967 0.41Mf 1.987 1948 -0.01 1968 0.13Ms 1988 1949 -0 .07Mf 1969 0.41 1989 1950 0.40 1970 0.28 1990 1951 0.10 1971 -0.03 1991 1952 -0.16 1972 -0.13 1992 1953 0.30 1973 -0.06 1993 1954 - 0 . 2 4 m s f 1974 -0.34 1955 0.02 1975 0.15 m f
-0.11 m s 0.17 0.29 0.21 M s
-0.09 0.03 0.04 M f
-0.57 -0.31 -0.17
0.16ms f -0.33 -0.01
0.05 M s f 0.06
-0.26 -0.30 -0.07
M: maximum; m: minimum; s: sunspots numbers; f: flare index.
more features occur in one or the other part of the disk in different time intervals.
To study flare-index asymmetry (AFI) it is customary to use the formula
AFI = ( X - S ) / ( N + S) . (2)
Here, N and S stand for the annual north and south flare-index values, respectively.
Knogka (1985) determined AFI for the part of cycle 17 and for cycles 18, 19, and
20 (1936-1976) . We have calculated AFI from the beginning of 1977 till the end
of 1993. The values of the yearly AFI determined from the daily flare index are
given in Table I.
To show the statistical significance of the asymmetry series, we performed a sign test which was introduced by Gleissberg (1947). According to this test, the
probability, p, that the variations in a time-series are due to chance can be calculated
from
p = l - e r f x , (3)

204 TAMER ATAr AND ATiLA 6ZG0r
I~
r.r.l
o.o
1o ii 0.15 0.15
. . . . . . . . . . . . . . . . . . . . . . . . . . . . 0 . 0
.O&
k
1 9 ~ 1940 1944 1944 194-9 1954 19.54 1969
CYCLE 17 CYCLE 18 CYCLE 19
1,0 1 . 0 1.0
~ f . . ~ f 7 /
( I , 5
- 0 ~
"%, 0.5
o.fi
19B4
O.5:
~0 . . . . . . . . ' ~ . . . . . . . . . . . :
e
-0 .~
I - 1 . 6 . . . . . . . . . . * . . . . . . . . . ' ' ' ' 1 . .0 . . . . . . . ' . . . . . . . ' ' ' ' L O i , ' . . . . . . . ' . . . . . . . , ,
IS4~r l~elJ 1+74 1976 I ~ 0 1954 19~6 . t 9 9 0 19~4
CYCLE 20 CYCLE 21 CYCLE 22
Fig. 1. The fit of a regression line to the yearly means of the N - S asymmetry of flare index during solar cycles 17-22.
where 'erf' denotes the error function. If p _~ 1, then we can say that variations in the time-series are due to chance;
alternatively, if p << 1, the asymmetry time-series can be considered significant. The method of calculating erfx is given by Ball (1955). Following it, we have determined that p = 7 • 10 -20 which shows that the distribution of the asymmetry index is highly significant, suggesting that it is a real feature of solar activity.
To show the reality of the variations of the asymmetry time-series we have fitted a straight line to the yearly values of AFI, for each cycle separately. The results are shown in Figure 1. We have started each cycle with the year of the minimum between two consecutive cycles. Because of insufficient data for cycle 17, we decided to omit that cycle from our study. The slope of the straight line changes its sign after solar cycle 19 (see Figure 1). This could suggest some kind of periodic behaviour in the N - S asymmetry by which the activity in one hemisphere is more important during the ascending part of the cycle whereas during the descending part the activity becomes more important in the other hemisphere. This confirms and extends earlier results of Waldmeier (1957, 1971). However, using sunspot areas, Vizoso and Ballester (1990) found that in cycle 20 the behaviour of the N - S asymmetry changed. They also pointed out a phase-difference in the activity between hemispheres. Moreover, the time variation of the yearly flare index cor- relates very well with the time variation of the sunspot numbers (see Figure 2). A

NORTH-SOUTH ASYMMETRY IN THE SOLAR FLARE INDEX 205
25
2O 09
t5
09
0 1.0
0.5 ~D
-0.13
"~ -0.5
-1.0
09
Z !00~
50
A (b)
. I l l . I l l . .13fit . I n . I l l
0 1930
. . . . . . iii 1940 1950 1960 1970 1980 1990 2000
TIME (Year ) Fig. 2. (a) Plot of the yearly means of the flare index. (b) Plot of the asymmetry values of the flare index ( 'm ' denotes solar activity minima). (c) Plot of the yearly means of the sunspot numbers.
comparison of the time variation of AFI with the phase of the 11-year cycle of solar activity shows no obvious relationship between them. Furthermore, the asymmetry changes its sign during the maximum, at the time of reversal of the Sun's general magnetic field (Figure 2).
3. Results
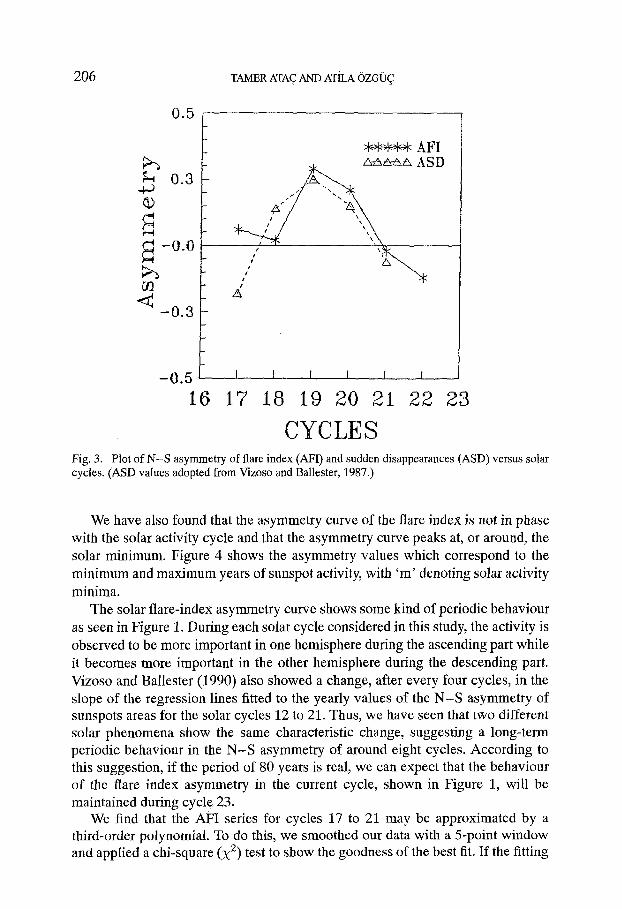
To show the relation of the asymmetry time series with other manifestations of solar activity, we have compared it with the behaviour of the north-south asymmetry of sudden disappearances of filaments. This comparison has been made using the coefficients of asymmetry calculated by Vizoso and Ballester (1987, their Table I), and is shown in Figure 3. The curve of cyclic flare index asymmetry is in good agreement with the curve of cyclic sudden disappearance of filaments.
206 TAMER ATA~ AND ATiLA OZG0(~
0 .5
-~--~--~-*-* AFI ~% A - ~ a ASD
0.3
.... r " 1 " , \ a ', ~ '
t
- 0 . 3
- , 0 . 5 I .... I l I . . . . r ,
16 17 18 19 20 21 22 23
CYCLES Fig. 3. Not of N-S asymmetry of flare index (AFI) and sudden disappearances (ASD) versus solar cycles. (ASD values adopted from Vizoso and Ballester, 1987.)
We have also found that the asymmetry curve of the flare index is not in phase with the solar activity cycle and that the asymmetry curve peaks at, or around, the solar minimum. Figure 4 shows the asymmetry values which correspond to the minimum and maximum years of sunspot activity, with 'm' denoting solar activity minima.
The solar flare-index asymmetry curve shows some kind of periodic behaviour as seen in Figure 1. During each solar cycle considered in this study, the activity is observed to be more important in one hemisphere during the ascending part while it becomes more important in the other hemisphere during the descending part. Vizoso and Ballester (1990) also showed a change, after every four cycles, in the slope of the regression lines fitted to the yearly values of the N - S asymmetry of sunspots areas for the solar cycles 12 to 21. Thus, we have seen that two different solar phenomena show the same characteristic change, suggesting a long-term periodic behaviour in the N - S asymmetry of around eight cycles. According to this suggestion, if the period of 80 years is real, we can expect that the behaviour of the flare index asymmetry in the current cycle, shown in Figure 1, will be maintained during cycle 23.
We find that the AFI series for cycles 17 to 21 may be approximated by a third-order polynomial. To do this, we smoothed our data with a 5-point window and applied a chi-square (X 2) test to show the goodness of the best fit. If the fitting

NORTH-SOUTH ASYMMETRY IN THE SOLAR FLARE INDEX 207
1.0
0.5 k~
0.0
- 0 . 5
- 1 . 0
- 1 . 5 1 9 3 0
/'~ ~
\ ,,' v/\. 't\
\ I
\ /
~1 . . . . 4.NPr
m m m i n r ~ , . . , l , , . , I , , , , I , I , , I , , , , I , , , , f , , . ,
1940 19:50 1960 1970 1980 1990 ZOO0
T I M E ( Y e a r )
Fig. 4. The N - S asymmetry of flare index (AFI) and sudden disappearances of solar filaments (ASD). Only the asymmetry values of minima and maxima for each cycle are plotted. The years of minima and maxima are derived from the sunspots activity time series ( 'm' denotes solar activity minima).
1 .0
~ - 0 . 0
t, - - F i t t e d /" * ~ ~ S m o o t h e d
I~ t s t J\,,_ . . . . . . O b s e r v e d I
,~, ! %
t , i ~ /' , i t
" , , i, ,', t , �9 ~t', al ii,i ! i ~:. tl
~ , ~ ~ :~ ,- '~. ~ ,; l'}~,', ' # ,
| I t I
I ! | | II
- - 1 . 0 ~ ~ I r I
95o 98o J.9 o o9o zooo
Time (year) Fig. 5. Plot of the yearly mean (dashed line) and 5-point window smoothed (dashed line with symbols) flare index asymmetry series between the years 1936 to 1993 versus time. The continuous line corresponds to the fit of a third-order polynomial.

208 TAMER ATA~ AND ATiLA 0ZGr0~
function is a good approximation to the parent function, then the estimated variance S 2 should agree well with the parent variance 02, and the value of reduced X 2 should be approximately unity (X 2 = 1). In our case, the chi-square test indicates that the best fit is a cubic, but there is a small differences in the respect to the first- and second-order polynomials. The shape of the third-order polynomial indicates that the solar activity has become more important in the southern hemisphere during the current solar cycle 22. The above results confirm those reported by Carbonell, Oliver, and Ballester (1993). They have also stated that the form of the underlying trend of sunspot-area asymmetry index indicates the possibility of a shift from north-dominant asymmetry to south-dominant in cycle 23.
Acknowledgements
The authors would like to thank to Drs H. E. Coffey and E. H. Erwin of WDC-A for Solar-Terrestrial Physics, NOAA E/GC2, Broadway 325, Boulder, CO, who made available the grouped flare lists.
References
Ata~, T.: 1987, Astrophys. Space Sci. 135, 201. Ball, E.: 1955, Ann. Astrophys. 18 (No. 2), 118. Carbonell, M., Oliver, R., and Ballester, J. L.: 1993, Astron. Astrophys. 274, 497. Garcia, H.: 1990, Solar Phys. 127, 185. Gleissberg, W.: 1947, Publ. Istanbul University Observatory, No. 31. Kleczek, J.: 1952, Publ. Inst. Centr. Astron., No. 22, Prague. Kleczek, J.: 1953, Publ. Astrophys. Obs. Czech. Acad. Sci. No. 24, Prague. Kno~ka, S.: 1985, Contrib. Astron. Obs. Skalnat~ Pleso 13, 217. Knogka, S. and Letfus, V.: Catalogue of Activity of Solar Flares 1950-1965 (unpublished). Kno~ka, S. and Petrfisek, J.: 1984, Contr. Astron. Obs. SkalnaM Pleso 12, 165. Oliver, R. and Ballester, J. L.: 1994, Solar Phys. 152, 481. Roy, J. R.: 1977, Solar Phys. 52, 53. Swinson, D. B., Koyoma, H., and Saito, T.: 1986, SolarPhys. 106, 35. Verma, V. K.: 1987, Solar Phys. 114, 185. Verma, V. K.: 1993, Astrophys. J. 403, 797. Verma, V. K., Pande, M. C., and Uddin, W.: 1987, SolarPhys. 112, 341. Vizoso, G. and Ballester, J. L.: 1987, Solar Phys. 112, 317. Vizoso, G. and Ballester, J. L.: 1990, Astron. Astrophys. 229, 540. Waldmeier, M.: 1957, Z. Astrophys. 43, 149. Waldmeier, M.: 1971, Solar Phys. 29, 232. Yadav, R. S. and Badruddin S. Kumar: 1980, Indian J. Radio Space Phys. 9, 155.