north slope allowable drill rig operation through … drill rig operation through modeling and...
TRANSCRIPT
North Slope Allowable Drill Rig Operation through Modeling and Monitoring Drill Rig Policy Working Group
August 1, 2014
July 28, 2014

Issues Background
Status
• Existing monitoring data indicates with reasonable
assurance that the NAAQS/AAAQS are protected with
electrified drill rigs (ADEC) and, we believe, sufficiently for
all rigs.
• A monitoring study is being undertaken to collect more data
in the near-field of an electrified drill rig but also collect data
in the near-field of diesel-fired drill rig.
• “Monte Carlo” dispersion modeling has been undertaken to
provide modeling results, that within guardrails, can also
demonstrate compliance with the NAAQS/AAAQS.
August 1, 2014 Drill Rig Policy Working Group Page 3
Standard Modeling
Where we have been…..
• MG1
– Considerable modeling has been conducted with the generic MG1
simulation using:
• various stack heights.
• various control technologies and in-stack ratios.
• both OLM and PVMRM and various ambient ozone assumptions.
• Model predicted impacts ranged from 2 to 3 times the
1-hour NO2 NAAQS.
– Performance evaluation with AERMOD indicated it could both under
and over-predict.
August 1, 2014 Drill Rig Policy Working Group Page 4
Performance Evaluation
August 1, 2014 Drill Rig Policy Working Group Page 5
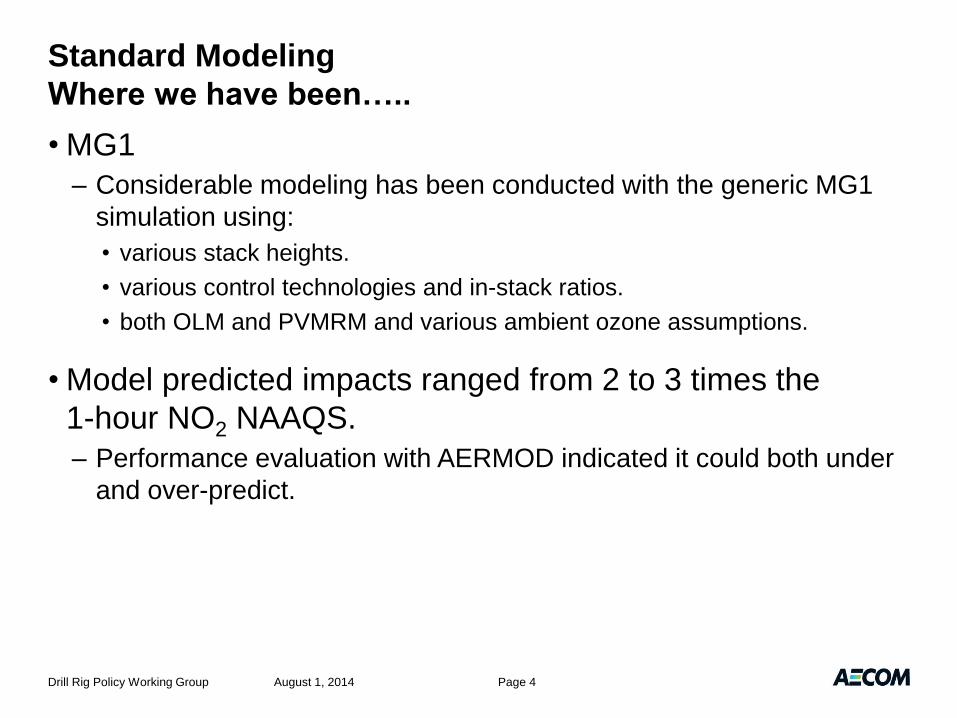
• Modeled the CD3 rig monitoring program
– AERMOD performance sometimes, but not all the time, reasonable,
contrary to permit modeling.
– This study shows modeling should be useful - provided a better job
can be done mirroring reality.
• This suggests re-evaluate the simulation and trying a Monte-Carlo
approach to account for periods the well site is empty.

Modeling
Revaluating Simulation
• MG1 = Son of Franken-Rig:
– REV = Revisited MG1 drill rig simulation.
• MG1 includes small portable sources questionably inflating
the model output:
August 1, 2014 Drill Rig Policy Working Group Page 6
Source Type No. Rating Height (m) Temp. (K) Velocity (m/s) Dia. (m)
Waste Oil Burner 1 0.5 MMBtu/hr 12.2 461 9.14 0.457
Small Heaters 4 0.6 MMBtu/hr 1.8 461 9.14 0.051
Source QMG1/Qrev
Hs/Hbldg Ts (K) Vs (m/s) Ds (m)
MG1 REV MG1 REV MG1 REV MG1 REV
Primary Engines 0.98 0.8 1.6 728 783 43.6 71.1 0.31 0.25
Lg. Utility Engines 2.26 0.8 1.4 589 789 39.6 60.5 0.34 0.20
Sm. Utility Engines 4.54 0.7 1.8 589 872 39.6 77.5 0.31 0.15
Boiler/Heaters 0.49 0.8 1.4 478 505 18.3 9.1 0.31 0.31
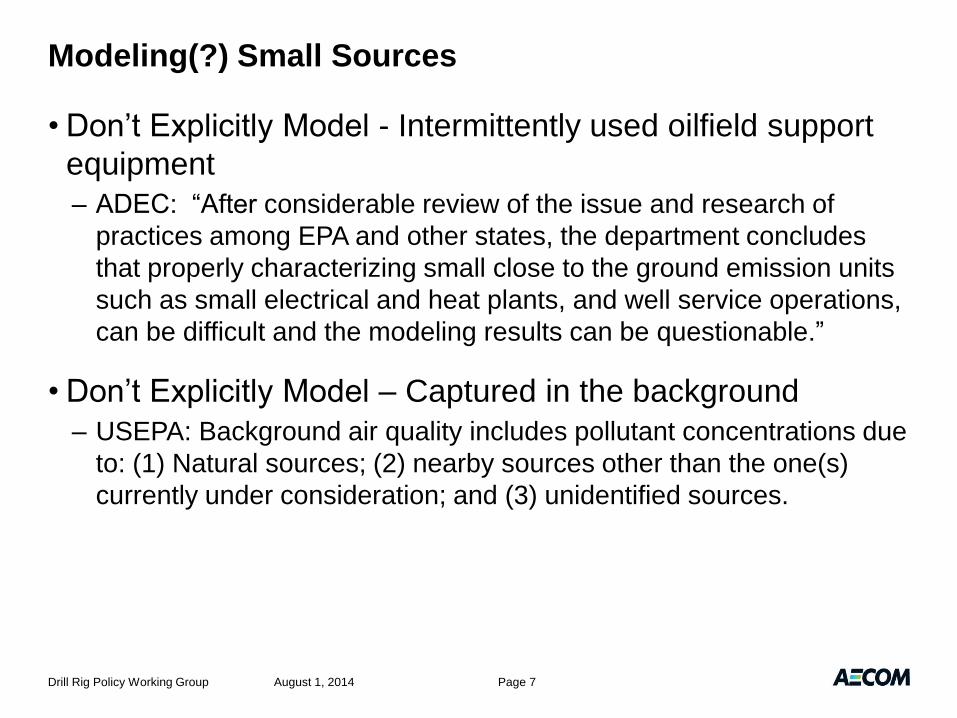
Modeling(?) Small Sources
• Don’t Explicitly Model - Intermittently used oilfield support
equipment
– ADEC: “After considerable review of the issue and research of
practices among EPA and other states, the department concludes
that properly characterizing small close to the ground emission units
such as small electrical and heat plants, and well service operations,
can be difficult and the modeling results can be questionable.”
• Don’t Explicitly Model – Captured in the background
– USEPA: Background air quality includes pollutant concentrations due
to: (1) Natural sources; (2) nearby sources other than the one(s)
currently under consideration; and (3) unidentified sources.
August 1, 2014 Drill Rig Policy Working Group Page 7

The Answer
• Monitoring:
– Building evidence from monitoring that indicates impacts from drilling
activities do not violate the NAAQS/AAAQS.
• Modeling:
– Refine the MG1 generic simulation.
– TRANSVAP to refine standard modeling approach results.
– Represent difficult to simulate “small sources” with low releases with
an appropriate background.
• Reasonable assurance across a range of activities that
drilling operations do not violate the NAAQS/AAAQS.
August 1, 2014 Presentation Title Page 8

State of the Proposal North Slope Focus
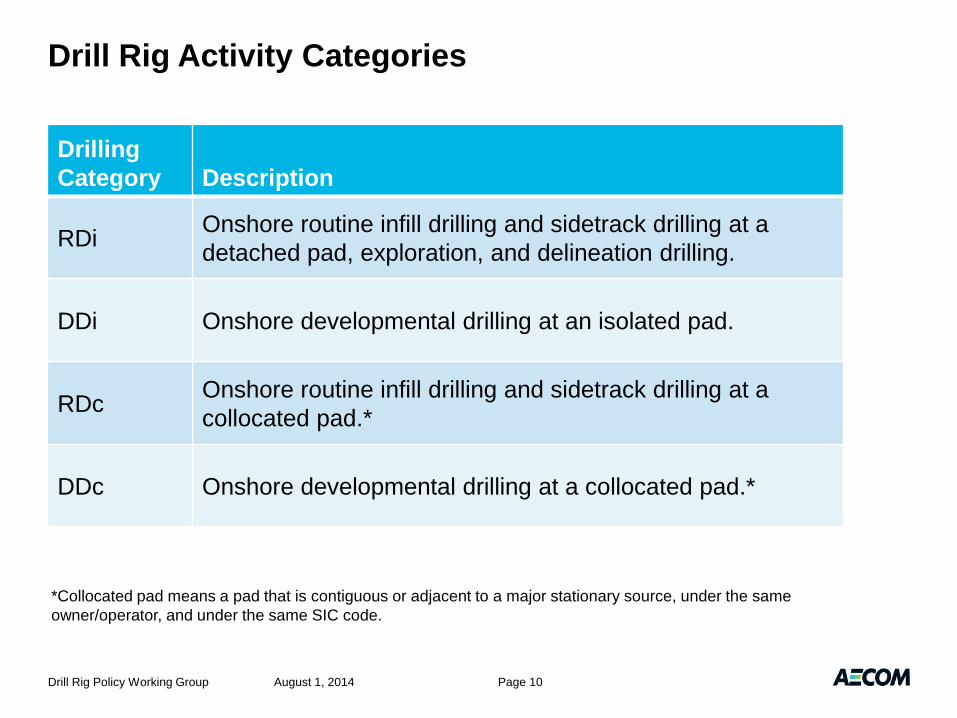
Drill Rig Activity Categories
August 1, 2014 Drill Rig Policy Working Group Page 10
Drilling
Category Description
RDi Onshore routine infill drilling and sidetrack drilling at a
detached pad, exploration, and delineation drilling.
DDi Onshore developmental drilling at an isolated pad.
RDc Onshore routine infill drilling and sidetrack drilling at a
collocated pad.*
DDc Onshore developmental drilling at a collocated pad.*
*Collocated pad means a pad that is contiguous or adjacent to a major stationary source, under the same
owner/operator, and under the same SIC code.

Drill Rig Activity Categories
August 1, 2014 Drill Rig Policy Working Group Page 11
Drilling
Category Frequency
RDi Very Common
FOCUS
DDi Occasional
RDc Uncommon
Alaska-Specific
DDc Rare

Overview of Proposed Allowable Operation
Electrification – Based on Monitoring Data
August 1, 2014 Drill Rig Policy Working Group Page 12
Drilling
Category
Allowable
Operation
RDi
Unrestricted Operation
DDi
RDc
DDc

Overview of Proposed Acceptable Operation
No Electrification - Based on Modeling (TRANSVAP)
August 1, 2014 Drill Rig Policy Working Group Page 13
Drilling
Category Region Nominal Fuel Consumption
RDi ANS ≤ 20,300 gal/day
DDi ANS ≤ 12,200 gal/day
RDc ANS ≤ 15,400 gal/day
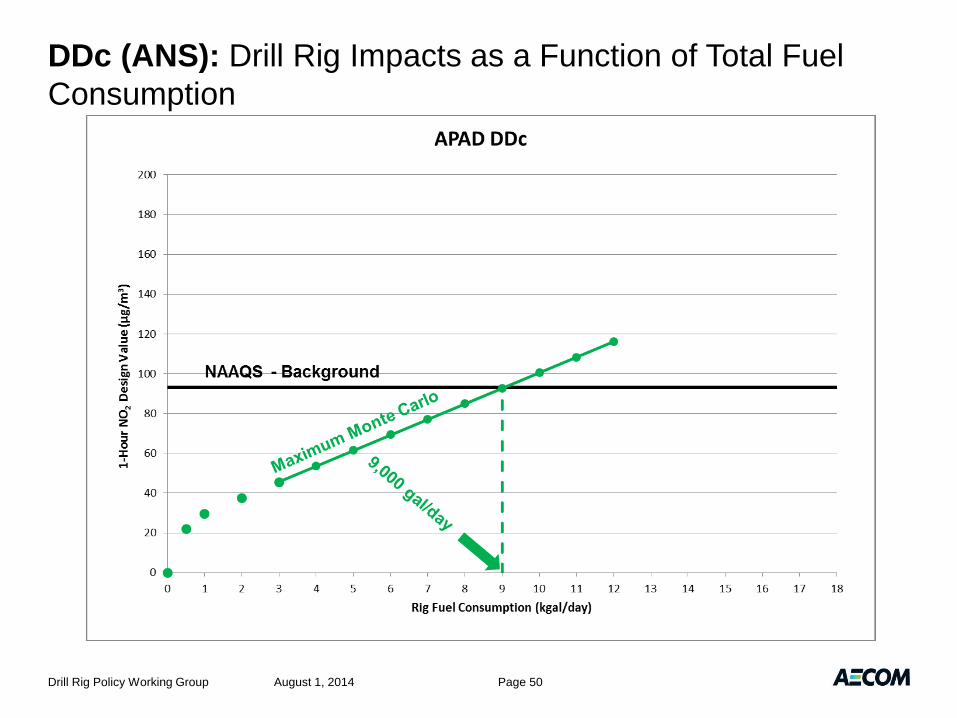
DDc ANS ≤ 9,000 gal/day
ANS = A-Pad Met. – Alaska North Slope
• Nominal Fuel Consumption ≠ Not-to-Exceed:
–Modeling indicates periodic excursions above nominal fuel
consumption do not alter conclusions.

Understanding TRANSVAP Routine Drilling Scenario

Available Modeling Approaches
• Standard Modeling: (Unrealistically Conservative)
– Place a drill rig on a wellsite for 5 years and simulate the impacts to
demonstrate compliance with a standard based on a 3-year average.
• Does not account for inactive periods = unrealistically conservative
• Standard Modeling Refinement: (Incomplete)
– Place a drill rig on a wellsite for 5 years according to a fixed, single
proposed drilling schedule.
• Accounts for inactive periods, but there is no such thing as a fixed schedule – drill
rigs often deviate from plan due to necessary changes in the drilling schedule.
• TRANSVAP (Monte Carlo) Modeling:
(Conservatively Representative)
– Model thousands of randomly generated drilling schedules over 5 years and
demonstrate compliance with the worst-case of thousands of impacts.
• Accounts for inactive periods and accounts for unpredictable drilling schedules.
• Results in thousands of individual compliance demonstrations covering the full
range of possibilities.
August 1, 2014 Page 15 Drill Rig Policy Working Group

Standard Modeling Approach: (Graphical)
• Model 1 multi-year period, get 1 result to compare with the NAAQS.
• Assume all drill rig emission units operate at maximum fuel
consumption, or permit restricted rates (11.6 g/s), all the time.
August 1, 2014 Drill Rig Policy Working Group Page 16
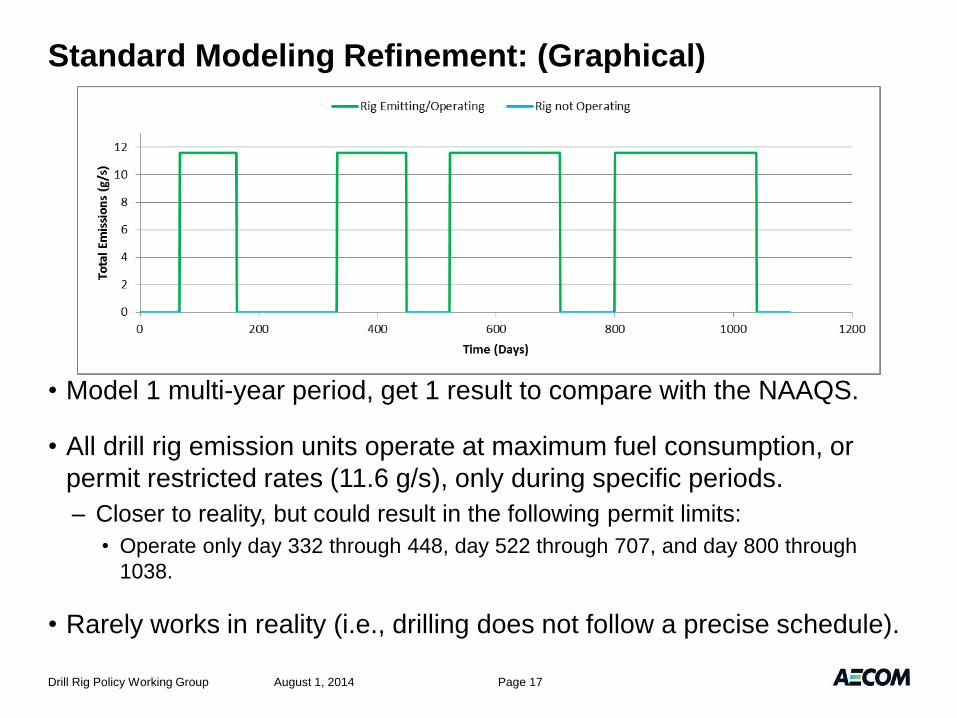
Standard Modeling Refinement: (Graphical)
• Model 1 multi-year period, get 1 result to compare with the NAAQS.
• All drill rig emission units operate at maximum fuel consumption, or
permit restricted rates (11.6 g/s), only during specific periods.
– Closer to reality, but could result in the following permit limits:
• Operate only day 332 through 448, day 522 through 707, and day 800 through
1038.
• Rarely works in reality (i.e., drilling does not follow a precise schedule).
August 1, 2014 Drill Rig Policy Working Group Page 17

TRANSVAP (Monte Carlo) Modeling: (Graphical)
• Model 10,000 multi-year periods, get 10,000 results – select the highest.
– Each modeled period represents a distinct randomly chosen operation scenario.
• All drill rig emission units operate at maximum fuel consumption, or
permit restricted rates (11.6 g/s) when the drill rig operates.
– Much closer to reality – statistically, one of the 10,000 scenarios is
worst-case reality.
August 1, 2014 Drill Rig Policy Working Group Page 18

Characterizing TRANSVAP Impacts
• How to characterize thousands of compliance demonstrations…
– The maximum impact from among 10,000 runs?
– A statistically significant impact from among the 10,000 runs
(i.e., 2 standard deviations above the mean)?
– The average impact from among the 10,000 runs?
August 1, 2014 Page 19 Drill Rig Policy Working Group
Avoid the
question, select
the most
conservative –
use the highest
value from among
10,000.

Is TRANSVAP Still Conservative?
YES
• Results are predicted with AERMOD
– TRANSVAP only recombines AERMOD results once predicted.
• Results are predicted assuming all emission units operate at the same
time.
• Decisions are based on the maximum from among 10,000 impacts,
making this as conservative as possible.
• Depending on activity frequency, results converge in 1,000’s of
iterations; therefore, 10,000 iterations yields a robust analysis.
– Convergence of results gives assurance that the maximum impacts are
predicted.
August 1, 2014 Drill Rig Policy Working Group Page 20
Application of TRANSVAP for ANS Drill Rig Simulation
• Modeling based on AERMOD with TRANSVAP as a postprocessor to
simulate drilling activities for the following drilling activity categories:
– routine drilling (RD)
– developmental drilling (DD)
• The following discussion will focus on the application of this method
for the Alaska North Slope (ANS) RD followed by modeling for DD.
– Results for RDi, RDc, DDi and DDc are developed by applying the appropriate
background concentration to the modeling.
• If the approach is acceptable to the Technical Working Group, it can
be used to develop modeling for other geographic regions in the state.
August 1, 2014 Page 21 Drill Rig Policy Working Group
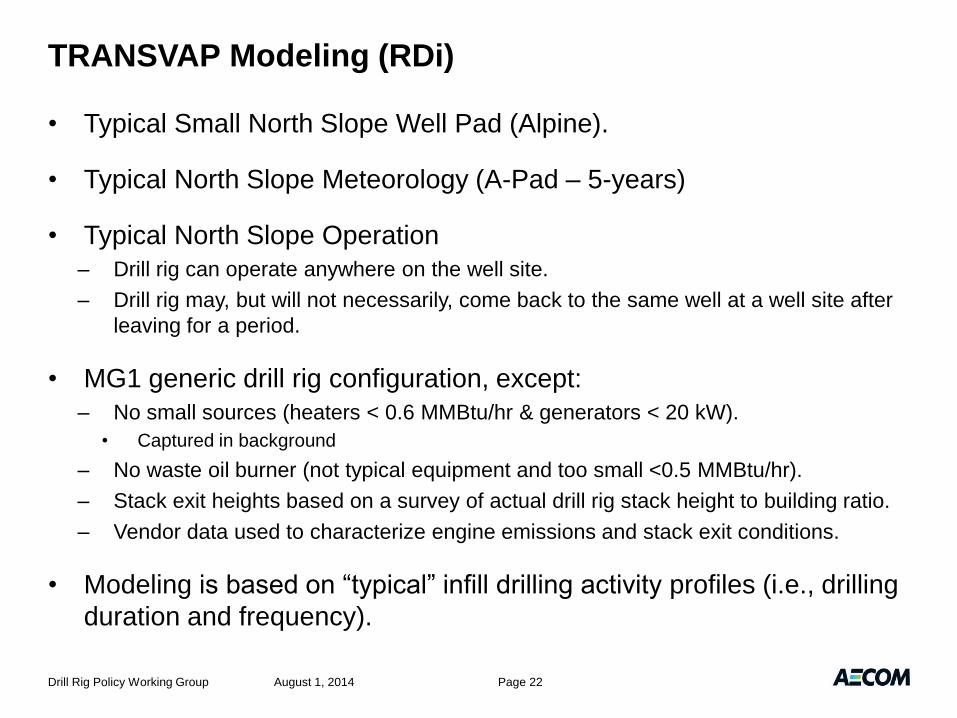
TRANSVAP Modeling (RDi)
• Typical Small North Slope Well Pad (Alpine).
• Typical North Slope Meteorology (A-Pad – 5-years)
• Typical North Slope Operation
– Drill rig can operate anywhere on the well site.
– Drill rig may, but will not necessarily, come back to the same well at a well site after
leaving for a period.
• MG1 generic drill rig configuration, except:
– No small sources (heaters < 0.6 MMBtu/hr & generators < 20 kW).
• Captured in background
– No waste oil burner (not typical equipment and too small <0.5 MMBtu/hr).
– Stack exit heights based on a survey of actual drill rig stack height to building ratio.
– Vendor data used to characterize engine emissions and stack exit conditions.
• Modeling is based on “typical” infill drilling activity profiles (i.e., drilling
duration and frequency).
August 1, 2014 Page 22 Drill Rig Policy Working Group
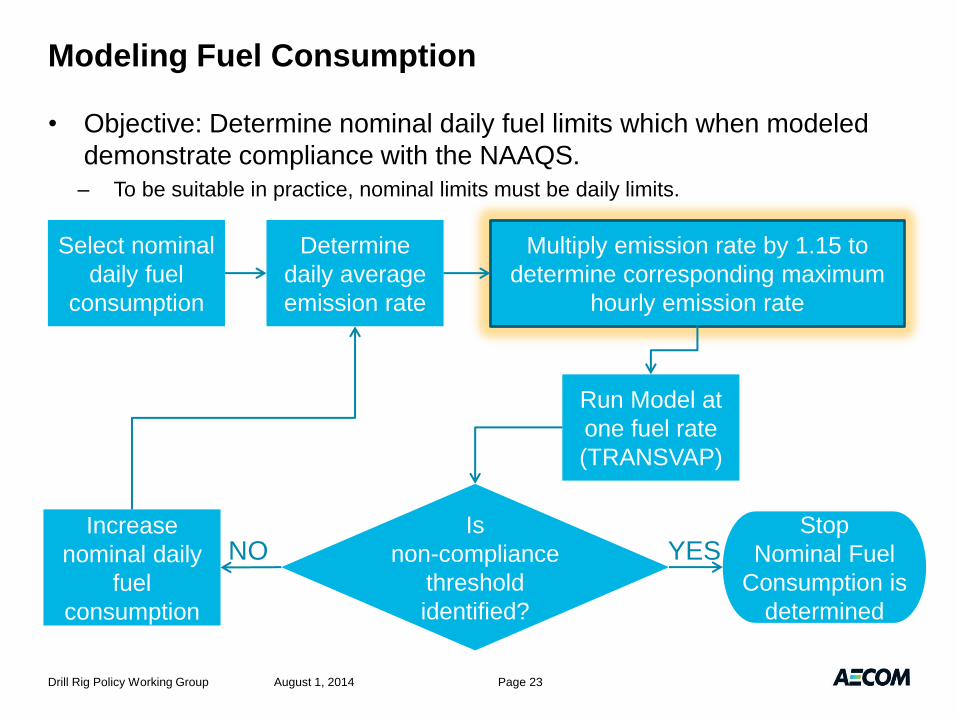
Modeling Fuel Consumption
• Objective: Determine nominal daily fuel limits which when modeled
demonstrate compliance with the NAAQS.
– To be suitable in practice, nominal limits must be daily limits.
August 1, 2014 Page 23 Drill Rig Policy Working Group
Select nominal
daily fuel
consumption
Determine
daily average
emission rate
Multiply emission rate by 1.15 to
determine corresponding maximum
hourly emission rate
Run Model at
one fuel rate
(TRANSVAP)
Is
non-compliance
threshold
identified?
Increase
nominal daily
fuel
consumption
Stop
Nominal Fuel
Consumption is
determined
NO YES
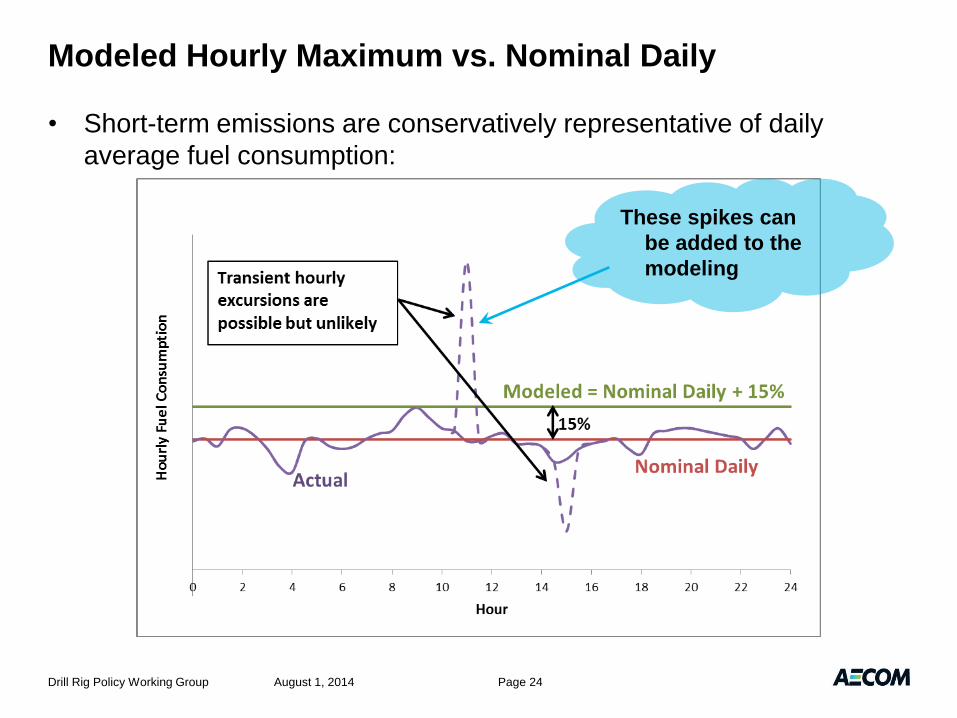
Modeled Hourly Maximum vs. Nominal Daily
• Short-term emissions are conservatively representative of daily
average fuel consumption:
August 1, 2014 Page 24 Drill Rig Policy Working Group
These spikes can
be added to the
modeling

Chemical Transformation
• PVMRM NO to NO2 chemistry using standard worst-case ambient
ozone data from A-Pad.
• In-Stack Ratios from USEPA database:
– Engines: 0.15
– Heaters/Boilers: 0.30
August 1, 2014 Page 25 Drill Rig Policy Working Group
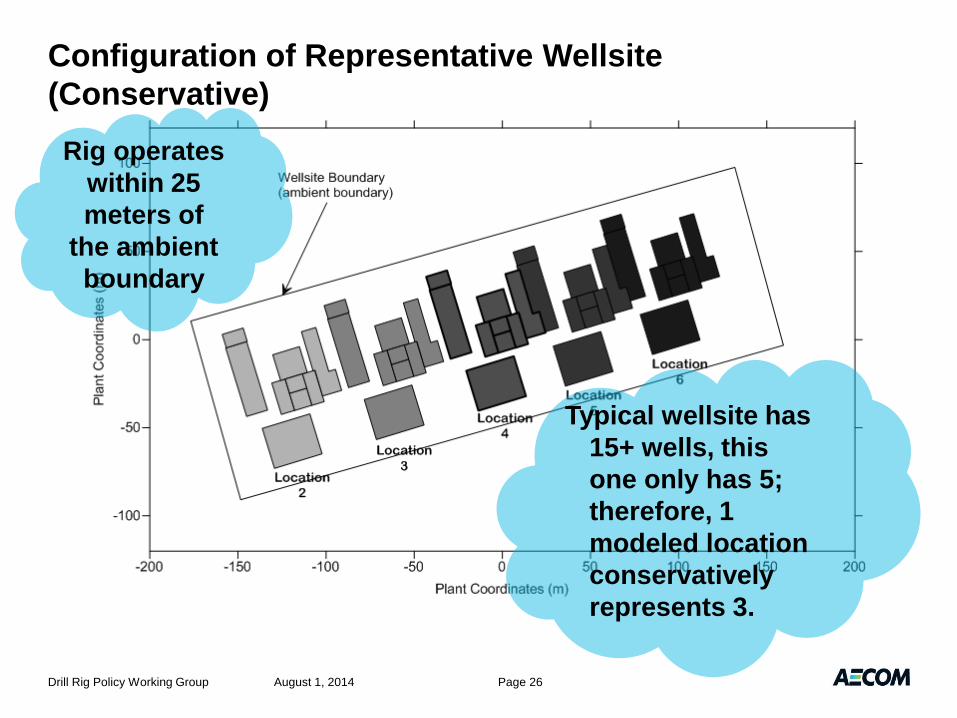
Configuration of Representative Wellsite
(Conservative)
August 1, 2014 Page 26 Drill Rig Policy Working Group
Rig operates
within 25
meters of
the ambient
boundary
Typical wellsite has
15+ wells, this
one only has 5;
therefore, 1
modeled location
conservatively
represents 3.

Configuration of Representative Drill Rig
(Conservative & Generic)
August 1, 2014 Page 27 Drill Rig Policy Working Group
4 Heaters/Boilers (ST1_2) 21.6 m
Primary Engines,
Large Utility
Engines and
Heaters/Boiler
stacks are
collocated.
Rig Inventory
• Four Emission Unit Categories (Tier 0):
– Primary Engines – Large (>600 bhp) diesel-fired reciprocating
internal combustion engines (RICE) used for power generation.
• Power is produced primarily for running the rig top-drive or rotary table and
draw-works, but also for lighting and heat.
– Large Utility Engines – Large (>600 bhp) diesel-fired RICE used for
miscellaneous power generation or in mechanical service driving
mud pumps, cement pumps or grind and inject units.
– Small Utility Engines – Small (<<600 bhp) diesel-fired RICE used
for miscellaneous portable power generation.
– Boilers/Heaters – Diesel-fired boilers and air heaters used to
provide general utility heat to the drill rig.
August 1, 2014 Drill Rig Policy Working Group Page 28
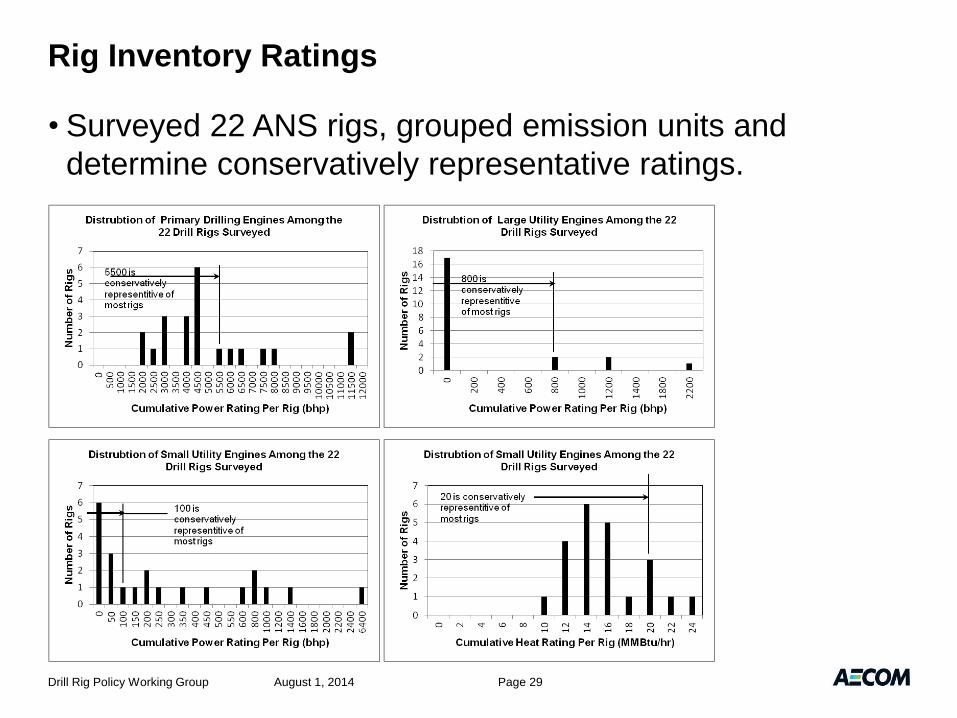
Rig Inventory Ratings
• Surveyed 22 ANS rigs, grouped emission units and
determine conservatively representative ratings.
August 1, 2014 Drill Rig Policy Working Group Page 29
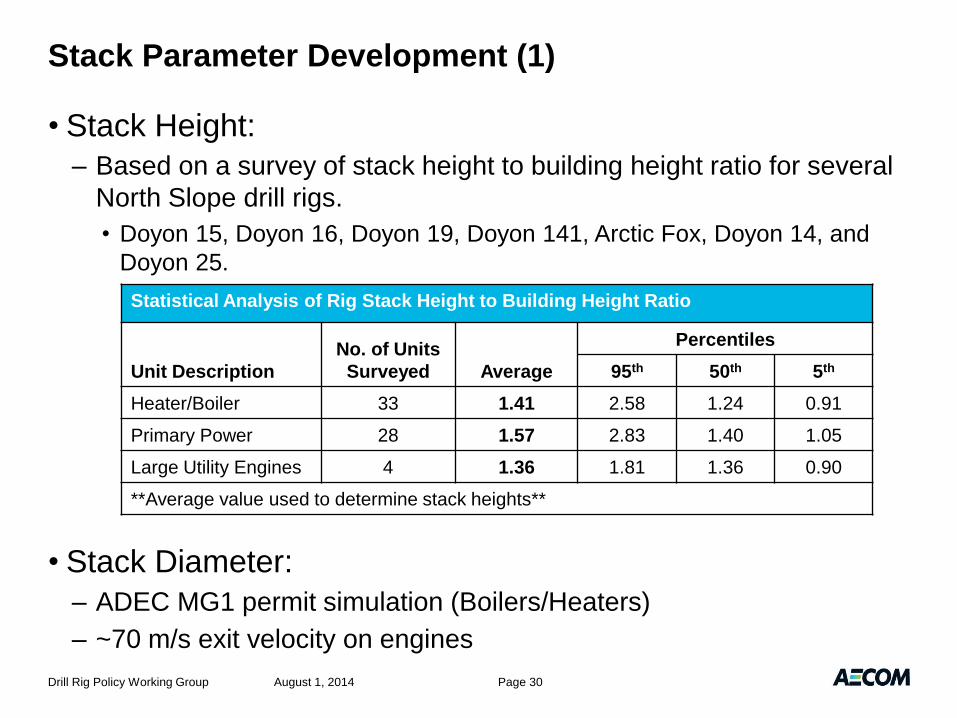
Stack Parameter Development (1)
• Stack Height:
– Based on a survey of stack height to building height ratio for several
North Slope drill rigs.
• Doyon 15, Doyon 16, Doyon 19, Doyon 141, Arctic Fox, Doyon 14, and
Doyon 25.
• Stack Diameter:
– ADEC MG1 permit simulation (Boilers/Heaters)
– ~70 m/s exit velocity on engines
August 1, 2014 Drill Rig Policy Working Group Page 30
Statistical Analysis of Rig Stack Height to Building Height Ratio
Unit Description
No. of Units
Surveyed Average
Percentiles
95th 50th 5th
Heater/Boiler 33 1.41 2.58 1.24 0.91
Primary Power 28 1.57 2.83 1.40 1.05
Large Utility Engines 4 1.36 1.81 1.36 0.90
**Average value used to determine stack heights**
Stack Parameter Development (2)
• Stack Exit Temperature:
– Engines: Representative vendor data
• CAT D399 (Primary Drilling Engines), CAT D379 (Large Utility Engines),
CAT 3406 (Small Utility Engines)
– Boilers/Heaters:
• ADEC MG1 permit simulation
• Flow Rate:
– Engines: Representative vendor data
• CAT D399 (Primary Drilling Engines), CAT D379 (Large Utility Engines),
CAT 3406 (Small Utility Engines)
– Boilers/Heaters:
• F Factor (scf/MMBtu) approach based on Appendix A-7 to Part 60—Test
Methods 19 through 25E, Method 19
August 1, 2014 Drill Rig Policy Working Group Page 31

Final Stack Parameters
August 1, 2014 Drill Rig Policy Working Group Page 32
Source
Description
Controlling
Struc. Hgt.
(m)
Stack
Height
(m)
Temp.
(K)
Exit
Velocity
(m/s)
Diameter
(m)
In-Stack
Ratio
Primary Drilling
Engines 15.2 23.9 783 71.1 0.254 0.15
Large Utility
Engines 15.2 20.7 789 60.5 0.203 0.15
Small Utility
Engines 15.2 27.5 872 77.5 0.152 0.15
Heater/Boilers 15.2 21.6 505 9.10 0.305 0.30
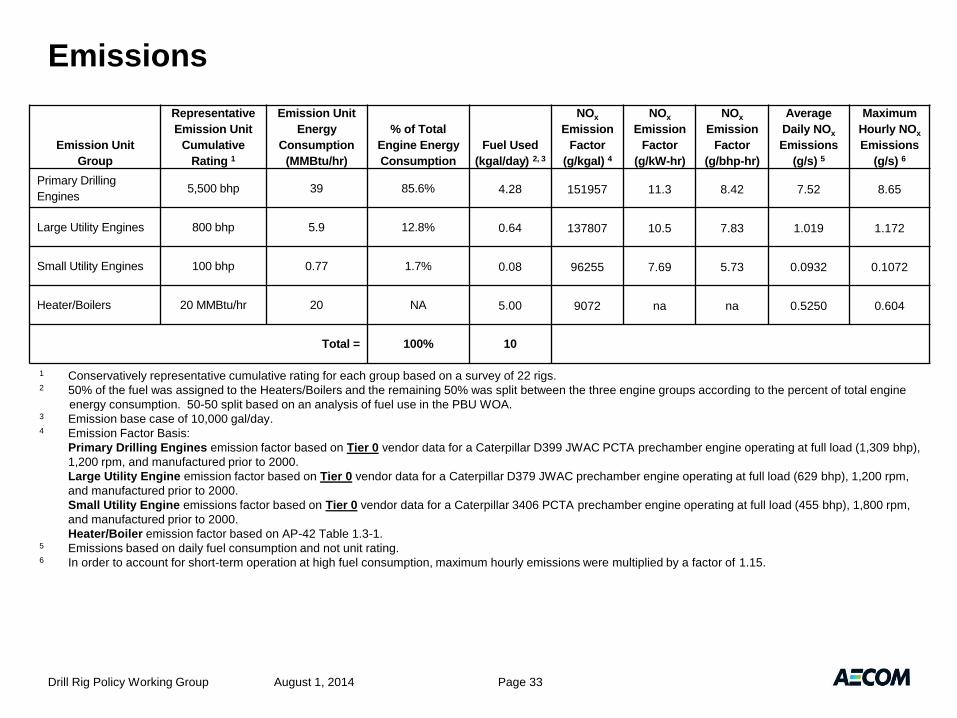
Emissions
August 1, 2014 Drill Rig Policy Working Group Page 33
Emission Unit
Group
Representative
Emission Unit
Cumulative
Rating 1
Emission Unit
Energy
Consumption
(MMBtu/hr)
% of Total
Engine Energy
Consumption
Fuel Used
(kgal/day) 2, 3
NOx
Emission
Factor
(g/kgal) 4
NOx
Emission
Factor
(g/kW-hr)
NOx
Emission
Factor
(g/bhp-hr)
Average
Daily NOx
Emissions
(g/s) 5
Maximum
Hourly NOx
Emissions
(g/s) 6
Primary Drilling
Engines 5,500 bhp 39 85.6% 4.28 151957 11.3 8.42 7.52 8.65
Large Utility Engines 800 bhp 5.9 12.8% 0.64 137807 10.5 7.83 1.019 1.172
Small Utility Engines 100 bhp 0.77 1.7% 0.08 96255 7.69 5.73 0.0932 0.1072
Heater/Boilers 20 MMBtu/hr 20 NA 5.00 9072 na na 0.5250 0.604
Total = 100% 10
1 Conservatively representative cumulative rating for each group based on a survey of 22 rigs. 2 50% of the fuel was assigned to the Heaters/Boilers and the remaining 50% was split between the three engine groups according to the percent of total engine
energy consumption. 50-50 split based on an analysis of fuel use in the PBU WOA. 3 Emission base case of 10,000 gal/day. 4 Emission Factor Basis:
Primary Drilling Engines emission factor based on Tier 0 vendor data for a Caterpillar D399 JWAC PCTA prechamber engine operating at full load (1,309 bhp),
1,200 rpm, and manufactured prior to 2000.
Large Utility Engine emission factor based on Tier 0 vendor data for a Caterpillar D379 JWAC prechamber engine operating at full load (629 bhp), 1,200 rpm,
and manufactured prior to 2000.
Small Utility Engine emissions factor based on Tier 0 vendor data for a Caterpillar 3406 PCTA prechamber engine operating at full load (455 bhp), 1,800 rpm,
and manufactured prior to 2000.
Heater/Boiler emission factor based on AP-42 Table 1.3-1. 5 Emissions based on daily fuel consumption and not unit rating. 6 In order to account for short-term operation at high fuel consumption, maximum hourly emissions were multiplied by a factor of 1.15.

Developing Representative Routine Drill Rig Activity
Profiles
• Activity Data:
– Activities from 26 separate wellsites in the Prudhoe Bay Unit
Western Operating Area (PBU – WOA).
– 6.5 years of daily drill rig activity data.
– Drilling activity was occurring somewhere in the field 98.5% of the
time (i.e., 1,978 days).
– Only one of the wellsites had no activity during the period.
• Excluding this wellsite, the least active pad was active a total of 28 days.
• The most active pad was active a total of 686 days during the 6.5 year
period.
August 1, 2014 Drill Rig Policy Working Group Page 34
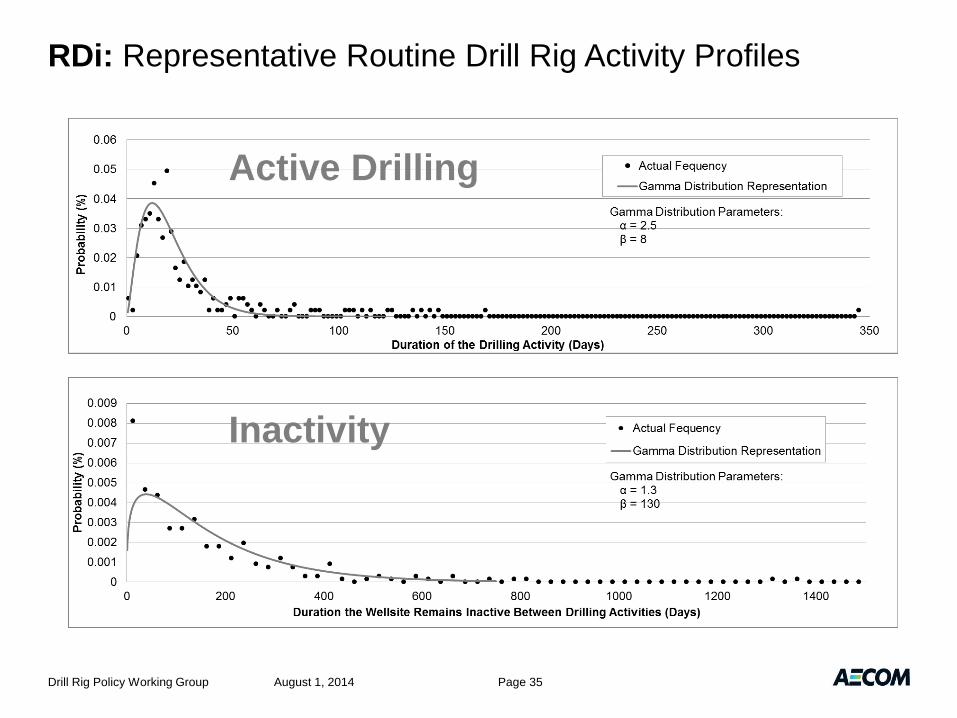
RDi: Representative Routine Drill Rig Activity Profiles
August 1, 2014 Page 35
Active Drilling
Inactivity
Drill Rig Policy Working Group
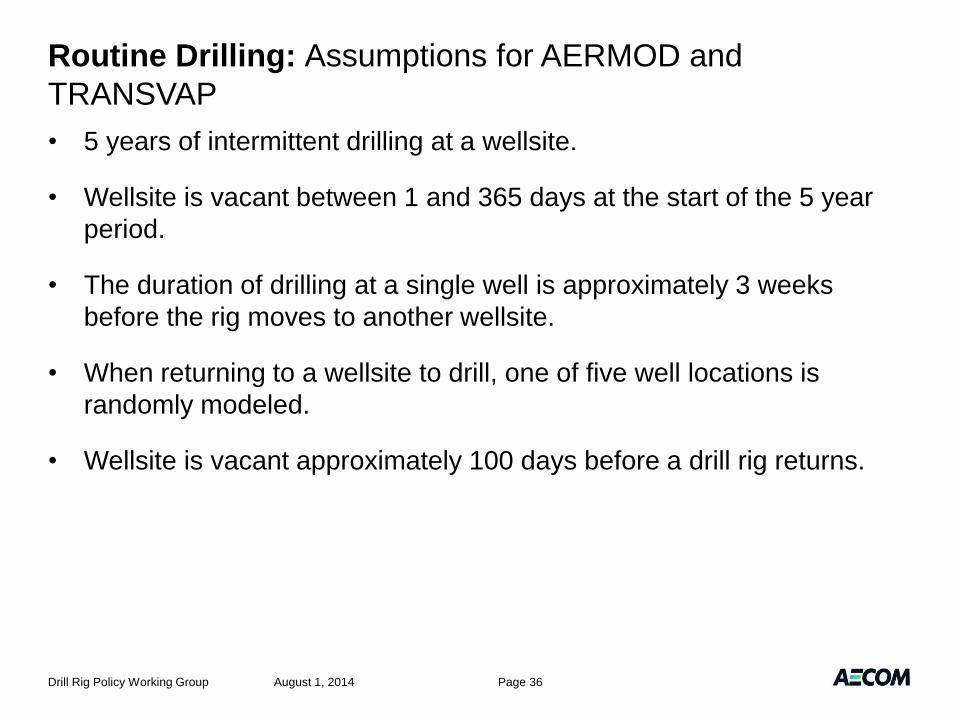
Routine Drilling: Assumptions for AERMOD and
TRANSVAP
• 5 years of intermittent drilling at a wellsite.
• Wellsite is vacant between 1 and 365 days at the start of the 5 year
period.
• The duration of drilling at a single well is approximately 3 weeks
before the rig moves to another wellsite.
• When returning to a wellsite to drill, one of five well locations is
randomly modeled.
• Wellsite is vacant approximately 100 days before a drill rig returns.
August 1, 2014 Page 36 Drill Rig Policy Working Group
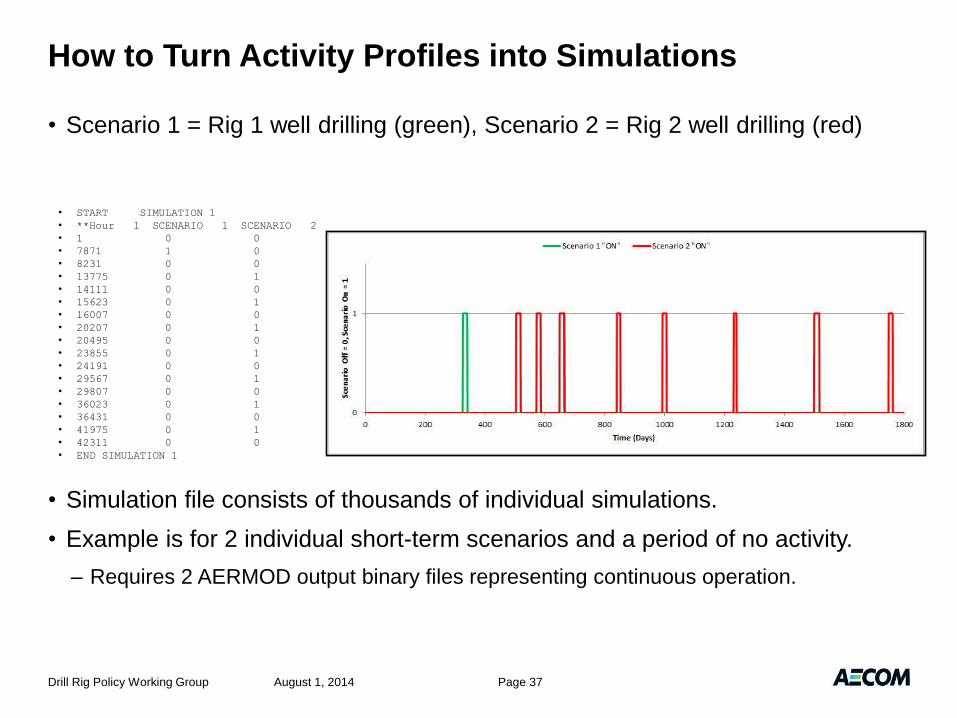
How to Turn Activity Profiles into Simulations
August 1, 2014 Drill Rig Policy Working Group Page 37
• Scenario 1 = Rig 1 well drilling (green), Scenario 2 = Rig 2 well drilling (red)
• Simulation file consists of thousands of individual simulations.
• Example is for 2 individual short-term scenarios and a period of no activity.
– Requires 2 AERMOD output binary files representing continuous operation.
• START SIMULATION 1
• **Hour 1 SCENARIO 1 SCENARIO 2
• 1 0 0
• 7871 1 0
• 8231 0 0
• 13775 0 1
• 14111 0 0
• 15623 0 1
• 16007 0 0
• 20207 0 1
• 20495 0 0
• 23855 0 1
• 24191 0 0
• 29567 0 1
• 29807 0 0
• 36023 0 1
• 36431 0 0
• 41975 0 1
• 42311 0 0
• END SIMULATION 1

How to Turn Activity Profiles into Simulations
• Create AERMOD output representing the modeled concentration for each
unique profile operating continuously.
August 1, 2014 Page 38 Drill Rig Policy Working Group
Rig 1 operating
continuously at full load
Rig 2 operating
continuously at full load
Nothing operating
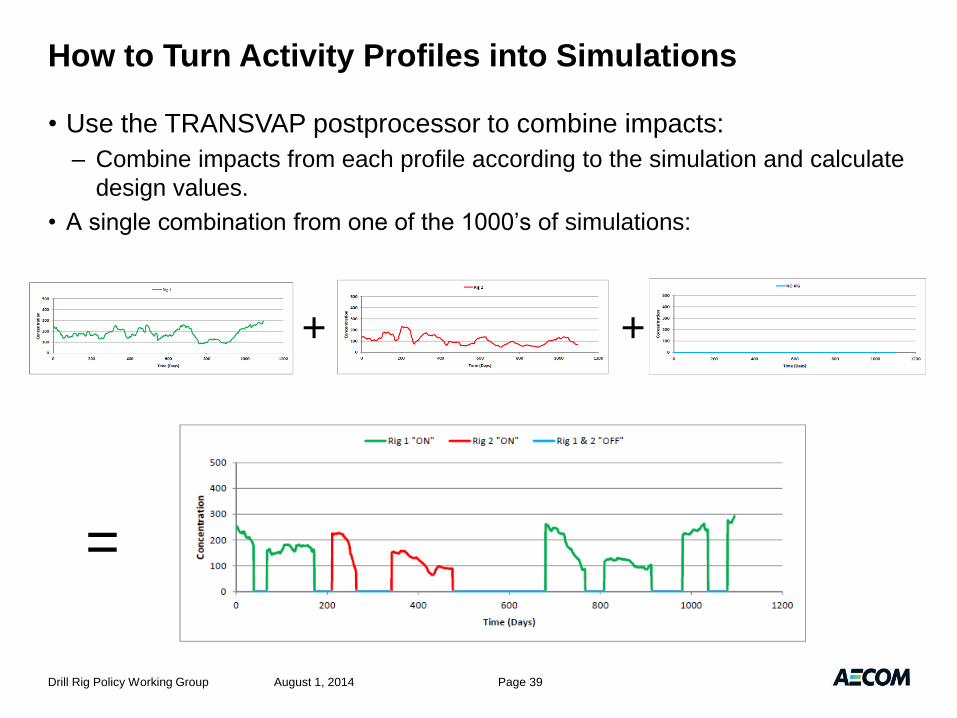
How to Turn Activity Profiles into Simulations
• Use the TRANSVAP postprocessor to combine impacts:
– Combine impacts from each profile according to the simulation and calculate
design values.
• A single combination from one of the 1000’s of simulations:
August 1, 2014 Page 39 Drill Rig Policy Working Group
+
=
+
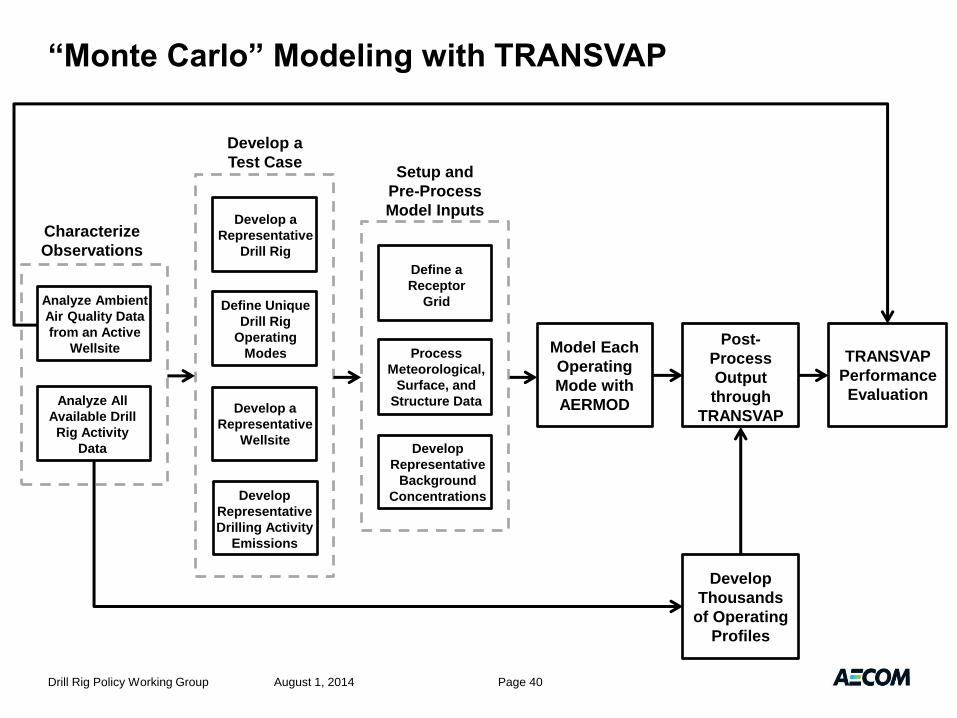
“Monte Carlo” Modeling with TRANSVAP
August 1, 2014 Page 40
Analyze Ambient
Air Quality Data
from an Active
Wellsite
Analyze All
Available Drill
Rig Activity
Data
Model Each
Operating
Mode with
AERMOD Develop a
Representative
Wellsite
Develop a
Representative
Drill Rig
Develop a
Test Case
Characterize
Observations
Setup and
Pre-Process
Model Inputs
Develop
Representative
Drilling Activity
Emissions
Process
Meteorological,
Surface, and
Structure Data
Define Unique
Drill Rig
Operating
Modes
Define a
Receptor
Grid
Develop
Representative
Background
Concentrations
Post-
Process
Output
through
TRANSVAP
Develop
Thousands
of Operating
Profiles
TRANSVAP
Performance
Evaluation
Drill Rig Policy Working Group

Results
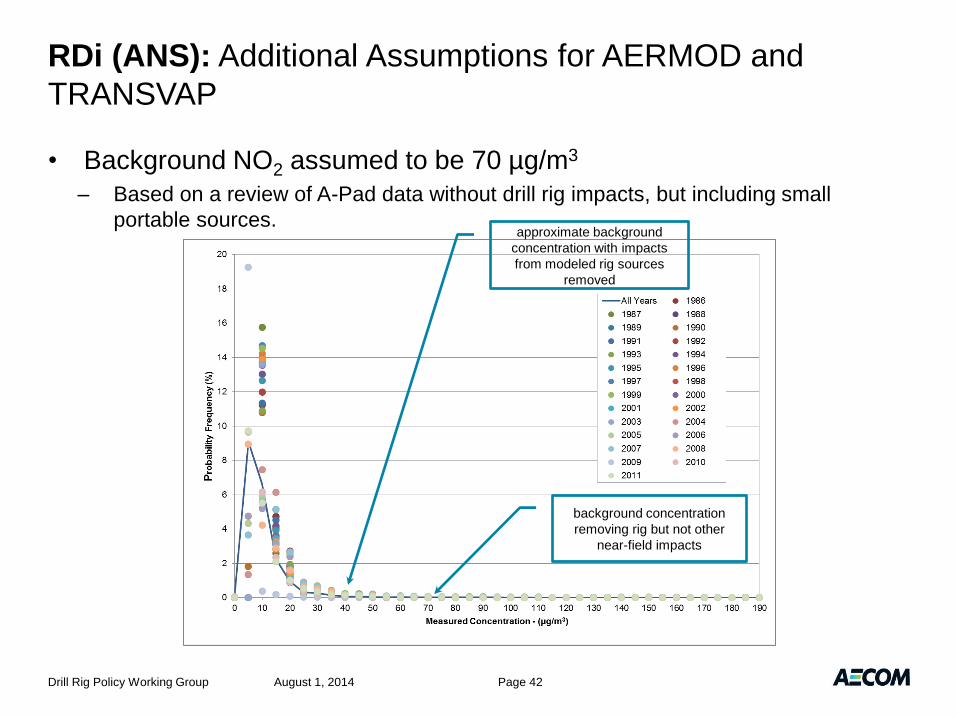
RDi (ANS): Additional Assumptions for AERMOD and
TRANSVAP
• Background NO2 assumed to be 70 µg/m3
– Based on a review of A-Pad data without drill rig impacts, but including small
portable sources.
August 1, 2014 Drill Rig Policy Working Group Page 42
approximate background
concentration with impacts
from modeled rig sources
removed
background concentration
removing rig but not other
near-field impacts

Representative Background NO2 Data from a A-Pad
August 1, 2014 Page 43 Drill Rig Policy Working Group
• Background should capture (1) natural sources, (2) far-field sources,
(3) on-site small equipment, and (4) other sources.
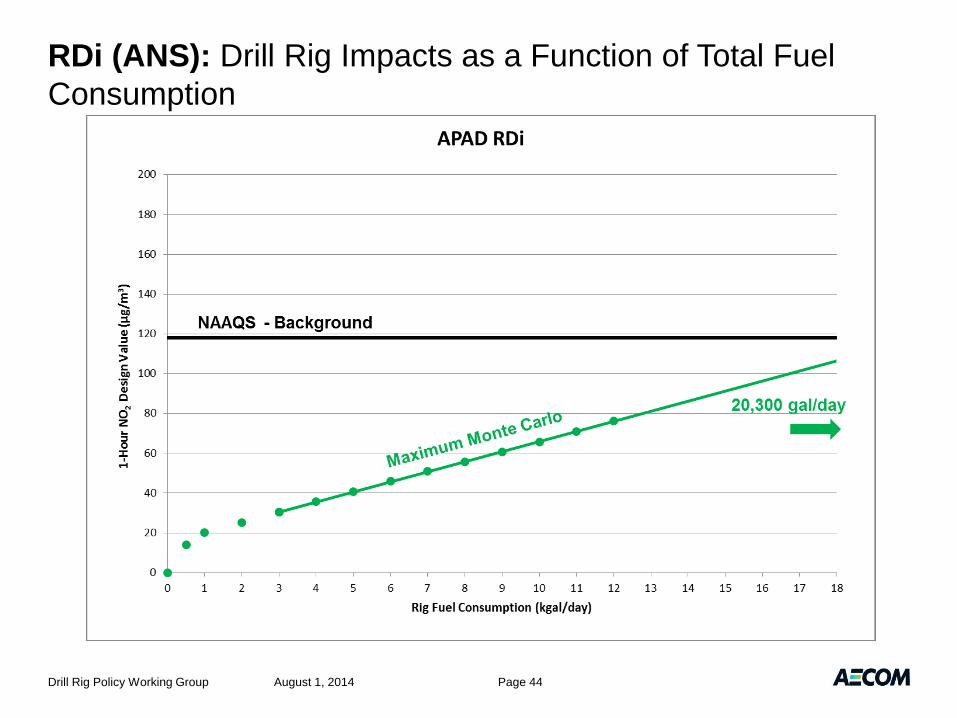
August 1, 2014 Page 44 Drill Rig Policy Working Group
RDi (ANS): Drill Rig Impacts as a Function of Total Fuel
Consumption
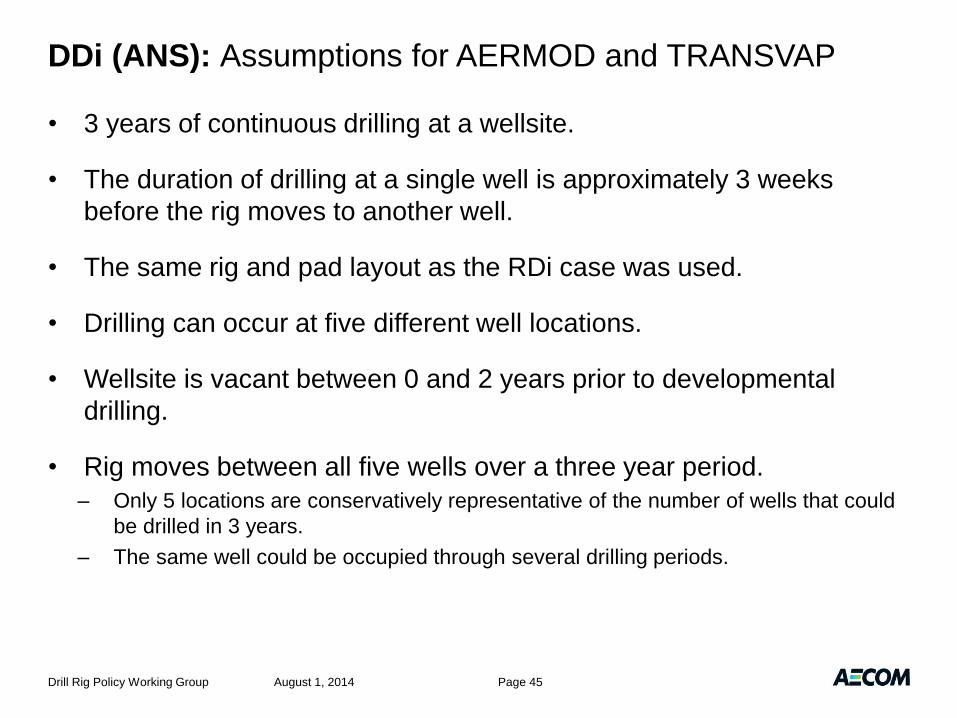
DDi (ANS): Assumptions for AERMOD and TRANSVAP
• 3 years of continuous drilling at a wellsite.
• The duration of drilling at a single well is approximately 3 weeks
before the rig moves to another well.
• The same rig and pad layout as the RDi case was used.
• Drilling can occur at five different well locations.
• Wellsite is vacant between 0 and 2 years prior to developmental
drilling.
• Rig moves between all five wells over a three year period.
– Only 5 locations are conservatively representative of the number of wells that could
be drilled in 3 years.
– The same well could be occupied through several drilling periods.
August 1, 2014 Page 45 Drill Rig Policy Working Group
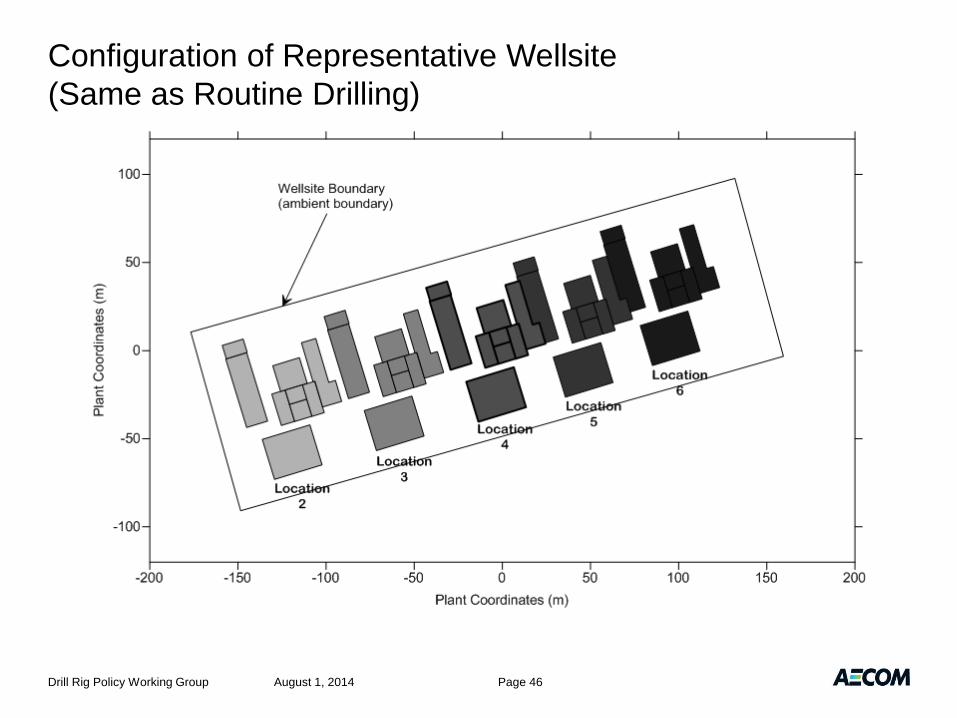
Configuration of Representative Wellsite
(Same as Routine Drilling)
August 1, 2014 Page 46 Drill Rig Policy Working Group
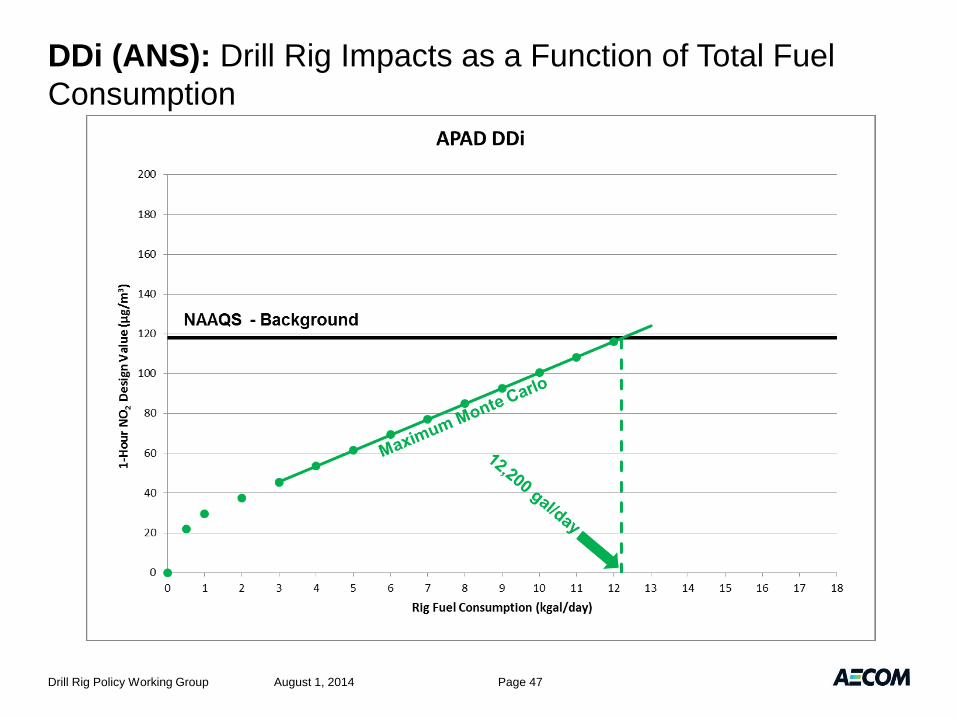
August 1, 2014 Page 47 Drill Rig Policy Working Group
DDi (ANS): Drill Rig Impacts as a Function of Total Fuel
Consumption

RDc and DDc (ANS): Assumptions for AERMOD and
TRANSVAP
• Same as RDi and DDi except a more conservative background has
been used to account for the impacts of non-modeled sources.
– Non-modeled sources include a major stationary source.
• Background NO2 assumed to be approximately 95 µg/m3
– Represents the 98th percentile of the annual distribution of daily maximum 1-hour
average concentrations based on 2013 data from the Alpine CD1 monitoring station.
– Small mobile sources and a large stationary source included in the background.
– Leaves 93 µg/m3 for the drilling operation.
• Modeled at several fuel consumption rates to compare to the NAAQS.
August 1, 2014 Page 48 Drill Rig Policy Working Group

August 1, 2014 Page 49 Drill Rig Policy Working Group
RDc (ANS): Drill Rig Impacts as a Function of Total Fuel
Consumption
August 1, 2014 Page 50 Drill Rig Policy Working Group
DDc (ANS): Drill Rig Impacts as a Function of Total Fuel
Consumption
ANS Allowable Operation - Summary
• Ambient Data = No Violations
• Historical Single Rig Activity:
– 3,000 gal/day = conservatively representative
– 7,000 gal/day = upper limit
– 10,000 gal/day = rare
– >10,000 gal day = anomalous/intermittent
• Electrification = no violation = all activities allowed
• RDi = 20,300 gal/day = no NAAQS violations
• DDi = 12,200 gal/day = no NAAQS violations
• RDc = 15,400 gal/day = no NAAQS violations
• DDc = 9,000 gal/day = no NAAQS violations
August 1, 2014 Page 51 Drill Rig Policy Working Group

Schedule

Schedule
August 1, 2014 Drill Rig Policy Working Group Page 53
Task Owner Completion
Date
Review and assess TRANSVAP approach Technical Working Group August 15, 2014
(tentative)
Modeling to address extreme short-term operation AECOM August 15, 2014
(tentative)
Refinements (as needed) to the ANS modeling AECOM/ADEC August 15, 2014
(tentative)
Develop modeling to represent South Central
activities
AECOM/ADEC August 15, 2014
(tentative)
Develop modeling to represent offshore activities AECOM/ADEC August 22, 2014
(tentative)