north mlk market and feasibility report
TRANSCRIPT

City of Greensboro
North MLK Market and Feasibility Report
March 29, 2012

1 3/29/12 – Teska & VSKA MLK Dr. North Market and Feasibility Report
North MLK Market and Feasibility Report
March 29, 2012
The City of Greensboro has been committed to revitalization of Martin Luther King Jr. Drive North and Ole Asheboro for a number of years, starting with the Ole Asheboro Redevelopment Plan adopted in 1979 and amended in 2004 by the Redevelopment Commission of Greensboro, the Ole Asheboro Planning Advisory Commission and the City of Greensboro. The Plan laid out a framework of land use, development, and community amenities that provided a strategy for redevelopment that supports the overall vision of the neighborhood. The Martin Luther King Jr. Drive Traditional Neighborhood Development Plan provided specific zoning and land use recommendations that outlines permitted uses, street frontage requirements and setbacks that reinforce the Plan and are guided by the principles of New Urbanism.
The MLK Jr. Drive North Initiative has been working on implementing development opportunities for four specific sites: A-1, A-2, A-3, and A-4.
Teska Associates and Valerie S. Kretchmer Associates were retained by the City of Greensboro to undertake a market analysis to:
1) Define the market for commercial development in the study area, including the potential for retail, office, and employment uses and the feasibility of new development.
2) Define the market for residential development in the study area, including the housing types that could be developed based on current regulatory and market conditions.
3) Develop specific recommendations for the market potential for housing, commercial, and mixed-use development on the four identified opportunity sites.
4) Conduct a rental feasibility analysis for the Nettie Coad Apartments and demand for possible expansion of the facility.
In addition to market analysis of the data, Teska Associates and VSKA conducted approximately 15 telephone interviews, conducted a survey of residents via the Internet, and led a site visit on March 14 and 15. During the site visit, interviews and focus groups were held with over 20 individuals representing developers, brokers, property managers, and key stakeholders. All of the sources of information verified the key data points summarized in the next section.

2 3/29/12 – Teska & VSKA MLK Dr. North Market and Feasibility Report
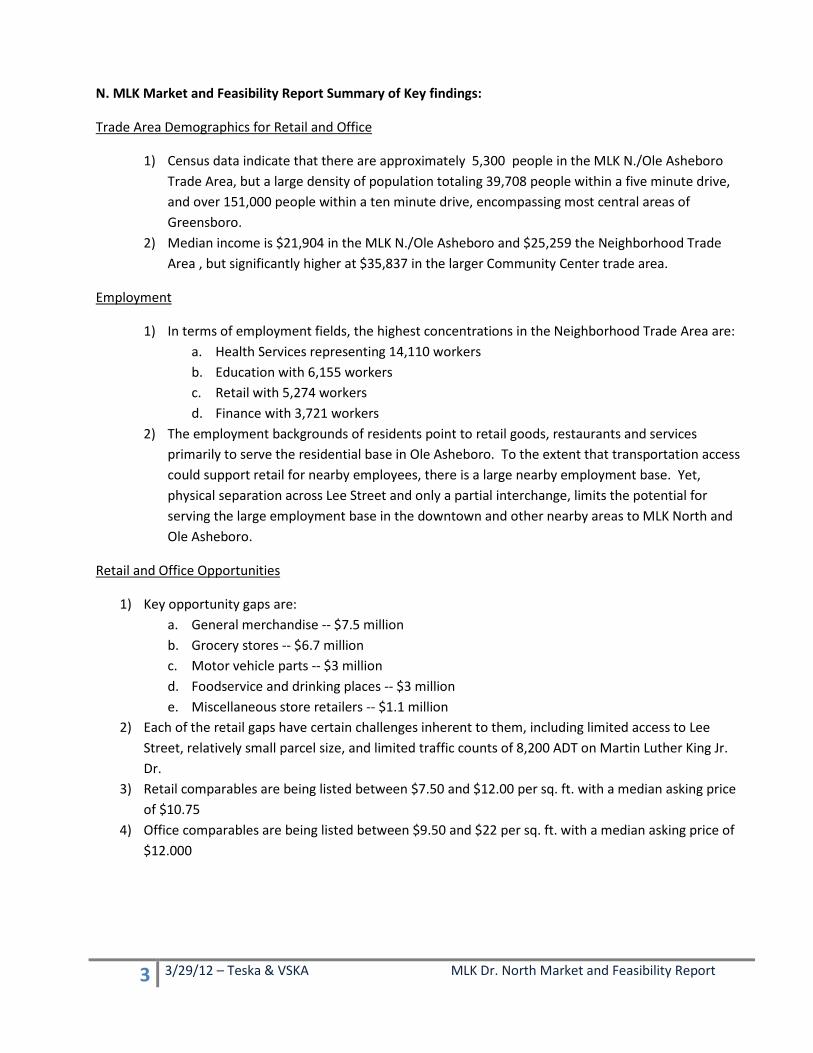
Figure 1: Ole Asheboro Redevelopment Plan
Bennett College
Arlington Park
N. Carolina A&T
Southside
Ole Asheboro
Lee St.
S. E
lm
N. M
LK
3 3/29/12 – Teska & VSKA MLK Dr. North Market and Feasibility Report
N. MLK Market and Feasibility Report Summary of Key findings:
Trade Area Demographics for Retail and Office
1) Census data indicate that there are approximately 5,300 people in the MLK N./Ole Asheboro Trade Area, but a large density of population totaling 39,708 people within a five minute drive, and over 151,000 people within a ten minute drive, encompassing most central areas of Greensboro.
2) Median income is $21,904 in the MLK N./Ole Asheboro and $25,259 the Neighborhood Trade Area , but significantly higher at $35,837 in the larger Community Center trade area.
Employment
1) In terms of employment fields, the highest concentrations in the Neighborhood Trade Area are: a. Health Services representing 14,110 workers b. Education with 6,155 workers c. Retail with 5,274 workers d. Finance with 3,721 workers
2) The employment backgrounds of residents point to retail goods, restaurants and services primarily to serve the residential base in Ole Asheboro. To the extent that transportation access could support retail for nearby employees, there is a large nearby employment base. Yet, physical separation across Lee Street and only a partial interchange, limits the potential for serving the large employment base in the downtown and other nearby areas to MLK North and Ole Asheboro.
Retail and Office Opportunities
1) Key opportunity gaps are: a. General merchandise -- $7.5 million b. Grocery stores -- $6.7 million c. Motor vehicle parts -- $3 million d. Foodservice and drinking places -- $3 million e. Miscellaneous store retailers -- $1.1 million
2) Each of the retail gaps have certain challenges inherent to them, including limited access to Lee Street, relatively small parcel size, and limited traffic counts of 8,200 ADT on Martin Luther King Jr. Dr.
3) Retail comparables are being listed between $7.50 and $12.00 per sq. ft. with a median asking price of $10.75
4) Office comparables are being listed between $9.50 and $22 per sq. ft. with a median asking price of $12.000
4 3/29/12 – Teska & VSKA MLK Dr. North Market and Feasibility Report
Housing
1) A separate trade area was defined for the housing market analysis focused on five Census Tracts surrounding Nettie Coad
2) The market area’s population was 20,400 at the time of the 2010 Census and the median age was 34.0 years. This is slightly younger than the city as a whole (33.4 years). The market area has a higher share of children under 15 (22%) than the city (19%). Two of the Census tracts have a large number of college students so that the market area has a higher share of the 15-24 year old cohort than the city overall.
3) Although the majority of housing in the market area is renter-occupied, almost two thirds of the seniors over 65 years of age are owners. Of those younger than 65, the overwhelming majority (73%) are renters.
4) The market area’s population increased by 6% between 2000 and 2011 and is projected to grow by another 11% or 2,200 people by 2016.
5) A competitive property survey of nearby rental properties found that: a. Most of the properties, including Nettie Coad, are well occupied and many have wait lists.
The longest wait lists are for those apartments with deep subsidies. b. Most properties require tenants to pay for heat and electricity. The landlord typically pays
for water, sewer and trash. c. Rents at Nettie Coad Apartments are lower than at LIHTC properties without deep subsidies
and market rate Class B properties. d. There is likely demand for an addition at Nettie Coad. Due to the demographics of the
market area and the competition of market-rate properties, consideration should be given to units that are income-restricted through the use of housing tax credits or other public financial assistance.
6) Interviews with local experts confirmed that while there are several rental projects being built in Greensboro, rents are starting to increase and there may be demand for additional rental housing in the market area.
Site Recommendations
A1: New Zion Church Site will house a 28,000 sq. ft. new church in a mixed use development. The best location for possible retail uses would need to be oriented toward MLK Jr. Drive. If the church site covers most of the presence along MLK, then the best retail portion of the site would be reuse of the first floor of the fire station and possible expansion toward the corner of MLK and Bragg Street or an outdoor seating area to support a restaurant use. Retail uses along Bragg Street west of MLK Jr. Drive and without direct access and visibility to MLK will face serious challenge in the marketplace. The highest and best use along Bragg Street will be residential – either attached single family, senior or small lot single family homes.

5 3/29/12 – Teska & VSKA MLK Dr. North Market and Feasibility Report
A2: New Rental Housing
One hundred and sixty-eight homes are proposed to be developed by TND Development. The development will include a y-shaped extension of Morrow Boulevard and a section of the new bike path. High quality, affordable housing is in demand in the marketplace. The proposed project would include a shallow subsidy such as a 221 d) 4) without income restrictions. Both market analysis and information from market comparables and interviews with developers and brokers in the marketplace confirm demand for the type of rental housing being proposed for the site.
A3: Nettie Coad Apartments
There are two approaches that could be used to pursue new housing on-site: either a Planned Development for the block or subdivide the parcel into two or 3 parcels and pursue rezoning of the property.
The property is large enough to support various housing products: from townhomes to two or three story multi-family buildings, to a larger multifamily building similar to Nettie Coad in scale. Because of single family housing to the east and the efficiency of development cost, a two-three story multifamily building or buildings may be the best fit for the site and market demand.
Based on numerous interviews with brokers, a high quality, affordable or mixed-income rental project could be very successful in the market place. Due to the location of the site and adjacency to Nettie Coad, new development should be compatible with the design of the existing building and compliment the site. A project with support from Housing Tax Credits, for example, could be very successful on the site and be blended with a mixed-income approach. Obtaining Housing Tax Credits, however, will be a challenge due to the State’s criteria for determining a stable housing market and proximity to retail amenities. The development of A1, A2 and Elm Street sites are likely to improve the viability of moving forward with a Tax Credit application to the NCHFA.
A-4: Vacant Retail Parcel
A-4 is currently a vacant lot owned by the City. Based on the retail market analysis, a retail development on the parcel could be viable. The lot, with excellent visibility to MLK and being a deep lot, has sufficient space for a mid-size retail use that could be general merchandise or a grocery store, or be divisible into restaurant and/or miscellaneous retail.
Based on the sites available in the market area, A-4 has the best visibility and access for the neighborhood-driven demand and traffic along MLK. While there may be challenges in the short-term to attracting a quality retail tenant with sufficient rent to justify development costs, this site should be retained for retail development which will become more viable as the church and new residents are built and retail rents in the marketplace rise.
The site could support a 20,000 sq. ft. retail anchor with sufficient parking to support the retail use. The site could either be a single user or multiple users. In addition to a possible grocery store, restaurants, services, and small general merchandise stores would be good fits for this site.
6 3/29/12 – Teska & VSKA MLK Dr. North Market and Feasibility Report
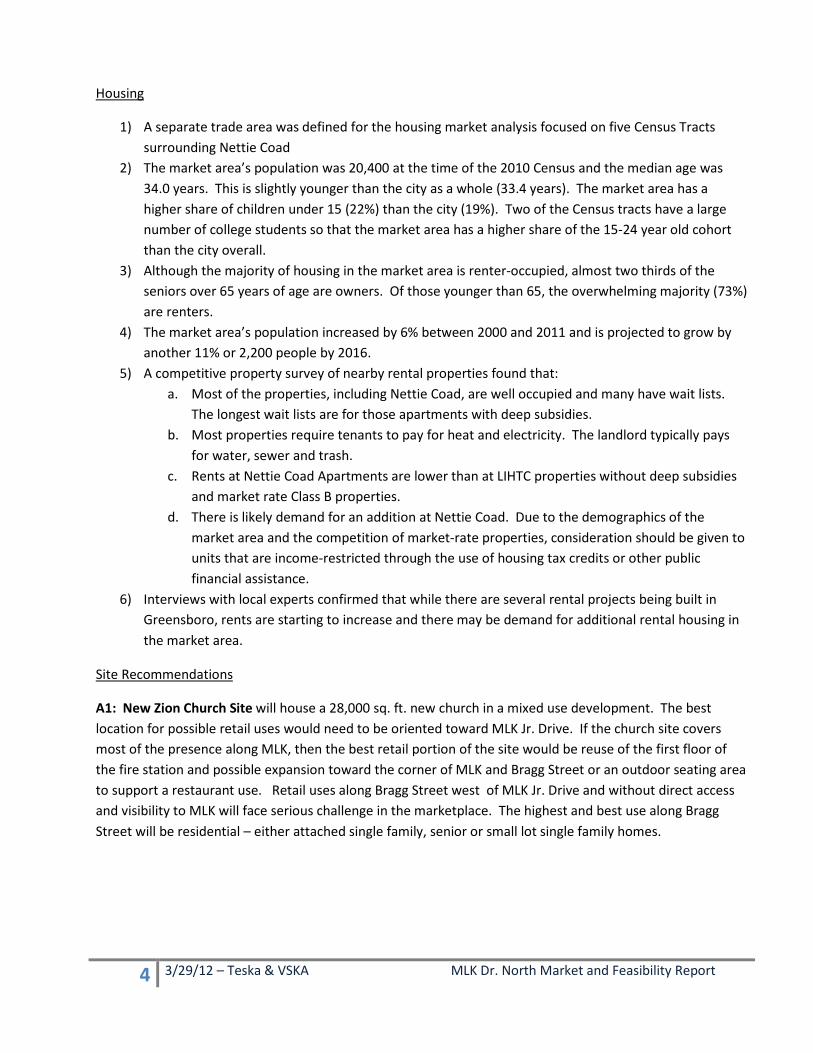
1. Demographic Analysis for Trade Area
Three trade areas for the retail and office market analyses have been identified as shown in Figure 2 and 3:
1) Custom Trade Area – representing neighborhood shopping in close proximity to MLK
2) N.Neighborhood/Convenience Retail Five Minute Drive Time Trade Area – representing residents
who live within close proximity of N. MLK and Lee Street and would be the primary driver of demand for convenience shopping; and
3) Community Center 10 Minute Drive Time Trade Area – which includes competitive properties available to local shoppers that may draw residents from the surrounding neighborhoods.
Figure 2: MLK N./Ole Asheboro Custom Trade Area
7 3/29/12 – Teska & VSKA MLK Dr. North Market and Feasibility Report
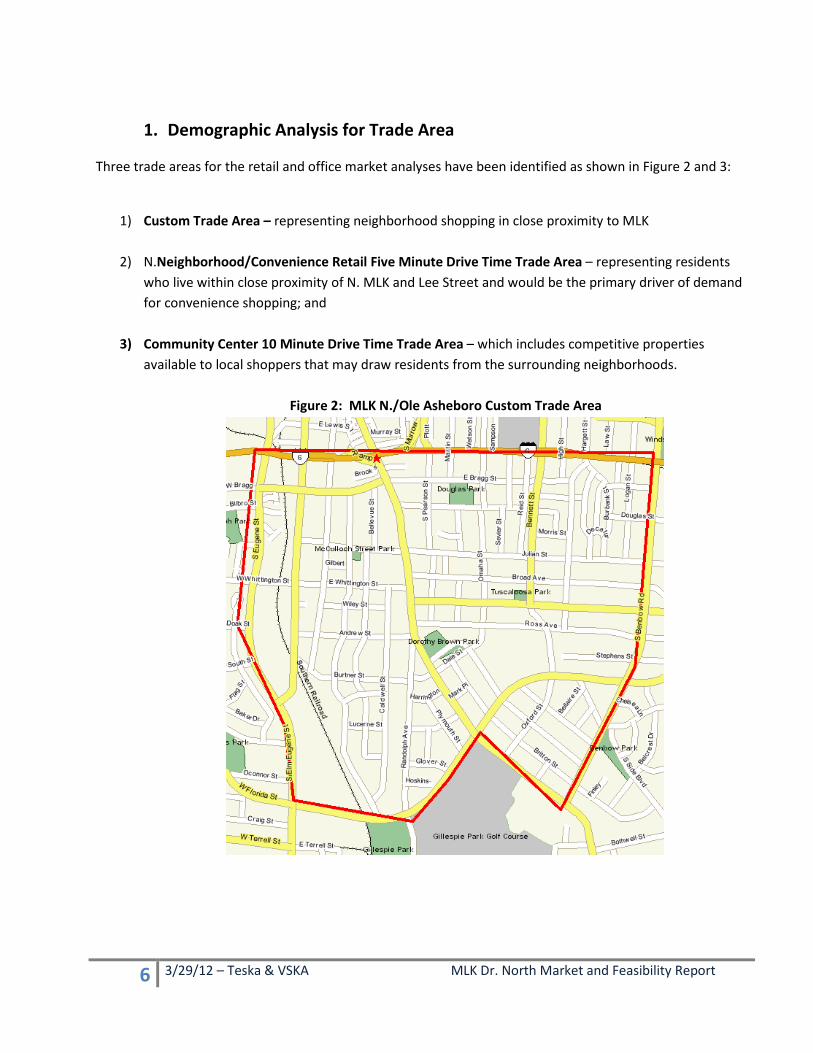
Figure 3: Neighborhood (5 Minute Drive Time) and Community Center (10 Minute Drive Time) Trade Areas
Demographic Profile Table 1 and 2 show the demographic characteristics of the trade areas. Highlights include: 3) There are approximately 5,300 people in the MLK N./Ole Asheboro Trade Area, but a large
density of population totaling 39,708 people within a five minute drive, and over 151,000 people within a ten minute drive, encompassing most central areas of Greensboro.
4) The population within Ole Asheboro is mostly Black or African American, while the population within a five minute drive is approximately 66% Black or African American, and 52% Black or African American within a ten minute drive. The Hispanic population is growing, and is now approximately 7% within the larger trade areas.
5) Ole Asheboro’s residents are significantly older than the larger trade areas, with a very young median age within the Neighborhood (5 Minute) Trade Area.
6) Education attainment is a mixed picture, with high levels of college degrees or higher within the larger trade areas which include major universities, but also relatively high levels of adults over age 25 who have not completed high school.

8 3/29/12 – Teska & VSKA MLK Dr. North Market and Feasibility Report
7) Median income is quite low in Ole Asheboro and the Neighborhood Trade Area and significantly higher at the larger Community Center trade area. Similarly, car ownership is low in both Ole Asheboro and the Neighborhood Trade Area, while families below poverty are fairly high.
These demographic profiles at both the Neighborhood (5 Minute Drive Time) and Community (10 Minute Drive Time) lead to retail strategies that:
a) Provide convenience retail to serve households in MLK N./Ole Asheboro and the surrounding neighborhoods.
b) Offer goods and services for smaller households, older households and households with fewer cars.
c) Determine potential whether it is possible to capture retail and service demand for residents in larger trade areas that may currently be underserved through existing stores and businesses.

9 3/29/12 – Teska & VSKA MLK Dr. North Market and Feasibility Report
Table 1: Demographic Profile: Ole Asheboro Custom Trade Area
Number % Population 2011 Estimate 5,362 2000 Census 5,202 1990 Census 5,275 2011 Est. Pop by Single Race Class 5,362 White Alone 162 3.02 Black or African American Alone 4,901 91.40 2011 Est. Pop Hisp or Latino by Origin 5,362 Hispanic or Latino: 288 5.37 2011 Est. Population by Age 5,362 Age 16 and over 3,954 73.74 Age 65 and over 731 13.63 2011 Est. Median Age 33.26 2011 Est. Pop. Age 25+ by Edu. Attainment 3,298 Less than High School Diploma 663 29.68 High School Graduate (or GED) 1,022 30.99 College Degree or Higher 466 14.13 2011 Est. HHs by HH Income 2,119 Income Less than $15,000 711 33.55 Income $15,000 - $24,999 505 23.83 Income $25,000 - $34,999 327 15.43 Income $35,000 - $49,999 304 14.35 Income $50,000 - $74,999 184 8.68 Income $75,000 - $99,999 68 3.21 Income $100,000 and more 0 0.99 2011 Est. Average Household Income $27,723 2011 Est. Median Household Income $21,904 2011 Est. Average Number of Vehicles 1.22 2011 Est. Families by Poverty Status 1,368 2011 Families Below Poverty 528 38.60 2011 Families Below Poverty with Children 474 34.65
Source: Claritas/Nielsen Site Reports, 2012

10 3/29/12 – Teska & VSKA MLK Dr. North Market and Feasibility Report
Table 2: Demographic Profile: Neighborhood and Community Center Trade Areas
5 Minute Neighborhood
Trade Area 10 Minute Community
Center Trade Area
Number % Number %
Population 2016 Projection 39,708 151,764 2011 Estimate 38,713 146,264 2000 Census 36,434 134,583 1990 Census 36,881 126,201 2011 Est. Pop by Single Race Class 38,713 146,264 White Alone 10,381 26.82 55,010 37.61 Black or African American Alone 25,639 66.23 76,100 52.03 2011 Est. Pop Hisp or Latino by Origin 38,713 146,264 Hispanic or Latino: 2,596 6.71 11,534 7.89 2011 Est. Population by Age 38,713 146,264 Age 16 and over 32,454 83.83 116,969 79.97 Age 65 and over 4,029 10.41 18,813 12.86 2011 Est. Median Age 27.33 34.15 2011 Est. Pop. Age 25+ by Edu. Attainment 20,586 92,560 Less than High School Diploma 4,318 21 15,335 17 High School Graduate (or GED) 5,601 27.21 26,004 28.09 College Degree or Higher 5,378 26 25,450 27 2011 Est. HHs by HH Income 13,413 57,299 Income Less than $15,000 3,965 29.56 10,630 18.55 Income $15,000 - $24,999 2,692 20.07 8,984 15.68 Income $25,000 - $34,999 1,948 14.52 8,474 14.79 Income $35,000 - $49,999 2,013 15.01 10,071 17.58 Income $50,000 - $74,999 1,545 11.52 9,661 16.86 Income $75,000 - $99,999 657 4.90 4,350 7.59 Income $100,000 or more 595 4 5,130 9 2011 Est. Average Household Income $35,262 $50,269 2011 Est. Median Household Income $25,259 $35,837 2011 Est. Average Number of Vehicles 1.27 1.57 2011 Est. Families by Poverty Status 6,692 33,945 2011 Families Below Poverty 1,881 28.11 5,496 16.19 2011 Families Below Poverty with Children 1,599 23.89 4,523 13.32
Source: Claritas/Nielsen Site Reports, 2012

11 3/29/12 – Teska & VSKA MLK Dr. North Market and Feasibility Report
Employment and Office Space Demand
There are 117 businesses employing 968 people within Ole Asheboro. About half of these jobs are in service industries, especially social services. The other half are divided between manufacturing and retail.
In the larger Neighborhood (5 Minute) and Community Center (10 Minute) Trade Areas there is a great deal of employment, concentrated in the downtown area, including 3,244 businesses and 56,483 jobs within the a five minute drive and over 8,700 businesses and 123,000 employees within a 10 minute drive.
In terms of employment fields, the highest concentrations in the Neighborhood Trade Area are:
- Health Services representing 14,110 workers - Education with 6,155 workers - Retail with 5,274 workers - Finance with 3,721 workers
In the Community Center Trade Area, the following employers have the highest concentration of workers:
- Retail with 22,089 workers - Health Services with 21,497 workers - Manufacturing with 11,703 workers - Education with 9,526 workers - Finance with 8,230 workers
The employment backgrounds of residents point to retail goods, restaurants and services primarily to serve the residential base in Ole Asheboro. To the extent that transportation access could support retail for nearby employees, there is a large nearby employment base. Yet, physical separation across Lee Street and only a partial interchange, limits the potential for serving the large employment base in the downtown and other nearby areas to MLK North and Ole Asheboro.

12 3/29/12 – Teska & VSKA MLK Dr. North Market and Feasibility Report
Table 3: MLK N./Ole Asheboro Custom Trade Area Employment
Total Total Business Description Establishments Employees Industries (All) 117 968 Industries (Private Sector) 81 587 Industries (Government and Non-Profit)* 36 381 Agriculture (All) 1 2 Mining (All) 0 0 Construction (All) 5 21 Manufacturing (All) 5 211 Transportation, Communications/Public Utilities 2 6 Wholesale Trade (All) 3 24 Retail (All Retail) 22 180 Building Matls and Garden Supply 0 0 General Merchandise Stores 0 0 Food Stores 6 14 Auto Dealers and Gas Stations 7 30 Apparel and Accessory Stores 0 0 Home Furniture, Furnishings and Equipment 0 0 Eating and Drinking Places 4 40 Miscellaneous Retail Stores 5 96 Finance (All) 7 18 Bank, Savings and Lending Institutions 0 0 Security and Commodity Brokers 1 3 Insurance Carriers and Agencies 1 2 Real Estate 5 13 Trusts, Holdings and Other Investments 0 0 Service (All) 72 506 Hotel and Other Lodging 0 0 Personal Services 13 25 Business Services 11 66 Motion Picture and Amusement 5 10 Health Services 2 14 Legal Services 1 2 Educational Services 1 1 Social Services 11 275 Misc, Membership Orgs and Nonclassified 28 113 Public Administration (All) 0 0
Source: Claritas/Nielsen Site Reports, 2012

13 3/29/12 – Teska & VSKA MLK Dr. North Market and Feasibility Report
Table 4: Economic Characteristics
Neighborhood (5 Minute Trade Area)
Community Center (10 Minute Trade Area)
Total Total Total Total Business Description Establishments Employees Establishments Employees Industries (All) 3,244 56,483 8,737 123,337 Industries (Private Sector) 2,598 36,870 7,431 94,294 Industries (Government and Non-Profit)* 646 19,613 1,306 29,043 Agriculture (All) 26 121 111 429 Mining (All) 0 0 5 45 Construction (All) 116 861 489 3,742 Manufacturing (All) 120 2,965 386 11,703 Transportation, Communications/Public Utilities 76 768 235 2,576 Wholesale Trade (All) 77 1,654 319 6,233 Retail (All Retail) 513 5,274 1,737 22,089 Building Matls and Garden Supply 15 199 74 1,048 General Merchandise Stores 20 293 77 2,638 Food Stores 46 441 147 1,662 Auto Dealers and Gas Stations 69 772 201 2,494 Apparel and Accessory Stores 18 77 203 1,750 Home Furniture, Furnishings and Equipment 43 162 141 847 Eating and Drinking Places 180 2,638 473 8,742 Miscellaneous Retail Stores 122 692 421 2,908 Finance (All) 333 3,721 977 8,230 Bank, Savings and Lending Institutions 67 498 168 1,861 Security and Commodity Brokers 35 242 114 622 Insurance Carriers and Agencies 85 2,178 259 3,197 Real Estate 140 747 420 2,331 Trusts, Holdings and Other Investments 6 56 16 219 Service (All) 1,728 31,258 4,124 55,745 Hotel and Other Lodging 14 291 47 1,574 Personal Services 309 1,337 855 4,201 Business Services 302 3,304 834 7,544 Motion Picture and Amusement 52 471 170 1,610 Health Services 378 14,110 785 21,497 Legal Services 200 1,410 271 1,775 Educational Services 76 6,155 184 9,526 Social Services 161 1,966 378 4,139 Misc, Membership Orgs and Nonclassified 236 2,214 600 3,879 Public Administration (All) 255 9,861 354 12,545

14 3/29/12 – Teska & VSKA MLK Dr. North Market and Feasibility Report
Transportation and Housing Characteristics
Tables 5 and 6 details transportation and housing characteristics. Highlights include:
MLK N. / Ole Asheboro
- High levels of car pooling (12.5%) and public transportation (6%) to go to work - Average commute time of about 21 minutes - Approximately 59% of households rent, while 41% own their home - Median value of homes is $80,657, with only 19 homes over $200,000 in value - Two-thirds of all housing units are one unit detached - 12% of housing are three and four flats, 8% are 5-19 units, and 5 % are two-flats - The median age of homes is 50 years old
Neighborhood (5 Minute) and Community Center (10 Minute) Trade Area
- High levels of car pooling in both trade areas, but much higher public transportation (7.4%) walking (9%) and bicycle (1%) to work within the Neighborhood Trade Area
- Average commute time of about 21 minutes - 65% of households rent while 35% own their home in the Neighborhood Trade Area, while 46% are
renters and 53% own their homes within the Community Center Trade Area - Average owner occupied housing length of residence is 14-16 years, while it is 7 years for renters - Median owner-occupied housing value of housing in the Neighborhood Trade Area is $96,317, while
it is $119,337 within the larger Community Center Trade Area - Housing is older in the Neighborhood Trade Area than the Community Center Trade Area
Implications for retail goods, restaurants and services suggest:
• Convenience retail goods to serve local residents • Goods that serve homeowners with lower housing values • Goods that serve smaller households and renters • Stores that build off of foot traffic may be successful, taking advantage of walkers, bikers, and those
that use public transportation to get to work

15 3/29/12 – Teska & VSKA MLK Dr. North Market and Feasibility Report
Table 5: Transportation and Housing Characteristics
2011 Est. Workers Age 16+, Transp. To Work 1,980 Drove Alone 1,428 72.12 Car Pooled 248 12.53 Public Transportation 120 6.06 Walked 40 2.02 Bicycle 0 0.00 Other Means 71 3.59 Worked at Home 73 3.69 2011 Est. Avg Travel Time to Work in Minutes 21.05 2011 Est. Tenure of Occupied Housing Units 2,119 Owner Occupied 874 41.25 Renter Occupied 1,246 58.80 2011 Owner Occ. HUs: Avg. Length of Residence 14
2011 Renter Occ. HUs: Avg. Length of Residence 8
2011 Est. All Owner-Occupied Housing Values 874 Value Less than $20,000 3 0.34 Value $20,000 - $39,999 26 2.97 Value $40,000 - $59,999 185 21.17 Value $60,000 - $79,999 217 24.83 Value $80,000 - $99,999 173 19.79 Value $100,000 - $149,999 219 25.06 Value $150,000 - $199,999 30 3.43 Value $200,000 or more 19 2 2011 Est. Median Owner-Occupied Housing Value $80,657
2011 Est. Housing Units by Units in Structure 2,473 1 Unit Attached 102 4.12 1 Unit Detached 1,668 67.45 2 Units 126 5.10 3 or 4 Units 301 12.17 5 to 19 Units 208 8.41 20 to 49 Units 53 2.14 50 or More Units 12 0.49
Source: Claritas/Nielsen Site Reports, 2012

16 3/29/12 – Teska & VSKA MLK Dr. North Market and Feasibility Report
Table 6: Transportation and Housing Characteristics – Neighborhood and Community Center Trade Areas
Neighborhood (5 Minute) Trade Area
Community Center (10 Minute) Trade Area
2011 Est. Workers Age 16+, Transp. To Work 16,260 69,609 Drove Alone 10,499 64.57 53,167 76.38 Car Pooled 1,909 11.74 7,957 11.43 Public Transportation 1,203 7.40 2,531 3.64 Walked 1,467 9.02 2,169 3.12 Bicycle 173 1.06 348 0.50 Other Means 313 1.92 1,057 1.52 Worked at Home 695 4.27 2,380 3.42 2011 Est. Avg Travel Time to Work in Minutes 20.57 21.66 2011 Est. Tenure of Occupied Housing Units 13,413 57,299 Owner Occupied 4,702 35.06 30,713 53.60 Renter Occupied 8,711 64.94 26,586 46.40 Owner Occ. HUs: Avg. Length of Residence 14 16 Renter Occ. HUs: Avg. Length of Residence 7 7 2011 Est. All Owner-Occupied Housing Values 4,702 30,713 Value Less than $20,000 16 0.34 445 1.45 Value $20,000 - $39,999 85 1.81 504 1.64 Value $40,000 - $59,999 463 9.85 1,355 4.41 Value $60,000 - $79,999 937 19.93 3,391 11.04 Value $80,000 - $99,999 1,043 22.18 5,663 18.44 Value $100,000 - $149,999 1,125 23.93 10,339 33.66 Value $150,000 - $199,999 471 10.02 3,530 11.49 Value $200,000 or more 562 12 5,486 18 Est. Median Owner-Occupied Housing Value $96,317 $119,337 2011 Est. Housing Units by Units in Structure 15,432 63,778 1 Unit Attached 474 3.07 2,099 3.29 1 Unit Detached 8,169 52.94 40,195 63.02 2 Units 946 6.13 1,748 2.74 3 or 4 Units 1,921 12.45 4,272 6.70 5 to 19 Units 2,895 18.76 11,222 17.60 20 to 49 Units 464 3.01 1,457 2.28 50 or More Units 466 3.02 1,314 2.06 2011 Est. Median Year Structure Built ** 1961 1968
Source: Claritas/Nielsen Site Reports, 2012

17 3/29/12 – Teska & VSKA MLK Dr. North Market and Feasibility Report
4. Retail Gap Analysis
A retail gap analysis was completed to determine the demand and supply of retail goods in the MLK N./Ole Asheboro Trade Area, the Neighborhood (5 Minute) Trade Area, and the Community Center (10 Minute Trade Area). A retail opportunity gap represents retail goods in which there is greater demand than supply within the trade area. This indicates that residents are leaving the trade area to shop for the type of retail goods shown as a gap and that additional retail stores selling these goods may be needed in the trade area. A retail surplus, shown in red, represents that there is greater supply than demand for the type of retail store. This means that residents are coming into the trade area to shop for this type of retail good, and represents a strength in the local market. More types of stores in this category may be warranted if it can be justified that the area is a magnet for this type of retail good. For example, a restaurant row may provide more supply than local demand because diners are coming into the trade area to eat at the restaurants because the area is known for restaurants. Table 7 is a summary of key retail gaps and surpluses in the three trade areas. The MLK N./Ole Asheboro shows retail gaps in most categories of retail stores, especially general merchandise, grocery stores, motor vehicle and parts dealers, and foodservice and drinking. Whether these goods can be accommodated on the key A1-A4 Opportunity Sites will depend on a variety of factors including size of the sites, traffic counts, accessibility, site design, cost of land, and development costs. While gaps are shown in most categories in the MLK N./Ole Asheboro Trade Areas, the demand for many of the categories is being met in the larger trade areas, as residents shop in nearby areas. Within the Neighborhood Trade Area, however, there are large gaps in the categories of grocery stores, general merchandise, and clothing and clothing accessories. The extent to which the A1-A4 are the best sites in the trade area based on local accessibility, size and design of the sites, traffic counts, land cost, and development costs. These issues will be explored in a later section of this report.

18 3/29/12 – Teska & VSKA MLK Dr. North Market and Feasibility Report
Table 7: Retail Gap and Surplus Summary
MLK N./Ole Asheboro Neighborhood (5 Minute) Trade Area
Community Center (10 Minute) Trade Area
Key Opportunity Gaps
$7,507,952 General Merchandise $6,719,204 Grocery Stores $3,092,593 Motor Vehicle and Parts Dealers $3,028,595 Foodservice and Drinking Places $1,116,395 Misc. Store Retailers
$49,782,893 Grocery Stores $36,120,193 General Merchandise $11,174,845 Clothing and Clothing Accessories
$77,335,341 Grocery Stores $31,252,097 General Merchandise $8,874,153 Misc. Stores
Key Surpluses/Market Strengths
$8,520,393 Building Materials $5,828,041 Gasoline Stations $1,449,642 Health and Personal Care
$16,908,848 Motor Vehicles & Parts $15,365,840 Building Materials $11,908,161 Foodservice & Drinking Places $7,770,864 Gasoline Stations
$128,199,327 Foodservice & Drinking Places $100,530,173 Gasoline Stations $77,318,019 Home Centers

19 3/29/12 – Teska & VSKA MLK Dr. North Market and Feasibility Report
Table 8: N. MLK/Ole Asheboro Custom Trade Area Retail Gaps (Surpluses)
Demand Supply Opportunity Gap/Surplus Total Retail Sales 48,827,525 33,872,147 14,955,378 Motor Vehicle and Parts Dealers-441 6,419,796 3,327,203 3,092,593 Furniture and Home Furnishings Stores-442 783,623 0 783,623 Electronics and Appliance Stores-443 957,108 186,878 770,230 Building Material, Garden Equip Stores -444 3,558,047 12,078,440 (8,520,393) Building Material and Supply Dealers-4441 3,163,182 12,078,440 (8,915,258) Home Centers-44411 1,333,308 12,078,440 (10,745,132) Paint and Wallpaper Stores-44412 69,182 0 69,182 Hardware Stores-44413 368,957 0 368,957 Lawn, Garden Equipment, Supplies Stores-4442 394,865 0 394,865 Food and Beverage Stores-445 7,795,579 419,970 7,375,609 Grocery Stores-4451 7,139,174 419,970 6,719,204 Supermarkets, Grocery (Ex Conv) Stores-44511 6,800,573 119,476 6,681,097 Convenience Stores-44512 338,601 300,494 38,107 Specialty Food Stores-4452 224,997 0 224,997 Beer, Wine and Liquor Stores-4453 431,408 0 431,408 Health and Personal Care Stores-446 3,776,424 5,226,066 (1,449,642) Gasoline Stations-447 5,358,015 11,186,056 (5,828,041) Clothing and Clothing Accessories Stores-448 2,521,204 0 2,521,204 Sporting Goods, Hobby, Book, Music Stores-451 886,104 268,485 617,619 Sporting Goods, Hobby, Musical Inst Stores-4511 664,819 0 664,819 Book, Periodical and Music Stores-4512 221,284 268,485 (47,201) General Merchandise Stores-452 7,507,952 0 7,507,952 Department Stores Excl Leased Depts-4521 3,631,607 0 3,631,607 Other General Merchandise Stores-4529 3,876,345 0 3,876,345 Miscellaneous Store Retailers-453 1,147,816 31,421 1,116,395 Florists-4531 74,191 0 74,191 Office Supplies, Stationery, Gift Stores-4532 402,537 0 402,537 Used Merchandise Stores-4533 102,591 31,421 71,170 Other Miscellaneous Store Retailers-4539 568,497 0 568,497 Foodservice and Drinking Places-722 4,176,223 1,147,628 3,028,595 Full-Service Restaurants-7221 1,851,105 914,192 936,913 Limited-Service Eating Places-7222 1,752,122 0 1,752,122 Special Foodservices-7223 344,149 233,436 110,713 Drinking Places -Alcoholic Beverages-7224 228,847 0 228,847
Source: Claritas/Nielsen Site Reports, 2012

20 3/29/12 – Teska & VSKA MLK Dr. North Market and Feasibility Report
Table 9: Neighborhood (5 Minute) Trade Area Retail Gaps (Surpluses)
Demand Supply Opportunity Gap/Surplus Total Retail Sales Incl Eating and Drinking Places 468,892,467 548,138,955 (79,246,488) Motor Vehicle and Parts Dealers-441 69,948,114 86,856,962 (16,908,848) Furniture and Home Furnishings Stores-442 7,179,450 9,859,050 (2,679,600) Electronics and Appliance Stores-443 11,913,560 10,241,608 1,671,952 Building Material, Garden Equip Stores -444 34,660,747 50,026,587 (15,365,840) Building Material and Supply Dealers-4441 31,067,111 49,936,911 (18,869,800) Home Centers-44411 12,740,295 19,621,166 (6,880,871) Paint and Wallpaper Stores-44412 678,246 1,431,029 (752,783) Hardware Stores-44413 3,475,379 5,767,150 (2,291,771) Lawn, Garden Equipment, Supplies Stores-4442 3,593,636 89,675 3,503,961 Food and Beverage Stores-445 65,058,052 10,391,469 54,666,583 Grocery Stores-4451 57,882,456 8,099,563 49,782,893 Supermarkets, Grocery (Ex Conv) Stores-44511 54,780,831 6,133,698 48,647,133 Convenience Stores-44512 3,101,625 1,965,866 1,135,759 Specialty Food Stores-4452 1,768,279 379,495 1,388,784 Beer, Wine and Liquor Stores-4453 5,407,317 1,912,411 3,494,906 Health and Personal Care Stores-446 27,347,426 26,650,610 696,816 Gasoline Stations-447 48,039,797 55,810,661 (7,770,864) Clothing and Clothing Accessories Stores-448 24,034,857 12,860,012 11,174,845 Sporting Goods, Hobby, Book, Music Stores-451 12,460,100 8,729,748 3,730,352 Sporting Goods, Hobby, Musical Inst Stores-4511 6,862,555 3,096,677 3,765,878 Book, Periodical and Music Stores-4512 5,597,545 5,633,071 (35,526) General Merchandise Stores-452 64,654,772 28,534,579 36,120,193 Department Stores Excl Leased Depts-4521 31,509,904 18,125,321 13,384,583 Other General Merchandise Stores-4529 33,144,868 10,409,258 22,735,610 Miscellaneous Store Retailers-453 12,574,901 10,592,007 1,982,894 Florists-4531 717,712 887,746 (170,034) Office Supplies, Stationery, Gift Stores-4532 4,979,967 4,562,611 417,356 Used Merchandise Stores-4533 1,318,975 2,289,012 (970,037) Other Miscellaneous Store Retailers-4539 5,558,248 2,852,638 2,705,610 Foodservice and Drinking Places-722 50,547,944 62,456,105 (11,908,161) Full-Service Restaurants-7221 23,152,370 25,746,600 (2,594,230) Limited-Service Eating Places-7222 20,459,206 17,987,902 2,471,304 Special Foodservices-7223 4,022,384 12,840,824 (8,818,440) Drinking Places -Alcoholic Beverages-7224 2,913,984 5,880,780 (2,966,796)
Source: Claritas/Nielsen Site Reports, 2012

21 3/29/12 – Teska & VSKA MLK Dr. North Market and Feasibility Report
Table 10: Convenient Center (10 Minute) Trade Area Retail Gaps (Surpluses)
Demand Supply Opportunity Gap/Surplus Total Retail Sales Incl Eating and Drinking Places 1,910,959,481 3,039,200,089 (1,128,240,608) Motor Vehicle and Parts Dealers-441 313,741,105 412,051,036 (98,309,931) Furniture and Home Furnishings Stores-442 34,794,144 56,760,629 (21,966,485) Electronics and Appliance Stores-443 42,744,650 50,656,721 (7,912,071) Building Material, Garden Equip Stores -444 159,793,512 269,457,436 (109,663,924) Building Material and Supply Dealers-4441 143,618,429 267,291,931 (123,673,502) Home Centers-44411 58,504,803 135,822,822 (77,318,019) Paint and Wallpaper Stores-44412 3,389,620 4,994,867 (1,605,247) Hardware Stores-44413 15,074,304 14,825,555 248,749 Other Building Materials Dealers-44419 66,649,703 111,648,687 (44,998,984) Lawn, Garden Equipment, Supplies Stores-4442 16,175,083 2,165,505 14,009,578 Food and Beverage Stores-445 259,253,758 165,214,799 94,038,959 Grocery Stores-4451 233,840,152 151,845,644 81,994,508 Supermarkets, Grocery (Ex Conv) Stores-44511 221,952,693 144,617,352 77,335,341 Convenience Stores-44512 11,887,459 7,228,292 4,659,167 Specialty Food Stores-4452 7,205,598 1,737,692 5,467,906 Beer, Wine and Liquor Stores-4453 18,208,009 11,631,462 6,576,547 Health and Personal Care Stores-446 122,021,576 189,245,886 (67,224,310) Gasoline Stations-447 194,155,539 188,931,511 5,224,028 Clothing and Clothing Accessories Stores-448 93,046,711 193,576,884 (100,530,173) Sporting Goods, Hobby, Book, Music Stores-451 40,177,807 44,723,540 (4,545,733) Sportng Goods, Hobby, Musical Inst Stores-4511 26,847,946 24,074,365 2,773,581 Book, Periodical and Music Stores-4512 13,329,860 20,649,174 (7,319,314) General Merchandise Stores-452 260,506,345 229,254,248 31,252,097 Department Stores Excl Leased Depts-4521 127,551,032 164,607,893 (37,056,861) Other General Merchandise Stores-4529 132,955,313 64,646,355 68,308,958 Miscellaneous Store Retailers-453 49,167,712 54,014,968 (4,847,256) Florists-4531 3,333,450 2,971,267 362,183 Office Supplies, Stationery, Gift Stores-4532 19,053,918 30,422,088 (11,368,170) Used Merchandise Stores-4533 4,400,298 7,115,721 (2,715,423) Other Miscellaneous Store Retailers-4539 22,380,045 13,505,892 8,874,153 Foodservice and Drinking Places-722 190,171,323 318,370,650 (128,199,327) Full-Service Restaurants-7221 86,114,494 144,912,099 (58,797,605) Special Foodservices-7223 15,482,512 23,789,433 (8,306,921) Drinking Places -Alcoholic Beverages-7224 9,925,531 14,004,571 (4,079,040)
Source: Nielsen, 2012

22 3/29/12 – Teska & VSKA MLK Dr. North Market and Feasibility Report
5. Traffic Counts
Traffic Counts for Quaker Village are modest on MLK N., with approximately 8,200 – 9,200 Average Daily Traffic (ADT) along MLK N. Lee Street has higher traffic volumes, reporting 21,000 west of Eugene and 16,000 to the east of N. MLK. Typically, large retailers would like to see traffic volumes of at least 20,000 ADT. While there is relatively good visibility to the A-1 and A-2 opportunity sites on MLK N and Lee Street (although grade changes will be a challenge for signage and visibility), the presence of only a limited intersection makes it challenging to attract community center type retail that would pull from surrounding areas off of Lee St.
Figure 4: City of Greensboro Department of Transportation Average Daily Traffic Volume, 2009
Source: NCDOT, 2009
23 3/29/12 – Teska & VSKA MLK Dr. North Market and Feasibility Report
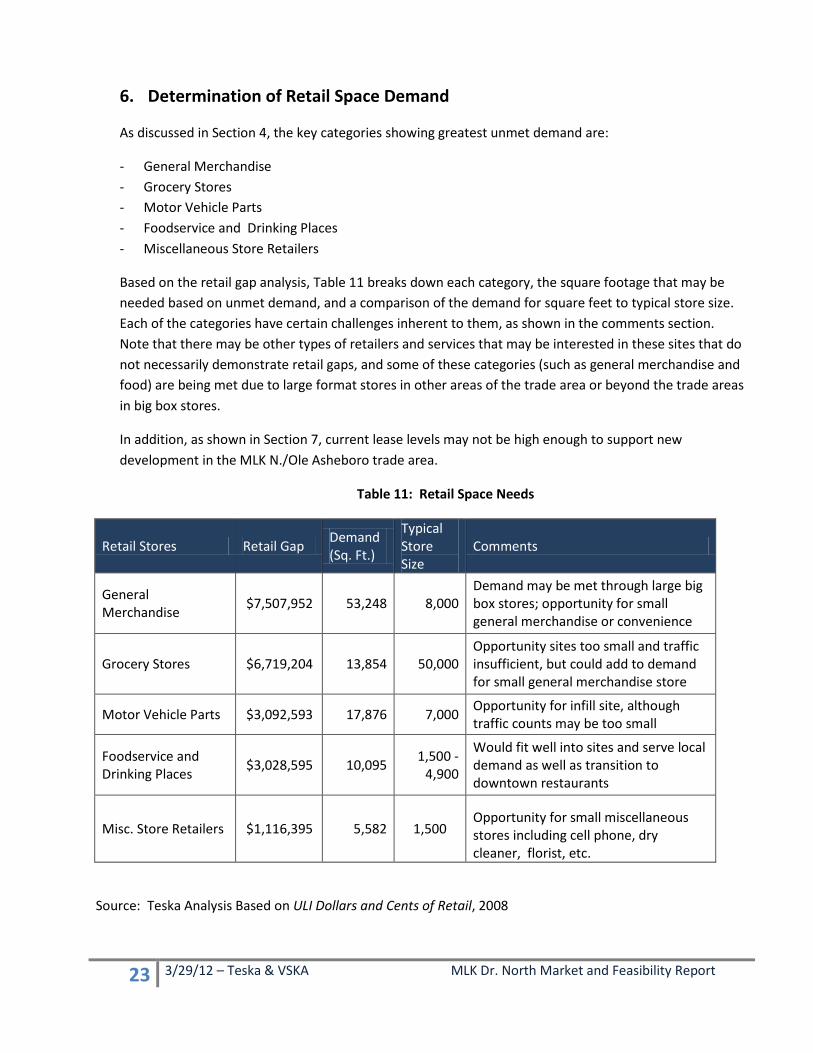
6. Determination of Retail Space Demand
As discussed in Section 4, the key categories showing greatest unmet demand are:
- General Merchandise - Grocery Stores - Motor Vehicle Parts - Foodservice and Drinking Places - Miscellaneous Store Retailers
Based on the retail gap analysis, Table 11 breaks down each category, the square footage that may be needed based on unmet demand, and a comparison of the demand for square feet to typical store size. Each of the categories have certain challenges inherent to them, as shown in the comments section. Note that there may be other types of retailers and services that may be interested in these sites that do not necessarily demonstrate retail gaps, and some of these categories (such as general merchandise and food) are being met due to large format stores in other areas of the trade area or beyond the trade areas in big box stores.
In addition, as shown in Section 7, current lease levels may not be high enough to support new development in the MLK N./Ole Asheboro trade area.
Table 11: Retail Space Needs
Retail Stores Retail Gap Demand (Sq. Ft.)
Typical Store Size
Comments
General Merchandise $7,507,952 53,248 8,000
Demand may be met through large big box stores; opportunity for small general merchandise or convenience
Grocery Stores $6,719,204 13,854 50,000 Opportunity sites too small and traffic insufficient, but could add to demand for small general merchandise store
Motor Vehicle Parts $3,092,593 17,876 7,000 Opportunity for infill site, although traffic counts may be too small
Foodservice and Drinking Places $3,028,595 10,095 1,500 -
4,900
Would fit well into sites and serve local demand as well as transition to downtown restaurants
Misc. Store Retailers $1,116,395 5,582 1,500 Opportunity for small miscellaneous stores including cell phone, dry cleaner, florist, etc.
Source: Teska Analysis Based on ULI Dollars and Cents of Retail, 2008

24 3/29/12 – Teska & VSKA MLK Dr. North Market and Feasibility Report
7. Market Trends and Comparables
Comparables were searched for zip codes 27406, 27401 and 27403 and compared with market trends in the Greensboro/High Point Metro, Guilford County, and statewide. This analysis was undertaken to determine the size of properties on the market, asking price for sale and for lease. A full set of comparables for retail, office, and multifamily housing are included in the appendix of this report.
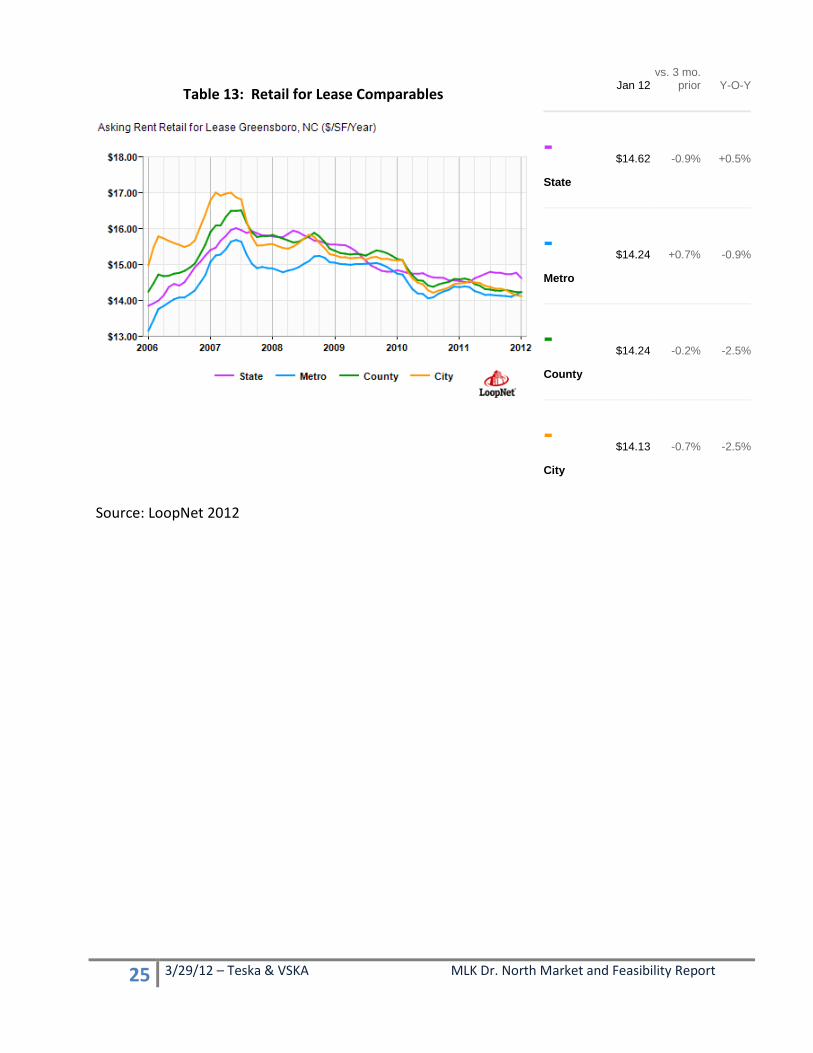
A. Retail for Lease
Most of the listings of retail spaces in close proximity to N. MLK are small in size, although there are a few large properties with multiple spaces for lease located further out along major roadways. Nearby competitive retail properties range from 5,800 to 8,000 sq. ft., with a median of 6,420 for spaces for lease. The asking rent for these spaces ranges from $7 per sq. ft. up to $12, with a median of $10.75. Market transactions are likely to be lower than asking price in today’s retail market. The median rent in the trade area is significantly lower than the Metro average of $14.24. Metro rents have edged up slightly in the past three months by 0.7%, although they are down by 0.9% over the past 12 months.
The relatively low rent levels are going to be a challenge to any new retail development, with product already available in the market area at costs generally lower than is necessary to support development costs.
Table 12: Retail Comparables for Lease
Retail 2901 E. Lee
507 N. Church
614 Past-eur
111 W. Wend- over
500 S. Ben-bow
328 E. Market
3515 W. Market
2005 S. Elm
1317 N. Elm
122 E. Market
510 N. Elm
405 Banner Median
Building Size (sq. ft.)
7,000
7,982
4,815
4,815
24,446
13,839 5,839
168,759
42,680
67,858
52,060
61,593
19,143
Space Available (sq. ft.)
7,000
7,982
2,235
2,480
19,726
5,776 5,839
91,968
42,680
1,760
4,000
8,470
6,420
Asking Rent ($)
12.00
7.50
11.00
11.00
6.95 N/A 9.25
10.50
10.00 N/A
12.00
12.00
$10.75
Source: LoopNet, 2012
25 3/29/12 – Teska & VSKA MLK Dr. North Market and Feasibility Report
Table 13: Retail for Lease Comparables
Source: LoopNet 2012
Jan 12 vs. 3 mo.
prior Y-O-Y
- State
$14.62 -0.9% +0.5%
- Metro
$14.24 +0.7% -0.9%
- County
$14.24 -0.2% -2.5%
- City
$14.13 -0.7% -2.5%

26 3/29/12 – Teska & VSKA MLK Dr. North Market and Feasibility Report
B. Retail Comparables -- For Sale
There is a wide range in asking prices for retail buildings for sale, ranging from under $60 per sq. ft. to $244 per square foot. The median size of buildings for sale is 7,000 sq. ft., but ranges from just 1,722 to 71,000 sq. ft. Region-wide, retail building sales suffered a deep decline in 2006, rose for three years, declined again in 2010, rose in 2011 and seem to be holding relatively steady in 2012.
Table 14: Retail for Sale Comparables
Retail for Sale
1500 Market St.
2010 Randle-man Rd.
403 N. Elm St.
302-304 S. Elm St.
2613 High Point Rd.
2906 High Point Rd.
2907 & 2809 High Point Rd.
358 S. Elm St.
358 S. Elm St.
2335 Randle-man Rd.
5501 Randle-man Rd. Median
Building Size (sq. ft.)
71,000
7,000
9,000 8,952
2,040
2,091 4,065
9,000
9,000
1,722
5,839 7,000
Asking Price ($)
4,200,000
425,000
1,500,000
350,000
425,000
425,000 995,000
985,000
985,000
350,000
550,000 $ 550,000
Price per Square Foot
59.15
60.71
166.67
39.10
208.33
203.25 244.77
109.44
109.44
203.25
94.19 $ 109.44
Table 15: Retail for Sale - Greensboro
Source: LoopNet, 2012
Jan
12 vs. 3
mo.prior Y-O-Y
- State
$126.98 -1.9% -0.6%
- Metro
$132.83 -2.2% +9.0%
- County
$154.79 +1.4% +9.9%

27 3/29/12 – Teska & VSKA MLK Dr. North Market and Feasibility Report
C. Office -- For Lease N. MLK is in such close proximity to Downtown Greensboro, that virtually all demand for office space will be met in Downtown or other, more established employment centers. While sites A1 and A2 to have visibility along Lee Street, the interchange is only a partial one with limited access. Similarly, MLK is a direct path to downtown, but there is currently sufficient office space at competitive prices within downtown and on the edges of downtown as shown below.
The exception to this may be neighborhood services and businesses – medical, small business office space, and non-profit agencies. A mixed use development, either vertically, or horizontally, could include some office space for these users, but rent levels would need to be competitive to nearby areas.
With asking prices at a median level of $12 per sq. ft., it will be challenging to build any new office space without public participation defraying development costs, in order to provide office space at a competitive price.
In fact, the major employers within N. MLK are service organizations. These organizations need very affordable space, but could help provide jobs and anchor demand for restaurants and retailers in the area.
In addition, the S. Elm development just west of MLK N/Ole Asheboro, is planning mixed use development with the possibility of office space that would largely absorb demand for office on the south side of Lee St.
Table 16: Office Space for Lease
Office for Lease 507 N. Church
614 Pasteur
111 W. Wend-over
500 S. Benbow
328 E. Market
3515 W. Market
2005 S. Elm
1317 N. Elm
122 E. Market
510 N. Elm
405 Banner
Medi-an
Space Available (sq. ft.)
5,327
1,400
6,000
2,037
8,866
15,560
10,600
1,860
4,500
8,000
3,168
5,327
Asking Rent per sq. ft. ($) N/A
13.00
12.00
11.78
17.00
13.75
9.50
22.00
12.00 N/A
11.36
12.00
The good news is that office space metro-wide has been rising since early 2011, reaching a median of $14.57 and $14.91 in the City of Greensboro.

28 3/29/12 – Teska & VSKA MLK Dr. North Market and Feasibility Report
Table 17: Office for Lease
The key issues for employment and office demand are therefore: 1) Create strong linkages to the downtown, fostering programs that offer job training and
education to secure jobs, and therefore, stronger income growth in the neighborhood to support retail and housing. The development of Mt. Zion Church at MLK N. and Lee St. can be part of this strategy of bringing economic activity into the area.
2) Consider providing spaces for local businesses or service organizations, but be aware of relatively low market rents which will likely not be able to support the full costs of development without additional support.
Jan 12
vs. 3 mo.
Prior Y-O-Y
- State
$16.08 0.0% -0.2%
- Metro
$14.57 +1.1% +1.4%
- County
$14.67 +1.2% +3.1%
- City
$14.91 +1.9% +2.4%

29 3/29/12 – Teska & VSKA MLK Dr. North Market and Feasibility Report
3) Office -- For Sale
The potential for office building development paints a similar picture to office rent levels. The median asking price for office buildings is $78.79 per square foot, less than typical development costs, and significantly less than the Citywide average of $98.19. With other competitive sites available downtown and surrounding the downtown, it will not be feasible to build speculative office space. That said, an anchor tenant of a service organization that is able to find resources to cover development costs, may find the area attractive due to its low land costs and transportation access. Nevertheless, the priorities of the City to support employment growth in the downtown and other key employment centers, makes these sites less attractive for office building development. As stated above, smaller office spaces for local services may make sense as part of a larger development strategy if other resources are secured to defray development costs.
Table 18: Office for Sale Comparables
Office for Sale 1031 Summit
111 W. Wendover
2434 W. Florida
504 Guilford
500 S. Benbow
2005 S. Elm
2627 Grims-ley
358 S. Elm
2D Terrace
211 E. Besse-mer Median
Space Available (sq. ft.)
28,214
6,000
2,700
5,906
2,037
26,600
5,520
9,000
1,820
2,200
5,713
Asking Price per sq. ft. ($)
92.15
99.17
66.67
47.41
122.24
46.43
53.44
109.44
43.96
90.91
78.79

30 3/29/12 – Teska & VSKA MLK Dr. North Market and Feasibility Report
Table 18: Office for Sale Prices
Source: LoopNet, 2012
Jan 12
vs. 3 mo.
prior Y-O-Y
- State
$126.35 -0.2% -5.4%
- Metro
$94.41 +1.7% -0.4%
- County
$94.99 +2.2% -0.6%
- City
$98.19 +3.6% +0.4%

31 3/29/12 – Teska & VSKA MLK Dr. North Market and Feasibility Report
8. Residential Rental Market Analysis
This section of the report focuses on the rental market in the Ole Ashboro neighborhood and the potential for new apartments in the immediate area. Teska and Valerie S. Kretchmer Associates, Inc. (VSKA) conducted the following:
1) Delineated a realistic rental market area and analyzed the area’s demographics 2) Identified and surveyed affordable and market rate apartments in and near the market area 3) Analyzed rents and occupancy at the surveyed apartments and specifically at Nettie Coad
Apartments 4) Analyzed the demand for additional apartments and realistic rents in the market area.
A. Rental Market Area Demographics The rental market area is based on conversations with staff at the Department of Planning and Community Development, as well as the attributes of the area, neighborhood identity, road network and other real and perceptual barriers. The market area includes five Census tracts south and east of downtown (111.01, 111.02, 1112, 113 and 114). A map of the market area is on the following page. Note that the rental market area is different than the retail market areas shown in the earlier chapters of this report to reflect the local housing market for rental properties compared with the demand for retail and office that was considered in earlier sections. The tables that follow provide information from the 2010 Census for the rental market area and the City of Greensboro. Highlights include:
1) The market area’s population was 20,400 at the time of the 2010 Census and the median age was 34.0 years. This is slightly younger than the city as a whole (33.4 years). The market area has a higher share of children under 15 (22%) than the city (19%). Two of the Census tracts have a large number of college students so that the market area has a higher share of the 15-24 year old cohort than the city overall.
2) Almost two thirds of the market area’s occupied housing is rental compared to 48% in the city overall.
3) The overall (owner and rental) vacancy rate in the market area was 12.4% as of April 2010, which was higher than that of the city overall (9.9%). However, the market area’s rental vacancy rate was lower at 10.7% than the city’s (11.9%).
4) Although the majority of housing in the market area is renter-occupied, almost two thirds of the seniors over 65 years of age are owners. Of those younger than 65, the overwhelming majority (73%) are renters. In the city as a whole, 52% of younger households are renters while 72% of those over 65 were owners.
5) Younger households ages 15-24 represent 20% of renters in the market area, a slightly higher share than in the city (18%), attributable to the presence of several colleges. Those over 55 make up a slightly higher share of renters in the market area (24%) and city (21%).

32 3/29/12 – Teska & VSKA MLK Dr. North Market and Feasibility Report
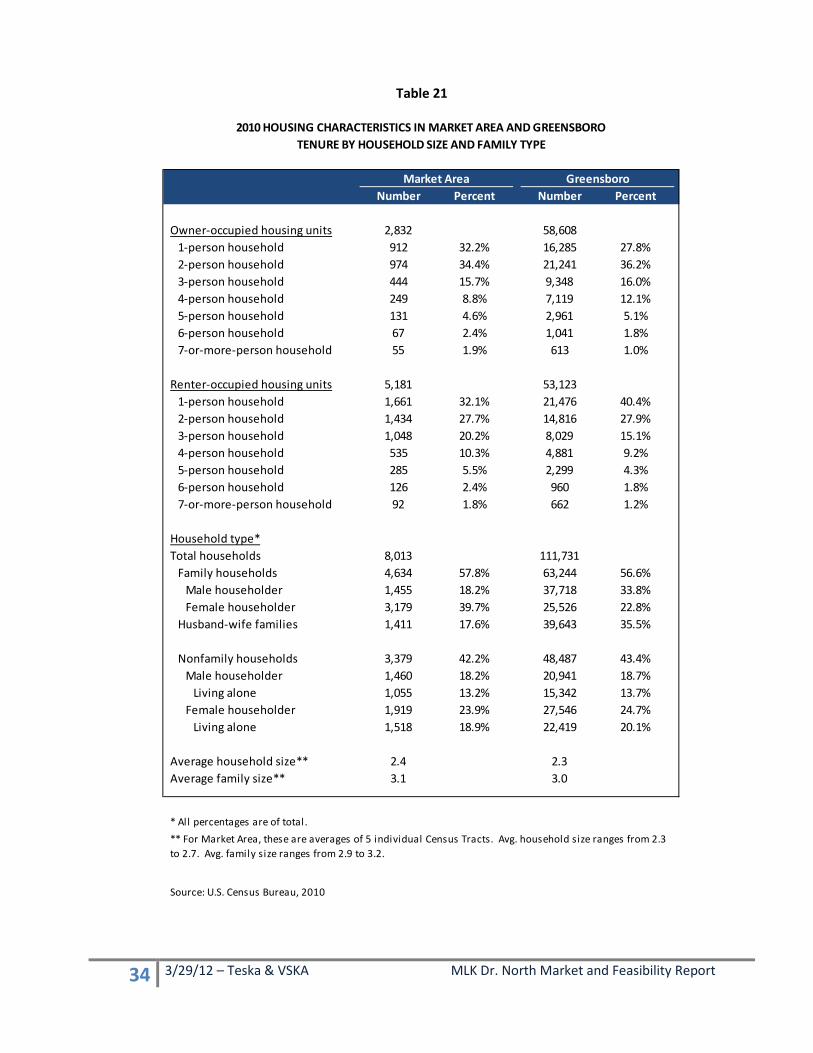
6) Almost one third of the market area’s rental housing units have one person compared to 40% in the city. Both areas have a similar share of two-person households at 28%. The market area has a much larger share of three and four-person renter households (31%) than the city (24%).
7) 58% of the market area’s households are families, though only 18% are husband and wife families. Greensboro has a slightly lower share of family households (57%), but a much higher share of husband and wife families (36%).

33 3/29/12 – Teska & VSKA MLK Dr. North Market and Feasibility Report
Table 19
Table 20
Number Percent Number Percent
Total Population 20,406 269,666Under 15 years 4,566 22.4% 51,027 18.9%15 to 19 years 1,742 8.5% 21,535 8.0%20 to 24 years 2,347 11.5% 27,649 10.3%25 to 29 years 1,432 7.0% 21,556 8.0%30 to 34 years 1,111 5.4% 18,655 6.9%35 to 44 years 2,222 10.9% 35,667 13.2%45 to 54 years 2,635 12.9% 34,388 12.8%55 to 64 years 1,969 9.6% 28,216 10.5%65 to 74 years 1,204 5.9% 15,963 5.9%75+ years 1,178 5.8% 15,010 5.6%
Median age (years)* 34.0 33.4
Source: U.S. Census Bureau, 2010
2010 POPULATION BY AGE IN MARKET AREA AND GREENSBORO
Market Area Greensboro
* Median age for Market Area is average of five Census Tract median ages, which range from 24.5 to 45.4. The tracts with median ages in the twenties are 112 and 114.
Number Percent Number Percent
Housing Occupancy/VacancyTotal housing units 9,144 124,074Vacant units 1,131 12.4% 12,343 9.9%Vacant units for rent 618 10.7% 7,171 11.9%
Housing TenureOccupied housing units 8,013 111,731Owner-occupied units 2,832 35.3% 58,608 52.5%Renter-occupied units 5,181 64.7% 53,123 47.5%
Occupied Units for HHs Age 65+ 1,771 20,925Owner Occupied 1,147 64.8% 14,985 71.6%Renter Occupied 624 35.2% 5,940 28.4%
Occupied Units for HHs Ages 15-64 6,242 90,806Owner Occupied 1,685 27.0% 43,623 48.0%Renter Occupied 4,557 73.0% 47,183 52.0%
Source: U.S. Census, 2010.
Market Area Greensboro
2010 HOUSING CHARACTERISTICS IN MARKET AREA AND GREENSBORO
34 3/29/12 – Teska & VSKA MLK Dr. North Market and Feasibility Report
Table 21
Number Percent Number Percent
Owner-occupied housing units 2,832 58,6081-person household 912 32.2% 16,285 27.8%2-person household 974 34.4% 21,241 36.2%3-person household 444 15.7% 9,348 16.0%4-person household 249 8.8% 7,119 12.1%5-person household 131 4.6% 2,961 5.1%6-person household 67 2.4% 1,041 1.8%7-or-more-person household 55 1.9% 613 1.0%
Renter-occupied housing units 5,181 53,1231-person household 1,661 32.1% 21,476 40.4%2-person household 1,434 27.7% 14,816 27.9%3-person household 1,048 20.2% 8,029 15.1%4-person household 535 10.3% 4,881 9.2%5-person household 285 5.5% 2,299 4.3%6-person household 126 2.4% 960 1.8%7-or-more-person household 92 1.8% 662 1.2%
Household type*Total households 8,013 111,731
Family households 4,634 57.8% 63,244 56.6%Male householder 1,455 18.2% 37,718 33.8%Female householder 3,179 39.7% 25,526 22.8%
Husband-wife families 1,411 17.6% 39,643 35.5%
Nonfamily households 3,379 42.2% 48,487 43.4%Male householder 1,460 18.2% 20,941 18.7%
Living alone 1,055 13.2% 15,342 13.7%Female householder 1,919 23.9% 27,546 24.7%
Living alone 1,518 18.9% 22,419 20.1%
Average household size** 2.4 2.3Average family size** 3.1 3.0
* All percentages are of total.
Source: U.S. Census Bureau, 2010
2010 HOUSING CHARACTERISTICS IN MARKET AREA AND GREENSBOROTENURE BY HOUSEHOLD SIZE AND FAMILY TYPE
Market Area Greensboro
** For Market Area, these are averages of 5 individual Census Tracts. Avg. household size ranges from 2.3 to 2.7. Avg. family size ranges from 2.9 to 3.2.

35 3/29/12 – Teska & VSKA MLK Dr. North Market and Feasibility Report
Table 22
It is also useful to look at population and household trends in the market area since 2000 and projected to 2016. The 2011 estimates and 2016 projections by Demographics Now incorporate 2010 Census data.
Highlights include:
1) The market area’s population increased by 6% between 2000 and 2011 and is projected to grow by another 11% or 2,200 people by 2016.
2) The number of households in the market area grew by 9% since 2000 and is projected to grow by another 9% over the next five years.
3) The average household size in the market area is notably higher than the city as a whole at 2.56 persons compared to 2.40 in the city.
4) Household incomes in the market area are significantly lower than those of the city overall. The market area’s median household income is estimated at $20,600 in 2011 compared to $41,100 in the city. The median income decreased over the past ten years in the market area while increasing slightly in the city. The market area’s decrease may be due in part to the increasing number of college students with low reported incomes because most students are not fully self-supporting.
Number Percent Number Percent
Owner-occupied housing units 2,832 58,60815 to 24 years 41 1.4% 770 1.3%25 to 34 years 197 7.0% 6,824 11.6%35 to 44 years 345 12.2% 10,868 18.5%45 to 54 years 519 18.3% 12,812 21.9%55 to 64 years 583 20.6% 12,349 21.1%65 years and over 1,147 40.5% 14,985 25.6%
Renter-occupied housing units 5,181 53,12315 to 24 years 1,012 19.5% 9,766 18.4%25 to 34 years 1,132 21.8% 14,572 27.4%35 to 44 years 864 16.7% 9,847 18.5%45 to 54 years 912 17.6% 7,794 14.7%55 to 64 years 637 12.3% 5,204 9.8%65 years and over 624 12.0% 5,940 11.2%
Source: U.S. Census Bureau, 2010.
2010 HOUSING CHARACTERISTICS IN MARKET AREA AND GREENSBOROTENURE BY HOUSEHOLDER AGE
Market Area Greensboro

36 3/29/12 – Teska & VSKA MLK Dr. North Market and Feasibility Report
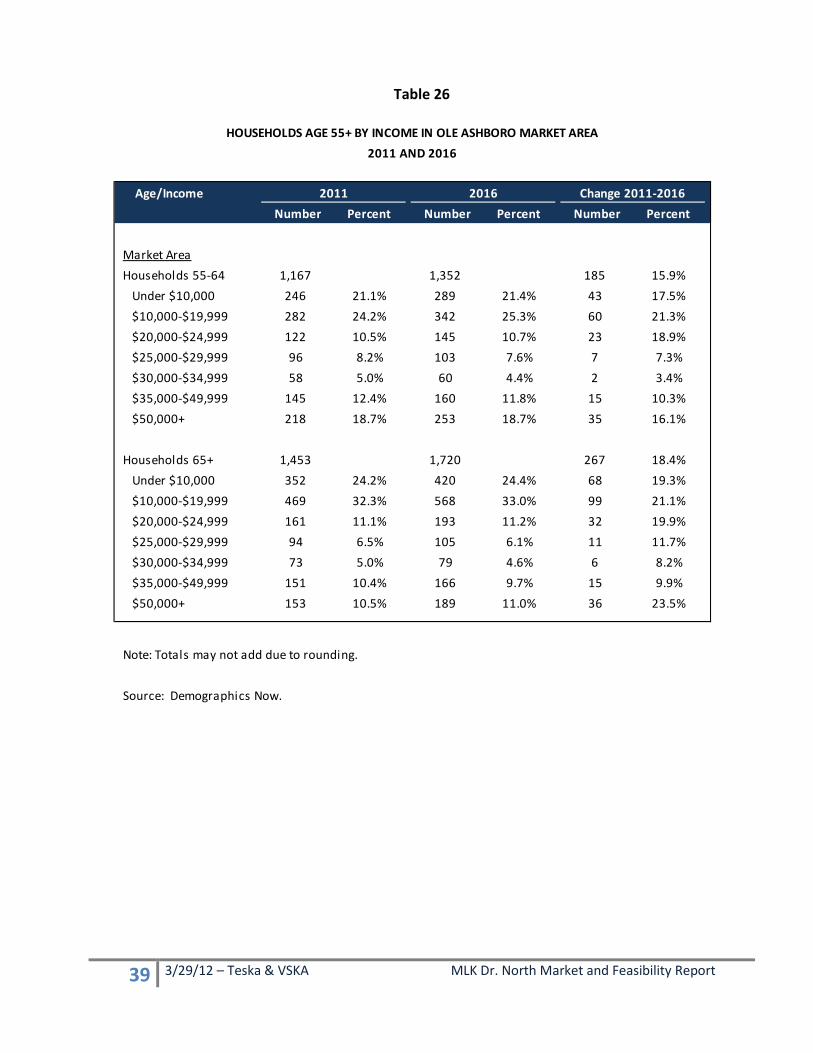
5) The number of market area households under age 65 is projected to increase by 7% over the next five years with largest increase in the number aged 55-64 years, the Baby Boomers. By income, the largest increase will be among households earning less than $20,000 (467).
6) The number of market area households over age 65 is projected to increase by 18% with the largest increase projected among those with incomes under $20,000 (167).
Table 23
Table 24
Number Percent Number Percent
Population 2000 Census 19,814 221,398 2011 Estimated 20,986 249,206 Change, 2000-2011 1,172 5.9% 27,808 12.6% 2016 Projected 23,182 272,087 Change, 2011-2016 2,196 10.5% 22,881 9.2%
Households 2000 Census 7,533 91,168 2011 Estimated 8,202 103,838 Change, 2000-2011 669 8.9% 12,670 13.9% 2016 Projected 8,921 111,645 Change, 2010-2016 719 8.8% 7,807 7.5%
Average Household Size, 2011 2.56 2.40
Population by Age, 2011 Under 5 1,387 6.6% 16,444 6.6% 5-14 2,448 11.7% 30,622 12.3% 15-24 2,840 13.5% 33,582 13.5% 25-44 6,680 31.8% 72,394 29.0% 45-54 3,155 15.0% 37,247 14.9% 55-64 2,065 9.8% 28,723 11.5% 65 and Older 2,411 11.5% 30,184 12.1%
Median Age, 2011 (years) 36.8 37.3
Note: Numbers may not total due to rounding.
Source: U.S. Census Bureau, 2000; estimates and projections from Demographics Now.
GreensboroMarket Area
GREENSBORO AND OLE ASHBORO MARKET AREAPOPULATION CHARACTERISTICS

37 3/29/12 – Teska & VSKA MLK Dr. North Market and Feasibility Report
Number Percent Number Percent
2000 Household Distribution 7,533 91,169
Under $15,000 2,493 33.1% 13,754 15.1% $15,000-24,999 1,653 21.9% 12,858 14.1% $25,000-34,999 1,128 15.0% 13,271 14.6% $35,000-49,999 1,081 14.4% 15,844 17.4% $50,000-74,999 763 10.1% 17,198 18.9% $75,000 or more 415 5.5% 18,245 20.0%
Median Household Income $22,340 $40,158
2011 Estimated Household Distribution 8,202 103,838
Under $15,000 2,989 36.4% 17,634 17.0% $15,000-24,999 1,862 22.7% 13,640 13.1% $25,000-34,999 948 11.6% 13,670 13.2% $35,000-49,999 1,050 12.8% 15,512 14.9% $50,000-74,999 927 11.3% 17,331 16.7% $75,000 or more 426 5.2% 26,052 25.1%
Median Household Income $20,583 $41,077
Note: Totals may differ sl ightly from those in earlier tables due to rounding.
Source: Demographics Now.
GreensboroMarket Area
2000 AND 2011 INCOME CHARACTERISTICSGREENSBORO AND OLE ASHBORO MARKET AREA

38 3/29/12 – Teska & VSKA MLK Dr. North Market and Feasibility Report
Table 25
Number Percent Number Percent Number Percent
Households by Age 8,202 8,921 719 8.8%Age 15-24 509 6.2% 511 5.7% 2 0.4%Age 25-34 1,604 19.6% 1,694 19.0% 90 5.6%Age 35-44 1,775 21.6% 1,843 20.7% 68 3.8%Age 45-54 1,694 20.7% 1,801 20.2% 107 6.3%Age 55-64 1,167 14.2% 1,352 15.2% 185 15.9% Total Under 65 6,749 82.3% 7,201 80.7% 452 6.7%Age 65+ 1,453 17.7% 1,720 19.3% 267 18.4%
Household Income - Under Age 65*$0-$9,999 1,531 22.7% 1,650 22.9% 119 7.8%$10,000-$19,999 1,481 21.9% 1,829 25.4% 348 23.5%$20,000-$24,999 699 10.4% 741 10.3% 42 6.0%$25,000-$29,000 475 7.0% 468 6.5% -7 -1.5%$30,000-$34,999 306 4.5% 307 4.3% 1 0.3%$35,000-$39,999 365 5.4% 373 5.2% 8 2.2%Over $40,000 1,892 28.0% 1,833 25.5% -59 -3.1%
* Percentages are shares of total households under age 65.
Source: Demographics Now
OLE ASHBORO MARKET AREA HOUSEHOLDS UNDER 65 BY INCOME2011 AND 2016
20162011 Change
39 3/29/12 – Teska & VSKA MLK Dr. North Market and Feasibility Report
Table 26
Age/IncomeNumber Percent Number Percent Number Percent
Market AreaHouseholds 55-64 1,167 1,352 185 15.9% Under $10,000 246 21.1% 289 21.4% 43 17.5% $10,000-$19,999 282 24.2% 342 25.3% 60 21.3% $20,000-$24,999 122 10.5% 145 10.7% 23 18.9% $25,000-$29,999 96 8.2% 103 7.6% 7 7.3% $30,000-$34,999 58 5.0% 60 4.4% 2 3.4% $35,000-$49,999 145 12.4% 160 11.8% 15 10.3% $50,000+ 218 18.7% 253 18.7% 35 16.1%
Households 65+ 1,453 1,720 267 18.4% Under $10,000 352 24.2% 420 24.4% 68 19.3% $10,000-$19,999 469 32.3% 568 33.0% 99 21.1% $20,000-$24,999 161 11.1% 193 11.2% 32 19.9% $25,000-$29,999 94 6.5% 105 6.1% 11 11.7% $30,000-$34,999 73 5.0% 79 4.6% 6 8.2% $35,000-$49,999 151 10.4% 166 9.7% 15 9.9% $50,000+ 153 10.5% 189 11.0% 36 23.5%
Note: Totals may not add due to rounding.
Source: Demographics Now.
HOUSEHOLDS AGE 55+ BY INCOME IN OLE ASHBORO MARKET AREA2011 AND 2016
2011 2016 Change 2011-2016

40 3/29/12 – Teska & VSKA MLK Dr. North Market and Feasibility Report
B. Competitive Rental Market for Nettie Coad Apartments and Ole Ashboro
VSKA contacted the manager at Nettie Coad Apartments as well as leasing agents and managers of other affordable housing in the market area and nearby or comparable locations. In addition, we contacted several market rate apartments as a comparison to the rents at the affordable properties.
The table on the following page has a summary of rents at the surveyed properties. Some of the affordable properties have deep subsidies so that residents pay 25-30% of their adjusted income in rent. Some properties are funded through the Low Income Housing Tax Credit program (LIHTC) which has rent and income restrictions. Most of these must rent to households earning less than 60% of the Area Median Income or AMI based on their household size. Some are more restrictive and must rent to those with incomes less than 50% AMI. A detailed table with information on Nettie Coad Apartments and the competitive properties is at the end of this section.
The Nettie Coad Apartments rent to tenants earning less than 60% AMI based on household size. The maximum allowable 2012 incomes for those at 50% and 60% AMI are shown below.
Table 27: Affordability Levels
Income Level 1 Person 2 People 3 People 4 People
50% AMI $19,400 $22,150 $24,900 $27,650 60% AMI $23,280 $26,580 $29,880 $33,180
Key findings of the competitive property survey are:
1) Most of the properties, including Nettie Coad, are well occupied and many have wait lists. The longest wait lists are for those apartments with deep subsidies.
2) Most properties require tenants to pay for heat and electricity. The landlord typically pays for water, sewer and trash.
3) Rents at Nettie Coad Apartments are lower than at LIHTC properties without deep subsidies and market rate Class B properties.
4) While geographically close to Ole Ashboro, the most expensive property surveyed, CityView at Southside, is the top of the market in terms of rents and amenities, and is not directly competitive with Nettie Coad and others in the Ole Ashboro neighborhood.
5) There is likely demand for additional rental housing at Nettie Coad or other key parcels. Due to the demographics of the market area and the competition of market-rate properties, consideration should be given to units that are income-restricted through the use of housing tax credits or other public financial assistance.

41 3/29/12 – Teska & VSKA MLK Dr. North Market and Feasibility Report
Table 28: NETTIE COAD AND COMPETITIVE RENT SUMMARY Property Type 1 Bedroom 2 Bedroom 3 Bedroom Nettie Coad Range $294-356 $335-414 Affordable Range 317-600 336-658 373-737 Market Rate Range 520-850 505-1,225 840

42 3/29/12 – Teska & VSKA MLK Dr. North Market and Feasibility Report
Table 29
Name 1 Bedroom 2 Bedroom 3 Bedroom
AffordableNettie Coad $294-356 $335-414
J.T. Hairston Memorial
St. James Homes* 600 650
Parkside Market rate units 522 591 $685
Trinity Gardens Market rate units 317 336 373Richardson Vil lage 560
Willow Ridge 518-645 592-737
Richardson Hospital 470 550
Rankin School Place 433-527 498-612
Churchview Farm 383-594 448-658
Townhomes at Willow Oaks Market rate (LIHTC) units 557 600 682
Havens at Willow Oaks LIHTC units 581 668
Villas at Willow Oaks
Market RateWillomac $505
Treybrooke Vil lage 520-560 605-615 840
Stoneybrooke 580-610 599-635
CityView at Southside 809-850 1,110-1,225
* After renovation in 2012.Source: Valerie S. Kretchmer Associates, Inc.
30% of income
30% of income
25% of income
30% of income
30% of income
30% of income
RENT SUMMARY OF COMPETITIVE AFFORDABLE AND MARKET RATE PROPERTIES

43 3/29/12 – Teska & VSKA MLK Dr. North Market and Feasibility Report
NETTIE COAD COMPETITIVE APARTMENTS March 2012
Name and Location Year # of Square Average Occupancy Amenities and Comments
(all Greensboro) Opened Units Unit Type $ Footage Rent/S.F. (%)
(Bed/Bath)
Nettie Coad Apartments 1990 30 100%503 Martin Luther King Drive rehab 13 1/1 $294 590-755 $0.39-0.50
336-272-6844 7 1/1.5 Loft 356 915 0.39
6 2/1 335-374 1,139 0.29-0.33
4 2/2 385-414 802 0.48-0.52
Affordable Family PropertiesJ.T. Ha irs ton Memoria l Apartment 1972 108 1/1 30% of NA NA 100%718 Marsh Street 2/1 income NA NA336-275-2902 3/1 NA NA
4/1 NA NA
St. James Homes 1972 90 now 1/1 $600 NA NA NA1228 S. Eugene Street rehab inafter rehab 2/1.5 650 900 0.72336-275-4572 2012 84
Parks ide Apartments NA 71 100%306 A O'Connor Street 59 Subs idized336-275-0026 1/1 30% of 554
2/1 income 7563/2 982
12 Market Rent1/1 $522 554 $0.942/1 591 756 0.783/2 685 982 0.70
Rental Range
Adaptive re-use of elementary school . Al l uni ts for tenants at 60% AMI. Lofts are 2 levels . Uni ts have s tove, refrigerator and carpeting. Community room and laundry room. Tenant pays for power. Monthly uti l i ty bi l l es t. at $50-60. Higher rents shown are for new tenants . Last rent increase August 2010. Ha l f of tenants are over 50. Severa l col lege s tudents . 3 uni ts have fami l ies with chi ldren. 17% turnover in 2011. Do not accept Section 8 vouchers .
HUD-funded. Rehabbed in 2008. Units have s tove and refrigerator. Laundry faci l i ties , community room, playground. Wait l i s t 6 months-3 years . Longest i s for 1 BR (only 16 uni ts ). Majori ty of uni ts have 2 BRs so shortest wait l i s t.
HUD-funded. 59 uni ts have Section 8 subs idy. Uni ts have s tove, refrigerator and dishwasher. Laundry room, community center, playgrounds . Rehabbed 3 years ago. Wait l i s t longest for 1 BR (3 years ) s ince have only 10.
HUD-funded ini tia l ly but exis ting subs idized tenants are being relocated. Rehab to s tart in Apri l 2012. Rents and uni t s i zes are approximate. After rehab uni ts wi l l have s tove, refrigerator and poss ibly dishwasher and washer/dryer connections . Community space. Tenants wi l l pay for electrici ty and water.

44 3/29/12 – Teska & VSKA MLK Dr. North Market and Feasibility Report
NETTIE COAD COMPETITIVE APARTMENTS March 2012
Name and Location Year # of Square Average Occupancy Amenities and Comments(all Greensboro) Opened Units Unit Type $ Footage Rent/S.F. (%)
(Bed/Bath)
Townhomes at Wi l low Oaks 2004 110 100%1801 Everi tt Street 70 1/1 30% of336-691-9675 2/1 and 2/1.5 TH income
3/2 and 2.540 Market (LIHTC) Rent
1/1 $557 667 $0.842/1 and 2/1.5 TH 600 863-938 0.64-0.70
3/2 and 2.5 682 1,219-1,242 0.55-0.56
The Havens at Wi l low Oaks 2007 60 2/1-2 & 2/2.5 TH $581 1,044-1,238 $0.47-0.562000 Everi tt Street 3/2 & 3/2.5 TH 668 1,377-1,463 $0.46-0.49336-272-1123
30 30% of income
Trini ty Garden Apartments 1969-70 152 Subs idized 100%2221 A-H Ti l lman Avenue 1/1 25% of336-272-8774 2/1 income
3/1Contract Rent
1/1 $317 530 $0.602/1 336 684 0.493/1 373 915 0.41
Richardson Vi l lage 2002 24 2/1.5 $560 870 $0.64 88%600 Dewitt Street rehabbed336-273-0050
Wi l low Ridge 1999 76 2/2 $518-645 1,021 $0.51-0.63 97%2031 Wi l low Road 3/2 592-737 1,262 0.47-0.58866-592-0120 4/2 638-802 1,377 0.46-0.58
HOPE VI and LIHTC. Units have s tove, refrigerator, washer/dryer, dishwasher, centra l HVAC. Community room and access to fi tness center. Maximum al lowable income is 60% AMI. Tenants pay electrici ty. Uti l i ty a l lowance: 1 BR: $63; 2 BR: $87; 3 BR: $112. Wait l i s t for deeply subs idized uni ts 1-3+ years . Short wait l i s t for market rent.
Outs ide Market Area. LIHTC. Rents shown for 50% and 60% AMI. Units have s tove, refrigerator, dishwasher, disposa l , washer/dryer connections , a i r conditioning. Clubhouse, pool , playground, bus iness center, laundry room. Uti l i ties extra . Wait l i s t for 2 BR apts . Vacancies in 3 BRs .
HOPE VI and LIHTC with 30 uni ts with deep subs idy for those at 30% AMI. Other uni ts at 60% AMI. Units have s tove, refrigerator, dishwasher. Laundry center and bus iness center with 2 computers . Uti l i ty a l lwance: 2 BR: $81; 3 BR: 97. Wait l i s t with about 25 names.
Outs ide Market Area. Section 236. Units have range and refrigerator. Laundry room. Maximum al lowable income is 80% AMI. Wait l i s t 1-3 months .
LIHTC. Older property renovated in 2002. Units have s tove, refrigerator, washer/dryer connections . Laundry room in nearby Richardson Hospita l apartments . Wait l i s t with 4 names. Maximum income 60% AMI. Only 4 fami l ies . 8 voucher holders .
Rental Range

45 3/29/12 – Teska & VSKA MLK Dr. North Market and Feasibility Report
NETTIE COAD COMPETITIVE APARTMENTS March 2012
Name and Location Year # of Square Average Occupancy Amenities and Comments(all Greensboro) Opened Units Unit Type $ Footage Rent/S.F. (%)
(Bed/Bath)
Affordable Senior PropertiesVi l las at Wi l low Oaks 2003 40 100%1806 Morning Joy Place 37 1/1 30% of 716 NA336-691-9675 3 2/1 income 912 NA
Richardson Hospita l 2002 32 1/1 $470 700 $0.67 91%603 Benbow Road rehabbed 2/1 550 800 0.69336-273-0050
Churchview Farm Feb. 68 1/1 $383-594 675 $0.57-0.88 96%2302 Old Chapman Street 2010 2/1 448-658 901 0.50-0.73336-316-0456
Rankin School Place 561603 Spry Street 48 1/1 $433-527336-375-6711 8 2/2 498-612
NA Not Avai lableSource: Va lerie S. Kretchmer Associates , Inc.
Rental Range
LIHTC. Adaptive re-use of 3-s tory hospi ta l . Elevator bldg. for ages 55+. Al lowed to have 5 res idents under 55. Most are ages 55-60. Units have s tove, refrigerator, cei l ing fan. Laundry and community room. Maximum income is 60% AMI. 12 voucher holders .
Outs ide Market Area in Charles B. Aycock His toric Dis trict. LIHTC. Units have s tove, refrigerator, dishwasher, washer/dryer connections , patio. Activi ty room, computer center, laundry, outdoor seating, garden. Age 55+. Max. income 60% AMI.
LIHTC outs ide market area. Rents shown are for 40% AMI and 60% AMI. Units have s tove, refrigerator, dishwasher, washer/dryer connections . Community bui lding with laundry room and community room. Outdoor gri l l , picnic area, gazebo, walking path. Tenants pay electrici ty. Uti l i ty a l lowance 1 BR: $51; 2 BR: $64. "Quite a few" voucher holders . Wait l i s t with 10 names.
HOPE VI. Age 55+. Open to those earning less than 60% AMI. Units have range, refrigerator, dishwasher, washer/dryer, centra l HVAC. Uti l i ty a l lowance $83 for 1 BR. Community room and access to fi tness center. Wait l i s t.

46 3/29/12 – Teska & VSKA MLK Dr. North Market and Feasibility Report
UNSUBSIDIZED APARTMENTS NEAR THE MARKET AREA March 2012
Name and Location Year # of Rental Range Square Average Occupancy Amenities and Comments(all Greensboro) Opened Units Unit Type $ Footage Rent/S.F. (%)
(Bed/Bath)
Wil lowmac Apartments 1972 50 2/1 $505 826 $0.61 80%1810 Wi l lowmore Street877-860-9552
Treybrooke Vi l lage 2000 318 1/1 $520-560 630-646 $0.83-0.87 86%117 Teakwood Drive 2/2 605-615 862 0.70-0.71
2/2 + s tudy NA 1,077 NA3/2 840 1,280 0.66
Stoneybrook 1982 126 1/1 $580-610 692 $0.84-0.88 91%258-A Webster Road 2/2 599-635 892 0.71-0.67888-810-0175
CityView at Souths ide 2008 276 Studio $709-875 606 $1.17-1.44 98%311 King Street 1/1 809-850 777 1.04-1.09336-379-0101 2/2 1,110-1,225 968 1.15-1.27
Source: Va lerie S. Kretchmer Associates , Inc.
866-581-7820
Refrigerator, s tove, dishwasher, disposa l , some have microwave, patio or ba lcony, outs ide s torage, washer/dryer connections , cei l ing fans . Fi tness center, pool , weight room, laundry, tennis court, clubroom, playground and gri l l ing areas . Tenants pay uti l i ties .
Representative upsca le apartment complex catering to younger profess ionals working downtown. Stove, refrigerator, dishwasher, disposa l , washer/dryer connections , cei l ing fan, 9' cei l ings , grani te countertops , ba lconies . Bus iness center, clubhouse, fi tness center, pool and rooftop deck, sports room, X-box/PlayStation 3 room, cyber care/free wireless internet, gated access . Uti l i ties extra . Must be 21 or older. Some graduate and law s tudents . Another bui lding under const. and wi l l open in June with 78 uni ts , mostly s tudios .
Garden apts . Stove, refrigerator, outs ide s torage, fi replaces ava i lable. Pool , wel lness center, tennis court, playground, detached garages . Markets to s tudents . Washer/dryer connections ava i lable. Tenants pay a l l uti l i ties .
Stove, refrigerator, dishwasher, disposa l , washer/dryer connections , cei l ing fans , ba lcony, a i r conditioning. Tenants pay uti l i ties . No common area amenities .

47 3/29/12 – Teska & VSKA MLK Dr. North Market and Feasibility Report
D. Rental Properties in Larger Trade Area
Interviews report that the rental housing market has become increasingly tight, particularly at the affordable end of the housing market. Listing prices range from $400 for studios to $800 and above for two to three bedroom buildings with amenities. Within the 27406 zip code, median rent is $0.63 per square foot, equal to $504 for a one bedroom, 800 sq. ft. apartment or $630 for a two bedroom, 1000 sq ft apartment. A detailed listing of comparison rental properties is included in Section F.
Table 29: Median Rent Per Sq. Ft. Table 30: Rent Asking Prices
Source: Zillow.com, March 6, 2012
Interviews with brokers and developers demonstrate interest in the market for development of rental housing. Price points reported by brokers support the listings shown in the market. Brokers and owners report much less need for incentives such as free first month rent than 1 year ago. Larger units with parking at affordable levels are most desirable. Based on a relatively affordable market, there has been a cap at which rental projects are successful. As rents rise, households have tended to move into homeownership, although this may be changing as underwriting has tightened and there is increased desire for rental housing. In addition, housing for students continues to grow in the central area of Greensboro, and while each of the colleges have pending rental housing developments, new housing in MLK N. that is designed as one or two bedrooms that can be used by small households and students may increase the breadth of the market and meet the growing demand for rental housing.

48 3/29/12 – Teska & VSKA MLK Dr. North Market and Feasibility Report
For the A1 and A2 sites, rental housing that can bridge and connect to Southside and Downtown would be ideal for the location, providing high quality design, but meeting market demand at appropriate, competitively based rent levels. This may require participation in the projects to bring rents into an affordable level, such as through housing tax credits or other similar products.

LEE
BRAGG
PEAR
SO
N
AR
LIN
GTO
N
VANC
E
DOUGLASB
ELLEV
UEM
ARTIN
LUTH
ER K
ING
JR
BROOKS
MUR
RAY
GIS data provided by the City of Greensboro; map prepared by Teska Associates, Inc.
Martin Luther King Jr. Drive North | Market & Feasibility Study Reports
°0 100 200 300 40050Feet
Redevelopment Sites Last Revised: March 12, 2012
City of Greensboro, North Carolina
A-1
A-2
A-3
A-4

50 3/29/12 – Teska & VSKA MLK Dr. North Market and Feasibility Report
9. Site Recommendations
A1: New Zion Church Site
Site A1 is being planned for mixed-use development. New Zion Church is currently developing a 28,000 sq. ft. new church with the capacity for 800 seats. The church currently has 600 members and has been growing since 2008. With a new church building, the membership is expected to continue to grow. The church is being planned to be located at the eastern end of the site at the top of the hill and will be visible from Lee Street and MLK. Entry to the church will be off of Bragg Street.
The former firehouse is owned by New Zion Church. There is also a small vacant corner property, but any new development will need to be set back from Bragg Street as a bike path is being planned along the street within the A1 Site. Because of the visibility of the firehouse on MLK and the ability to expand or use of outdoor area along the corner, this site is the best available retail or mixed use portion of the property. While the reuse of the building and site area will not allow a large retail facility, the first floor could be used as a coffeehouse or small restaurant with open seating and flexible use of the space. Community uses could still be provided on the second floor. In addition, a small addition or outdoor seating area could be provided on the vacant corner parcel, increasing visibility and use of the coffeehouse and taking advantage of access to the adjacent bike path and residences that are being planned across MLK.
New Zion Church Street Seen from Lee St. and MLK

51 3/29/12 – Teska & VSKA MLK Dr. North Market and Feasibility Report
The first floor of the Fire House could be renovated for a commercial use with an addition or outdoor seating area on the corner of MLK and Bragg St.
Current plans call for retail uses along Bragg St. west of MLK. With no visibility to either Lee Street or MLK, and very low traffic, Bragg St. does not have sufficient traffic or visibility to support retail uses. In addition, the development costs of retail space are higher than current rents in the area can support. A housing use – whether it is attached single family homes, senior housing, or a small multi-family building is appropriate along Bragg Street for several reasons:
• Market demand for rental and senior housing is growing • New housing along Bragg would connect the demand driven by development being planned at Elm
Street and Lee Street and the A2 property on the east side of MLK • Walking and biking distance to downtown • Proximity to universities and the need for housing in the marketplace

52 3/29/12 – Teska & VSKA MLK Dr. North Market and Feasibility Report
Several Bikers Were Seen Using Bragg Street
A-2: New Rental Housing
The A-2 site is being developed by TND Partners for 168 apartments. The project will be financed with a shallow subsidy through a 221 d)4) program, without income restrictions, but marketed to households with income below 60% of AMI. There are currently 5 buildings planned with heights of 2-3 stories. The developer is working with the developer to plan for a y-shaped connection between S. Morrow Blvd. across Lee St. and south towards Bragg St.
Residential along MLK will be designed to be allowed to be converted to commercial. The development is planned to be a traditional neighborhood design of appropriate scale and walkability that will provide a neighborhood feel and connection that bridges development across Lee Street into Southside, and the single family nature of Ole Asheboro towards the east and south.
Rents will be affordable to prospective residents in the target market. The goal is to have a mix of households, as an affordable, neighborhood apartment building with a mix of families, students and seniors. In addition to Best Management Practices being designed for the landscaping and stormwater, the developer will design their portion of the bike path which will run along the new street being planned to connect Morrrow and Bragg St.
Based on market demand and evidence based on numerous interviews with residential brokers, developers, and property managers, and analysis of market comparables, there is sufficient demand to support the type of development proposed by TND Developers.

53 3/29/12 – Teska & VSKA MLK Dr. North Market and Feasibility Report
A-3 – Nettie Coad
Nettie Coad Apartments are available to tenants earning less than 60% AMI based on household size, although the average tenant income is lower than that allowable. Nettie Coad’s rents are well below Low Income Housing Tax Credit (LIHTC) and Class B market rate apartments. Interviews with the property manager supported the value of the property in the marketplace leading to zero vacancy of apartments.
In 2011, major energy efficiency upgrades were made utilizing HOME and Better Buildings. Improvements made include 144 new energy efficient windows, all new exterior doors, new refrigerators in each unit, new common laundry machines. This has brought down the utility bills of tenants. The City will be keeping track of the energy savings per tenant as a result of the grant funds that were made available for the energy efficiency upgrades.
There are two areas behind the site
that are available for additional housing development and the northeast and southeast portions of the site. Due to a significant elevation change, these two pieces should be thought of as supporting two or more separate buildings. Based on the residential market analysis, there is capacity to support demand for affordable or mixed-income new housing. Rents for new housing will be capped based on the funding scheme used.
Only 15 of 30 units have cars. With three parking lots for Nettie Coad, there is currently an excess of a parking that can either be used for new development on site, or reprogrammed as part of a redevelopment effort of the vacant areas.
There are two approaches that could be used to pursue new housing on-site: either a Planned Development for the block or subdivide the parcel into two or 3 parcels and pursue rezoning of the property.
The property is large enough to support various housing products: from townhomes to two or three story multi-family buildings, to a larger multifamily building similar to Nettie Coad in scale. Because of single family housing to the east and the efficiency of development cost, a two-three story multifamily building or buildings may be the best fit for the site and market demand. A more detailed site analysis would need to be conducted to determine the number of units and the affordability level of each unit based on the type of financing that will be pursued.
Nettie Coad Apartments

54 3/29/12 – Teska & VSKA MLK Dr. North Market and Feasibility Report
Based on numerous interviews with brokers, a high quality, affordable or mixed-income rental project could be very successful in the market place. Due to the location of the site and adjacency to Nettie Coad, new development should be compatible with the design of the existing building and compliment the site. A project with support from Housing Tax Credits, for example, could be very successful on the site and be blended with a mixed-income approach. Obtaining Housing Tax Credits, however, will be a challenge due to the State’s criteria for determining a stable housing market and proximity to retail amenities. The development of A1, A2 and Elm Street sites are likely to improve the viability of moving forward with a Tax Credit application to the NCHFA.

55 3/29/12 – Teska & VSKA MLK Dr. North Market and Feasibility Report
A-4: Vacant Retail Parcel
A-4 is currently a vacant lot owned by the City. At one time, the lot held a grocery store. Based on the retail market analysis, a retail development on the parcel could be viable. The lot with excellent visibility to MLK and a deep lot has sufficient space for a mid-size retail use that could be general merchandise or a grocery store, or be divisible into restaurant and/or miscellaneous retail.
Based on the sites available in the market area, A-4 has the best visibility and access for the neighborhood and traffic along MLK. While there may be challenges in the short-term to attracting a quality retail tenant with sufficient rent to justify development costs, this site should be retained for retail development which will become more viable as the church and new residents are built and retail rents in the marketplace rise.
The site could support a 20,000 sq. ft. retail anchor with sufficient parking to support the retail use. The site could either be a single user or multiple users. In addition to a possible grocery store, restaurants, services, and small general merchandise stores would be good fits for this site.
Vacant Land at A3 (Behind Nettie Coad) and A4 Sites