north central pennsylvania regional planning and ... action strategy page 3 introduction the north...
TRANSCRIPT

North Central Pennsylvania Regional Planning and Development Commission
June 24, 2008

This page intentionally left blank.

Table of Contents Executive Summary........................................................................................................................................ 1 Introduction .................................................................................................................................................... 3 Summary Observations .................................................................................................................................. 4 North Central - Outlook .................................................................................................................................. 6 Strategic Goals, Objectives, and Projects ..................................................................................................... 19 Regional Strategies, Objectives, and Projects – Plan Matrix ........................................................................ 20 Implementing the Plan .................................................................................................................................. 29 LUTED Process Overview ........................................................................................................................... 30 Ongoing Process Flowchart .......................................................................................................................... 36 Appendix 1 - Investment Criteria and Measures .......................................................................................... 37 Appendix 2 – Project Worksheet .................................................................................................................. 38 Appendix 3 - Scoring Matrix ........................................................................................................................ 45 Appendix 4 - Regional Outcome Measures Scorecard ................................................................................. 48 Appendix 5 – NCPRPDC Strategic Plan ...................................................................................................... 49 Appendix 6 - Long Range Transportation Plan (LRTP) ............................................................................... 50 Appendix 7 - Comprehensive Economic Development Strategy (CEDS).................................................... 52 Appendix 8 – Keystone Principles ............................................................................................................... 54 Appendix 9 – North Central Pennsylvania Regional Planning and Development Commission ................... 60 Appendix 10 – Current Rural Studies: “Conventional Wisdom” ................................................................. 63

REGIONAL ACTION STRATEGY
Page 1
Executive Summary
In an effort to enhance the integration of transportation and land use planning with economic development, the Commonwealth is supporting the development of ten Regional Strategic Action Plans to address these issues. The intention of the strategic plan process is to encourage the exchange of meaningful strategies on how communities can soundly manage growth and development to efficiently and effectively link land use, transportation, and economic development decision-making at the regional scale. The Commonwealth of Pennsylvania’s Keystone Principles for Growth, Investment and Resource Conservation act as the foundation criteria for these plans and their priority recommendations. State Agencies will use these plan recommendations for regionally significant investment decisions. The Regional Action Strategy (RAS) is a framework and an implementation guide for identifying local projects that will have demonstrable positive regional socio-economic impact. The strategic goals and objectives of the RAS are based on the requirements for renewed growth and improved prosperity. The RAS rests on the premise that projects that are linked to strategies intended to increase economic productivity and competitiveness will cause improved regional prosperity. Economic performance is measured by factors such as employment growth, unemployment rate, population growth, wage growth, and inbound capital investment. These are important in order to determine future productivity and growth. As productivity of the regional economy increases, so does the value of the goods and services of the region. This results in higher wages and improved standard of living, the building blocks of prosperity. The regional action strategy is founded on a combination of targeted stakeholder outreach, review of existing plans, and extensive economic research regarding rural economic development to ensure its applicability to the unique challenges of the North Central region. The RAS integrates plans that currently exist in the region: The Comprehensive Economic Development Strategy (CEDS), the Long Range Transportation Plan (LRTP), County Comprehensive Plans, the North Central Strategic Plan, and Tourism Marketing Plans. The RAS also integrates applicable criteria directly from the Keystone Principles. In short, the RAS integrates land use, transportation, and economic development through a practical implementation. NCPRPDC completed an ongoing and inclusive outreach to regional, county and municipal officials, residents, business and commercial interests and representatives, the administrators of institutions of higher education, and economic development groups. Common themes were consistently offered as descriptive regional characteristics, such as:
• Rural and isolated • Natural forests and scenic views • Specialized industries and manufacturing • Poor infrastructure • Community pride and historic heritage • Safe, clean, good quality of life • Small population, large region
Regional liabilities that were consistently mentioned were: • Lack of regional vision and identity • Economy not sufficiently diversified • Lack of skilled workers • Young people leaving • Lack of affordable and quality housing • Regional competition and parochialism

REGIONAL ACTION STRATEGY
Page 2
The North Central region has its own unique economic profile. It is this unique composition that drives priorities for improving productivity and competitiveness. The economic structure is based on a combination of factors: economic assets, such as natural resources or location, and investment choices, such as infrastructure. Opportunities flow from the combination of market-based conditions in making informed investment choices. Investment criteria and performance measures were formulated from common themes and findings identified in the regional outreach to distinguish “Projects of Regional Significance” from “regular” ongoing operational or maintenance projects. “Projects of Regional Significance” leverage regional resources, and, by definition, are aligned with consolidated strategies, goals, and objectives. They therefore demonstrate a more definitive impact. These projects will invest in the people of the region, in education and development of world-class skills. The projects will build community capacity by investing in roads, bridges, infrastructure, housing and destination attractions, and in turn, promote development and private investment. They will build and expand business capabilities to improve productivity and competitiveness – and profitability. These projects will ultimately attract more people – residents, employees, and visitors – because the cumulative result will improve the standard of living and prosperity of the region. Above all, this RAS process will foster an essential regional dialogue about investment choices that spans organizations, policies, programs, and jurisdictions. A primary challenge of the Regional Action Strategy is to provide a sustainable process and framework to create better conditions for existing regional firms to achieve high productivity and sustainable growth while at the same time attending to environmental stewardship and conservation. A Project Review Committee will be responsible for evaluating projects for significant impact, and monitoring the effects on the regional economy. The process depends on active involvement of the review committee to pursue the strategies in the RAS.

REGIONAL ACTION STRATEGY
Page 3
Introduction
The North Central Pennsylvania Regional Planning and Development Commission (NCPRPDC) is in the process of developing a Regional Action Strategy to link Land Use, Transportation, and Economic Development decisions which will include:
• Priority projects and investments consistent with the Commonwealth’s Keystone Principles for Growth, Investment, and Resource Conservation.
• Criteria that will yield significant economic development impact and that are strategically the most important to the region.
• A process and/or criteria by which regionally significant projects and investments can be determined on a regular basis.
• Identification of partners and implementing agencies related to each recommendation.
• Mechanisms, tools, or systems used to promote coordination within programs of land use, transportation, resource conservation, and economic development decisions and investments.
• A plan for maintaining and updating the Regional Action Strategy plan.
• Continuing engagement and a process for sustained coordinated planning within the region to maintain and help implement the plan.
NCPRPDC has taken an innovative approach by coordinating efforts to ensure commitment from various stakeholders and alignment to achieve breakthrough strategies and actions. This is not a traditional plan belonging to one organization. The intention is for a variety of involved organizations – public and private – to take ownership and move the plan forward. In order to determine investment priorities and return on investment of programs and initiatives, the region needs to determine what is important for the future. That which is important in the future for the region is defined by, and embedded in, strategic choices. This process to evaluate program or project investment is not intended as an additional layer of review or bureaucracy, but rather a baseline set of investment criteria that can be used by all programs in ensuring consistency and integration of programs to overall regional strategy. The process will be sustained through the NCPRPDC programs’ use when evaluating programs submitted for funding by the stakeholders. Other agencies are also encouraged to utilize the RAS The RAS technical memorandum identifies interim findings of research, synthesizes existing plans, summarizes key data and trends, and describes the implications for the North Central region. Each of the findings is related to improving the economic competitiveness and quality of life opportunities for future strength and sustainability of the North Central communities. The key to a comprehensive implementation is an ongoing, integrated planning process which addresses four key elements:
• Vision – Where do we want to be?
• Analysis – What is the outlook for the future?
• Strategic Choices – Where to target investments in the region?
• Decisions – What is important to us to ensure a better future?

REGIONAL ACTION STRATEGY
Page 4
Summary Observations
Generally, the North Central region, assuming current trends continue in the future, will face declining municipal revenues as a result of shrinking populations, fewer high-quality, high-paying jobs, and further declines in local tax-bases, all together resulting in difficulty in achieving higher prosperity and quality of life. Stated more simply, slow growth, population loss, and low-wage jobs replacing high-paying jobs will ensue unless a strategy based on intervention is developed and implemented. The following observations were drawn from evaluating a wide range of data using the same considerations of a private investor and industry site selectors.
The region’s population growth rate is declining while the population is aging.
The region needs more people. Population change is a general indicator of the overall vitality of a region. North Central’s population has declined since 2000. Of the counties in Pennsylvania that have the greatest decline in population, the region has three of the top ten: Cameron, Elk, and McKean. At the same time, the median age of the region has increased faster than the state rate. An increasingly aging population will likely rely on fixed incomes and add stress on the region’s health care services and human services providers. Increasingly, these “public transfer payments” are sustaining personal income for the growing aging segment of the population.
The North Central region is large and sparsely populated.
The North Central region has a “real” population density of approximately 68 persons per square mile, excluding unusable public lands. The decentralized nature of the region’s settlement pattern has particular implications on the efficiency and effectiveness of public services. Conversely, the scenic nature of the region can be considered an economic asset, especially for recreational tourism. The region appears to have an abundance of natural resources, such as coal, lumber, natural gas, and minerals.
The region’s ethnicity is predominately homogeneous.
The non-white population is only 3.4 percent, compared to the state rate of 15 percent and almost 20 percent nationally, even though the white population has decreased by 2.6% since 2000. Research shows that the more a region embraces diversity, the greater the capacity for innovation and entrepreneurship.
The educational proficiency and achievement is lower than state and national averages.
More than half of the school districts in the region have 11th grade proficiency rates in math and reading that are below the state average. Educational achievement, the percentage of residents with a post-secondary education or bachelor’s degree or higher, is less than the state average. Educational achievement can be considered an indicator of innovation and entrepreneurial capacity, and a key factor for industry site selectors.

REGIONAL ACTION STRATEGY
Page 5
Unemployment rates closely follow state and national trends.
Unemployment rates in the region have run higher than Pennsylvania overall. More recently, unemployment rates have increased, and they continue to be higher than the state and national averages. Unemployment rates are the most recognized indicator of the economic health of a region.
The region’s substantial powdered metals industry cluster is consolidating internationally.
Despite slight declines in numbers employed in recent years, the North Central region depends heavily on Powdered Metals and Metals Manufacturing, having employed 24% of the workforce in 2003. The industry cluster retains a substantial regional competitive advantage, although it is susceptible to economic restructuring due to consolidation and internationalization. This has been proven to some degree by the selling of family-owned metals enterprises in the past few years to large, international firms. There have been recent increases in service sector employment which do not usually translate into middle-class family-sustainable incomes.
There is a general lack of planning for land use throughout the region.
Of the region’s 157 municipalities, fewer than half (58) have a comprehensive plan. Only 34 have a land development ordinance. Many areas in the region are restricted in possible growth because they are surrounded by state or national parks. Land use for these areas is less of an issue because the use is driven by federal legislation imposed on local municipalities. The lack of planning in the areas that can be developed and are available for possible future growth can lead to uncoordinated development, undesirable uses of land, and sprawl.
The region needs a common “brand” identity and destinations to attract people.
A common perception of the region is that, although isolated and hidden, it has many scenic, open views and it is considered a wholesome, community-friendly oasis with many opportunities for outdoor recreation and tourism. However, a review of various regional, county, and statewide tourism websites and marketing materials presents fragmented, varied, and potentially competing messages.
NCPRPDC operates a variety of economic development, transportation, social, and workforce development programs.
The programs have varied funding sources and measure program-specific outcomes. There is a need to integrate the process of evaluating and communicating project decisions on two levels: 1) consistent and standard region-wide investment criteria and 2) individual funding source criteria within an internal NCPRPDC mechanism to communicate decisions that are made by one program that impacts another.
REGIONAL ACTION STRATEGY
Page 6
North Central - Outlook
The people of the North Central region may be its greatest strength (characterized by their strong work ethic), but its lack of diversity and less than average educational achievement levels may limit its ability to take advantage of entrepreneurial opportunities and attract additional creative talent.
Population Trends
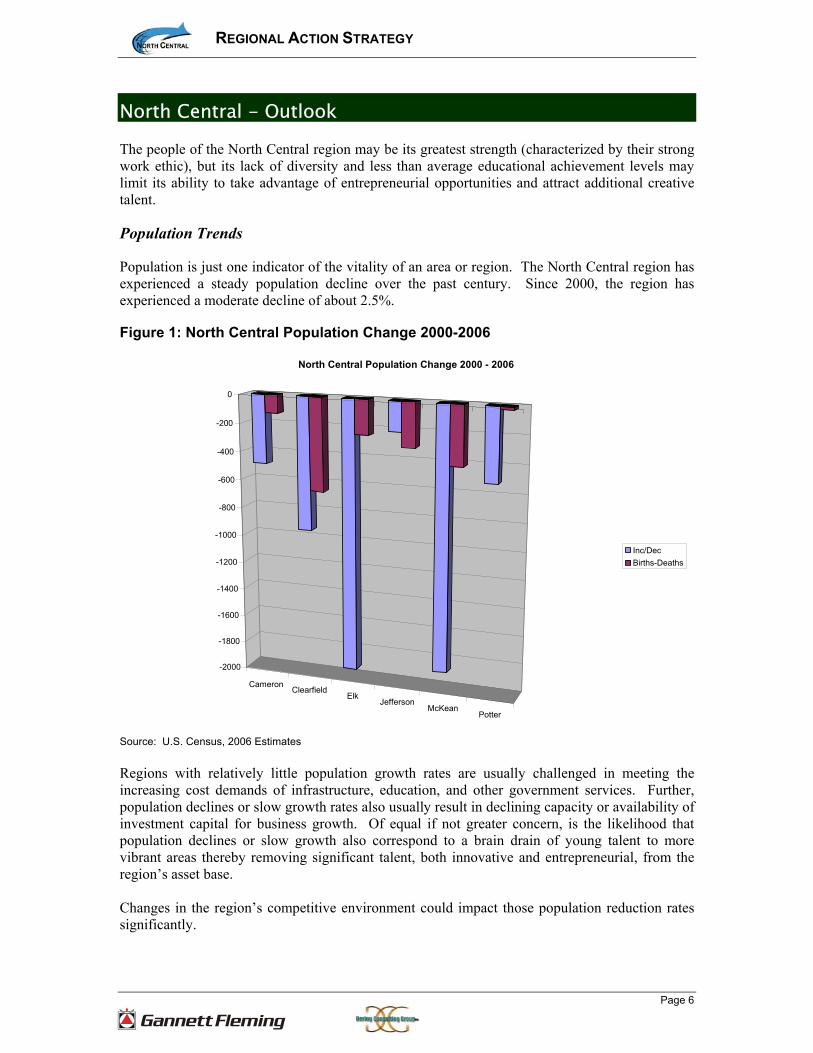
Population is just one indicator of the vitality of an area or region. The North Central region has experienced a steady population decline over the past century. Since 2000, the region has experienced a moderate decline of about 2.5%. Figure 1: North Central Population Change 2000-2006
Cameron Clearfield
ElkJefferson
McKeanPotter
-2000
-1800
-1600
-1400
-1200
-1000
-800
-600
-400
-200
0
North Central Population Change 2000 - 2006
Inc/DecBirths-Deaths
Source: U.S. Census, 2006 Estimates Regions with relatively little population growth rates are usually challenged in meeting the increasing cost demands of infrastructure, education, and other government services. Further, population declines or slow growth rates also usually result in declining capacity or availability of investment capital for business growth. Of equal if not greater concern, is the likelihood that population declines or slow growth also correspond to a brain drain of young talent to more vibrant areas thereby removing significant talent, both innovative and entrepreneurial, from the region’s asset base. Changes in the region’s competitive environment could impact those population reduction rates significantly.

REGIONAL ACTION STRATEGY
Page 7
Every county in the region has experienced a population decline since 2000. Projecting the population to 2020, using a mathematical model, indicates that Cameron, McKean, and Elk will endure a further decline, as indicated in the following table. Table 1: County Population Change, 2000-2020 North Central Counties 2000 20061 % Change
(00-06) 20202
(Proj.) % Change
(06-20) Cameron 5,940 5,490 - 7.60% 5,270 -4.08% Clearfield 83,390 82,440 - 1.14% 82,590 0.17% Elk 35,050 33,180 -5.34% 32,200 -3.04% Jefferson 45,950 45,730 -0.48% 45,360 -0.81% McKean 45,850 44,070 -3.88% 42,760 -3.06% Potter 18,150 17,750 -2.20% 17,710 0.80% Region 234,330 228,660 -2.42% 225,890 -1.21% Pennsylvania 12,286,910 12,440,620 1.25% 13,286,320 6.80% Source: 1-U.S. Census; 2-Mathematical Trend Analysis based on 1997 - 2006. However, a three to four percentage decline over a fifteen-year period is insignificant on an annual basis. The population, at best, will be stagnant over the next decade.
Age Profile
The graying of Pennsylvania has been a common topic of transportation and economic planning in recent years. The “Baby Boomer” generation (those born between 1945 and 1963) has created economic and transportation implications throughout its existence. As the front end of this group moves into the region’s more senior demographic ranks, it will continue to have significant economic ramifications for the region. Figure 2: Northern Central Age Cohort as a Percentage of Population – Projections to 2020
North Central Population % By Age Cohort 2000 - 2020
0.00%
5.00%
10.00%
15.00%
20.00%
25.00%
0-17 18-34 35-49 50-64 65-74 75-84 85+
200020062020
Source: Us Census, Woods & Poole, Inc., 2007

REGIONAL ACTION STRATEGY
Page 8
As demonstrated in the following table, the population segments that are most dependent, 0-17 and over 65, are increasing and projected to increase. This trend has implications on health and human service providers and services. Further, this region may be forced to deal with the implications of these changes before the rest of the state, in terms of meeting changing demands on the transportation system, the linkage of transportation systems, as well as the economic transitions of an older workforce and greater percentage of residents in retirement. Table 2: Population by Age Cohort (000’s) – 2000-2020 North Central
Cohort 2000 2006 20201 0-17 54.87 48.41 48.05 18-24 17.70 17.76 14.17 25-29 13.39 14.20 12.82 30-34 15.55 12.57 14.35 35-39 17.65 15.09 15.75 40-44 19.04 17.14 14.73 45-49 17.06 18.72 13.95 50-54 15.25 17.49 16.59 55-59 12.39 15.37 18.14 60-64 11.14 12.01 18.81 65-69 10.07 9.88 15.30 70-74 10.14 8.22 12.30 75-79 8.64 8.19 8.23 80-85 6.21 6.74 5.66 85+ 5.19 6.67 9.52
Source: U.S. Census; 1- Projections from Woods & Poole, 2007 As depicted in Table 3, the median age of residents is increasing in each of the North Central counties, and at a rate exceeding the rate of the state overall. From 2000-2005, the region’s median age has increased by an average of 5.1%, versus the state rate of 4.5%. Table 3: Median Age (2000-2005) North Central Cameron Clearfield Elk Jefferson McKean Potter PA 2000 41.3 39.3 39.4 39.8 38.7 39.1 38.0 2005 43.6 41.5 42.6 41.5 40.4 41.0 39.3 2030 46.4 44.1 44.2 44.7 43.5 43.9 42.1 Source: U.S. Census, Interim Projections by Sex and Age, March 2004
Diversity
Diversity is an important consideration in any planning effort, specifically for economic development and transportation planning. Diversity of thought and ideas is critical for innovation, creativity, and entrepreneurship. The population of the North Central region is fairly homogeneous, where approximately 97.7 percent of the population is white. The minority populations are growing as a percentage of the total population; however, the region is still not reflective of the state or nation in terms of racial distribution and diversity.

REGIONAL ACTION STRATEGY
Page 9
Table 4: Population Growth by Race, 2000 - 2006 North Central White Black Hispanic
Counties 2006 2000 %Inc/Dec 2006 2000 % Inc/Dec
2006 2000 %Inc/Dec
Cameron 5,401 5,904 -8.52% 36 21 71.4% 43 34 26.5% Clearfield 80,075 81,218 -1.41% 1,570 1,239 26.7% 594 471 26.1% Elk 32,788 34,476 -4.90% 82 52 57.7% 172 142 21.1% Jefferson 45,137 45,457 -0.70% 102 59 72.9% 221 188 17.6% McKean 42,450 44,312 -4.20% 969 860 12.7% 539 485 11.1% Potter 17,167 17,729 -3.17% 136 52 161.5% 125 103 21.4% Region 225,024 231,096 -2.63% 4,901 4,283 14.4% 3,700 3,423 8.1% Pennsylvania 10.6M 10.4M 1.68% 1.3M 1.2M 9.1% 0.52M 0.39M 33.7% Source: PA State Data Center, Pennsylvania Abstract, 2007 According to economic development research, talent is attracted by diversity. Regions that are open to diversity are able to attract a wider range of talent by nationality, race, ethnicity, and sexual orientation than those areas that are relatively closed. Regions that are diverse gain distinct economic advantages in the competition for human talent, and in their capacity to generate and attract industries.
Population Density
In addition to total population and composition, another important demographic indicator for economic development (and particularly downtown revitalization) and transportation (particularly public transportation) includes population density. With a population density of fewer than 43 persons per square mile, the North Central region is perhaps Pennsylvania’s least densely populated region. The region has some of the state’s largest counties by land area. The North Central regions’ most densely populated county, Clearfield, is far below the state average of 274 persons per square mile. The comparative density calculation considers the total area of land divided into the population. This can be misleading in this region because of the amount of land that is unavailable for development of any kind, such as steep slopes, state and federal game lands and forests, and wetlands. When the total land area is separated into two groups - land available for development (usable), and unavailable (unusable) - it is possible to recalculate the “real” density by dividing the usable land by the population to obtain a more realistic density picture of the region. Based on this evaluation, the percentage of usable land accounts for 65.16% of the land area, while the balance of 34.84% of the land area is unusable. The revised or “real” density changes from 43 persons per square mile to approximately 68 persons per square “usable” mile. NCPRDC has a map visually detailing the location of the lands that are available for development with those that are not.
Table 5: Pennsylvania’s Least Densely Populated Counties
County Persons per Square Mile (2005)
1. Cameron 13.8 2. Sullivan 13.9 3. Forest 15.2 4. Potter 16.3 5. Fulton 33.8 6. Tioga 36.3 7. Elk 40.0 8. McKean 44.9 9. Warren 47.3 10. Bedford 49.2
Jefferson 69.8 Clearfield 71.9 Source: PA Abstract 2007, PA State Data Center

REGIONAL ACTION STRATEGY
Page 10
Land Use and Planning – Municipalities
Residents in the North Central are served by 163 governments including all six counties, and 157 local municipal government entities. (Counties are included in the total because of the requirement for comprehensive plans.) The ratio of local municipalities (non-county) per resident is one local government per every 1,450 persons as compared to the statewide average of one municipal government per 5,000 residents. This has significant implications for economic growth and the increased complexity and degree of cooperation necessary for transportation and other infrastructure planning and development. Table 6: Municipalities and Land Use Planning North Central Municipalities School
Districts Comprehensive
Plans Zoning
Ordinances Planning
Commissions Cameron 7 1 3 2 2 Clearfield 52 8 21 9 18 Elk 12 3 6 5 7 Jefferson 34 3 8 5 8 McKean 21 5 8 10 10 Potter 31 5 12 3 6 Total 1571 25 58 34 51 Source: Pennsylvania State Archives The number of residents served by local governments impacts the costs of government services. Further, industry site selectors and entrepreneurship research cite that fragmentation of local governments impacts economic development. Site selectors assess the number of local governments a firm will have to secure necessary approvals or permits, while entrepreneurial activity is most successful where there is the least friction or barriers to entry into the market.
Education Education proficiency and attainment in the North Central region is lower than the state and national averages. Educational proficiency and educational achievement are indicators of innovation and entrepreneurial capacity. Table 7: Educational Attainment Rates for Individuals Age 25+ North Central
Percent of Persons Less Than High School Bachelor’s
Degree Graduate Degree High School and More
Cameron 20.2 79.8 12.1 3.7 Clearfield 20.9 79.1 11.1 3.9 Elk 17.3 82.7 12.3 4.0 Jefferson 19.0 81.0 11.7 4.0 McKean 17.8 82.2 14.0 5.1 Potter 19.4 80.6 12.3 4.5 Pennsylvania 18.1 81.9 22.4 8.4
Source: US Bureau of the Census, 2000 Census of Population and Housing, SF3
1 Portions of Falls Creek Borough are in both Clearfield and Jefferson Counties
REGIONAL ACTION STRATEGY
Page 11
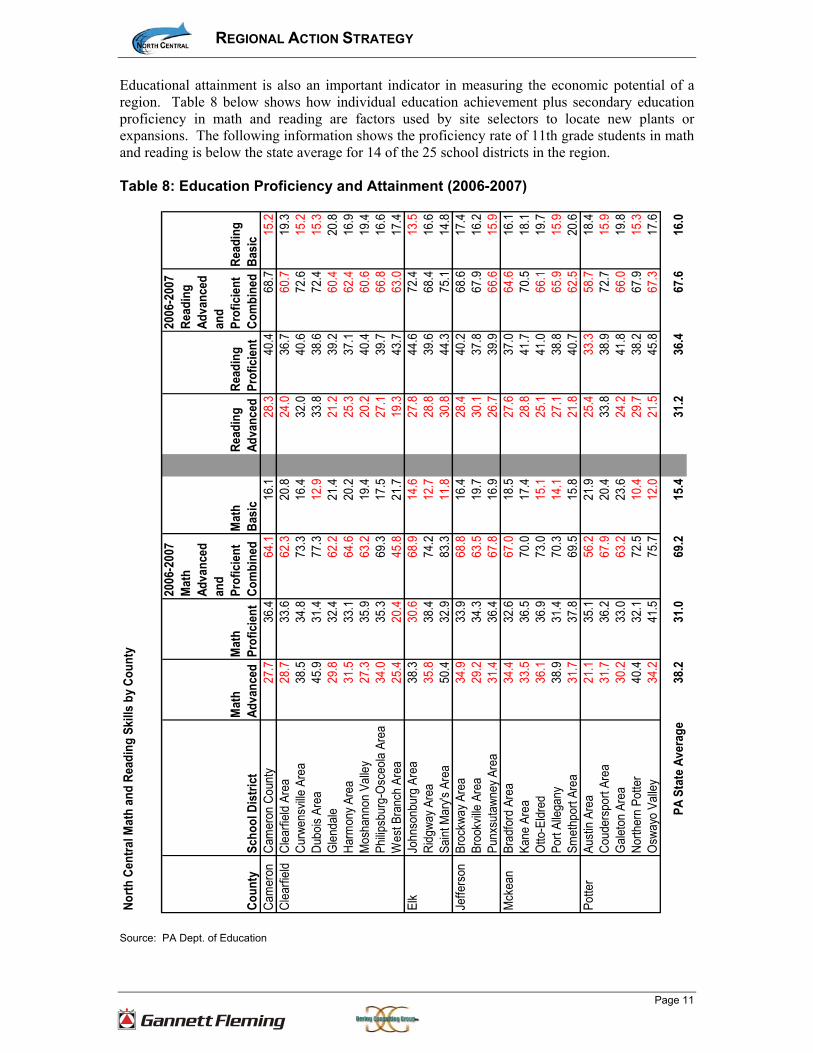
Educational attainment is also an important indicator in measuring the economic potential of a region. Table 8 below shows how individual education achievement plus secondary education proficiency in math and reading are factors used by site selectors to locate new plants or expansions. The following information shows the proficiency rate of 11th grade students in math and reading is below the state average for 14 of the 25 school districts in the region. Table 8: Education Proficiency and Attainment (2006-2007)
North
Cen
tral M
ath
and
Read
ing
Skill
s by
Cou
nty
Coun
tySc
hool
Dis
trict
Mat
h Ad
vanc
edM
ath
Prof
icie
nt
2006
-200
7 M
ath
Adva
nced
an
d Pr
ofic
ient
Co
mbi
ned
Mat
h Ba
sic
Read
ing
Adva
nced
Read
ing
Prof
icie
nt
2006
-200
7 Re
adin
g Ad
vanc
ed
and
Prof
icie
nt
Com
bine
dRe
adin
g Ba
sic
Cam
eron
Cam
eron
Cou
nty
27.7
36.4
64.1
16.1
28.3
40.4
68.7
15.2
Clea
rfiel
dCl
earfi
eld
Area
28.7
33.6
62.3
20.8
24.0
36.7
60.7
19.3
Curw
ensv
ille A
rea
38.5
34.8
73.3
16.4
32.0
40.6
72.6
15.2
Dubo
is Ar
ea45
.931
.477
.312
.933
.838
.672
.415
.3G
lend
ale
29.8
32.4
62.2
21.4
21.2
39.2
60.4
20.8
Harm
ony A
rea
31.5
33.1
64.6
20.2
25.3
37.1
62.4
16.9
Mos
hann
on V
alle
y27
.335
.963
.219
.420
.240
.460
.619
.4Ph
ilipsb
urg-
Osc
eola
Are
a34
.035
.369
.317
.527
.139
.766
.816
.6W
est B
ranc
h Ar
ea25
.420
.445
.821
.719
.343
.763
.017
.4El
kJo
hnso
nbur
g Ar
ea38
.330
.668
.914
.627
.844
.672
.413
.5Ri
dgwa
y Are
a35
.838
.474
.212
.728
.839
.668
.416
.6Sa
int M
ary's
Are
a50
.432
.983
.311
.830
.844
.375
.114
.8Je
ffers
onBr
ockw
ay A
rea
34.9
33.9
68.8
16.4
28.4
40.2
68.6
17.4
Broo
kville
Are
a29
.234
.363
.519
.730
.137
.867
.916
.2Pu
nxsu
tawn
ey A
rea
31.4
36.4
67.8
16.9
26.7
39.9
66.6
15.9
Mck
ean
Brad
ford
Are
a34
.432
.667
.018
.527
.637
.064
.616
.1Ka
ne A
rea
33.5
36.5
70.0
17.4
28.8
41.7
70.5
18.1
Otto
-Eld
red
36.1
36.9
73.0
15.1
25.1
41.0
66.1
19.7
Port
Alle
gany
38.9
31.4
70.3
14.1
27.1
38.8
65.9
15.9
Smet
hpor
t Are
a31
.737
.869
.515
.821
.840
.762
.520
.6Po
tter
Aust
in A
rea
21.1
35.1
56.2
21.9
25.4
33.3
58.7
18.4
Coud
ersp
ort A
rea
31.7
36.2
67.9
20.4
33.8
38.9
72.7
15.9
Gal
eton
Are
a30
.233
.063
.223
.624
.241
.866
.019
.8No
rther
n Po
tter
40.4
32.1
72.5
10.4
29.7
38.2
67.9
15.3
Osw
ayo
Valle
y34
.241
.575
.712
.021
.545
.867
.317
.6
PA S
tate
Ave
rage
38.2
31.0
69.2
15.4
31.2
36.4
67.6
16.0
Source: PA Dept. of Education

REGIONAL ACTION STRATEGY
Page 12
North Central GRP Growth % 1998 - 2006
-3.00%
-2.00%
-1.00%
0.00%
1.00%
2.00%
3.00%
4.00%
5.00%
1998 1999 2000 2001 2002 2003 2004 2005
NC RegionUSAPennsylvania
Economy
The economy of the North Central region, in terms of its Gross Regional Product (GRP), can be characterized as closely following the trends of the state and the nation, but lags behind both and reacts much more severely in a turndown. The overall economy, in terms of GRP percent growth, reacts well to economic upturns but experiences only moderate growth during cycles of prosperity. Figure 3: Gross Regional Product (GRP) % Growth 1998 – 2006 North Central
Source: Woods & Poole, 2007 A few large employers continue to significantly influence the overall employment and economic environment of the region. Historically, unemployment rates have been above the national and state averages, but recently, unemployment rates closely follow the state and national averages while total employment in the region has been somewhat stagnant over the past five years and declining in some areas.
Employment and Unemployment
Historically, unemployment rates in the region’s six counties have run higher than many other Pennsylvania counties. However, over the past several years, the non-seasonally adjusted unemployment rate was fairly consistent with the state and national averages and in some cases, lower. For July 2007, the seasonally adjusted and non-seasonally adjusted unemployment rate of 4.6 percent is just slightly above the state non-seasonally adjusted rate of 4.5 percent and above the adjusted rate of 4.1 percent; it is below the national non-seasonally adjusted rate of 4.9 percent and equal to the adjusted rate of 4.6 percent (July 2007).

REGIONAL ACTION STRATEGY
Page 13
North Central Average Annual Unemployment Rates 2002-2007
0.00
1.00
2.00
3.00
4.00
5.00
6.00
7.00
8.00
9.00
Cameron Clearfield Elk Jefferson McKean Potter Pennsylvania United States
Rat
e (%
)
200220032004200520062007
Source: Department of Labor, Bureau of Labor Statistics
Figure 4: Unemployment Rates, 2002-2007 North Central
Home ownership and home values are often indicators of economic prosperity and quality of life. In the North Central region, median home values are less than the state and nation as a whole; however, home ownership rates are significantly greater. This fact corroborates previous data that residents of the North Central region and surrounding areas enjoy jobs at fair wages that allow them a reasonable quality of life. Table 9: Ownership Percentage of Owner-Occupied Homes And Median Value (2000) - North Central Home
Ownership Percentage
Median Home Value ($)
Cameron 57.24% $61,300Clearfield 60.06% $62,600Elk 65.94% $78,000Jefferson 56.71% $59,100McKean 57.21% $53,500Potter 45.90% $68,700Region 58.20% $63,225Pennsylvania 60.49% $97,000 Source: US Census

REGIONAL ACTION STRATEGY
Page 14
Economic Development
The North Central region has several economic development providers including: the North Central Pennsylvania Regional Planning and Development Commission, Ben Franklin of Northeastern Pennsylvania, Ben Franklin of Central and Northern Pennsylvania, the Industrial Modernization Center, and county economic development offices. These entities manage a number of state and local economic development financing and assistance programs throughout the region. The region has designated 25 Keystone Opportunity Zones providing tax free sites for business development. Also, the region has a Keystone Innovation Zone, the Tri-County KIZ, encompassing PSU DuBois, DuBois Business College, and Jeff Tech, supporting the following industries: Advanced Material Manufacturing, Energy/Biomass, and Information Technology. Water, sewer, and electric utilities are available throughout the region. However, broadband access is limited in many areas. The region’s rural and scenic identity is widely recognized as an economic asset within the region. There is a small fragmented but widespread travel and tourism industry. The opportunity to capitalize on the image by promoting a scenic and outdoors-oriented place to attract visitors and potentially more business demands more scrutiny.
Industry Concentration
Previous analyses of the North Central region and in Pennsylvania generally have documented the decline in the number of manufacturing jobs and the rise in the businesses services sector. In viewing the North Central region as a whole, the top five industries with the greatest number of employees are: retail trade, sawmills, powdered metals manufacturing, miscellaneous manufacturing, and health care. However, those with the greatest earnings per worker include: energy, custom communications, metals and metal fabricating, and logistics and transportation. Industries with the greatest competitive advantage included: machine shops, metals and metal fabricating, energy, logistics and transportation, health care, and business services. Figure 5: Largest Industries – # Jobs Relative to Earnings -North Central
Source: PA Dept of Labor & Industry, Workforce Information & Analysis & EMSI, Inc.

REGIONAL ACTION STRATEGY
Page 15
The North Central Pennsylvania Regional Planning and Development Commission has targeted three key industry clusters for focusing on workforce development: Advanced and Diversified Manufacturing, Health Care, and Information Technology. Location quotient is a method for gauging the relative specialization of a region in selected industries. It is simply a ratio of industry concentration in an area compared to the industry concentration nationally. In understanding the location quotient, a value of 1 or close to 1 indicates the region produces enough of that good or service to satisfy local demand; less than 1 indicates the region does not produce enough locally and must import; greater than 1, then the industry is an export industry and the region likely has some competitive advantage in that industry cluster. Similarly, a positive change in location quotient indicates the region is growing its competitive advantage, increasing market share or exports, and growing value added employment and jobs. Industry clusters can be characterized as: “cash cows,” a significant but not growing or dynamic component of the local economy; “emerging industries” not yet having significant employment but growing; or “winners” having significant employment and growing and increasing competitive advantage. A cash cow has a location quotient above 1, but a negative change in location quotient. Emerging clusters have a location quotient less than 1, but increasing. Finally, winners have a location quotient above 1 and a positive change over several years. Industry clusters which emerge as winners in the North Central region are: metals and metal fabricating, retail, and perhaps logistics and transportation. Emerging clusters could include chemicals and oil & gas. Opportunities lie where regional assets support winners and emerging clusters allowing existing firms in the cluster to grow as well as spinning off entrepreneurial endeavors. This allows the regional clusters to continue to grow creating more jobs, higher wage jobs, and wealth for the region.
Figure 6: Location Quotient – North Central Industry Clusters
Source: PA Dept of Labor & Industry, Workforce Information & Analysis & EMSI, Inc
Emerging

REGIONAL ACTION STRATEGY
Page 16
Figure 7: Location Quotient (Closer-in View of Figure 6 Above)
Source: PA Dept of Labor & Industry, Workforce Information & Analysis & EMSI, Inc
The Pennsylvania Department of Labor and Industry’s Center for Workforce Information and Analysis projects total employment in the North Central region to grow by approximately 2.6 percent between 2004 and 2014. Table 10: Per Capita Personal Income, 2000-2005 North Central PCPI 2000 PCPI 2005 % Change North Central $23,499 $26,967 15% Pennsylvania $29,693 $34,937 18% USA $29,843 $34,471 16% Source: U.S. Census Bureau (2000) & Woods & Poole, Inc. 2007 The North Central region median income is significantly below state and national averages. In addition, the percent increase in per capita income for the six county regions is well below the state average. Further, it can be inferred that the jobs in the North Central region and the North Central labor shed pay wages or salaries that are below average, perhaps indicating that either the high-wage, high-value jobs are being created elsewhere; or the wages in the region are lower than the rest of the state for the same jobs.
Employers
Top employers in the region reflect the socio-economic characteristics of the population. Increasingly, employers are either in the public sector – federal, state, and municipal – or retail and healthcare, and tend to provide lower wage jobs.
REGIONAL ACTION STRATEGY
Page 17
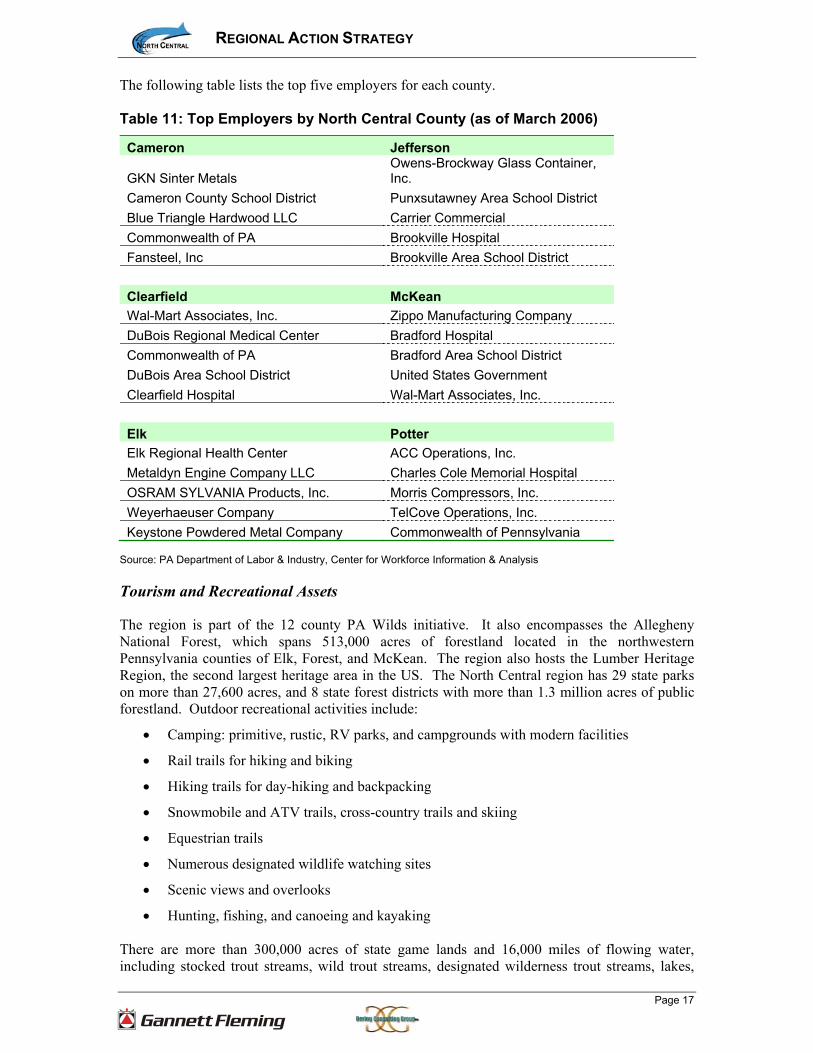
The following table lists the top five employers for each county. Table 11: Top Employers by North Central County (as of March 2006)
Cameron Jefferson
GKN Sinter Metals Owens-Brockway Glass Container, Inc.
Cameron County School District Punxsutawney Area School District Blue Triangle Hardwood LLC Carrier Commercial Commonwealth of PA Brookville Hospital Fansteel, Inc Brookville Area School District Clearfield McKean Wal-Mart Associates, Inc. Zippo Manufacturing Company DuBois Regional Medical Center Bradford Hospital Commonwealth of PA Bradford Area School District DuBois Area School District United States Government Clearfield Hospital Wal-Mart Associates, Inc. Elk Potter Elk Regional Health Center ACC Operations, Inc. Metaldyn Engine Company LLC Charles Cole Memorial Hospital OSRAM SYLVANIA Products, Inc. Morris Compressors, Inc. Weyerhaeuser Company TelCove Operations, Inc. Keystone Powdered Metal Company Commonwealth of Pennsylvania
Source: PA Department of Labor & Industry, Center for Workforce Information & Analysis
Tourism and Recreational Assets
The region is part of the 12 county PA Wilds initiative. It also encompasses the Allegheny National Forest, which spans 513,000 acres of forestland located in the northwestern Pennsylvania counties of Elk, Forest, and McKean. The region also hosts the Lumber Heritage Region, the second largest heritage area in the US. The North Central region has 29 state parks on more than 27,600 acres, and 8 state forest districts with more than 1.3 million acres of public forestland. Outdoor recreational activities include:
• Camping: primitive, rustic, RV parks, and campgrounds with modern facilities
• Rail trails for hiking and biking
• Hiking trails for day-hiking and backpacking
• Snowmobile and ATV trails, cross-country trails and skiing
• Equestrian trails
• Numerous designated wildlife watching sites
• Scenic views and overlooks
• Hunting, fishing, and canoeing and kayaking There are more than 300,000 acres of state game lands and 16,000 miles of flowing water, including stocked trout streams, wild trout streams, designated wilderness trout streams, lakes,
REGIONAL ACTION STRATEGY
Page 18
and reservoirs. More than 150,000 acres include 8 wild areas and 27 natural areas, so named because of their significant scenic, historic, geologic, and ecological value. A review of PA tourism websites and brochures does not identify the 6 counties of North Central as a distinct location or destination. The North Central region appears to lack a distinct identity offering its own distinctive attractions, and more definitive destinations to draw potential tourists. Nearby competing choices are “Northeastern Mountains” (Poconos) or “PA Wilds” (12 county region). The destinations appear to compete for visitors on their own specific characteristics, which appear to be very similar to those of the North Central region counties. The significant amount of public land in the region significantly impacts land use planning and development, especially in the areas of the region where municipalities are either surrounded, or in very close proximity to public lands.

REGIONAL ACTION STRATEGY
Page 19
Strategic Goals, Objectives, and Projects
The RAS is concerned with targeted investments of regional significance encompassing the need to coordinate among counties, stakeholders, or programs to achieve regional benefit regardless of the location within the region. The fundamental approach that forms the basis for implementing the plan should begin with three basic questions: What are the projects desired (by the stakeholders), where should they be located, and why should they be completed? Two regional workshops were held during which priority initiatives were identified, followed by investment criteria, and suggested implementation approaches. Facilitators tasked each of four table groups with selecting, describing, and prioritizing three strategic initiatives of regional significance. The following list demonstrates the breadth of priority areas for investment and, in turn, demonstrates the requirement to distinguish actionable projects from strategic thrusts.
Priority #1 Initiatives Priority #2 Initiatives Priority #3 Initiatives
Core Infrastructure & Economic Centers
Infrastructure & Technology
Regional Economic Intelligence Agency (Energy)
Regional Fiber Telecommunications Network
Attraction and Creation Program for Entrepreneurs
Further Recreational Activities Within the Region
Educate the Current and Future Workforce
Educational System Collaborative Venture
Develop & Market Tourism Assets and Services
Assist Existing Businesses Retain and Expand Existing Businesses
Education & Training
Each priority suggests a focused, targeted effort. Educational initiatives recommended vigor in targeted needs and programs. Traditional development initiatives recommended analysis of existing structures and creating backbones of areas to develop. Education and infrastructure are consistent in the top three priorities of regional significance. Education is not limited to public secondary education. The focus in each group was to match employer needs with educational programs and outcomes. Likewise, infrastructure is not limited to roads, water, and sewer. In each case, the focus was on a targeted approach to solving geographical challenges and meeting current and future needs. In terms of projects to build the business base, all were focused on working with existing businesses. Incumbent business support was considered at least as important as or more important than recruiting new businesses to come to the area. It also provides an opportunity to encourage small business start-up and entrepreneurial activity.

REGIONAL ACTION STRATEGY
Page 20
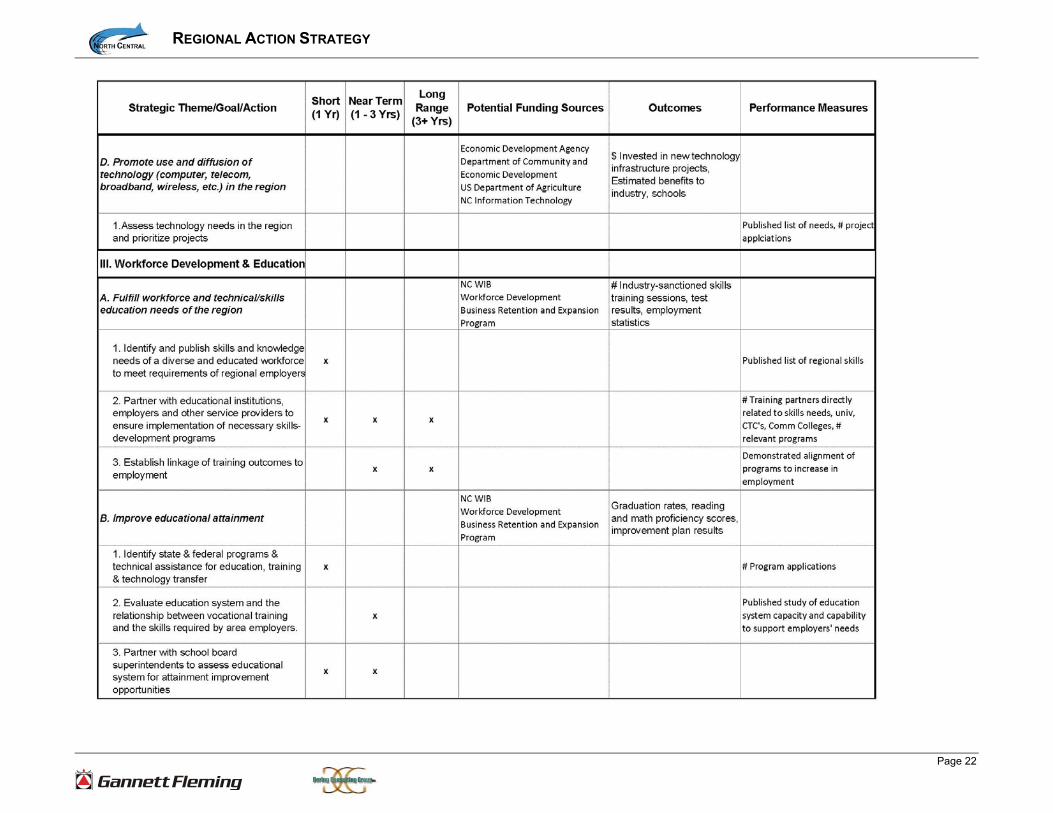
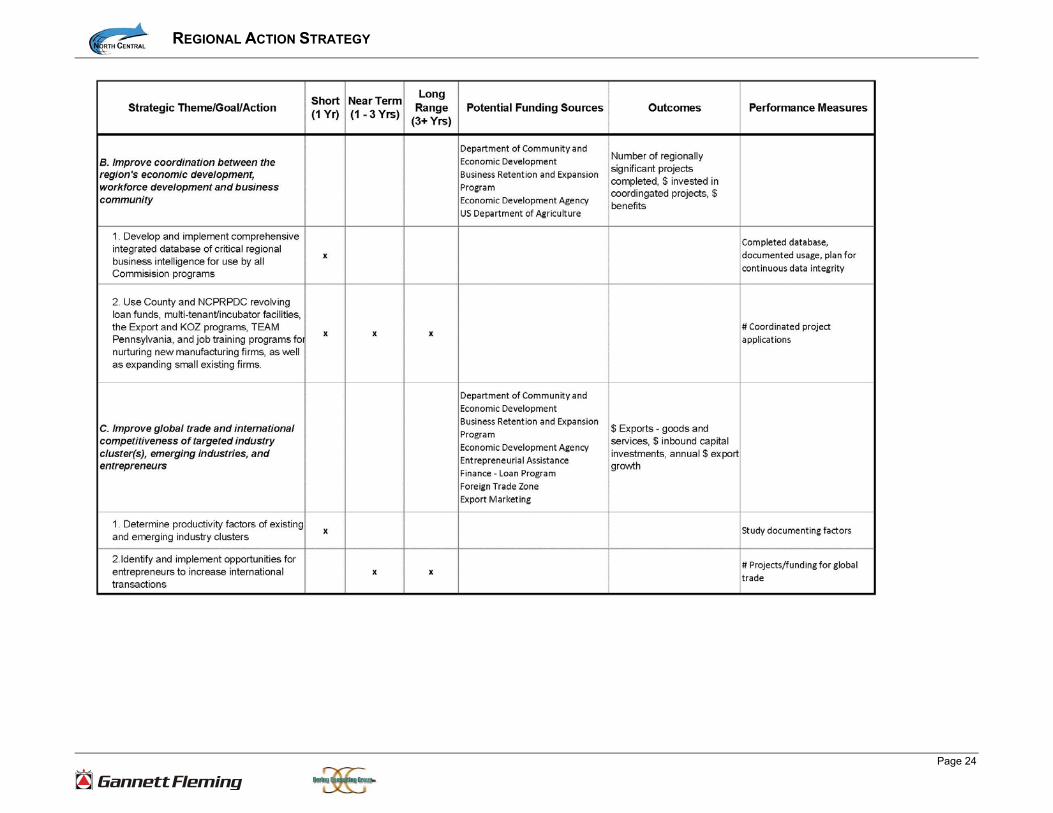
Regional Strategies, Objectives, and Projects

REGIONAL ACTION STRATEGY
Page 21
REGIONAL ACTION STRATEGY
Page 22

REGIONAL ACTION STRATEGY
Page 23
REGIONAL ACTION STRATEGY
Page 24

REGIONAL ACTION STRATEGY
Page 25

REGIONAL ACTION STRATEGY
Page 26

REGIONAL ACTION STRATEGY
Page 27

REGIONAL ACTION STRATEGY
Page 28

REGIONAL ACTION STRATEGY
Page 29
Implementing the Plan
The North Central Pennsylvania Regional Planning and Development Commission has, along with the Regional Action Strategy, developed a process described below to solicit, review, recommend, and measure Projects of Regional Significance. This process aligns with the Commonwealth of Pennsylvania’s integrated approach to funding projects that support goals in Land Use, Transportation, and Economic Development (LUTED). The RAS will be used as guidance, and a filter, for coordinating the process for integrating the different areas for planning. The plan is not a list of all possible projects in the region. Each program may have short-term maintenance or mandated efforts that are more tactical or operational in maintaining services to the residents of the region. Feedback from key stakeholders listed the following characteristics of the implementation approach in order to ensure successful implementation:
1. Keep the process simple
2. Provide education, continuous awareness, and ongoing guidance
3. Obtain commitment from private enterprise
4. Maintain consistency in the evaluation approach
5. Obtain continuous local involvement and “buy-in”
6. Assign ownership of projects and mandate follow-through
7. Get the process moving first, then refine and adapt
8. Make sure the projects and initiatives are future-oriented
9. Develop and foster relationships throughout the region Taking these suggestions into account, the following three primary activities are recommended to move the RAS forward:
1. Education, Outreach and Coordination • Develop 12 Month Work Program—develop an overall year one start up approach and
associated technical assistance • Develop outreach strategy and approach • Continue ongoing facilitation of process • Develop public communications, information, and materials • Customize materials according to sector audience—e.g., local government, industry
clusters, etc. • Develop interactive web site

REGIONAL ACTION STRATEGY
Page 30
2. Identify Targeted Investment Areas • Compile inventory of potential areas by county • List economic assets within region • Develop comprehensive database of core community assets
3. Project Cultivation -
• Support and facilitate overall process and approach for identification of first round of regional LUTED projects anticipating state looking for candidate projects
• Develop project proposals and supporting rationale for state funding • Assist and facilitate Project Review Committee process and early start up • Fine tuning of the project screening criteria • Adapting the project screening criteria to specific programs (as we will be doing with
transportation) In order to accomplish these, we must:
Agree on key regional performance measures Develop LUTED progress reporting Initiate special pilot projects—e.g. a LUTED based planning and zoning pilot in a
willing municipality or multiple municipalities Assist with organizational goal setting, performance review systems and other
management consulting activities to align with the accountability for the LUTED system.
Assist NCPRPDC with its participation and leadership role/opportunity in statewide LDD association in this upcoming critically important year.
Provide extensive training and workshops—help transition various organizations and stakeholders.
LUTED Process Overview
A summary of the process is as follows:
• Projects will be submitted to the Project Review Committee.
• An initial screening determines if it is a LUTED project (i.e. Project of Regional Significance).
o LUTED projects are rated and prioritized via weighted scoring.
o Non-LUTED projects are evaluated and funded through existing channels.
• LUTED projects are presented to the Commonwealth of Pennsylvania with LUTED-Regionally Significant status.
• After project completion, all projects are evaluated and documented in terms of reaching the goals and objectives of the Strategic Plan, LRTP, CEDS, and County Plans. A draft process flowchart is in Appendix 1.

REGIONAL ACTION STRATEGY
Page 31
There are three phases in developing a sustainable LUTED project review process:
1. Create and Task the Project Review Committee
2. Perform Initial LUTED Project Selection
3. Refine, Promote, and Sustain the LUTED Project Selection process
The following sections describe how the three phases of sustainable LUTED processes will be implemented.
1. Create the LUTED Project Review Committee
The Project Review Committee (PRC) will be accountable for the solicitation, review, recommendation, and outcome measurement of LUTED projects of regional significance. NCRPDC will select members for the committee. Consideration should be given to a PRC that includes staff managers and a subset of the NCPRDC board and regional stakeholders. LUTED PRC will:
1. Refine the submission plan, weighted scoring, and outcome measurement procedures for projects.
2. Solicit projects from stakeholders in North Central Pennsylvania. Each existing NC program will fall under this approach, but will preserve its uniqueness.
3. Evaluate, prioritize, and recommend projects based on published criteria and a selection process that includes both qualitative and quantitative analysis.
4. Establish and implement a communication plan to update stakeholders and the general public, share success stories, and promote the regional benefits of the LUTED approach.
5. Educate stakeholders on the background, benefits, and procedures of the LUTED project selection process.
6. Update the regional action plan at regular intervals and/or when external conditions require it.
7. Measure the outcomes of recommended LUTED projects based on the selection criteria and performance measures included in the selection process.
8. Systematically communicate outcomes at all levels: board, program stakeholders and clients, funding agencies and the public.

REGIONAL ACTION STRATEGY
Page 32
2. Perform Initial LUTED Process Selection
The initial LUTED project selection process will include additional steps that relate to implementing a process for the first time and refining the process through experience.
Step 1: NCPRPDC selects Project Review Committee members and create agendas for meetings in the initial planning phase.
Step 2: Review and ensure that all committee members understand the background, benefits, and procedures involved in selecting LUTED projects of regional significance.
Step 3: Refine initial processes as needed.
• Project solicitation procedure (spanning existing programs)
• Project acceptance procedure (spanning existing programs)
• Timelines for review
• Timelines for submission to Commonwealth for consideration
• Communication plan for selected program and project stakeholders
• Frequency of solicitation and review
• Triggers for solicitation and review
• Outcome measurement and communication plans
• Plan and Committee update procedures
Step 4: Publish basic guidelines and procedures for how the PRC will review projects including instructions, types of meetings, and estimated time commitments, and its interface with NC board and committees (CEDS, RPO).
Step 5: Create a communications plan to:
• Educate stakeholders on the benefits and reasons to use the LUTED process.
• Provide an overview of the project submission worksheets and their importance and relevance to optimizing investments.
• Solicit an initial set of projects using the LUTED project submission worksheets.
• Raise awareness among the general public about how inter-municipal cooperation and regional planning benefits them.
• Ensure transparency in the process and reinforce public and stakeholder confidence in the process.

REGIONAL ACTION STRATEGY
Page 33
Step 6: Review an initial set of projects to select and to validate the processes and procedures in place. Projects will be submitted using the Submission Worksheet.
1st Pass
• The PRC determines if the project is eligible for LUTED consideration.
• If not, the PRC does not consider the project. The project is sent through existing channels for funding.
2nd Pass
• For projects that the PRC will evaluate to be LUTED, the PRC will use the weighted scoring form to “grade” the project.
• Grading is based on the information provided on the submission worksheet.
• This is the quantitative analysis element of the process.
3rd Pass
• The PRC will review the project and scoring at a meeting. This is the qualitative analysis element.
• Recommendation/No recommendation to the board as a project of regional significance and to the Commonwealth as necessary.
Step 7: Refine and update procedures as necessary.
Step 8: Review, refine, and publish standards for performance and outcome measurement, including:
• Critical metrics and measures
• Triggers for reporting
• Report formats, frequency, and submission
• Data collection and analysis guidelines
Step 9: Publish ongoing process including:
• Project solicitation and acceptance guidelines
• Timelines and expectations for review and consideration
• Communication paths
• Appeals and exceptions
Step 10: As initial projects close, complete outcome and performance measurement tasks. Update procedures and documentation as needed.
REGIONAL ACTION STRATEGY
Page 34
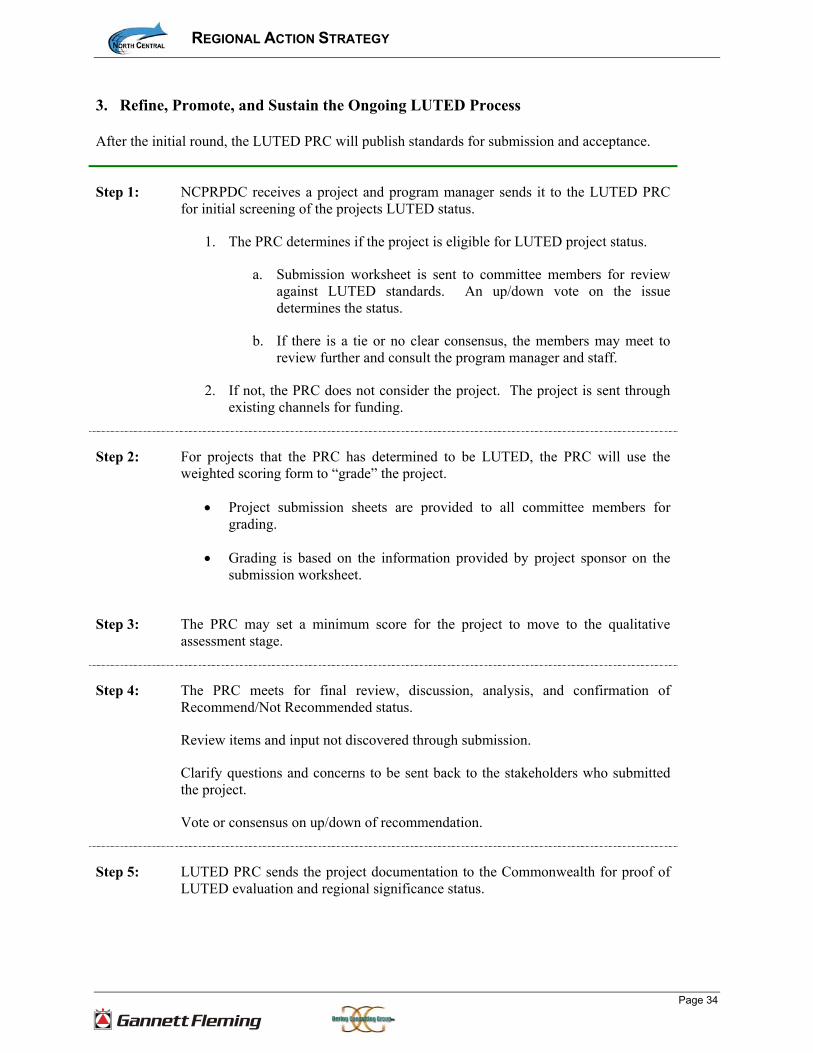
3. Refine, Promote, and Sustain the Ongoing LUTED Process
After the initial round, the LUTED PRC will publish standards for submission and acceptance.
Step 1: NCPRPDC receives a project and program manager sends it to the LUTED PRC for initial screening of the projects LUTED status.
1. The PRC determines if the project is eligible for LUTED project status.
a. Submission worksheet is sent to committee members for review against LUTED standards. An up/down vote on the issue determines the status.
b. If there is a tie or no clear consensus, the members may meet to review further and consult the program manager and staff.
2. If not, the PRC does not consider the project. The project is sent through existing channels for funding.
Step 2: For projects that the PRC has determined to be LUTED, the PRC will use the weighted scoring form to “grade” the project.
• Project submission sheets are provided to all committee members for grading.
• Grading is based on the information provided by project sponsor on the submission worksheet.
Step 3: The PRC may set a minimum score for the project to move to the qualitative assessment stage.
Step 4: The PRC meets for final review, discussion, analysis, and confirmation of Recommend/Not Recommended status.
Review items and input not discovered through submission.
Clarify questions and concerns to be sent back to the stakeholders who submitted the project.
Vote or consensus on up/down of recommendation.
Step 5: LUTED PRC sends the project documentation to the Commonwealth for proof of LUTED evaluation and regional significance status.
REGIONAL ACTION STRATEGY
Page 35
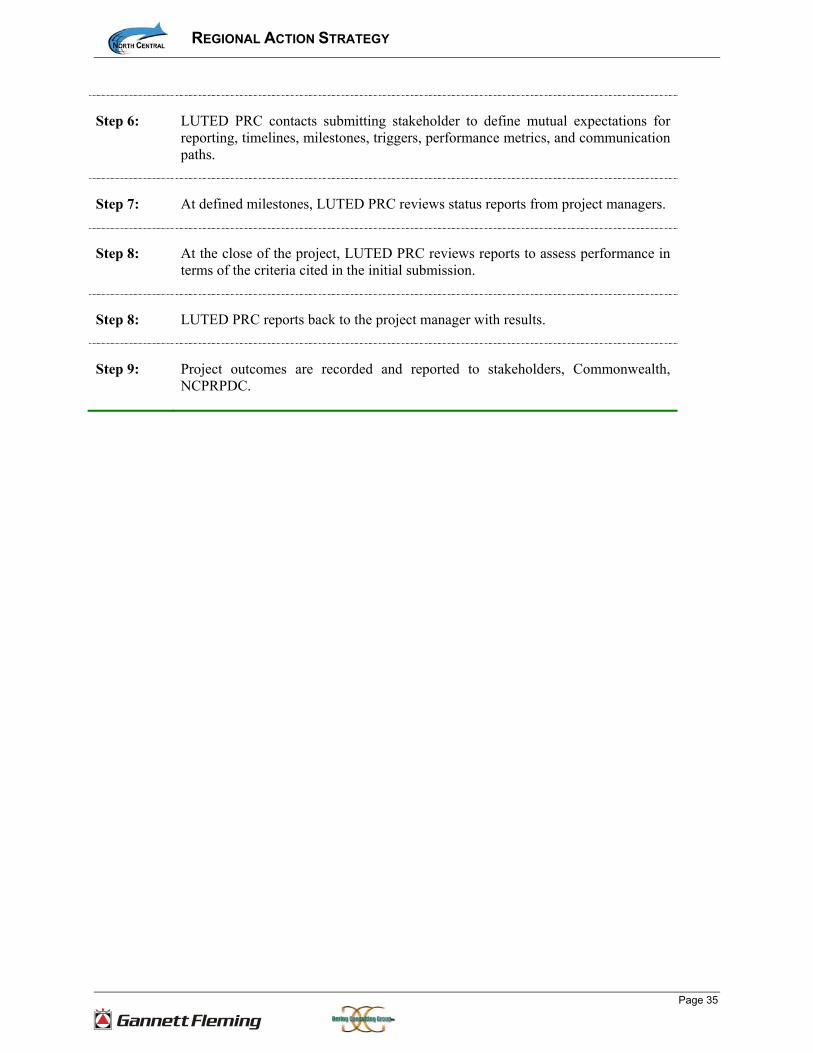
Step 6: LUTED PRC contacts submitting stakeholder to define mutual expectations for reporting, timelines, milestones, triggers, performance metrics, and communication paths.
Step 7: At defined milestones, LUTED PRC reviews status reports from project managers.
Step 8: At the close of the project, LUTED PRC reviews reports to assess performance in terms of the criteria cited in the initial submission.
Step 8: LUTED PRC reports back to the project manager with results.
Step 9: Project outcomes are recorded and reported to stakeholders, Commonwealth, NCPRPDC.

REGIONAL ACTION STRATEGY
Page 36
Ongoing Process Flowchart
Policy, Program,Project Guidance
Project SponsorSubmit
Application
ProjectApplicationReview‐RASInvestment
Criteria
Prioritize Projects‐ PRS status
Candidate forProgram Funding
without PRSstatus
ProjectImplementationand Evaluation
Funded ProjectsFunded Projects
Strategic Plan priorities & GoalsRAS Investment CriteriaProgram Specific
New Application materialsCommon RAS ItemsProgram Specifications
Regionally Significant ?YES
Special Programming CategoryBoardState Funding Agencies
Regionally Significant?NO
Evaluate with OtherProgram‐Specific Criteria
Performance MeasuresProject Outcome TrackingReturn on Investment
Based on Regional FilteringCriteriaDemonstrated Plan Integration
Ongoing Regional Action Strategy Process (DRAFT)

REGIONAL ACTION STRATEGY
Page 37
Appendix 1 - Investment Criteria and Measures
Project investment criteria will be used to evaluate and select projects of regional significance. The criteria reflect the goals, values, and direction of the stakeholders. The investment criteria in this plan were derived from multiple sources and prioritized at a regional stakeholder workshop. Investment Criteria are the inputs to creating a “Weighted Scoring” model to evaluate projects. As part of the initial review, “Minimum Eligibility” criteria will be used to determine whether or not the project will be considered as a regionally significant project. The minimum criteria identified by stakeholders to be used in rating, scoring, and prioritizing project include:
Project promotes or strengthens targeted industry clusters
Project creates or retains high-skilled jobs
Project location is consistent with regional development strategies
Project is consistent with local land use regulations
Project improves workforce training, development, and education
Project will attract private investment
Project will maximize return on taxpayer investment
Project promotes the use and diffusion of technology
Project establishes a destination and attracts visitors to the region
Project increases international transactions and supports global competitiveness

REGIONAL ACTION STRATEGY
Page 38
Appendix 2 – Project Worksheet

REGIONAL ACTION STRATEGY
Page 39

REGIONAL ACTION STRATEGY
Page 40

REGIONAL ACTION STRATEGY
Page 41

REGIONAL ACTION STRATEGY
Page 42
REGIONAL ACTION STRATEGY
Page 43
REGIONAL ACTION STRATEGY
Page 44

REGIONAL ACTION STRATEGY
Page 45
Appendix 3 - Scoring Matrix

REGIONAL ACTION STRATEGY
Page 46

REGIONAL ACTION STRATEGY
Page 47
REGIONAL ACTION STRATEGY
Page 48
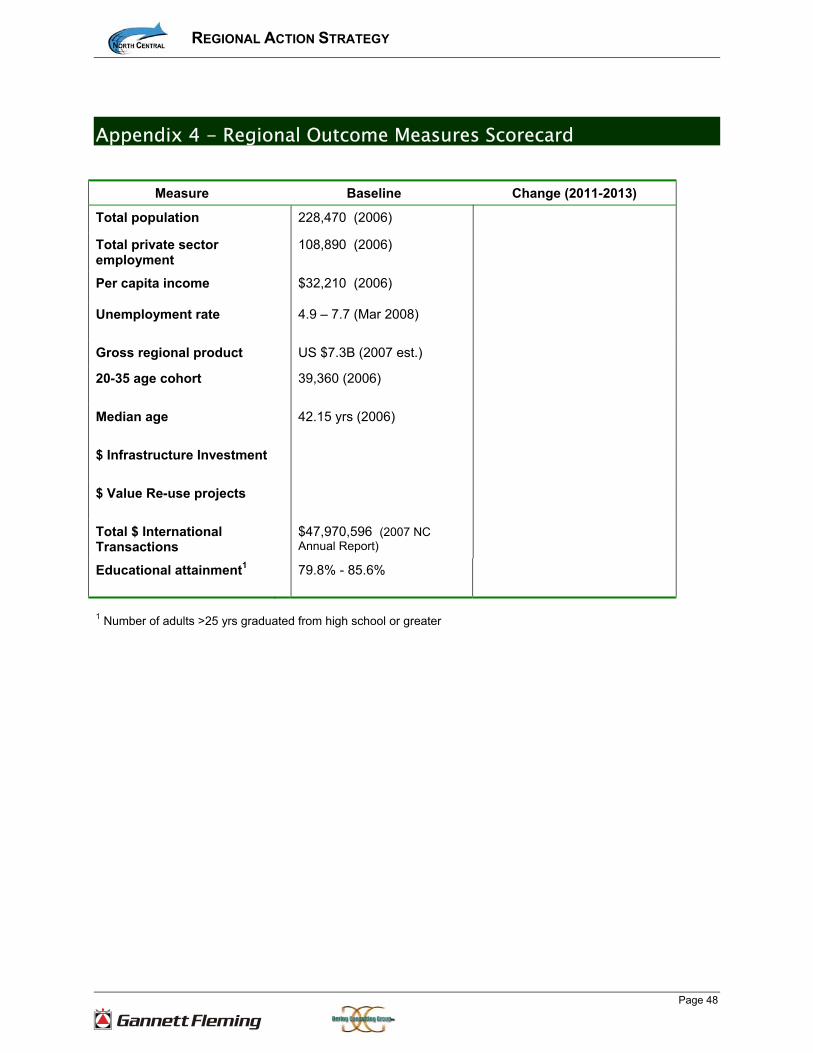
Appendix 4 - Regional Outcome Measures Scorecard
Measure Baseline Change (2011-2013)
Total population 228,470 (2006)
Total private sector employment
108,890 (2006)
Per capita income $32,210 (2006)
Unemployment rate 4.9 – 7.7 (Mar 2008)
Gross regional product US $7.3B (2007 est.)
20-35 age cohort 39,360 (2006)
Median age 42.15 yrs (2006)
$ Infrastructure Investment
$ Value Re-use projects
Total $ International Transactions
$47,970,596 (2007 NC Annual Report)
Educational attainment1 79.8% - 85.6%
1 Number of adults >25 yrs graduated from high school or greater

REGIONAL ACTION STRATEGY
Page 49
Appendix 5 – NCPRPDC Strategic Plan
Mission: North Central will exceed the expectations of our customers and stakeholders by committing to organizational excellence, helping to build vibrant communities, aiding in the preparation of a first-class workforce, stimulating economic vitality through collaboration, and partnering to build the infrastructure and technology necessary for regional growth.
Vision: North Central will be recognized and respected as a premier regional development organization by providing first class services to our customers.
Priority 1: Community Development
Goal 1.1: Promote economic initiatives that benefit the region
Goal 1.2: Partner with the region’s municipalities and other organizations
Goal 1.3: Support local and regional planning & development
Goal 1.4: Promote quality of life initiatives while safeguarding the region’s assets Priority 2: Infrastructure & Technology
Goal 2.1: Assess regional infrastructure needs including communication, transportation, water & sewer, energy, healthcare, education & site remediation
Goal 2.2: Educate stakeholders on the status of the region’s infrastructure and develop partnerships for technology investment that support regional growth
Goal 2.3: Collaborate & build the infrastructure & technology for regional growth
Goal 2.4: Leverage economic development and other programs to advance emerging energy-related industry opportunities
Priority 3: Workforce Development & Education
Goal 3.1: Determine workforce and education needs of the region
Goal 3.2: Partner with educational institutions, employers and other service providers to ensure that the region’s workforce is sufficiently skilled
Goal 3.3: Develop the workforce to meet the demands of the region’s employers
Goal 3.4: Maximize state & federal programs & technical assistance for education, training & technology transfer
Priority 4: Job & Business Retention & Creation
Goal 4.1: Promote the economic development and diversification of the region
Goal 4.2: Improve coordination between the region's economic development, workforce development and business community
Goal 4.3: Leverage the Commission’s economic development programs to advance regional growth
REGIONAL ACTION STRATEGY
Page 50
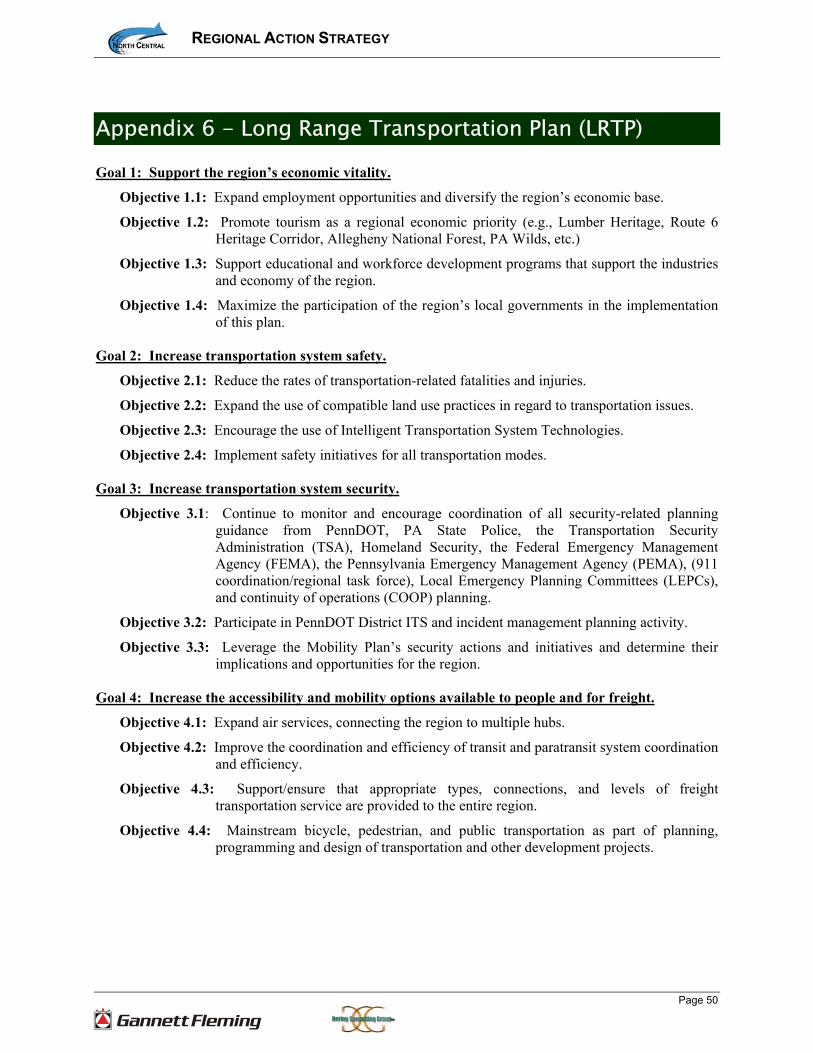
Appendix 6 - Long Range Transportation Plan (LRTP)
Goal 1: Support the region’s economic vitality.
Objective 1.1: Expand employment opportunities and diversify the region’s economic base.
Objective 1.2: Promote tourism as a regional economic priority (e.g., Lumber Heritage, Route 6 Heritage Corridor, Allegheny National Forest, PA Wilds, etc.)
Objective 1.3: Support educational and workforce development programs that support the industries and economy of the region.
Objective 1.4: Maximize the participation of the region’s local governments in the implementation of this plan.
Goal 2: Increase transportation system safety.
Objective 2.1: Reduce the rates of transportation-related fatalities and injuries.
Objective 2.2: Expand the use of compatible land use practices in regard to transportation issues.
Objective 2.3: Encourage the use of Intelligent Transportation System Technologies.
Objective 2.4: Implement safety initiatives for all transportation modes. Goal 3: Increase transportation system security.
Objective 3.1: Continue to monitor and encourage coordination of all security-related planning guidance from PennDOT, PA State Police, the Transportation Security Administration (TSA), Homeland Security, the Federal Emergency Management Agency (FEMA), the Pennsylvania Emergency Management Agency (PEMA), (911 coordination/regional task force), Local Emergency Planning Committees (LEPCs), and continuity of operations (COOP) planning.
Objective 3.2: Participate in PennDOT District ITS and incident management planning activity.
Objective 3.3: Leverage the Mobility Plan’s security actions and initiatives and determine their implications and opportunities for the region.
Goal 4: Increase the accessibility and mobility options available to people and for freight.
Objective 4.1: Expand air services, connecting the region to multiple hubs.
Objective 4.2: Improve the coordination and efficiency of transit and paratransit system coordination and efficiency.
Objective 4.3: Support/ensure that appropriate types, connections, and levels of freight transportation service are provided to the entire region.
Objective 4.4: Mainstream bicycle, pedestrian, and public transportation as part of planning, programming and design of transportation and other development projects.

REGIONAL ACTION STRATEGY
Page 51
Goal 5: Protect and enhance the environment, promote energy conservation, and improve quality of life.
Objective 5.1: Promote the use of alternative modes of transportation.
Objective 5.2: Promote inter-municipal and regional cooperation.
Objective 5.3: Involve public officials to better integrate land use and transportation with economic development.
Objective 5.4: Identify priority areas for development and redevelopment.
Objective 5.5: Incorporate context-sensitive design into highway, trail, and public transportation improvements to improve or maintain surrounding aesthetic value.
Objective 5.6: Protect the region’s scenic vistas through the designation of scenic byways, and the development of scenic overlooks as part of project design and construction.
Goal 6: Enhance the regional transportation system’s integration and connectivity.
Objective 6.1: Define and develop a regional core transportation system that connects local and regional facilities with the state’s system and coordinates with other community initiatives and priorities.
Objective 6.2: Strengthen the intermodal links between bicycle and pedestrian facilities, public transportation, and motorized recreation.
Objective 6.3: Expand bulk commercial freight transfer capabilities for rail-truck movements to serve area shippers/receivers and to attract intermodal transfer facility development for the region.
Objective 6.4: Develop and maintain trailway and waterway systems through a cooperative approach at all levels of government.
Goal 7: Promote efficient transportation system management and operation.
Objective 7.1: Share digital maps and demographic data with municipalities, transportation modes, and other organizations, advancing this plan’s goals and objectives.
Objective 7.2: Expand the use of technology for improved traffic management, congestion reduction, and safety enhancement.
Objective 7.3: Increase the use of land use practices that protect transportation system capacity.
Objective 7.4: Continue to improve the analytical methods and supporting data necessary for a strengthened regional planning and programming process.
Goal 8: Give priority to transportation system preservation.
Objective 8.1: Improve deficiencies in the region’s transportation system.
REGIONAL ACTION STRATEGY
Page 52
Appendix 7 - Comprehensive Economic Development Strategy (CEDS)
Overall Comprehensive Economic Development Strategy is:
• Reduce on the rate of population decline,
• Improve rate of increase in median family income,
• Improve standard of living for the residents of north central Pennsylvania. Seven specific priority areas are included in this strategy. Priority 1: Economic Development
Goal 1.1: Pursue the preservation/retention of existing manufacturing jobs and the creation of additional manufacturing jobs in the region.
Goal 1.2: Pursue manufacturing job development in forest projects, biotech, powdered metals manufacturing, fabricated metals, and specialized electronics.
Goal 1.3: Link County and NCPRPDC revolving loan funds, multi-tenant/incubator facilities, the Export and KOZ programs, TEAM Pennsylvania, and job training programs for nurturing new manufacturing firms, as well as expanding small existing firms. Also, the NCPRPDC’s Self Employment Assistance Program aids in the development of new entrepreneurs.
Priority 2: Community Development
Goal 2.1: Address water, sewer, access roads, multi-tenant buildings, industrial parks, and other projects likely to need services to bring about job creation.
Goal 2.2: Prioritize job-creating and job-retaining projects as most important, unless health and safety issues represent a larger concern.
Goal 2.3: Promote capital improvements, planning to identify needs and financial planning for implementation.
Priority 3: Housing
Goal 3.1: Promote and pursue housing rehabilitation programs, elderly housing, and affordable housing programs.
Priority 4: Transportation
Goal 4.1: Continued participation with PennDOT and TEA 21 programs with Regional Transportation Planning Advisory Committee.
Priority 5: Human Resources/Education
Goal 5.1: Continue to evaluate education system and the relationship between vocational training and the skills required by area employers.

REGIONAL ACTION STRATEGY
Page 53
Priority 6: Environmental
Goal 6.1: Participate with DEP in reducing/monitoring proposed actions or regulations that inhibit or produce an undue burden on private sector employers.
Priority 7: Tourism/Recreation
Goal 7.1: Coordinate tourism promotion with existing tourist promotion agencies.
Goal 7.2: Coordinate special tourism opportunities with the PA Department of Conservation and Natural Resources. (The elk herd in Cameron, Clearfield, and Elk counties is such an example.)

REGIONAL ACTION STRATEGY
Page 54
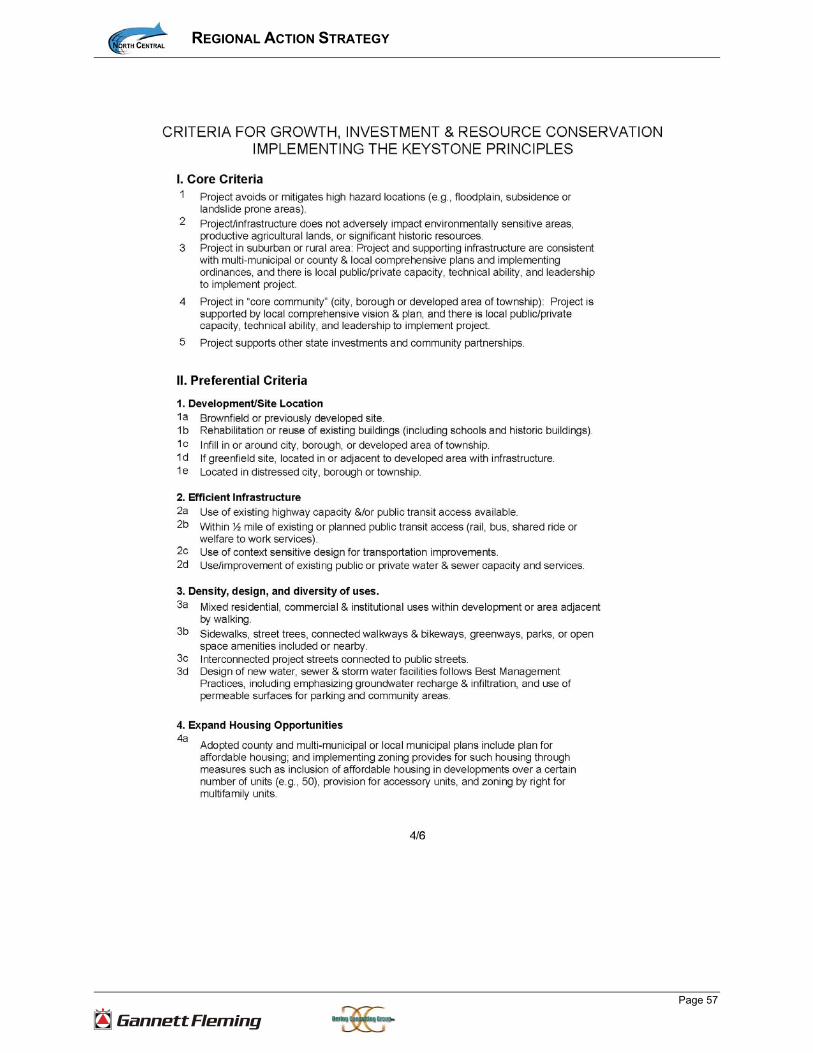
Appendix 8 – Keystone Principles

REGIONAL ACTION STRATEGY
Page 55

REGIONAL ACTION STRATEGY
Page 56
REGIONAL ACTION STRATEGY
Page 57

REGIONAL ACTION STRATEGY
Page 58

REGIONAL ACTION STRATEGY
Page 59

REGIONAL ACTION STRATEGY
Page 60
Appendix 9 – North Central Pennsylvania Regional Planning and Development Commission
NCPRPDC operates a number of economic development, transportation, social, and workforce development programs. The programs have varied funding sources and measure program-specific outcomes. Following is a list of programs.
Enterprise/Economic Development
The major focus of the Economic Development Administration (EDA) program continues to be a multi-agency approach toward implementing economic development projects in rural Pennsylvania.
Finance - Loan Program The Loan Program is set up to support businesses for capital development projects that will create or save jobs. The loan programs can finance capital improvements in an amount up to $200,000, or 40%-50% of the project cost, whichever is less. Businesses that are eligible to apply for financing include manufacturing, industrial services, warehousing, distribution, tourism, and agriculture.
Export Marketing The Export Marketing Program provides value-added assistance to North Central clients that are interested or engaged in international trade. The major objective of the Export Marketing Program is to facilitate economic development through growth in world trade.
Procurement Technical Assistance
The Procurement Assistance Program is designed to increase the number of area companies receiving government contracts by educating management on how to market their products to the government and to offer technical assistance and support through each phase of the procurement process.
Lumber Heritage Region The Lumber Heritage Region is one of Pennsylvania's twelve Heritage Regions. A grassroots effort to tell the great stories of the lumbering era; to share the vast wealth of natural, cultural, and historic resources in the 15 county Region; and to educate visitors and residents alike about the importance of the sustainable forest practices of today's lumber industry.
Keystone Opportunity Zones and Keystone Innovation Zones
A Keystone Opportunity Zone (KOZ) is a defined, parcel-specific geographic area designated by local governments and approved by the state as virtually tax free. Property owners, residents, and businesses benefit from little or no tax burden on these properties for up to 12 years. The goal of the KOZ Program is to revive economically distressed urban and rural communities with the most powerful market-based incentive - virtually no taxes.

REGIONAL ACTION STRATEGY
Page 61
Keystone Innovation Zones (KIZs) are designated zones that may be established in communities that host institutions of higher education – colleges, universities, and associate degree technical schools. These zones are designed to foster innovation and create entrepreneurial opportunities.
Foreign Trade Zone The DuBois-Jefferson County Airport Foreign-Trade Zone #254 consists of 337 acres of developable land adjacent to the DuBois Jefferson County Airport in Washington Township, just 5 miles from Interstate 80 and Genesee-Wyoming Railroad, with connection to CSX and Norfolk-Southern.
Entrepreneurial Assistance The Entrepreneur's Club, organized as a component of the Department of Community and Economic Development's Entrepreneurial Network Initiative, is a forum for business owners to come together to be educated on topics of their choice as well as network with one another. The topics are chosen by the participants based on their needs and interests. The club meets on the first Thursday of every other month at DuBois Holiday Inn from 6-8 p.m.
ARC (Appalachian Regional Commission)
Implement the mission of the ARC and provide technical assistance to LDDs to improve overall quality of life of the region.
EDA (Economic Development Agency, US Dept. of Commerce)
Enhance Infrastructure of region and support local economic development initiatives.
Local Technical Assistance Program (LTAP)
The LTAP program is designed to help Pennsylvania’s municipalities make the best use of their roadway maintenance dollars. LTAP provides technical information and proven technologies dealing with roadway maintenance and safety methods to meet the growing demands on municipal governments.
Business Retention and Expansion Program (BREP)
The program promotes a proactive retention and expansion strategy designed to identify business needs and concerns. It provides action through a partnership comprised of the Commonwealth, private industry, and economic and community development professionals.
Industrial Technical Education Center
Provide hands-on training from industry experienced instructors and financing options.
Information Technology North Central Internet offers a high quality Internet service to customers. This service includes Dial-Up, DSL, and High Speed Wireless Internet access. Web Hosting, Personalized Customer Support, and Spam and Virus Protection are also part of the North Central Internet package.
REGIONAL ACTION STRATEGY
Page 62
Geographic Information Systems (GIS)
GIS is an enabling technology that integrates common database operations such as query and statistical analysis with the unique visualization and geographic analysis benefits offered by maps. These abilities distinguish GIS from other information or database systems and make it valuable to a wide range of county departments for explaining events, predicting outcomes, and planning strategies.
Rural Transportation Planning
North Central serves as the official Rural Transportation Planning Organization (RPO) for Cameron, Clearfield, Elk, Jefferson, McKean and Potter counties. Operating via an agreement with the Pennsylvania Department of Transportation, the RPO is responsible for guiding the transportation planning, and programming process as well as approving the development and implementation of highways, transit, and other transportation facilities and services. The RPO Planning Committee acts as the authority on all transportation planning activities.
WIC (Women, Infant & Children)
WIC provides nutritious foods, nutrition education, and referrals to health and other social services to participants at no charge. WIC serves low-income pregnant, postpartum, and breastfeeding women, and infants and children up to age 5 who are at nutrition risk.
Workforce Development North Central Workforce Development provides a wide variety of high quality service to employers within our six county region. Consistent with our mission of improving the quality of life, North Central Workforce makes a significant contribution by delivering training services to our customers; the Region's workforce and employer community.
Municipal Technology Assistance Program (MTAP)
The Municipal Technology Assistance Program is a cooperative effort designed to assist local governments in securing the IT (Information Technology) infrastructure and training that will enable them to offer local government services more effectively and efficiently. The program is designed to work with any office of local government that is interested in providing information, services, etc. to constituents via electronic format.

REGIONAL ACTION STRATEGY
Page 63
Appendix 10 – Current Rural Studies: “Conventional Wisdom”
A review of a number of studies of rural regions, and rural Pennsylvania in particular, indicate that the North central region exhibits rural characteristics and trends that are emphasized in recent literature. The following is a recap of several well-known and relevant studies, with summarized recommendations:
1. "Pennsylvania’s Global Competitiveness Initiative: An Investor-Oriented Approach to Economic Development” IBM/PA DCED October 2007
• Enhance competitive advantages to attract or retain growing business in integrated bio-pharmaceutical manufacturing, biotech research, integrated medical devices, alternative energy (including solar panels, waste fired coal, bio-fuel, and wind turbine assemblies), agro-food processing, digital media, prefabricated (i.e. manufactured) housing, fine chemicals production, and printing and publishing
• Gain access to a sufficient number of qualified workers • Ensure workforce initiatives and workforce development organizations continue to focus
upon growth sectors of the economy • Examine capabilities and offerings through the lens of prospective investors • Focus economic development resources to attract and expand investment in sectors of the
economy in which the region has a competitive advantage • Recognize that businesses and potential investors typically focus on labor markets when
determining where to site their facilities • Investor-oriented focus
2. “Transportation, Economic, and Land Use System” NJIT, Newark NJ, and Rutgers University, New Brunswick, NJ, 2002
• Consider the likely effect of transportation policy decisions on land use and development, and the consistency of transportation plans and programs with the provisions of all applicable short- and long-term land use and development plans.
• Assess the impact of transportation improvements on surrounding land uses based on existing research
• Take into account the effect of all transportation projects to be undertaken with the (metropolitan) area without regard to whether such projects are publicly funded
3. “Strengthening Rural Pennsylvania: An Innovative Approach to a Prosperous Commonwealth” The Brookings Institution, March 2007
• Embrace complexity and cooperation • Leverage local assets:
1. Think and act regionally 2. Identify indigenous assets 3. Match assets with emerging or existing niche in global markets 4. Make investments that allow communities and regions to capitalize on assets 5. Foster local entrepreneurship
• Foster leadership and local capacity

REGIONAL ACTION STRATEGY
Page 64
4. “Committing to Prosperity: Moving Forward on the Agenda to Renew Pennsylvania”, The Brookings Institution, March 2007
• Strengthen existing cluster development • Make clusters the primary client of the Governor’s Action Team • Expand the role of the state’s Industry Partnership Grants • Dissolve barriers between economic and workforce development • Coordinate economic development and land use planning
5. “Structuring Healthy Communities. Part 1: Revenue Generation and Fiscal Health,” The Pennsylvania Economy League, Inc. 2003
• The fiscal health of Pennsylvania’s municipalities is moving in the wrong direction • Five stages of municipal fiscal decline show a continuing path toward distress are:
1. Prosperity with low taxes 2. Increasing demand for services and gradually rising tax rates and service fees 3. Reductions in non-core services 4. Reductions in core services 5. Loss of tax base and distress
• The current set of tools is insufficient to reverse the current momentum • Keep local municipal identity but administer regionally
6. “The State of Rural Pennsylvania”, The Keystone Research Center, Harrisburg, PA 2006
• Develop a business plan for rural Pennsylvania and the key leadership at the state and regional level to implement it.
• Become a national model in rural education and skill development for the 21st century. • Invest in economic development strategies that capitalize on the existing strengths of rural
areas and create good jobs. • Support the long-term security of the rural middle class through more affordable access to
health insurance and retirement security. • Lower the rural share of state taxes through more progressive taxation. When taxes are
regressive, and Pennsylvania’s are highly so, lower-income taxpayers pay a bigger share of their income in taxes than higher-income taxpayers. As a result, rural Pennsylvania currently pays a substantially larger share of its total income in state and local taxes than suburban Pennsylvania.
7. “The Prescription for Prosperity, An Economic Agenda for Pennsylvania’s Future”, The Keystone Research Center, Harrisburg, PA, 2007
• Become a national model in education and skills development for the 21st century • Invest in good jobs through economic development for the 21st century • Support the long-term security of the middle class • Bring more Pennsylvanians into the middle class • Reform Pennsylvania’s taxes for the 21st century • Develop a “Business Plan for Pennsylvania’s Future”