north carolina supplemental retirement plans manager updates · 2019-02-14 · ashraf haque –...
TRANSCRIPT

North Carolina Supplemental Retirement Plans Manager Updates January 28, 2013

Research note
Manager: Sands Capital Management (Sands)
Title: Select Growth Equity update Date: 16 January 2013 Author: Carey Freimuth Peer reviewer: Jack Liu Strategies reviewed in this note: Product group/ category
Strategy name Current rating
Recommended rating (*)
ESG rating (**)
US Equity - Large Cap Growth
Select Growth Equity A (T) A (T) ESG4
(*)The recommended ratings in this document may be subject to an approval process and may be subject to change. For the most recent approved ratings please refer to your consultant or to GIMD as appropriate.
(**) For more information on ESG ratings please refer to your consultant or to the ‘Guide to Mercer Ratings’ on GIMD as appropriate.
Details of research meeting(s) covered by this note: Date Location On-site? 1 November 2012
Arlington, VA Yes
Manager attendees: David Levanson – Senior Portfolio Manager, Senior Research Analyst Ashraf Haque – Research Analyst Thomas Trentman – Research Analyst, Portfolio Manager Michael Raab – Research Analyst, Portfolio Manager Luke Iglehart – Consultant Relations Mercer attendees: Carey Freimuth Hoa Quach Rationale for A rating Sands' Select Growth Equity strategy benefits from a skilled and experienced team that follows a well-defined process to identify leading growth companies in attractive businesses. The firm allocates significant resources to fully understand each company prior to making an investment decision. Sands' deep team of seasoned analysts and thorough fundamental research are competitive advantages.

Research note
Mercer Evaluation Summary Factor Rating
(-, =, + or ++) Comments
Idea Generation ++ Sands' deep investment team is solely dedicated to finding large cap companies that meet its focused definition of a leading growth company. This definition, combined with a concentrated low-turnover approach, focuses the research process on a narrow universe of stocks and allows Sands to allocate significant resources in getting to know each company prior to making an investment decision. The ability for the investment team to uncover profitable investment ideas over the long-term is a strength of the strategy. In addition, the team shares in a common belief in what drives a profitable investment and has shown a willingness to challenge each other to ensure that the best ideas are in the portfolio.
Portfolio Construction
+ A unique feature of Sands' investment process is known as business space diversification. Companies in the portfolio will typically have exposure to multiple business lines, and these exposures are monitored to ensure that all key sectors are represented in the portfolio. We view business space diversification as a strength of the strategy, especially given the concentrated nature of the portfolio.
Implementation + Given current assets under management, we believe Sands has ample capacity to implement investment ideas. The strategy invests primarily in large cap names and is managed in a low turnover fashion. Nevertheless, given the concentrated nature of the strategy, we believe it is important that the firm control growth in assets under management, particularly with its global strategy, to retain trading flexibility.
Business Management
+ Sands is 100% employee-owned and focused on large cap growth investing. In 2005, the firm reorganized into a LLC which enabled it to distribute equity to its employees. All investment professionals have equity ownership and the team has remained stable. Overall, we have a favorable view of its business management. However, the firm is highly reliant on the success of a single product. The firm introduced a global strategy which leverages the team's strength in growth investing and helps to diversify some of the firm's product risk.
Overall Rating (A, B+, B or C)
A (T)
Sands follows a well-defined process to identify leading growth companies in attractive businesses. Sands has successfully applied this process to its management of large cap growth portfolios and has aligned its research in a global fashion over time. The firm's definition of a leading company and the application of business space diversification are the defining features. In addition, the depth to which the firm gets to know its companies and the resources it employs support the concentrated nature of the portfolio. Sands' deep team of seasoned analysts and thorough fundamental research provides a competitive advantage. Sands' organizational structure is fully supportive of the research process, and the widespread distribution of equity ownership promotes stability.
Additional Observations
Given the portfolio's loose constraints and concentrated nature, tracking error can be high at times. Short-term deviations relative to the benchmark can be quite significant and clients invested with Sands must be willing to take a long-term perspective. The strategy is best classified as aggressive growth.
Mercer Page 2 of 13

Research note
Mercer Page 3 of 13
Key product details
Inception Year 1992
Assets under management in strategy $22.5 billion as at 31 December 2012
Estimated capacity $30 billion
Open/Closed Open to All Investors
Most suitable benchmark index for strategy Russell 1000 Growth
Outperformance target (% per annum) - Manager's estimate
2-3
Expected tracking error range (%) - Manager's estimate
6-9
Issues to watch Overlap with Global Growth Equity Strategy: The firm runs a Global strategy and there is approximately 50% overlap between the two strategies. Given the firm’s concentrated approach, will it be sensitive to liquidity issues resulting from the overlap between the strategies as the Global strategy gains traction? Highlights
• Little has changed with Sands’ Select Growth Equity strategy since our last meeting. The team and the process remain the same and there has been little change in the actual holdings of the portfolio. The strategy handily outperformed its benchmark during 2012 by 940 basis points. We continue to have conviction in Sands’ investment philosophy, process, and team and are not recommending any change to the rating.
• The team continues to focus on its six investment criteria, looking to continually evaluate
its investment decisions. Over the past five years, the team identified some patterns that detracted from performance. A weaker fit with Sands’ six investment criteria, failure to meet growth expectations, failure to anticipate the maturation of primary growth engines, and poor execution by company management were characteristics of the companies that underperformed. Conversely, patterns of successful companies were identified over the past five years to include development of key insights into a major shift within an industry, identifying a big gap between long-term projects and consensus estimates, and identifying dominant businesses at ‘choke points’ (the step in the value chain which allows the company the most control). This type of analysis demonstrates the team’s commitment to constantly evaluating its process and stocks to provide a portfolio of its best ideas.

Research note
Mercer Page 4 of 13
• Earlier in 2012, Sands created an Executive Management Team (EMT) to provide strategic leadership across the investment research, client service, and business management functions of the firm. Previously, this responsibility had fallen to four of the firm’s most senior people; the creation of the EMT formalizes this function and expands the number of people to relieve some of the responsibilities from Frank Sands, Jr. The EMT is currently comprised of Frank Sands, Sr. (Chairman & Founder), Frank Sands, Jr. (Chief Executive Officer and Chief Investment Officer), Bob Hancock (Chief Operating Officer & Chief Compliance Officer), Bob Puff (Vice Chairman), Dave Levanson (Co-Portfolio manager, Global Growth), Tom Ricketts (Co-Portfolio manager, Select Growth), and Perry Williams (Co-Portfolio manager, Select Growth).
• The EMT meets once a month to review all departments. The group also has an annual offsite to plan the future of the firm. Ricketts believes the management team could expand to include some from the client relationship group and that maybe Sands would add one to three new members over the next five years. Given the size of Sands, the creation of a formal committee to focus on the management of the firm makes sense. Additionally, expanding the group that makes those decisions reinforces the importance of the senior portfolio managers to the firm.
• With approximately $22 billion in assets the Select Growth Equity strategy is the firm’s largest offering. The Global Equity has approximately $3 billion under management but has been experiencing significant growth however we do not believe it impedes on the resources of the US research team. The overlap between the two is currently around 45% to 50% but this can vary over time.
Firm background and history Sands Capital Management (Sands) was founded in 1992 by Frank Sands, Sr. and William Johnson. In 2000, Frank Sands, Jr. joined the firm. The following year, Johnson's ownership interest in the firm was bought out and redistributed to Sands, Jr. In 2005, the firm changed its ownership structure to a LLC in order to facilitate the transfer of control from Sands Sr. to Sands Jr. and provide a more efficient means to distribute equity to employees. Effective September 2008, Sands Jr. succeeded Sands Sr. as CEO and CIO. Sands Sr. remains involved in the investment process and is Chairman. The firm spread out economic interest to a sizable number of employees in 2009 and all senior and mid-level investment professionals (including research analysts) have ownership along with senior client service, trading, and operation personnel. Key decision makers The strategy is managed by a Frank Sands, Jr., who receives support from Sands, Sr. and an experienced team of global sector researchers. While the entire team has input into the process, Sands Jr. has the ultimate responsibility for investment decisions. A team of sector specific research analysts and associates also supports the strategy. Product history In addition to separate accounts ($25 million minimum), Sands manages assets for two sub-advisory relationships. The firm began managing assets for Touchstone (Touchstone Sands

Research note
Mercer Page 5 of 13
Capital Growth Fund - previously called Constellation Sands Capital Growth Fund) in February 2005. Additionally, the firm sub-advises a fund for the IKANO Group in Europe. Sub-advised funds are managed similarly to separate accounts. The only difference is that the funds may hold slightly more cash as a means to provide liquidity for daily transactions. Please note the name was changed from Large Cap Growth to Select Equity Growth with the introduction of the Global Growth Equity strategy. Investment style/philosophy Sands is a bottom-up, quality growth manager. The firm builds concentrated portfolios of leading companies, which are broadly diversified across a number of business lines. Sands essentially follows a buy and hold philosophy with extremely low turnover and low transaction costs. The long-term investment horizon allows the companies in the portfolio to realize long-term business opportunities that lead to shareholder wealth creation. Investment process The process is bottom-up and fundamental in nature. The team's primary goal is to identify outstanding growth companies that lead and dominate attractive growth industries. Initial research looks for companies with above-average historical sales and earnings growth. This initial research results in stocks being added to or deleted from the Growth Company Watch List. The Watch List typically contains 250 to 300 potential leaders participating in growing sectors such as Technology, Health Care and Consumer/Retail. Seven qualitative success factors are then analyzed to identify the leaders within each attractive business space. Sands believes companies can lead and dominate by creating growth drivers (new products/services and entering new markets), developing and anticipating industry trends, creating competitive barriers, gaining market share, building financial muscle and a strong business model, displaying superior management ability, and applying technology to add value. Fulfilling these criteria is the most important part of the investment research process, providing a powerful filter for locating high quality companies. Companies that pass the leaders screens are added to the Company Leader List, which typically contains 60 to 80 companies in 15 to 20 growing industries. Purchase candidates are selected from the Leader List and are expected to possess dominant leadership in an attractive growth business with the potential to deliver sustainable, long-term earnings growth. A stock will be sold if it becomes overvalued, if the business matures, if there is an adverse change in long-term fundamentals, or if reality differs from initial analysis. Portfolios will hold up to 30 stocks. Individual positions are maintained between 1% and 10% of the total portfolio. Sands does not constrain the portfolio based on sector exposure. However, the leading companies in the portfolio typically will have exposure to multiple business lines. Sands monitors this business line exposure to ensure that all key sectors are represented in the portfolio. Average market capitalization, while not specifically managed, is expected to be roughly in line with that of the S&P 500 Index. Turnover is low and averages around 20%.

Research note
Portfolio holdings analysis
US Equity - Large Cap Growth - Select Growth Equity
Date of analysis 30 September 2012
Benchmark used for analysis Russell 1000 Growth
Number of stocks 28
Predicted tracking error (%) 6.7
Average value score -2.5
Average growth score 1.9
Adjustment used for Style Tilts No Adjustment
Cash (%) 0.7 The following chart shows the 'style tilts' for the portfolio. Style analysis shows that the portfolio has a negative bias to value factors and positive tilts to growth and quality factors, which is what we would expect given Sands’ process and since our last review. This style skyline is consistent with the portfolio’s style characteristics since its inception and is what we would expect going forward.
-1.1
-3.4-3.1
-1.8
-3.2
0.8
3.02.7
3.4
-0.5
-1.6
2.3
-0.9
-0.2
1.31.0
0.7
-0.6
-4.0
-3.0
-2.0
-1.0
0.0
1.0
2.0
3.0
4.0
Book
to P
rice
Divid
end
Yield
C'Fl
ow Y
ield
Sales
to P
rice
IBES
Eng
s Yl
d
Earn
ings
Grow
th
Sales
Gro
wth
IBES
12M
th G
r
IBES
Eng
s LT
G
Sust
ainab
le Gr
owth
Rtn
on E
quity
Low
Gear
ing
Earn
ings
Gr S
tabil
ity
Mar
ket C
ap
Mar
ket B
eta
Mom
entu
m S
T
Mom
entu
m M
T
IBES
1Yr
Rev
Styl
e Ti
lt™
'Value' Factors 'Growth' Factors Other Style Factors
Select Growth Equity as at Sep 2012
Mercer Page 6 of 13

Research note
Mercer Page 7 of 13
The following chart shows the portfolio weightings to each sector. Similar to a year ago, the largest overweight remains to Technology with overweights to Consumer Discretionary and Healthcare. Energy now has a larger overweight relative to a year ago with Schlumberger in the top ten holdings. The remaining top ten holdings which comprise of 55.5% of assets include: Alexion, Allergan, Amazon, Apple, ASML, Google, Qualcomm, Salesforce, and Visa.
SANDS - Sector Weights as at Sep 2012
0
10
20
30
40
50
Ener
gy
Mat
eria
ls
Indu
stria
ls
Con
s D
isc
Con
s St
aple
s
Hea
lth C
are
Fina
ncia
ls
Info
Tec
h
Tele
com
Serv
ices
Utili
ties
Wei
ght (
%)
Weight Benchmark Weight

Research note
Past performance
US Equity - Large Cap Growth - Select Growth Equity
Track Record Select Growth Equity Composite
Currency $US
Benchmark Russell 1000 Growth
Mercer Universe US Equity Large Cap Growth ($US)
Track record type Composite
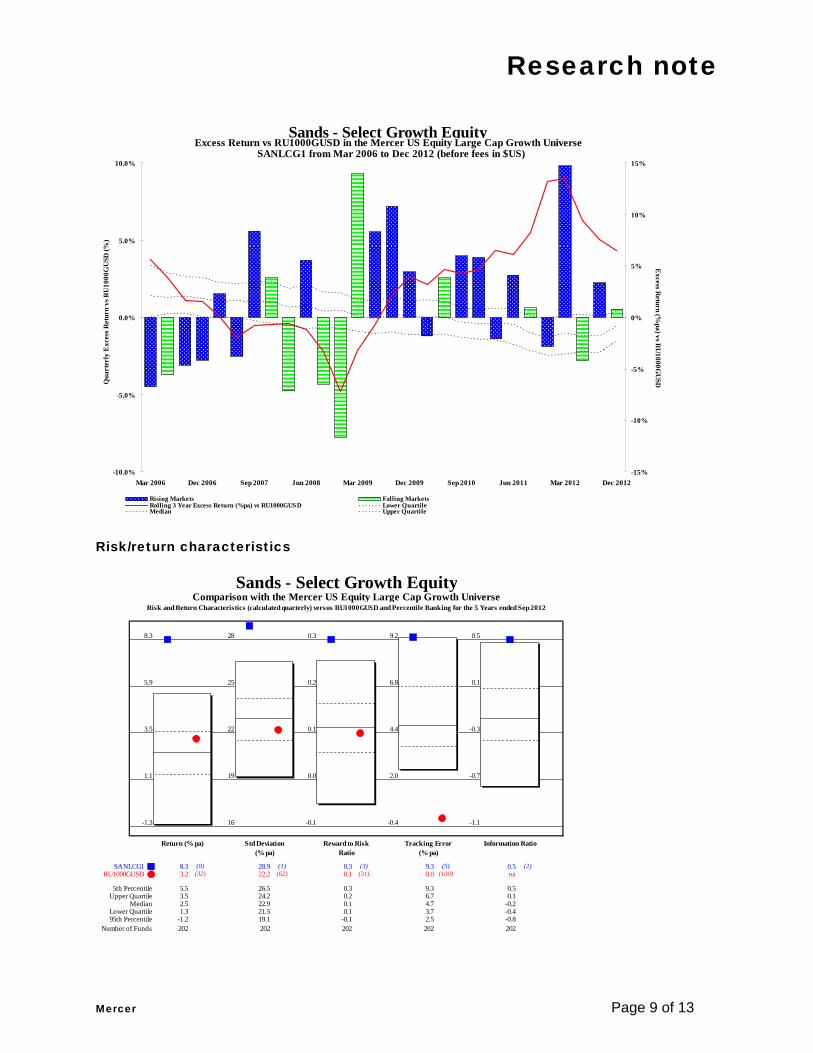
Track Record Assets $12.4 billion as at 31 December 2012 Rolling period chart The Select Growth Equity portfolio is ahead of the Russell 1000 Growth Index on a one (by 940 basis points), three (by 640 basis points), and five (by 470 basis points), year basis. Over the past year earnings growth, a characteristic of Sands’ portfolio, was rewarded by the market. The top three contributors over a trailing three year period are Amazon, Salesforce, Visa, Las Vegas Sands and Alexion Pharmaceuticals. Visa is positioned at a choke point in the payment-processing value chain and its position in this value chain is its major competitive advantage, given that it operates in a relatively benign competitive environment. The bottom detractors over that same time horizon are Netflix, Monsanto, Opentable and Cree. Netflix is an example of poor management decisions that disrupted growth, leadership, and an investment case and has since been sold. Cree was initially purchased for its leadership in manufacturing LED lighting components, believing its patents and technical trade secrets would defend its position. However, competitors began to produce "good enough" LED components for general lighting, which ultimately negatively affected pricing and gross margins. In retrospect Cree's competitive advantages were more marginal than initially expected.
Mercer Page 8 of 13
Research note
Mercer Page 9 of 13
-10.0%
-5.0%
0.0%
5.0%
10.0%
Mar 2006 Dec 2006 Sep 2007 Jun 2008 Mar 2009 Dec 2009 Sep 2010 Jun 2011 Mar 2012 Dec 2012-15%
-10%
-5%
0%
5%
10%
15%
Rising Markets Falling Markets Rolling 3 Year Excess Return (%pa) vs RU1000GUSD Lower Quartile Median Upper Quartile
Excess R
eturn (%pa) vs R
U1000G
USD
Excess Return vs RU1000GUSD in the Mercer US Equity Large Cap Growth UniverseSANLCG1 from Mar 2006 to Dec 2012 (before fees in $US)
Sands - Select Growth Equity
Qua
rter
ly E
xces
s Ret
urn
vs R
U10
00G
USD
(%)
Risk/return characteristics
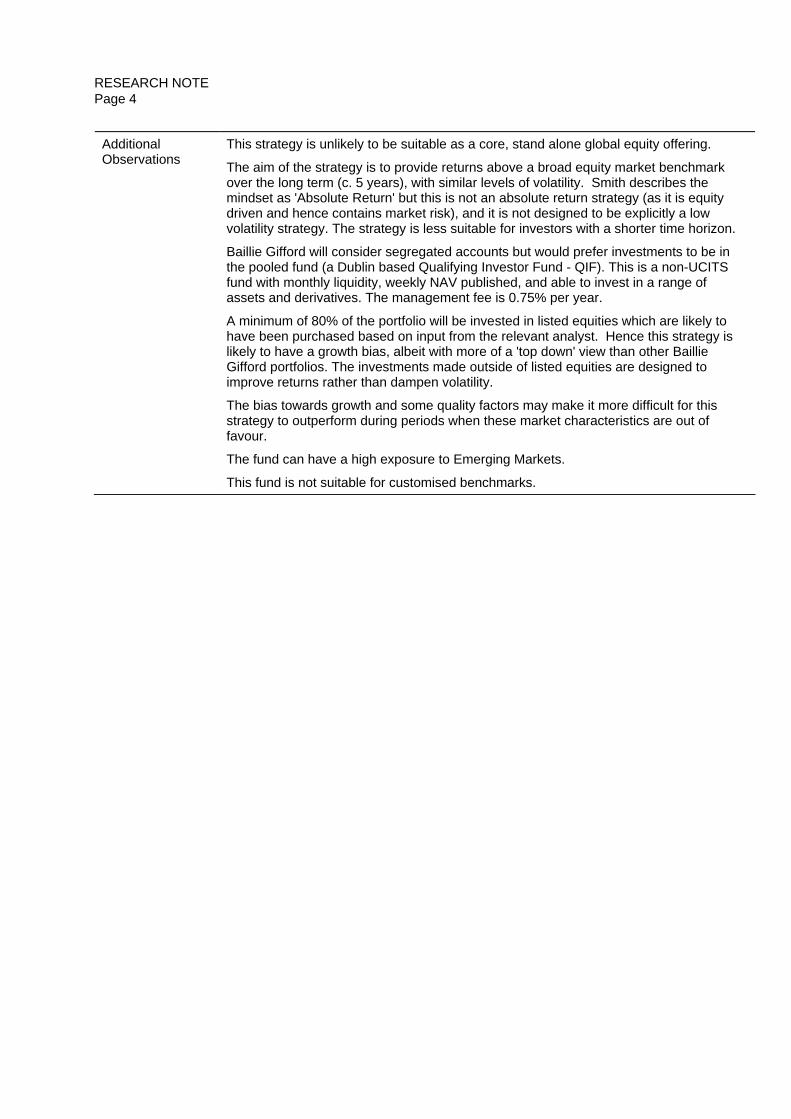
8.3 28 0.3 9.2 0.5
5.9 25 0.2 6.8 0.1
3.5 22 0.1 4.4 -0.3
1.1 19 0.0 2.0 -0.7
-1.3 16 -0.1 -0.4 -1.1
SANLCG1 8.3 (0) 28.9 (1) 0.3 (3) 9.3 (5) 0.5 (2)RU1000GUSD 3.2 (32) 22.2 (62) 0.1 (31) 0.0 (100) na
5th Percentile 5.5 26.5 0.3 9.3 0.5Upper Quartile 3.5 24.2 0.2 6.7 0.1
Median 2.5 22.9 0.1 4.7 -0.2Lower Quartile 1.3 21.5 0.1 3.7 -0.495th Percentile -1.2 19.1 -0.1 2.5 -0.8
Number of Funds 202 202 202 202 202
Comparison with the Mercer US Equity Large Cap Growth UniverseSands - Select Growth Equity
Risk and Return Characteristics (calculated quarterly) versus RU1000GUSD and Percentile Ranking for the 5 Years ended Sep 2012
Return (% pa) Std Deviation (% pa)
Reward to Risk Ratio
Tracking Error (% pa)
Information Ratio

Research note
Mercer Page 10 of 13
Further Detail
ESG and Active Ownership Sands considers environmental, social, and, in particular, governance (ESG) issues in the context of their potential financial effect on a company’s stock price, but the factors are not explicit drivers of the investment philosophy and process. A rating of ESG3 is appropriate. Business Management The compensation structure employed at Sands has been evolving for the last ten years, but at its core, the goal is to have alignment with client success. The bulk of an investment professional’s compensation is in the form of a bonus with more senior professionals receiving a greater percentage of total compensation from incentive pay. Total compensation for all investment professionals include a salary based on their job functions, incentive compensation, and equity. The incentive compensation is comprised of both a quantitative and qualitative portion with the quantitative portion a greater percentage of the total. The quantitative portion is based on results of client portfolios with 10% weighted to one-year results, 40% to three-year returns, and 50% to rolling five-year numbers. The management team sets an absolute target bonus and a linear function is used to determine the amount over or under the target that a professional receives based on the relative portfolio performance. If the portfolio outperforms the benchmark, the professional will receive a multiple of the target amount. Benchmark performance results in a payment equal to the target amount. Portfolio Construction Sands has a two level approach to portfolio construction: strategic weights and tactical weights. The strategic weights are determined by how well the stock fulfills the six investment criteria and how it compares to other stocks in the portfolio. The portfolio is bucketed into small, medium, and large position sizes. The team will also consider risk when determining the bucket for a stock. The team will tactically over- or underweight a stock versus its strategic weight based on shorter-term metrics such as valuation. There is no explicit limit to the tactical over/under weighting. However, historically, those weighting differences have been in the 50% to 150% range. The tactical weights are infrequent and not a focus of the team. At any given time, the team may have two to four such positions with expectations that they might last for 12 to 18 months. The risk management process is integrated into the investment process. The goal is to avoid loss of capital. The key sources of risk considered by Sands are business risk, market risk, macro risk, and portfolio-level risk. Business risk is managed as part of the research process. Adherence to the six investment criteria helps the team to control the impact of business risk and the strategic weights balance the risk with the return potential. Market risk is managed through the specification of expected return ranges and the use of tactical weights. Macro risk is managed within the headwinds/tailwinds framework used for stock research and a focus on long-term secular forces. Sands manages portfolio-level risk by diversifying across geography and industry, monitoring overlapping growth drivers, staying aware of implied macro bets, and ensuring liquidity in the portfolio. There is about 45% overlap in names between the global and US portfolios. Sands does not have rules regarding the level of overlap between the portfolios. Each portfolio management team is independent, but the research follows the same process. Even though the names may

Research note
Mercer Page 11 of 13
overlap, the timing of purchases and sales may be different for the portfolios. The availability of cash is a main determinant of when a stock is purchased for either portfolio.
Important notices © 2012 Mercer LLC. All rights reserved. This contains confidential and proprietary information of Mercer and is intended for the exclusive use of the parties to whom it was provided by Mercer. Its content may not be modified, sold or otherwise provided, in whole or in part, to any other person or entity, without Mercer’s written permission. The findings, ratings and/or opinions expressed herein are the intellectual property of Mercer and are subject to change without notice. They are not intended to convey any guarantees as to the future performance of the investment products, asset classes or capital markets discussed. Past performance does not guarantee future results. This does not contain investment advice relating to your particular circumstances. No investment decision should be made based on this information without first obtaining appropriate professional advice and considering your circumstances. Information contained herein has been obtained from a range of third party sources. While the information is believed to be reliable, Mercer has not sought to verify it. As such, Mercer makes no representations or warranties as to the accuracy of the information presented and takes no responsibility or liability (including for indirect, consequential or incidental damages), for any error, omission or inaccuracy in the data supplied by any third party. This does not constitute an offer or a solicitation of an offer to buy or sell securities, commodities and/or any other financial instruments or products. Research ratings Mercer’s rating of an investment strategy signifies Mercer’s opinion as to the strategy’s prospects for outperforming a suitable benchmark, on a risk-adjusted basis, over a full market cycle. Strategies rated A are those assessed as having above average prospects. Those rated B are those assessed as having average prospects. Those rated C are assessed as having below average prospects. B+ is an intermediate category in between A and B. If the rating shown is N, or if no rating is shown at all, this signifies that the strategy is not currently rated by Mercer. Some strategies may carry an additional rating (e.g. T (Higher Tracking Error), P (Provisional), and W (Watch)). For some product categories, Mercer does not maintain formal ratings but instead assigns a Preferred Provider status. For the most recent approved ratings, and a fuller explanation of their meanings, refer to your Mercer representative or to the Mercer Global Investment Manager Database (GIMD™) as appropriate. The term “strategy” is used in this context to refer to the process that leads to the construction of a portfolio of investments, regardless of whether it is offered in separate account format or through one or more funds. The rating assigned to a strategy may or may not be consistent with its historical performance. While the rating reflects Mercer’s expectations on future performance relative to its benchmark, Mercer does not provide any guarantees that these expectations will be fulfilled.

Research note
Mercer Page 12 of 13
Mercer does not generally take the investment management fees of a given manager into account in determining ratings. Managers’ fees charged for a specific strategy will often vary among investors, either because of differing account sizes, inception dates or other factors. Mercer does not perform operational infrastructure due diligence or personal financial or criminal background checks on investment managers. Mercer’s research process and ratings do not include an evaluation of a manager’s custodian, prime brokerage, or other vendor relationships or an assessment of its back office operations. Research is generally limited to the overall investment decision-making process used by managers. Mercer's investment consulting business rates and/or recommends strategies of investment managers, some of whom are either Mercer clients, Mercer affiliates or clients of Mercer’s affiliates. The services provided to those managers may include a broad range of consulting services as well as the sale of licenses to use Mercer’s proprietary software and databases and/or subscriptions to Mercer's investment forums. Policies are in place to address these and any other conflicts of interest that may arise in the course of Mercer’s business. This is only a summary of Mercer’s conflicts of interest. For more information on Mercer’s conflict of interest policies, contact your Mercer representative. Universe notes Mercer manager universes are constructed using data and information provided to Mercer either directly or via third party providers. The universes are intended to provide collective samples of strategies that best allow for robust peer group comparisons to be conducted over a chosen timeframe. Mercer does not assert that the peer groups are wholly representative of and applicable to all strategies available to individual investors. Universe distributions are calculated based on the data that was in our database at the time that the universe was constructed, and may therefore change over time due to additional information supplied by an investment manager or revisions to data. Risk warnings The value of stocks and shares, including unit trusts, can go down as well as up and you
may not get back the amount you have invested.
The value of Gilts, bonds, and other fixed income investments including unit trusts can go down as well as up and you may not get back the amount you have invested.
Investments denominated in a foreign currency will fluctuate with the value of the currency.
The value of investments in real property can go down as well as up, and you may not get back the amount you have invested. Valuation is generally a matter of a valuer’s opinion, rather than fact. It may be difficult or impossible to realise an investment because the property concerned may not be readily saleable.
Certain investments, such as illiquid, leveraged or high-yield instruments or funds and securities issued by small capitalization and emerging market issuers, carry additional risks that should be considered before choosing an investment manager or making an investment decision.
For higher volatility investments, losses on realisation may be high because their value may fall suddenly and substantially.

Research note
Mercer Page 13 of 13
Where investments are not domiciled and regulated locally, the nature and extent of investor protection will be different to that available in respect of investments domiciled and regulated locally. In particular, the regulatory regimes in some domiciles are considerably lighter than others, and offer substantially less investor protection. Where an investor is considering whether to make a commitment in respect of an investment which is not domiciled and regulated locally, we recommend that legal advice is sought prior to the commitment being made.

RESEARCH NOTE
Manager: Baillie Gifford & Company
Title: Global and Emerging Market equities update and review Author: Michael Kinney Peer reviewer: Deb Clarke Strategies reviewed in this note: Product group/ category
Strategy name Current rating
Recommended rating (*)
ESG rating (**)
International Equity - Global Equity - Core
Global Opportunities A (T) A (T) ESG3
International Equity - Global Equity - Growth
Global Alpha (+2-3%) A A ESG3
International Equity - Global Equity - Growth
Long Term Global Growth (+3%) A (T) A (T) ESG3
International Equity - World ex US/EAFE Equity - Growth
Long Term Global Growth ex NA (+3%) A (T) A (T) ESG3
International Equity - World ex US/EAFE Equity - Growth
ACWI ex US Alpha (+2-3%) A A ESG3
International Equity - World ex US/EAFE Equity - Growth
EAFE Plus Alpha (+2-3%) A A ESG3
International Equity - World ex US/EAFE Equity - Growth
EAFE Pure Alpha (+2-3%) A A ESG3
Emerging Markets - Emerging Markets Equity
Emerging Markets All Cap B+ B+ ESG3 (RI)
Emerging Markets - Emerging Markets Equity
Emerging Markets Leading Companies B+ B+ ESG3 (RI)
International Equity - Global Equity - Growth
Global Focus (+1.5%) R N ESG3
International Equity - World ex US/EAFE Equity - Growth
ACWI ex US Focus (up to +2%) R R ESG3
International Equity - World ex US/EAFE Equity - Growth
EAFE Plus Focus (up to +2%) R R ESG3
International Equity - World ex US/EAFE Equity - Growth
EAFE Pure Focus (up to 2%) R R ESG3

RESEARCH NOTE Page 2
Manager: Baillie Gifford & Company
(*)The recommended ratings in this document may be subject to an approval process and may be subject to change. For the most recent approved ratings please refer to your consultant or to GIMD as appropriate.
(**) For more information on ESG ratings please refer to your consultant or to the ‘Guide to Mercer Ratings’ on GIMD as appropriate.
Details of research meeting(s) covered by this note: Date Location On-site? (a) 23 Nov 2012 Edinburgh Yes (b) 4 Dec 2012 London (Mercer offices) No Manager attendees: Malcolm MacColl (Global Alpha, investment manager, a) Spencer Adair (Global Alpha, investment manager, a) Nick Thomas (EAFE Alpha, Deputy Chair of EAFE Alpha PCG and institutional clients department, a) Tom Coutts (EAFE Alpha, investment manager, a) Tom Record (EAFE Alpha, investment manager, a) Jonathan Bates (ACWI Alpha, investment manager, a) Robert Blaikie (dealer, a) Scott Nisbett (LTGG, product specialist, a) Gerald Smith (Global Alpha, investment manager, a) Mike MacPhee (Global Alpha, investment manager, a) Douglas Brodie (Global Discovery, investment manager, a) Will Sutcliffe (Emerging Markets, investment manager, a) Laurence Linklater (International Focus, product specialist, a) Andrew Telfer (CEO, b only) Colin Neilson (consultant relations, a & b) Mercer attendees: Michael Kinney (a and b), Deb Clarke (a only) and Andy Barber (b only)
Rationale for rating No changes in rating are proposed other than for one of the Focus strategies. The global products at Baillie Gifford source stock ideas from the regional and global sector analysts, who are experienced and whom we hold in high regard. Increasingly, stock ideas are also generated within the various strategy teams, and we find the culture of the firm means these ideas are efficiently discussed and shared between teams. We believe the firm’s partnership structure has been successful in creating stability across the firm and providing the right incentives to create a culture striving for outperformance on behalf of clients. In this note, we examine the “shared DNA” of the firm’s global equity strategies. We find that although there is a commonality of style and approach across Baillie Gifford portfolios, there are still noticeable differences between strategies at stock level. We are impressed by the way in which the firm is able to achieve a subtle balance between having a common philosophy, approach and style, whilst also allowing teams autonomy in picking stocks. We think that achieving this balance is tough to do, and that Baillie Gifford is one of only a few firms to do so successfully. They seem to work genuinely as one big team – sharing information and seemingly all wanting to succeed. The partnership structure and the fact that 50% of bonus is about teamwork and contribution to the broader team are contributors. There is, to a degree, a concentration of business risk to the firm due to the common growth / quality style, but we maintain our view that the quality of intellectual capital generated by the firm’s analysts is of a high standard.

RESEARCH NOTE Page 3
Mercer Evaluation Summary
International Equity - Global Equity - Core - Global Opportunities Factor Rating
(-, =, + or ++) Comments
Idea Generation ++ This strategy draws on the Baillie Gifford analysts, whom we generally rate highly, as well as two experienced portfolio managers. The strategy is global in nature and can invest in a number of off-benchmark investments, some of which may be illiquid. However, the portfolio managers have a deep understanding of the investment thesis and their expected exit strategy from each investment. It is clear the portfolio managers have a depth of knowledge in the companies in which they invest but also a clear view of how the value might be recognised. The focus on absolute returns differentiates this strategy further from many of the other global strategies managed by the firm.
Portfolio Construction
+ Although they do not make extensive use of traditional risk models they have a focus on absolute risk; one they have applied for many years in the investment trusts they manage. Their ideas are weighted relative to the risk they contribute to the portfolio and the expected upside.
Implementation + Assets in the strategy are very low and there are no capacity concerns at present. However, there are a number of global strategies managed by Baillie Gifford and so there is a degree of overlap. We believe this is not sufficient to cause any immediate concerns on capacity. The team use the firm’s dedicated dealing team.
Business Management
++ The partnership structure has almost certainly contributed to the stability across the firm. We do not anticipate any corporate activity with this firm. Baillie Gifford has consistently demonstrated the ability to attract and retain quality staff. By growing steadily over the years, it has been able to give opportunities to up and coming staff members. Many join as graduates, advancing through to senior positions.
Overall Rating (A, B+, B or C)
A (T)
We rate the underlying Baillie Gifford analysts highly and have a high opinion of Smith. He and MacPhee have strong track records in investment trusts which they both manage using the same approach as they apply to the Global Opportunities strategy. This combination and the ability of this strategy to invest anywhere, across the spectrum in terms of capital structure and the ability to take on liquidity risk make this an attractive global equity strategy. Whilst we have no capacity concerns at present with this strategy, Baillie Gifford does manage a number of global equity strategies. Although the majority of these are more traditional in their approach we would not like to see further global strategies launched.
RESEARCH NOTE Page 4
Additional Observations
This strategy is unlikely to be suitable as a core, stand alone global equity offering.
The aim of the strategy is to provide returns above a broad equity market benchmark over the long term (c. 5 years), with similar levels of volatility. Smith describes the mindset as 'Absolute Return' but this is not an absolute return strategy (as it is equity driven and hence contains market risk), and it is not designed to be explicitly a low volatility strategy. The strategy is less suitable for investors with a shorter time horizon.
Baillie Gifford will consider segregated accounts but would prefer investments to be in the pooled fund (a Dublin based Qualifying Investor Fund - QIF). This is a non-UCITS fund with monthly liquidity, weekly NAV published, and able to invest in a range of assets and derivatives. The management fee is 0.75% per year.
A minimum of 80% of the portfolio will be invested in listed equities which are likely to have been purchased based on input from the relevant analyst. Hence this strategy is likely to have a growth bias, albeit with more of a 'top down' view than other Baillie Gifford portfolios. The investments made outside of listed equities are designed to improve returns rather than dampen volatility.
The bias towards growth and some quality factors may make it more difficult for this strategy to outperform during periods when these market characteristics are out of favour.
The fund can have a high exposure to Emerging Markets.
This fund is not suitable for customised benchmarks.

RESEARCH NOTE Page 5
Mercer Evaluation Summary
International Equity - Global Equity - Growth - Global Alpha (+2-3%) Factor Rating
(-, =, + or ++) Comments
Idea Generation ++ All of the global products at Baillie Gifford rely on the generation of ideas from the regional and global sector research analysts, whom we regard highly and have significant experience. These ideas are then discussed in a global context by the Global Alpha team consisting of Charles Plowden, Spencer Adair and Malcolm MacColl, who ask themselves an additional series of questions about each stock. The three have different, and complementary, personalities and perspectives, and have been focused solely on this strategy since 2008 (all have been involved since inception in 2005); we believe this is critical to this strategy's success. They have continued to evolve their process to ensure rigorous debate and that the very best ideas are included in portfolios.
Portfolio Construction
+ The Global Alpha team takes the best of the ideas from the regional and sector teams and place them in a global context. The portfolios are driven by stock selection. Individual positions sizes are generally well calibrated. The portfolio can at times have a tail of stocks with smaller position sizes, but these are generally in the higher-growth section of the portfolio. Whilst they have access to - and consider - risk models, there are relatively broad sector, stock and regional controls. They have developed sensible ways of viewing the portfolio in four different growth 'buckets' to help monitor positions.
Implementation + Baillie Gifford employs a team of dealers who are all based in Edinburgh but have extensive experience of dealing across the globe. They have been leaders in unbundling of commission and rigorously assess their brokers on a regular basis. There is scope to manage more assets under the Global Alpha approach, however we do note that at times there are constraints on how much can be invested in some mid cap ideas, particularly in UK stocks, due to the size of assets elsewhere within the firm.
Business Management
++ The partnership structure has almost certainly contributed to the stability across the firm. We do not anticipate any corporate activity with this firm. Baillie Gifford has consistently demonstrated the ability to attract and retain quality staff. By growing steadily over the years, it has been able to give opportunities to up and coming staff members. Many join as graduates, advancing through to senior positions.
Overall Rating (A, B+, B or C)
A
The Global Alpha product takes a holistic approach to portfolio construction, putting analysts’ research into a global context and constructing portfolios on a genuinely global basis. We have confidence in the team of three senior investors who focus solely on this strategy. Their different perspectives on the world and their willingness to use all the tools at their disposal, including high quality regional and sector research, leads us to believe they will outperform their benchmark, on a risk-adjusted basis, over a full cycle. Overall we believe this is a sensible way of accessing Baillie Gifford's research in a truly global context.

RESEARCH NOTE Page 6
Additional Observations
The bias towards growth and some quality factors may make it more difficult for this strategy to outperform during periods when these market characteristics are out of favour.
The fund can have a high exposure to Emerging Markets.
This fund is not suitable for customised benchmarks.

RESEARCH NOTE Page 7
Mercer Evaluation Summary
International Equity - Global Equity - Growth - Long Term Global Growth (+3%) International Equity - World ex US/EAFE Equity - Growth - Long Term Global Growth ex NA (+3%) Factor Rating
(-, =, + or ++) Comments
Idea Generation ++ This is an experienced group of portfolio managers led by James Anderson, whom we rate highly. Whilst the high quality of the stock research carried out by the Baillie Gifford regional and global sector teams provides this team with a strong starting point from which to work, what makes this strategy stand out is the extra layer of research the team carries out to identify those companies that they consider to have the best long-term growth prospects globally allied to their ability to take a longer term view. They focus their additional research into ten questions, which help them identify long-term global winners.
Portfolio Construction
+ Portfolios are constructed from the team's best ideas on a purely bottom-up basis; risk controls are relatively loose. There are no formal constraints, but in practice a common sense fundamental overview is taken to ensure that the portfolios remain reasonably well diversified. Portfolios are concentrated and risk can be focused in relatively few names.
Implementation + Baillie Gifford employ a team of dealers, all based in Edinburgh and with extensive experience of dealing across the globe. They have been leaders in unbundling of commission and rigorously assess their brokers on a regular basis. The LTGG strategy has been closed to new assets at a sensible asset level such that capacity is not an issue.
Business Management
++ The partnership structure has almost certainly contributed to the stability across the firm. We do not anticipate any corporate activity with this firm. Baillie Gifford has consistently demonstrated the ability to attract and retain quality staff. By growing steadily over the years, it has been able to give opportunities to up and coming staff members. Many join as graduates, advancing through to senior positions.
Overall Rating (A, B+, B or C)
A (T)
The general high quality of stock research carried out by the Baillie Gifford regional and global sector teams provides this team with a strong starting point from which to work. The talent and experience of the team leader, James Anderson, is another positive factor. What makes this strategy stand out is the extra layer of research that his team carries out to identify those companies that they consider to have the best long-term growth prospects globally. Baillie Gifford continues to be an organisation that is structured in a partnership and has been a very stable investment team. The partnership enables them to take long-term decisions and not be drawn into short-term fads. The competitive advantage of this team is their ability to think differently about investment ideas and to take a genuinely long-term perspective.

RESEARCH NOTE Page 8
Additional Observations
This strategy is currently closed to new enquiries.
This strategy is managed with a very long term (5 years plus) perspective, with very little regard to the composition of the world index, and investors would need to be willing to tolerate the potential for significant underperformance relative to the world index over shorter periods. The bias towards growth and quality stocks may make it more difficult for this strategy to outperform during periods when these market characteristics are out of favour.
The portfolio can have a relatively high exposure to emerging markets. The departure of James Anderson would lead us to review the rating of this strategy.
This fund is not suitable for customised benchmarks.

RESEARCH NOTE Page 9
Mercer Evaluation Summary
International Equity - World ex US/EAFE Equity - Growth - ACWI ex US Alpha (+2-3%) Factor Rating
(-, =, + or ++) Comments
Idea Generation ++ The ACWI ex-US Alpha strategy relies on the generation of ideas from the regional and global sector research analysts, whom we regard highly and who are generally long-term veterans of Baillie Gifford. The Portfolio Construction Group (PCG) takes the best of the ideas from these teams and places them in a holistic international context; in this case under the leadership of Gerald Smith, an experienced emerging markets manager. Smith thinks laterally about ideas and provides strong challenge to the rest of the PCG which consists of experienced regional investors and two dedicated research specialists.
Portfolio Construction
+ This team works as one in order to identify ideas and implements them with joint responsibility. The portfolios are driven by stock selection and whilst they have access to - and consider - risk models, there are relatively broad sector, stock and regional controls. Positions are well calibrated across the portfolio.
Implementation + Baillie Gifford employ a team of dealers, all based in Edinburgh and with extensive experience of dealing across the globe. They have been leaders in unbundling of commission and rigorously assess their brokers on a regular basis. Turnover is typically low. The strategy has been closed to new assets at a sensible asset level such that capacity is not an issue.
Business Management
++ The partnership structure has almost certainly contributed to the stability across the firm. We do not anticipate any corporate activity with this firm. Baillie Gifford has consistently demonstrated the ability to attract and retain quality staff. By growing steadily over the years, it has been able to give opportunities to up and coming staff members. Many join as graduates, advancing through to senior positions.
Overall Rating (A, B+, B or C)
A
The Alpha range of funds takes a more holistic approach to portfolio construction, putting the regional and sector research into an international context and constructing portfolios on a genuinely globally basis. The strength of this product lies in the regional and sector research analysts and the leadership of Smith, who brings extensive experience and constructive challenge to the investment ideas of the team.
Additional Observations
This strategy is closed to new clients.
Relative to the MSCI ACWI-ex US index, we do not believe this is a higher tracking error strategy. However, clients assessing the strategy against the MSCI EAFE index should note that the structure of the portfolio can diverge from that of this index, and that tracking error relative to EAFE could be high.
The bias towards growth and quality stocks may make it more difficult for this strategy to outperform during periods when these market characteristics are out of favour.
This strategy is not suitable for customised benchmarks.
The departure of Gerald Smith would lead us to review the rating of this strategy.
Smith has a number of additional responsibilities including managing the Global Opportunities strategy.

RESEARCH NOTE Page 10
Mercer Evaluation Summary
International Equity - World ex US/EAFE Equity - Growth - EAFE Plus Alpha (+2-3%) International Equity - World ex US/EAFE Equity - Growth - EAFE Pure Alpha (+2-3%) Factor Rating
(-, =, + or ++) Comments
Idea Generation ++ The EAFE Alpha strategy relies on the generation of ideas from the regional and global sector research analysts, whom we regard highly and who are all long term veterans of Baillie Gifford. The Portfolio Construction Group (PCG) takes the best of the ideas from these teams and places them in a holistic international context, in this case under the leadership of James Anderson who provides effective leadership and extensive global experience. Anderson has clear views about long-term investing and is relatively benchmark unaware in his thinking; whilst this product is a benchmark aware product we believe he provides a different perspective when assessing stocks and whether they should be candidates for the EAFE Alpha portfolio.
Portfolio Construction
+ This team works as one in order to identify ideas and implements them with joint responsibility. The portfolios are driven by stock selection and whilst they have access to - and consider - risk models, there are relatively broad sector, stock and regional controls. Positions are well calibrated across the portfolio.
Implementation + Baillie Gifford employ a team of dealers, all based in Edinburgh and with extensive experience of dealing across the globe. They have been leaders in unbundling of commission and rigorously assess their brokers on a regular basis. Turnover is typically low. The strategy has been closed to new assets at a sensible asset level such that capacity is not an issue.
Business Management
++ The partnership structure has almost certainly contributed to the stability across the firm. We do not anticipate any corporate activity with this firm. Baillie Gifford has consistently demonstrated the ability to attract and retain quality staff. By growing steadily over the years, it has been able to give opportunities to up and coming staff members. Many join as graduates, advancing through to senior positions.
Overall Rating (A, B+, B or C)
A
The Alpha range of funds takes a more holistic approach to portfolio construction, putting the regional and sector research into an international context and constructing portfolios on a genuinely bottom-up basis. The strength of this product is the regional and sector research analysts and the leadership of Anderson, who brings extensive experience and insightful investment ideas to the team.
Additional Observations
This strategy is currently closed to new clients.
The bias towards growth and quality stocks may make it more difficult for this strategy to outperform during periods when these market characteristics are out of favour. The fund tends to have a bias towards large cap stocks.
This strategy is not suitable for customised benchmarks.
The departure of James Anderson would lead us to review the rating of this strategy.

RESEARCH NOTE Page 11
Mercer Evaluation Summary
Emerging Markets - Emerging Markets Equity - Emerging Markets All Cap Emerging Markets - Emerging Markets Equity - Emerging Markets Leading Companies Factor Rating
(-, =, + or ++) Comments
Idea Generation + This is a medium-sized, highly stable, team led by Richard Sneller. The approach combines rigorous bottom-up research with a macro-economic overlay, though company analysis remains the focus. In common with other Baillie Gifford products, the GEM product focuses on stocks that can sustain an above-average growth rate and trade at a reasonable price; however the focus on quality/growth companies is less evident in Sneller than the previous head of the team, Gerald Smith. Equally we note a slightly shorter-term focus with Sneller. However the team remains experienced and well resourced, travel extensively, have access to Baillie Gifford's other investment resources and rotate the country coverage to ensure they avoid 'group-think'.
Portfolio Construction
+ Portfolios are constructed by the lead portfolio managers from the team's best ideas. There are broad guidelines on company/industry/country weights and the overview of the Emerging Markets Investment Advisory Group ensures that the portfolios remain well diversified.
Implementation + The firm employs a team of full-time traders and has two dealing assistants. Both the All Cap and Leading Companies GEM products are currently closed to new business and the closures were made at quite a conservative level of assets under management.
Business Management
++ The partnership structure has almost certainly contributed to the stability across the firm. We do not anticipate any corporate activity with this firm. Baillie Gifford has consistently demonstrated the ability to attract and retain quality staff. By growing steadily over the years, it has been able to give opportunities to up and coming staff members. Many join as graduates, advancing through to senior positions.
Overall Rating (A, B+, B or C)
B+
There are several very experienced investors on this team, which has been stable for many years. The team are conscious of the need to avoid group-think and we believe they take steps to avoid this. The approach is reasonably straightforward and relies on rigorous bottom-up research and the resources to visit companies regularly. Overall this is a sensible product that would be of interest to those seeking a growth-orientated emerging markets approach (noting that the strategy is currently closed to new business enquiries). Our views remain broadly positive, but Sneller appears to focus less on Baillie Gifford's core competencies (long term perspective; quality / growth companies) than we might expect.
Additional Observations
Product will exhibit a growth style relative to benchmark.
Both the Global Emerging Markets All Cap and Emerging Markets Leading Companies strategies are closed to new accounts.

RESEARCH NOTE Page 12
Key product details
International Equity - Global Equity - Core - Global Opportunities
International Equity - Global Equity - Growth - Global Alpha (+2-3%)
International Equity - Global Equity - Growth - Long Term Global Growth (+3%)
Inception Year 2011 2005 2003
Assets under management in strategy
$133 million as at 30 September 2012
$13.6 billion as at 30 September 2012
$21.9 billion as at 30 September 2012
Estimated capacity $5 billion £12bn Not stated / closed
Open/Closed Open for Pooled Fund (call for availability for separate accounts)
Open to All Investors Closed
Most suitable benchmark index for strategy
MSCI ACWI MSCI AC World MSCI AC World
Outperformance target (% per annum) - Manager's estimate
3% 2%–3% 3% over rolling 5 years
Expected tracking error range (%) - Manager's estimate
N/A 1 Not targeted by the manager, but Mercer estimate is 3%-7%
N/A 1
1 The strategy does not have a tracking error target and is not managed to tracking error limits. We would expect, however, the strategy to have a relatively high tracking error relative to MSCI ACWI.
International Equity - World ex US/EAFE Equity - Growth - ACWI ex US Alpha (+2-3%)
International Equity - World ex US/EAFE Equity - Growth - EAFE Plus Alpha (+2-3%)
International Equity - World ex US/EAFE Equity - Growth - EAFE Pure Alpha (+2-3%)
Inception Year 2002 2003 2006
Assets under management in strategy
$13.4 billion as at 30 September 2012
$23.0 billion as at 30 September 2012
$1.6 billion as at 30 September 2012
Estimated capacity Not stated / closed Not stated / closed Not stated / closed
Open/Closed Closed Closed Closed
Most suitable benchmark index for strategy
MSCI ACWI ex US MSCI ACWI ex US MSCI EAFE
Outperformance target (% per annum) - Manager's estimate
2%-3% 2%-3% 2%-3%
Expected tracking error range (%) - Manager's estimate
3%-7% 3%-7% 3%-7%

RESEARCH NOTE Page 13
Emerging Markets - Emerging Markets Equity - Emerging Markets All Cap
Emerging Markets - Emerging Markets Equity - Emerging Markets Leading Companies
Inception Year 1994 2004
Assets under management in strategy
$7.2 billion as at 30 September 2012
$6.0 billion as at 30 September 2012
Estimated capacity Not stated / closed Not stated / closed
Open/Closed Closed Closed
Most suitable benchmark index for strategy
MSCI Emerging Markets
MSCI Emerging Markets
Outperformance target (% per annum) - Manager's estimate
2%-3% 3%
Expected tracking error range (%) - Manager's estimate
4%-10% 4%-10%
Issues to watch
• How many different global and international equity strategies can Baillie Gifford support?
• Who are the next generation of investment leaders at the firm?
• Across the firm, Baillie Gifford has large positions in some stocks, e.g. Baidu (in excess of 10%) and Tencent.
• To what extent will the culture of co-operation be tested if the firm’s overall growth/quality style falls out of favour?
• The investment process for the Focus range of strategies now has much in common with the Alpha range. What is the rationale for maintaining separate strategies?
• Will the firm begin to market the Global Discovery team products? Will this dilute the team’s intellectual capital?
Highlights We spent a full day at Baillie Gifford, reviewing a broad range of the firm’s global and international equity strategies. We found this a useful exercise in cross-checking the flow of ideas within the firm, enabling us to get a better understanding of the firm’s intellectual capital “DNA”. We found a firm with a strong culture, with a strong sense of shared DNA and with incentives which encourage co-operation between teams. We also found that sharing DNA does not necessarily lead to identical portfolios – the international equity strategies can, and do, have their differences. Whilst recognisably from the same “family”, portfolios are typically cousins rather than siblings. (The Holdings Analysis and Further Details sections of this note provide more details which compare and contrast portfolios.)

RESEARCH NOTE Page 14
Portfolios typically have a number of features in common: a tilt towards growth factors and away from value; a positive tilt to quality factors; an overweight position in cyclical sectors at the expense of defensive sectors; a beta usually higher than that of the market; a relatively high allocation to emerging market securities relative to benchmark, and a performance pattern which is typically better in rising markets than falling markets. The differences between portfolios are evident in the strength of each of these signals, the degree of concentration of portfolios, and individual stock positions. The latter can be quite noticeable. An analysis of the unique stocks in each of the main strategies is made in Further Details, and we find these typically account for between 25% and over 50% of each strategy. The common DNA between teams results in a correlation between the relative performance of different strategies. The following table shows performance relative to benchmark of the key strategies reviewed in this note. (See Performance Section for details of track records).
2005 2006 2007 2008 2009 2010 2011 2012*Global Opps - - - - - - - -3.4Global Alpha - -1.8 -0.6 -2.3 11.1 5.1 0.8 1.1LTGG 13.1 -3.8 5.9 -6.4 18.4 4.4 -1.5 5.4ACWI Alpha 7.8 0.4 12.1 -0.4 7.1 4.4 3.1 4.7EAFE+ Alpha 3.7 2.2 4.9 -0.4 5.5 6.2 2.8 0.3EM All Cap 7.3 5.5 6.1 -2.7 17.5 -0.4 -0.7 -0.5* 2012 is year to end Q3. Source: MSCI and Baillie Gifford as reported to GIMD.
The table highlights the relative strength of recent performance across the firm, principally due to the quality style aspects of the firm’s DNA. This does represent a concentration risk to the firm, as there will surely come a time when the firm’s quality/growth style acts as a headwind rather than a tailwind to performance. We think there is a good balance between shared philosophy and the latitude that each team has to construct portfolios. We observed at several points during the day how teams shared (and acted on) stock ideas. Encouragingly, we think this is because teams want to share ideas, and the motivations for this are (a) the realisation that the teams can get good ideas from each other, and (b) the partnership structure and team-oriented compensation structures. 50% of bonus is dependent on teamwork and contribution to the broader team, which also helps foster co-operation, as does the fact that individual strategy teams do not have their own P&L. In short, the teams co-operate because they want to, and not because they are forced to. It is in this context that we note Gerald Smith’s decision to relinquish the title of Chief Investment Officer (see News Item on GIMD dated 13 September 2012), and we have no real concerns over this change. The shared DNA owes more to culture than it does to any individual, whilst the role of CIO (perhaps even in titular form) would risk impeding the autonomy each team has to do its own work and stock selection. We are relaxed that he has taken the decision to no longer have a CIO role. Baillie Gifford continues to recruit primarily at graduate level, which has a lot to do with the firm’s culture. Some hires from other firms are made, but these tend to be the exception. Graduate recruitment means new staff absorb the culture at outset, learn the Baillie Gifford way of doing things, and begin to establish personal relationships across the firm. In some way, it is like raising children. The firm seeks to train them well, but also recognises that at some point they have to trust them and allow them to go off independently and manage portfolios in the Baillie Gifford way. The firm is making more of an effort, however, to achieve

RESEARCH NOTE Page 15
greater cognitive diversity within its graduate intake. A perusal of the staff list will show many senior professionals educated at Oxford, Cambridge, or St Andrew’s, whereas younger professionals have often come from further afield. We do notice, however, an increase in the number of dedicated researchers allocated to some teams, and (anecdotally) an increase in ideas generated within each team. The medium/longer term challenge for the firm will be to prevent this becoming a drift in style and philosophies between teams, but we do not see this as an immediate threat. We also note that having multiple sources of research could cause some confusion for companies in which they invest, as different Baillie Gifford professionals research the same stock. The firm is aware of the latter risk, and we have no immediate concerns over the issue. Another potential challenge will be in achieving this co-operation between teams when performance deteriorates, as it inevitably will when growth/quality is out of favour. The risk is that it will create internal tensions between teams. What are currently healthy rivalries (noticeably between LTGG and Global Alpha) could become less healthy. We do not see this at present, but that is the risk. Highlights on the individual strategies reviewed in this note are given in the evaluation summaries above and the Further Details section. In the second of our two meetings, we met with Andrew Telfer, CEO. We find Telfer to be a man who thinks about issues and questions very carefully, and a discussion of this is made in Further Details. We remain comfortable with the firm’s partnership structure and business strategy.

RESEARCH NOTE Page 16
Firm background and history Baillie Gifford & Co is an independent investment management firm based in Edinburgh, 100% owned and managed by the partners in the business. Baillie Gifford was formed in 1908 and began managing money in 1909 when it launched an investment trust, which it still manages today (Scottish Mortgage Investment Trust). The firm has been managing pension fund assets since 1948, however they began to concentrate on this market in the late 1970s and pension funds now account for a significant proportion of the business. The firm has also successfully gained business from overseas, such that international clients now account for more than half of assets under management. The partnership culture has been important in recruiting and retaining investors, and they remain committed to this structure. Profile: International Equity - Global Equity - Core - Global Opportunities
Key decision makers Gerald Smith and Michael MacPhee have overall responsibility for the strategy. Smith joined Baillie Gifford in 1987 and was appointed CIO in 2011 (a title which was dropped by the firm in September 2012), having previously been Deputy CIO and, until 2008, Head of Emerging Markets. MacPhee joined Baillie Gifford in 1987 and was Head of the European equity team (2003-2008). They are directly supported by two analysts: Benedikt Wagner, who has worked on the emerging markets and US teams as part of his rotation, and Andrew Hunt who has worked in the Global Discovery team as part of his rotation. The team is supported for idea generation by the regional equity and global sector teams. Smith remains responsible for the Portfolio Construction Group (PCG) for ACWI ex US Alpha mandates. Product history Smith and MacPhee began to development the strategy in 2008. It was one of a very few number of new products supported for development by Baillie Gifford – Smith and MacPhee gave up their respective research responsibilities to focus on the development and launch of this product. The strategy was launched in February 2011, however it follows a very similar approach to the Monks Investment Trust also managed by Smith, and Mid Wynd Investment Trust managed by MacPhee (the latter has a smaller cap bias than Monks given its lower asset base). The key difference for Global Opportunities is the lack of any leverage that is used in the investment trusts (this should be taken into account when assessing the track records of the investment trusts). Investment style/philosophy This is a bottom-up, research driven strategy, managed with an absolute return mindset and the ability to invest up to 20% in non-equity assets. The process is typically seeking high growth opportunities. They seek to exploit a number of market anomalies - short-termism, misunderstanding of risk, investment myopia and benchmark fixation. Ultimately the aim is to take advantage of the asymmetric returns which these anomalies create. Investment process The team leverages research done by the regional and global sector teams as well as developing their own ideas from contacts they have and their past experience. The process

RESEARCH NOTE Page 17
is clear as to which market anomalies it is seeking to exploit and is designed to enable them to do that. Those anomalies are: - Short-termism - they believe the market is preoccupied with short-term themes and
trends presenting them with frequent and significant investment opportunities. - Misunderstanding of risk - investments are often considered risky if they are volatile or
have fallen significantly. This provides them with investment opportunities because they see the only real risk as the risk of a permanent loss of asset value.
- Desire for smoothed returns - investors prefer companies with smooth earnings progressions resulting in plenty of attractive investment opportunities elsewhere.
- Benchmark fixation - the regard for benchmarks provides compelling investment opportunities.
- Investment myopia - the trend towards specialisation and narrower areas of responsibilities leave opportunities for those who have an ability to see the wider picture.
- Unrecognised growth potential - the tendency to extrapolate trends from the recent past into the future leads to growth potential going unrecognised, particularly during economic or cyclical downturns. Growth potential resulting from corporate action or restructuring benefits may also go unrecognised.
The process starts with as broad a universe as possible and the team monitors ideas which arise from the regional and sector teams. They then apply their own analysis in order to understand the reason for the mispricing, in a global context, and then may undertake some additional analysis or work with the research team. There is an emphasis on the long-term investment case, the team see this as one of the inefficiencies they are exploiting, and they are not concerned with short-term performance. The ideas for the non-equity investments are most likely to come from others areas of Baillie Gifford. They will lever off ideas from a range of teams such as the fixed income team, currency team, small cap team (Global Discovery team) and diversified growth team, as well as the large regional and emerging market equity teams; the latter largely for listed equity ideas. They will not short stocks, but will use derivatives. Although this fund invests across different asset classes, it is driven by bottom-up opportunities rather than top-down macro calls. The aim of the strategy is to provide a good total return; targeting a total return greater than MSCI ACWI by 3% per annum or more, measured on a five-year rolling basis. The strategy is broadly diversified in order to reduce the likelihood of large losses and to reduce the overall level of volatility. Portfolios are constructed with no reference to the benchmark; typically with between 100 and 150 positions. However there will be at least 80% in listed equities; up to 20% can be outside the listed equity universe. The only other guidelines are a minimum of 40 "effective positions", i.e. the number of positions which would give the same level of diversification if the portfolio were an equally weighted one, a minimum of 7 effective sectors and 4 effective countries. Turnover is expected to be relatively low at between 25 and 50% per annum.

RESEARCH NOTE Page 18
Profile: International Equity - Global Equity - Growth - Global Alpha (+2-3%)
Key decision makers Charles Plowden, Joint Senior Partner, heads a team of three who take joint decisions for the Global Alpha Strategy. They are dedicated to this strategy, with no portfolio other management duties. Spencer Adair and Malcolm MacColl make up the remainder of the team. Plowden joined Baillie Gifford in 1983 and was previously the head of the UK equity team. He also gained experience in the North American, Emerging Market and European equity teams. Adair joined in 2000 and has previously worked in the Japanese, UK and European equity teams as well as the fixed income team. MacColl, a partner, joined in 1999 and previously worked on the UK small cap and North American equity teams. The team is supported for idea generation by the regional equity and global sector teams. The also team has the direct support of two dedicated analysts, Helen Xiong and Felix Amoako Product history This strategy has been managed by Plowden, MacColl and Adair since inception in 2005 but all three moved to focusing solely on this strategy in 2008. Investment style/philosophy The investment approach is bottom-up based upon long-term fundamental research, with a focus on identifying well-managed, quality, under-appreciated growth stocks that have sustainable competitive advantages. A core belief is that share prices ultimately follow earnings and free cash flow. Attention is paid to the broader macro economic view identifying potential growth areas. Investment process The Global Alpha investment process starts with the work of the regional investment teams and global research specialists, who collectively follow around 3,000 companies. This stage of the process focuses on the qualitative assessment of companies. Fundamental analysis has a strong growth flavour with an emphasis on quality companies with above average growth prospects operating in niche or non-cyclical markets or industries. Emphasis is also placed on an assessment of the strengths of company management. To this end, company visits and meeting the management are considered an important source of information. Once the regional teams have identified ideas, these are promoted to the Global Alpha team by way of the Portfolio Review Group (PRG). The PRG consists of the three Global Alpha managers, regional research representatives, a global sector research representative and two client service directors. At the PRG meetings, the regional representatives rank the stocks that are currently in the portfolio and those that they think warrant inclusion. Stocks are categorised in one of four 'growth buckets': growth stalwarts, rapid growth, cyclical growth and latent growth. Ideas are debated in a global context, but where more work needs to be done the investment managers can either take this forward themselves, ask the regional representative to undertake the work, or refer it to the global sector research specialists.

RESEARCH NOTE Page 19
The three managers have ultimate responsible for portfolio construction and performance. After considering debate within the PRG, these three consider three questions of each potential holding when constructing the portfolio: 1. How does the business compare globally? - designed to test the long-term durable
competitive advantages of the stock. 2. Where do they differ from the market? - designed to establish whether the attractions of
the stock are not reflected by the broader market. 3. What does the stock bring to the portfolio? - designed to seek out whether the stock is
bringing a new theme to the portfolio or whether it is replicating an investment already held.
All three investment managers have an equal say in investment decisions. If one strongly disagrees with the other two, they will undertake further work in order to achieve broader agreement before any final decision is taken. Careful consideration is given to position sizes. There are three broad groups of holding size: 0.5%, 1.0% and 1.5%+. Only the highest conviction stocks are normally holdings above 1.5% of the portfolio. Companies in which there is a greater degree of risk or uncertainty are typically 1.0% or less. Portfolios are concentrated with between 70 and 120 stocks. There are upper limits relative to the benchmark for stocks of +6%, Sectors +10% and regions +20% (there are no minimum weights). Currency is not hedged. Sell decisions are a result of a frequent reassessment of the holdings. There are four situations that can result in a sell decision; an adverse change in business fundamentals, a loss of confidence in management, valuation, and a portfolio asset allocation decision.

RESEARCH NOTE Page 20
Profile: International Equity - Global Equity - Growth - Long Term Global Growth (+3%)
Profile: International Equity - World ex US/EAFE Equity - Growth - Long Term Global Growth ex NA (+3%) Key decision makers The LTGG strategy team of 7 comprises 4 portfolio managers responsible for portfolio decisions and 3 supporting analysts. The team is headed by James Anderson who joined the firm in 1983. Anderson has wide-ranging experience within the firm, and was CIO between 2006 and 2011. He is also manages the Scottish Mortgage Investment Trust and supports a number of international equity strategies. On the LTGG team, he works alongside fellow portfolio managers Mark Urquhart (joined in 1996), Tom Slater (joined 2000) and Julien Reynolds (joined 2007). Anderson, Urquhart and Slater have spent their entire careers at Baillie Gifford. They are supported by three dedicated analysts, Marina Ofrikhter, Jenny Davis and Wanyi Yao (who is based in China). The team is further supported for idea generation by the regional equity and global sector teams. Product history The strategy has been managed by Anderson and team since inception in 2003. Investment style/philosophy The team believes that the shares of companies with sustainable competitive advantages that grow their earnings faster than the market will outperform the market over the long term - provided the shares are purchased at a reasonable price. Portfolios are concentrated and are constructed on a bottom-up basis with no constraints other than some broad diversification rules. Investment process This team leverages research done by the regional and global sector teams; testing their ideas but also undertaking their own layer of additional research. The team will also generate their own investment ideas. The emphasis is on the long-term investment case, and the team are not concerned with short-term performance. The approach to picking stocks is to find those expected to have sustainable future earnings and cash flow growth above that of the market average; the team must be able to understand and articulate why the market has misinterpreted the company's growth prospects. If they cannot outline the reason for the market mispricing, then they will not buy the stock. The team's investment approach is based around their own ten questions, eight of which are related to industry and company fundamentals and two of which are related to stock price valuation: 1. Is there sufficient market potential to allow sizeable increase in sales for the next 5
years? 2. What happens then? 3. What is your long-term competitive advantage? 4. Are your people consistently better than their people, if so, why and at what? 5. Why do your customers like you and why will they continue to do so?

RESEARCH NOTE Page 21
6. Are your margins worthwhile? 7. Will they rise or fall? 8. How do you allocate capital? (capex, dividend and exit strategies) 9. Is the stock attractively valued? 10. Why doesn't the market understand this? Portfolios typically consist of 30 to 60 stocks, with stock weightings ranging from 1.5% to 10%. Portfolios will tend to have a growth, quality and small to mid-cap size bias. The portfolios are monitored on a fundamental basis to make sure that there is a reasonable level of diversification by country, sector and theme, and the portfolio will be invested in at least 6 countries and 6 sectors. Turnover is expected to average out at less than 25% per annum. There is no currency hedging.

RESEARCH NOTE Page 22
Profile: International Equity - World ex US/EAFE Equity - Growth - ACWI ex US Alpha (+2-3%)
Key decision makers Gerald Smith is the Chair of the Portfolio Construction Group (PCG) of 6 people for ACWI ex-US Alpha mandates. Smith joined Baillie Gifford in 1987 and was appointed CIO in 2011 (a title which was dropped by the firm in September 2012), having previously been Deputy CIO and, until 2008, Head of Emerging Markets. The PCG also comprises 3 regional equity managers and 2 dedicated international research specialists. The PCG collectively shares responsibility for decision-making and is further supported for idea generation by the regional and global sector research teams. The Deputy Chair of the PCG, who assists in much of the day-to-day management, is Angus Franklin. Investment style/philosophy The investment approach is bottom-up, based on fundamental research, with a focus on identifying quality, growth stocks that have an identifiable competitive advantage. Attention is paid to the broader macro economic view identifying potential growth areas. Investment process Portfolios are constructed on a bottom-up basis using input from the specialist regional and global sector teams; taking their best ideas and placing them in an international context. Stock ideas are debated at the PCG weekly meeting; the overall portfolio is reviewed at the more formal monthly meeting, where the views of the Investment Advisory Committee (IAC) are also taken into account. The IAC, which takes recommendations from the regional teams, global sector teams and portfolio managers, considers valuation levels, economic outlook and currency prospects and provides a framework for where the most interesting investment themes are likely to be found going forward. The PCG looks to ensure that all good ideas are fully implemented, insights shared and any issues addressed. It has responsibility for the overall portfolio, ensuring it has no unintended risks and that the regional portfolio managers are challenged on their stocks in an international context. The PCG collectively shares responsibility for decision-making. There is no lead portfolio manager, and there is no formal voting mechanism by which stocks are selected for the portfolio. Rather, if a member of the PCG is still convinced of the case for a stock after vigorous debate, then that stock will be selected for the portfolio. The purpose of the PCG is to ensure that all the managers involved in this strategy are aware of the issues affecting the overall portfolio and that the discussion of stocks is made in an international context, rather than simply a regional one. Stock selection has a strong growth flavour and an emphasis on quality companies with above average growth prospects operating in niche or non-cyclical markets or industries. Opportunities are identified through in-house research with individuals on the PCG having responsibilities in a regional team or a global sector team. Emphasis is placed on an assessment of the strengths of company management; to this end, company visits and meeting the management are considered to be key. Portfolios hold between 70 and 110 stocks. There are limits relative to the benchmark for stocks of +/- 6%, industries +/- 7.5%, and countries +/- 9%. Emerging market exposure is not formally constrained, but limited by any client guidelines. Currency is rarely hedged, and on a defensive basis only.

RESEARCH NOTE Page 23
Profile: International Equity - World ex US/EAFE Equity - Growth - EAFE Plus Alpha (+2-3%)
Profile: International Equity - World ex US/EAFE Equity - Growth - EAFE Pure Alpha (+2-3%) Key decision makers James Anderson is the Chair of the Portfolio Construction Group (PCG) of 8 people for EAFE Alpha mandates. Anderson joined the firm in 1983, and has wide-ranging experience within the firm. He was CIO between 2006 and 2011, and also manages the Long Term Global Growth strategy and the Scottish Mortgage Investment Trust. The PCG also comprises 2 regional equity managers, 2 members of the institutional clients department and three dedicated international research specialists. The PCG collectively shares responsibility for decision-making and is further supported for idea generation by the regional and global sector research teams. The Deputy Chair of the PCG, who assists in much of the day-to-day management, is Nick Thomas. Investment style/philosophy The investment approach is bottom-up, based on fundamental research, with a focus on identifying quality, growth stocks that have an identifiable competitive advantage. Attention is paid to the broader macro economic view identifying potential growth areas. Investment process Portfolios are constructed on a bottom-up basis using input from the specialist regional and global sector teams; taking their best ideas and placing them in an international context. Stock ideas are debated at the PCG weekly meeting; the overall portfolio is reviewed at the more formal monthly meeting, where the views of the Investment Advisory Committee (IAC) are also taken into account. The IAC, which takes recommendations from the regional teams, global sector teams and portfolio managers, considers valuation levels, economic outlook and currency prospects and provides a framework for where the most interesting investment themes are likely to be found going forward. The PCG looks to ensure that all good ideas are fully implemented, insights shared and any issues addressed. It has responsibility for the overall portfolio, ensuring it has no unintended risks and that the regional portfolio managers are challenged on their stocks in an international context. The PCG collectively shares responsibility for decision-making. There is no lead portfolio manager, and there is no formal voting mechanism by which stocks are selected for the portfolio. Rather, if a member of the PCG is still convinced of the case for a stock after vigorous debate, then that stock will be selected for the portfolio. The purpose of the PCG is to ensure that all the managers involved in this strategy are aware of the issues affecting the overall portfolio and that the discussion of stocks is made in an international context, rather than simply a regional one. Stock selection has a strong growth flavour and an emphasis on quality companies with above average growth prospects operating in niche or non-cyclical markets or industries. Opportunities are identified through in-house research with individuals on the PCG having responsibilities in a regional team or a global sector team. Emphasis is placed on an assessment of the strengths of company management; to this end, company visits and meeting the management are considered to be key.

RESEARCH NOTE Page 24
Portfolios hold between 70 and 85 stocks. There are limits relative to the benchmark for stocks of +/- 6%, sectors +/- 9% and countries +/- 9% (sector and country limits are also subject to absolute ranges). Currency is rarely hedged, and on a defensive basis only. Exposure to emerging markets for the EAFE Plus Alpha strategy is limited by client guidelines, and is typically 20%. For the EAFE Pure Alpha strategy there is no exposure to emerging markets.

RESEARCH NOTE Page 25
Profile: Emerging Markets - Emerging Markets Equity - Emerging Markets All Cap
Profile: Emerging Markets - Emerging Markets Equity - Emerging Markets Leading Companies Key decision makers The Emerging Markets team of 10 is led by Richard Sneller. Emerging market portfolios are co-managed by Sneller and Will Sutcliffe. Both Sneller and Sutcliffe are partners at Baillie Gifford, having joined the firm and industry in 1994 and 1999 respectively. The team consists of an additional eight emerging market investment professionals who have a rotating regional research focus. Product history Baillie Gifford has been running the core Global Emerging Markets All Cap strategy since 1994. Growth in assets led to the All Cap strategy being closed, and so in 2004 the Emerging Markets Leading Companies strategy was launched. This follows the same approach but with higher market cap and more stringent liquidity criteria. This strategy was also closed to new accounts in 2010. Investment style/philosophy The emerging markets team believes that it can add value by long-term investment in well-managed quality businesses that have superior profit growth and enjoy sustainable, competitive advantages in their marketplace. Country allocation is driven predominantly by decisions on individual stocks, though a top-down view feeds into the stock decisions. Investment process The team conducts detailed research on a bottom-up and top-down basis. All Cap: The investable universe is all stocks that meet the liquidity criteria of being tradable to cash within 8 days. Leading Companies: The investable universe is all stocks have at least $1bn free float and/or $5m daily turnover. Baillie Gifford focuses on five key areas - industry background, competitive advantage, financial strength, management attitudes and valuation. Stock research includes detailed analysis of financial statements focusing on earnings growth, cash flow growth, profitability (return on equity and capital), debt and interest cover and valuation based on multiples. Macroeconomic analysis includes changes in economic growth rate, inflation, monetary policy, international competitiveness of industry, savings rate, Government debt levels and current account position. All holdings are reviewed quarterly and in-depth analysis is conducted following profit statements, large price movements and other significant events. Emphasis is placed not only on the "number-crunching", but on an assessment of the strengths of company management. To this end, company visits are an important part of the process. Whilst stock research and selection is the responsibility of the team and the relevant lead portfolio manager, an Emerging Markets Investment Advisory Group (EMIAG) meets quarterly to review broader regional themes and to review all the portfolios for consistency.

RESEARCH NOTE Page 26
Each portfolio is allocated to an individual manager, who is responsible for all buy and sell decisions. When an attractive company is identified the investment thesis must be made to the team at the Wednesday afternoon meeting, the team will challenge the recommendation before a final buy or sell rating is agreed. Only when the decision has been agreed can the portfolio managers implement the idea in the most appropriate way for their portfolios. A meeting between all investment teams is held on a Friday, where other teams are formally advised of new ideas that may be suitable for their portfolios and are given the opportunity to purchase. Stocks will be sold if they become overvalued, there is an adverse change in fundamentals, confidence in management declines or for risk control reasons. Turnover is expected to be approximately 40-80%. The team work to a 2-3 year time horizon. All Cap: There are broad guidelines on company/industry/country weightings. Countries/industries should not exceed 10%, or twice the benchmark weight, whichever is greater, subject to a cap of 20% of the portfolio. Companies should not exceed 5%, or twice the benchmark weight, whichever is greater, subject to a cap of 10% of the portfolio. The aim is that the portfolio is invested in a minimum of 15 countries/industries and a minimum of 75 companies. Tracking error will usually range between 4% and 10%. Portfolios typically contain 100-120 stocks and are expected to display a growth style. Currency hedging is not incorporated into the process. Leading Companies: There are broad guidelines on company/industry/country weightings. Industries/country weights should be within a maximum of 20% relative to the index at the time of purchase, stocks should be within 5%. Tracking error will usually range between 4% and 10%. Portfolios contain 40-80 stocks and are expected to display a growth style. Currency hedging is not incorporated into the process.
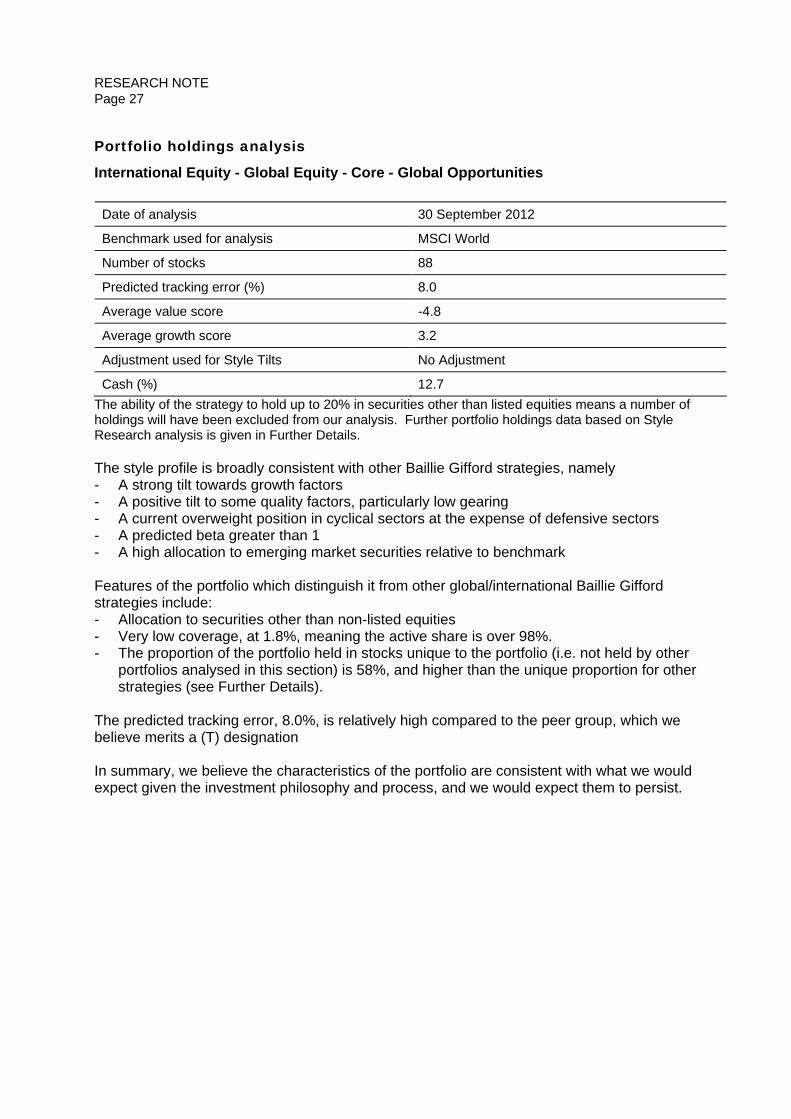
RESEARCH NOTE Page 27
Portfolio holdings analysis
International Equity - Global Equity - Core - Global Opportunities
Date of analysis 30 September 2012
Benchmark used for analysis MSCI World
Number of stocks 88
Predicted tracking error (%) 8.0
Average value score -4.8
Average growth score 3.2
Adjustment used for Style Tilts No Adjustment
Cash (%) 12.7 The ability of the strategy to hold up to 20% in securities other than listed equities means a number of holdings will have been excluded from our analysis. Further portfolio holdings data based on Style Research analysis is given in Further Details. The style profile is broadly consistent with other Baillie Gifford strategies, namely - A strong tilt towards growth factors - A positive tilt to some quality factors, particularly low gearing - A current overweight position in cyclical sectors at the expense of defensive sectors - A predicted beta greater than 1 - A high allocation to emerging market securities relative to benchmark Features of the portfolio which distinguish it from other global/international Baillie Gifford strategies include: - Allocation to securities other than non-listed equities - Very low coverage, at 1.8%, meaning the active share is over 98%. - The proportion of the portfolio held in stocks unique to the portfolio (i.e. not held by other
portfolios analysed in this section) is 58%, and higher than the unique proportion for other strategies (see Further Details).
The predicted tracking error, 8.0%, is relatively high compared to the peer group, which we believe merits a (T) designation In summary, we believe the characteristics of the portfolio are consistent with what we would expect given the investment philosophy and process, and we would expect them to persist.

RESEARCH NOTE Page 28
The following chart shows the 'style tilts' for the portfolio.
-2.2
-4.0
-5.7
-3.7
-8.2
2.7
5.3
2.63.9
1.8
-1.0
3.5
-1.0
-4.7
-2.1 -2.1
2.6
0.4
-9.0
-7.0
-5.0
-3.0
-1.0
1.0
3.0
5.0
7.0
9.0
Book
to P
rice
Divid
end
Yield
C'Fl
ow Y
ield
Sales
to P
rice
IBES
Eng
s Yl
d
Earn
ings
Grow
th
Sales
Gro
wth
IBES
12M
th G
r
IBES
Eng
s LT
G
Sust
ainab
le Gr
owth
Rtn
on E
quity
Low
Gear
ing
Earn
ings
Gr S
tabil
ity
Mar
ket C
ap
Mar
ket B
eta
Mom
entu
m S
T
Mom
entu
m M
T
IBES
1Yr
Rev
Styl
e Ti
lt™
'Value' Factors 'Growth' Factors Other Style Factors
Global Opportunities as at Sep 2012
The following chart shows the components of risk (variance) against the benchmark and relative to other managers in the peer group.
-6
-4
-2
0
2
4
6
8
10
12
Trac
king
Erro
r
Cur
renc
yR
isk
Mar
ket X
Term
s
Mar
ket R
isk
Sect
or X
Term
s
Sect
or R
isk
Styl
e X
Term
s
Styl
e R
isk
Equi
ty X
Term
s
Equi
ty R
isk
% p
er a
nnum
-15
-10
-5
0
5
10
15
20
25
30
Tracking Error (LHS) Risk Components - Variances (RHS)
Relative to the Mercer Style Market: Global Equity (293)Global Opportunities as at Sep 2012

RESEARCH NOTE Page 29
International Equity - Global Equity - Growth - Global Alpha (+2-3%)
Date of analysis 30 September 2012
Benchmark used for analysis MSCI World
Number of stocks 98
Predicted tracking error (%) 4.6
Average value score -2.8
Average growth score 0.9
Adjustment used for Style Tilts No Adjustment
Cash (%) 2.9 Further portfolio holdings data based on Style Research analysis is given in Further Details. The Global Alpha portfolio continues to display the tilts we would expect, reflecting Baillie Gifford’s research focus on quality growth companies. Specifically they include tilts to companies with earnings growth stability, low financial gearing, away from large market cap companies and tilts to growth factors – although we note the growth tilts in general are more modest in the Global Alpha strategy compared to other Baillie Gifford strategies. The portfolio remains relatively diversified with 98 names as at September 2012, and a predicted tracking error of 4.6%. The analysis has used the MSCI World Index as benchmark, rather than the MSCI ACWI, and we believe the tracking error would be lower if the analysis was made against the MSCI ACWI index. The key drivers of tracking error risk are market risk and stock-specific risk. The former is mainly due to the portfolio’s overweighting in the emerging markets, and the commensurate underweighting in the US. The regional biases have generally been a persistent feature of the portfolio. The style profile is broadly consistent with other Baillie Gifford strategies: - A tilt towards growth factors and away from value. - A positive tilt to some quality factors, particularly low gearing. - A current overweight position in cyclical sectors at the expense of defensive sectors - A predicted beta greater than 1 - A high allocation to emerging market securities relative to benchmark Compared to other global strategies (Global Opps and LTGG) the predicted tracking error of the Global Alpha strategy is more in line with the peer group average. The characteristics of the portfolio are consistent with what we would expect given the investment philosophy and process, and we would expect them to persist.

RESEARCH NOTE Page 30
The following chart shows the 'style tilts' for the portfolio.
-2.0
-3.0-3.5
-1.9
-3.5
-1.8
1.4 1.1
3.1
0.40.0
1.9
0.5
-3.0
0.81.0 1.3
-1.0
-4.0
-3.0
-2.0
-1.0
0.0
1.0
2.0
3.0
4.0
Book
to P
rice
Divid
end
Yield
C'Fl
ow Y
ield
Sales
to P
rice
IBES
Eng
s Yl
d
Earn
ings
Grow
th
Sales
Gro
wth
IBES
12M
th G
r
IBES
Eng
s LT
G
Sust
ainab
le Gr
owth
Rtn
on E
quity
Low
Gear
ing
Earn
ings
Gr S
tabil
ity
Mar
ket C
ap
Mar
ket B
eta
Mom
entu
m S
T
Mom
entu
m M
T
IBES
1Yr
Rev
Styl
e Ti
lt™
'Value' Factors 'Growth' Factors Other Style Factors
Global Alpha (+2-3%) as at Sep 2012
The following chart shows the 'style tilts' for the portfolio relative to its own history.
-5.0
-4.0
-3.0
-2.0
-1.0
0.0
1.0
2.0
3.0
4.0
5.0
Book
to P
rice
Divid
end
Yield
C'Fl
ow Y
ield
Sales
to P
rice
IBES
Eng
s Yl
d
Earn
ings
Grow
th
Sales
Gro
wth
IBES
12M
th G
r
IBES
Eng
s LT
G
Sust
ainab
le Gr
owth
Rtn
on E
quity
Low
Gear
ing
Earn
ings
Gr S
tabil
ity
Mar
ket C
ap
Mar
ket B
eta
Mom
entu
m S
T
Mom
entu
m M
T
IBES
1Yr
Rev
Styl
e Ti
lt™
'Value' Factors 'Growth' Factors Other Style Factors
Sep 2012 vs Historical Tilt Range (26)Global Alpha (+2-3%)

RESEARCH NOTE Page 31
The following chart shows the components of risk (variance) against the benchmark and relative to other managers in the peer group.
-4
-2
0
2
4
6
8
10
12
Trac
king
Erro
r
Cur
renc
yR
isk
Mar
ket X
Term
s
Mar
ket R
isk
Sect
or X
Term
s
Sect
or R
isk
Styl
e X
Term
s
Styl
e R
isk
Equi
ty X
Term
s
Equi
ty R
isk
% p
er a
nnum
-10
-5
0
5
10
15
20
25
30
Tracking Error (LHS) Risk Components - Variances (RHS)
Relative to the Mercer Style Market: Global Equity (282)Global Alpha (+2-3%) as at Sep 2012

RESEARCH NOTE Page 32
International Equity - Global Equity - Growth - Long Term Global Growth (+3%)
Date of analysis 30 September 2012
Benchmark used for analysis MSCI World
Number of stocks 31
Predicted tracking error (%) 10.0
Average value score -3.3
Average growth score 3.7
Adjustment used for Style Tilts No Adjustment Further portfolio holdings data based on Style Research analysis is given in Further Details. The portfolio remains consistent with our expectations, with a highly concentrated, quality-growth orientated portfolio. As a result tracking error remains very high (31 names with a predicted tracking error of 10.0%), which clearly merits a (T) designation. Stock-specific risk continues to be the main driver of the high predicted tracking error. The predicted beta of the portfolio, 1.12, is also noticeably high compared to peers. There is a consistent focus on companies with high top line growth (sales growth), high sustainable earnings growth (ROE times retained earnings), high ROE, and low gearing. These are similar characteristics to other Baillie Gifford portfolios, but the exposures tend to be more evident; unsurprising given the unconstrained and concentrated nature of the LTGG portfolio. The portfolio maintains its exposure to technology focused growth stocks such as e-Bay, Google, Amazon, Apple, in addition to the specifically Chinese focused Baidu (Chinese search engine) and Tencent (online gaming in China). As such it is not a surprise to see the Information Technology sector having the largest weighting in the portfolio; 38%. Equally we note that the weight to China is high at 17%, and total emerging market exposure is at 22%. Compared to other Baillie Gifford international/global equity strategies, LTGG has more of a bias to mid and large cap stocks. (Other strategies having more of a tilt to smaller cap stocks.) The characteristics of the portfolio are consistent with what we would expect given the investment philosophy and process, and we would expect them to persist.
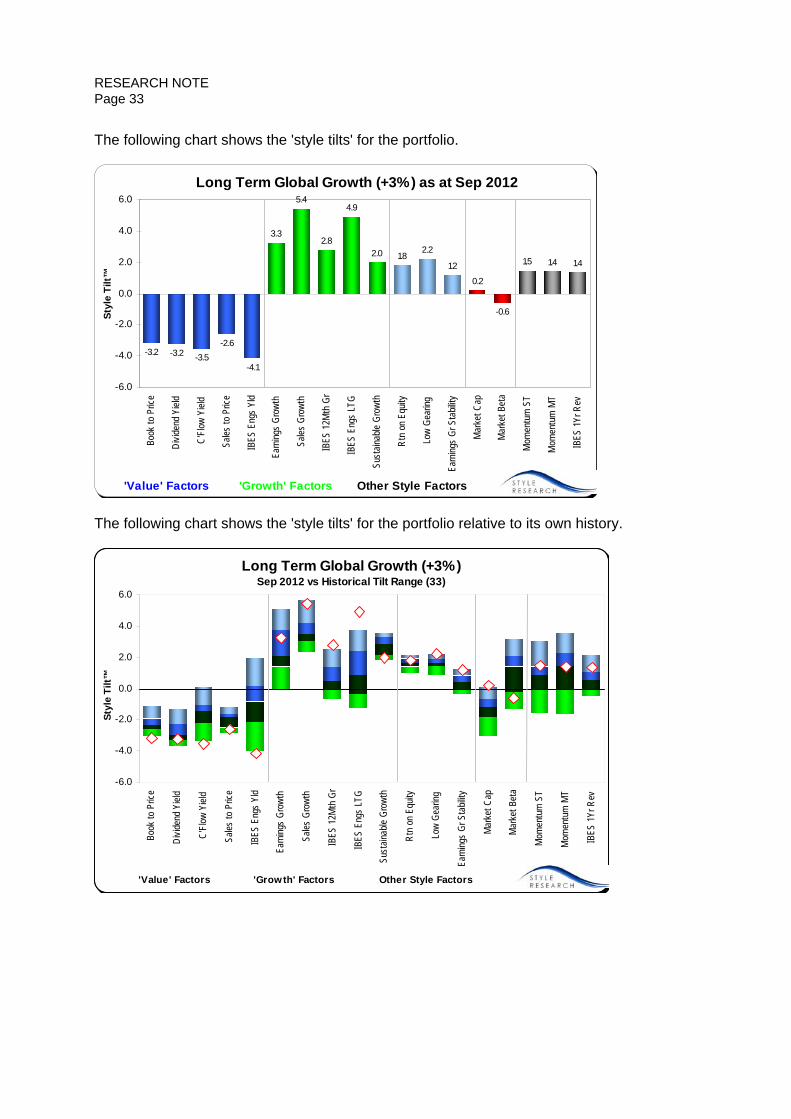
RESEARCH NOTE Page 33
The following chart shows the 'style tilts' for the portfolio.
-3.2 -3.2 -3.5-2.6
-4.1
3.3
5.4
2.8
4.9
2.0 1.82.2
1.2
0.2
-0.6
1.5 1.4 1.4
-6.0
-4.0
-2.0
0.0
2.0
4.0
6.0
Book
to P
rice
Divid
end
Yield
C'Fl
ow Y
ield
Sales
to P
rice
IBES
Eng
s Yl
d
Earn
ings
Grow
th
Sales
Gro
wth
IBES
12M
th G
r
IBES
Eng
s LT
G
Sust
ainab
le Gr
owth
Rtn
on E
quity
Low
Gear
ing
Earn
ings
Gr S
tabil
ity
Mar
ket C
ap
Mar
ket B
eta
Mom
entu
m S
T
Mom
entu
m M
T
IBES
1Yr
Rev
Styl
e Ti
lt™
'Value' Factors 'Growth' Factors Other Style Factors
Long Term Global Growth (+3%) as at Sep 2012
The following chart shows the 'style tilts' for the portfolio relative to its own history.
-6.0
-4.0
-2.0
0.0
2.0
4.0
6.0
Book
to P
rice
Divid
end
Yield
C'Fl
ow Y
ield
Sales
to P
rice
IBES
Eng
s Yl
d
Earn
ings
Grow
th
Sales
Gro
wth
IBES
12M
th G
r
IBES
Eng
s LT
G
Sust
ainab
le Gr
owth
Rtn
on E
quity
Low
Gear
ing
Earn
ings
Gr S
tabil
ity
Mar
ket C
ap
Mar
ket B
eta
Mom
entu
m S
T
Mom
entu
m M
T
IBES
1Yr
Rev
Styl
e Ti
lt™
'Value' Factors 'Growth' Factors Other Style Factors
Sep 2012 vs Historical Tilt Range (33)Long Term Global Growth (+3%)
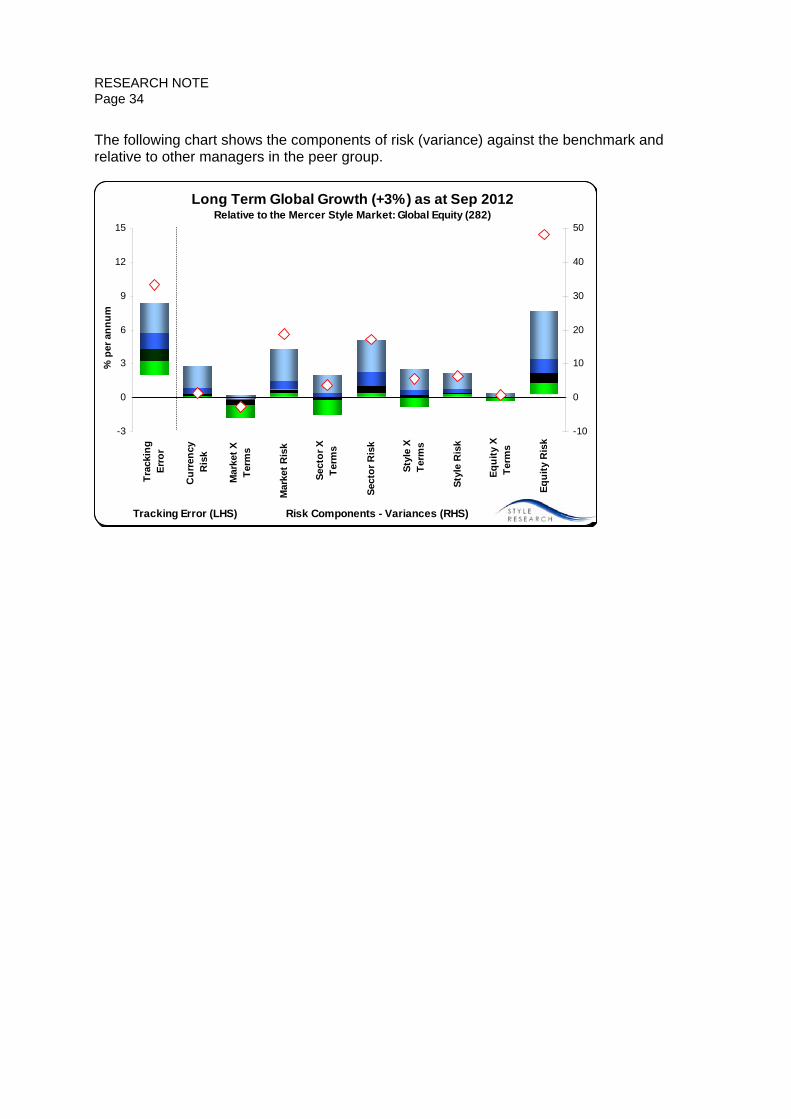
RESEARCH NOTE Page 34
The following chart shows the components of risk (variance) against the benchmark and relative to other managers in the peer group.
-3
0
3
6
9
12
15
Trac
king
Erro
r
Cur
renc
yR
isk
Mar
ket X
Term
s
Mar
ket R
isk
Sect
or X
Term
s
Sect
or R
isk
Styl
e X
Term
s
Styl
e R
isk
Equi
ty X
Term
s
Equi
ty R
isk
% p
er a
nnum
-10
0
10
20
30
40
50
Tracking Error (LHS) Risk Components - Variances (RHS)
Relative to the Mercer Style Market: Global Equity (282)Long Term Global Growth (+3%) as at Sep 2012

RESEARCH NOTE Page 35
International Equity - World ex US/EAFE Equity - Growth - ACWI ex US Alpha (+2-3%)
Date of analysis 30 September 2012
Benchmark used for analysis MSCI EAFE
Number of stocks 85
Predicted tracking error (%) 5.6
Average value score -4.6
Average growth score 2.4
Adjustment used for Style Tilts No Adjustment
Cash (%) 1.3 Further portfolio holdings data based on Style Research analysis is given in Further Details. The structure of the portfolio is consistent with both its own history and its investment philosophy and process. The style profile is broadly consistent with other Baillie Gifford strategies: - A tilt towards growth factors and away from value - A positive tilt to quality factors. - A current overweight position in cyclical sectors at the expense of defensive sectors - A predicted beta greater than 1 - A high allocation to emerging market securities relative to benchmark The following chart shows the 'style tilts' for the portfolio.
-5.3
-4.2-4.6
-4.1-4.7
0.0
5.2
1.92.5 2.5 2.5 2.6
0.8
-2.7
-0.7
2.4
3.4
0.1
-6.0
-4.0
-2.0
0.0
2.0
4.0
6.0
Book
to P
rice
Divid
end
Yield
C'Fl
ow Y
ield
Sales
to P
rice
IBES
Eng
s Yl
d
Earn
ings
Grow
th
Sales
Gro
wth
IBES
12M
th G
r
IBES
Eng
s LT
G
Sust
ainab
le Gr
owth
Rtn
on E
quity
Low
Gear
ing
Earn
ings
Gr S
tabil
ity
Mar
ket C
ap
Mar
ket B
eta
Mom
entu
m S
T
Mom
entu
m M
T
IBES
1Yr
Rev
Styl
e Ti
lt™
'Value' Factors 'Growth' Factors Other Style Factors
ACWI ex US Alpha (+2-3%) as at Sep 2012

RESEARCH NOTE Page 36
The following chart shows the 'style tilts' for the portfolio relative to its own history.
-7.0
-5.0
-3.0
-1.0
1.0
3.0
5.0
7.0
Book
to P
rice
Divid
end
Yield
C'Fl
ow Y
ield
Sales
to P
rice
IBES
Eng
s Yl
d
Earn
ings
Grow
th
Sales
Gro
wth
IBES
12M
th G
r
IBES
Eng
s LT
G
Sust
ainab
le Gr
owth
Rtn
on E
quity
Low
Gear
ing
Earn
ings
Gr S
tabil
ity
Mar
ket C
ap
Mar
ket B
eta
Mom
entu
m S
T
Mom
entu
m M
T
IBES
1Yr
Rev
Styl
e Ti
lt™
'Value' Factors 'Growth' Factors Other Style Factors
Sep 2012 vs Historical Tilt Range (23)ACWI ex US Alpha (+2-3%)
The following chart shows the components of risk (variance) against the benchmark and relative to other managers in the peer group.
-6
-3
0
3
6
9
12
Trac
king
Erro
r
Cur
renc
yR
isk
Mar
ket X
Term
s
Mar
ket R
isk
Sect
or X
Term
s
Sect
or R
isk
Styl
e X
Term
s
Styl
e R
isk
Equi
ty X
Term
s
Equi
ty R
isk
% p
er a
nnum
-10
-5
0
5
10
15
20
Tracking Error (LHS) Risk Components - Variances (RHS)
Relative to the Mercer Style Market: World ex US/EAFE Equity (251)ACWI ex US Alpha (+2-3%) as at Sep 2012
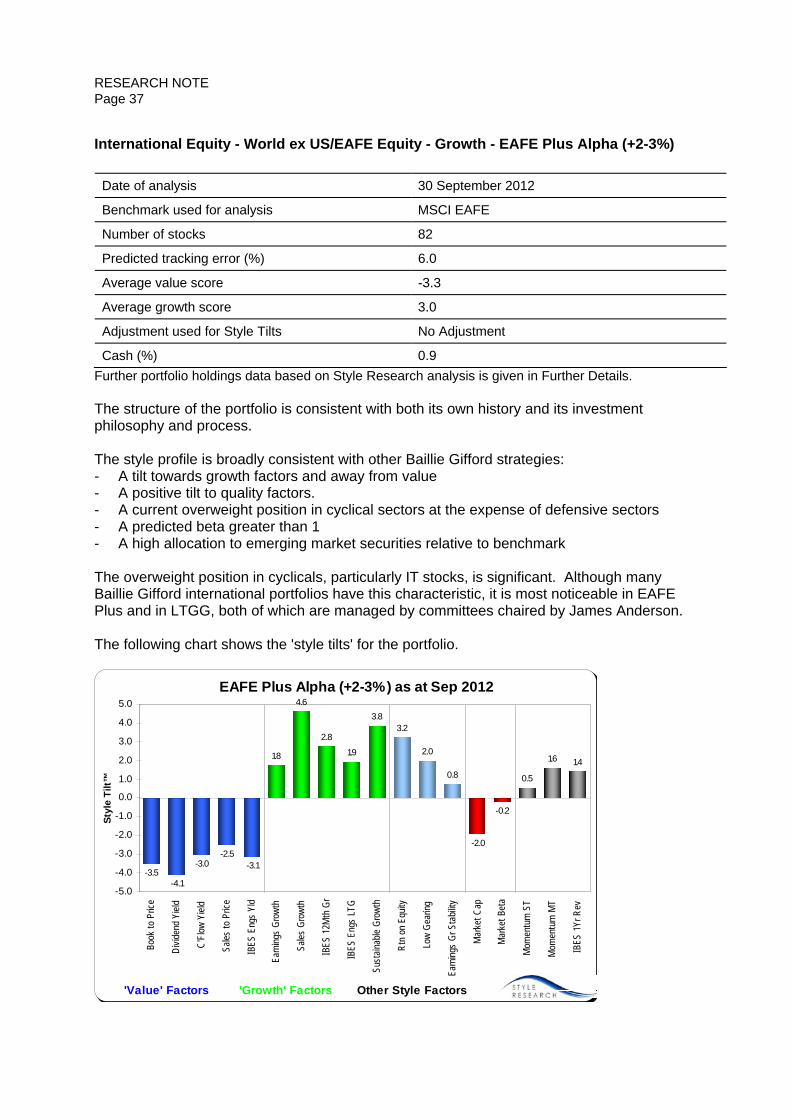
RESEARCH NOTE Page 37
International Equity - World ex US/EAFE Equity - Growth - EAFE Plus Alpha (+2-3%)
Date of analysis 30 September 2012
Benchmark used for analysis MSCI EAFE
Number of stocks 82
Predicted tracking error (%) 6.0
Average value score -3.3
Average growth score 3.0
Adjustment used for Style Tilts No Adjustment
Cash (%) 0.9 Further portfolio holdings data based on Style Research analysis is given in Further Details. The structure of the portfolio is consistent with both its own history and its investment philosophy and process. The style profile is broadly consistent with other Baillie Gifford strategies: - A tilt towards growth factors and away from value - A positive tilt to quality factors. - A current overweight position in cyclical sectors at the expense of defensive sectors - A predicted beta greater than 1 - A high allocation to emerging market securities relative to benchmark The overweight position in cyclicals, particularly IT stocks, is significant. Although many Baillie Gifford international portfolios have this characteristic, it is most noticeable in EAFE Plus and in LTGG, both of which are managed by committees chaired by James Anderson. The following chart shows the 'style tilts' for the portfolio.
-3.5-4.1
-3.0-2.5
-3.1
1.8
4.6
2.8
1.9
3.83.2
2.0
0.8
-2.0
-0.2
0.5
1.6 1.4
-5.0
-4.0
-3.0
-2.0
-1.0
0.0
1.0
2.0
3.0
4.0
5.0
Book
to P
rice
Divid
end
Yield
C'Fl
ow Y
ield
Sales
to P
rice
IBES
Eng
s Yl
d
Earn
ings
Grow
th
Sales
Gro
wth
IBES
12M
th G
r
IBES
Eng
s LT
G
Sust
ainab
le Gr
owth
Rtn
on E
quity
Low
Gear
ing
Earn
ings
Gr S
tabil
ity
Mar
ket C
ap
Mar
ket B
eta
Mom
entu
m S
T
Mom
entu
m M
T
IBES
1Yr
Rev
Styl
e Ti
lt™
'Value' Factors 'Growth' Factors Other Style Factors
EAFE Plus Alpha (+2-3%) as at Sep 2012

RESEARCH NOTE Page 38
The following chart shows the 'style tilts' for the portfolio relative to its own history.
-6.0
-4.0
-2.0
0.0
2.0
4.0
6.0
Book
to P
rice
Divid
end
Yield
C'Fl
ow Y
ield
Sales
to P
rice
IBES
Eng
s Yl
d
Earn
ings
Grow
th
Sales
Gro
wth
IBES
12M
th G
r
IBES
Eng
s LT
G
Sust
ainab
le Gr
owth
Rtn
on E
quity
Low
Gear
ing
Earn
ings
Gr S
tabil
ity
Mar
ket C
ap
Mar
ket B
eta
Mom
entu
m S
T
Mom
entu
m M
T
IBES
1Yr
Rev
Styl
e Ti
lt™
'Value' Factors 'Growth' Factors Other Style Factors
Sep 2012 vs Historical Tilt Range (24)EAFE Plus Alpha (+2-3%)
The following chart shows the components of risk (variance) against the benchmark and relative to other managers in the peer group.
-6
-3
0
3
6
9
12
Trac
king
Erro
r
Cur
renc
yR
isk
Mar
ket X
Term
s
Mar
ket R
isk
Sect
or X
Term
s
Sect
or R
isk
Styl
e X
Term
s
Styl
e R
isk
Equi
ty X
Term
s
Equi
ty R
isk
% p
er a
nnum
-10
-5
0
5
10
15
20
Tracking Error (LHS) Risk Components - Variances (RHS)
Relative to the Mercer Style Market: World ex US/EAFE Equity (251)EAFE Plus Alpha (+2-3%) as at Sep 2012

RESEARCH NOTE Page 39
Emerging Markets - Emerging Markets Equity - Emerging Markets All Cap
Date of analysis 30 September 2012
Benchmark used for analysis MSCI Emerging Markets
Number of stocks 96
Predicted tracking error (%) 5.7
Average value score -2.2
Average growth score 1.4
Adjustment used for Style Tilts No Adjustment
Cash (%) 0.9 Further portfolio holdings data based on Style Research analysis is given in Further Details. The value and growth characteristics are in line with the portfolio’s history, and with what we would expect given the manager’s investment philosophy and process. The main contributor to tracking error risk is stock-specific risk. Sector and geographical allocations are broadly in line with the index. The portfolio is broadly consistent with Baillie Gifford’s international/global equity strategies in that it has a tilt towards growth factors and away from value. However, in some other regards it stands apart. For example, the bias toward cyclical sectors is much less evident, and the coverage ratio (26.2%) is relatively high compared to other Baillie Gifford strategies. The following chart shows the 'style tilts' for the portfolio.
-2.8 -2.8-3.1
-0.3
-2.0
0.1
2.22.6
0.4
1.5
-0.4
0.6
-0.7 -0.6-0.3 -0.5
2.6
1.1
-4.0
-3.0
-2.0
-1.0
0.0
1.0
2.0
3.0
4.0
Book
to P
rice
Divid
end
Yield
C'Fl
ow Y
ield
Sales
to P
rice
IBES
Eng
s Yl
d
Earn
ings
Grow
th
Sales
Gro
wth
IBES
12M
th G
r
IBES
Eng
s LT
G
Sust
ainab
le Gr
owth
Rtn
on E
quity
Low
Gear
ing
Earn
ings
Gr S
tabil
ity
Mar
ket C
ap
Mar
ket B
eta
Mom
entu
m S
T
Mom
entu
m M
T
IBES
1Yr
Rev
Styl
e Ti
lt™
'Value' Factors 'Growth' Factors Other Style Factors
Emerging Markets All Cap as at Sep 2012

RESEARCH NOTE Page 40
The following chart shows the 'style tilts' for the portfolio relative to its own history.
-4.0
-3.0
-2.0
-1.0
0.0
1.0
2.0
3.0
4.0
Book
to P
rice
Divid
end
Yield
C'Fl
ow Y
ield
Sales
to P
rice
IBES
Eng
s Yl
d
Earn
ings
Grow
th
Sales
Gro
wth
IBES
12M
th G
r
IBES
Eng
s LT
G
Sust
ainab
le Gr
owth
Rtn
on E
quity
Low
Gear
ing
Earn
ings
Gr S
tabil
ity
Mar
ket C
ap
Mar
ket B
eta
Mom
entu
m S
T
Mom
entu
m M
T
IBES
1Yr
Rev
Styl
e Ti
lt™
'Value' Factors 'Growth' Factors Other Style Factors
Sep 2012 vs Historical Tilt Range (20)Emerging Markets All Cap
The following chart shows the components of risk (variance) against the benchmark and relative to other managers in the peer group.
-4
-2
0
2
4
6
8
10
12
Trac
king
Erro
r
Cur
renc
yR
isk
Mar
ket X
Term
s
Mar
ket R
isk
Sect
or X
Term
s
Sect
or R
isk
Styl
e X
Term
s
Styl
e R
isk
Equi
ty X
Term
s
Equi
ty R
isk
% p
er a
nnum
-10
-5
0
5
10
15
20
25
30
Tracking Error (LHS) Risk Components - Variances (RHS)
Relative to the Mercer Style Market: Emerging Markets Equity (102)Emerging Markets All Cap as at Sep 2012

RESEARCH NOTE Page 41
Past performance The following table, a copy of which was also given in the Highlights section, shows performance relative to benchmark of the key strategies reviewed in this note.
2005 2006 2007 2008 2009 2010 2011 2012*Global Opps - - - - - - - -3.4Global Alpha - -1.8 -0.6 -2.3 11.1 5.1 0.8 1.1LTGG 13.1 -3.8 5.9 -6.4 18.4 4.4 -1.5 5.4ACWI Alpha 7.8 0.4 12.1 -0.4 7.1 4.4 3.1 4.7EAFE+ Alpha 3.7 2.2 4.9 -0.4 5.5 6.2 2.8 0.3EM All Cap 7.3 5.5 6.1 -2.7 17.5 -0.4 -0.7 -0.5* 2012 is year to end Q3. Source: MSCI and Baillie Gifford as reported to GIMD.
The table highlights the relative strength of recent performance across the firm, principally due to the firm’s general quality style. A commentary on each individual strategy’s performance follows shortly, but before that we show more summary performance characteristics which compare and contrast the different strategies over the 5 years to end Q3 2012. Global Opps* Global Alpha LTGG ACWI Alpha EAFE+ Alpha EM All Cap Ex Ret - 2.1 1.8 3.2 2.4 0.7Alpha - 2.5 2.9 3.4 2.9 1.0Beta - 1.0 1.2 1.0 1.1 1.1% Out - 65 53 58 57 50% Out Up - 71 68 59 62 59% Out Down - 59 38 58 52 42Standard Dev - 23.0 26.5 24.8 26.1 31.5Tracking Er - 3.7 8.5 3.8 4.1 3.8* no data for Global Opps as track record is less than 5 years. For all the 5 strategies for which we have 5-year data, - Each made a positive excess return - The beta was greater than or equal to one - In outperformance was not simply due to the beta exposure – the “alpha” was greater
than zero - The batting average, or the % of months in which the strategy outperformed the market,
was greater in rising markets than falling markets In terms of differences, the most noticeable is that the tracking error for LTGG is much higher than that of other strategies, and furthermore that it had the highest beta. Commentary on individual strategies follows.

RESEARCH NOTE Page 42
International Equity - Global Equity - Core - Global Opportunities
Track Record Global Opportunities
Base Currency $US
Benchmark MSCI AC World
Mercer Universe Global Equity
Track record type Composite
Track Record Assets $US133 million as at 30 September 2012 The track record for the strategy starts at the beginning of March 2011, and so to Sep 2012 is 19 months long. This is too short to draw any meaningful conclusions. In the short period since inception, the strategy has had two quarters of noticeable underperformance, Q4 2011 and Q3 2012. The main driver on both occasions was stock selection. - In Q3 2012, the manager underperformed in a rising market principally due to stocks not
held, e.g. Apple, Google (both of which are held by some other international strategies at the firm) and some of the large pharmaceutical and oil companies. Of stocks held, the largest negative contributor was IP Group PLC, with other detractors being Chariot Oil & Gas, TripAdvisor and Facebook.
- Conversely in Q4 2011, IP Group was the strongest contributor to performance. (It remains the largest position in the portfolio). Stocks which hindered performance over the quarter include Yoox, RIM (the makers of the Blackberry) and Odontoprev.
Although we noted in the previous section that the style of the portfolio is consistent with other international strategies managed by the firm, we do note the portfolio has a considerable numbers of “unique stocks”. Of 85 stocks in the portfolio, 32 are held by other portfolio assessed in this report, and 53 are unique (representing 58% of the portfolio). There is scope for performance to differ from other strategies due to stock-specific factors. The final chart in this section shows that underperformance (labelled as “Ex Ret”) has come from negative alpha rather than due to beta.

RESEARCH NOTE Page 43

RESEARCH NOTE Page 44

RESEARCH NOTE Page 45
International Equity - Global Equity - Growth - Global Alpha (+2-3%)
Track Record Global Alpha
Base Currency $US
Benchmark MSCI AC World
Mercer Universe Global Equity
Track record type Composite
Track Record Assets $US10.1 billion as at 30 September 2012 Performance in recent quarters has been described in quarterly update notes on GIMD, and is consistent with what we would expect given the style of the portfolio. Over 2012, the strategy outperformed in rising markets (Q1 and Q3), and underperformed in Q2 when the market favoured defensive sectors (in which the portfolio is underweight). Longer term, performance remains above the index and in the upper quartile over 5 years. The observed (historic) tracking error over the same 5-year period is around the lower quartile of the peer group.

RESEARCH NOTE Page 46
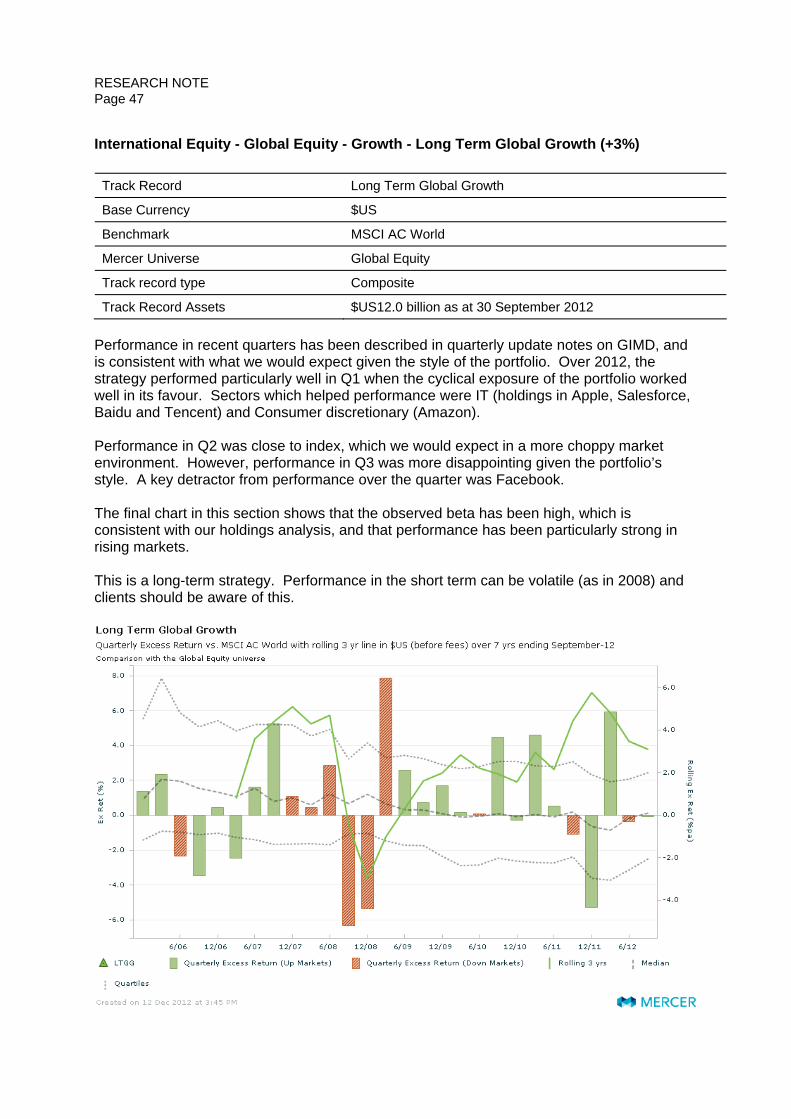
RESEARCH NOTE Page 47
International Equity - Global Equity - Growth - Long Term Global Growth (+3%)
Track Record Long Term Global Growth
Base Currency $US
Benchmark MSCI AC World
Mercer Universe Global Equity
Track record type Composite
Track Record Assets $US12.0 billion as at 30 September 2012 Performance in recent quarters has been described in quarterly update notes on GIMD, and is consistent with what we would expect given the style of the portfolio. Over 2012, the strategy performed particularly well in Q1 when the cyclical exposure of the portfolio worked well in its favour. Sectors which helped performance were IT (holdings in Apple, Salesforce, Baidu and Tencent) and Consumer discretionary (Amazon). Performance in Q2 was close to index, which we would expect in a more choppy market environment. However, performance in Q3 was more disappointing given the portfolio’s style. A key detractor from performance over the quarter was Facebook. The final chart in this section shows that the observed beta has been high, which is consistent with our holdings analysis, and that performance has been particularly strong in rising markets. This is a long-term strategy. Performance in the short term can be volatile (as in 2008) and clients should be aware of this.

RESEARCH NOTE Page 48
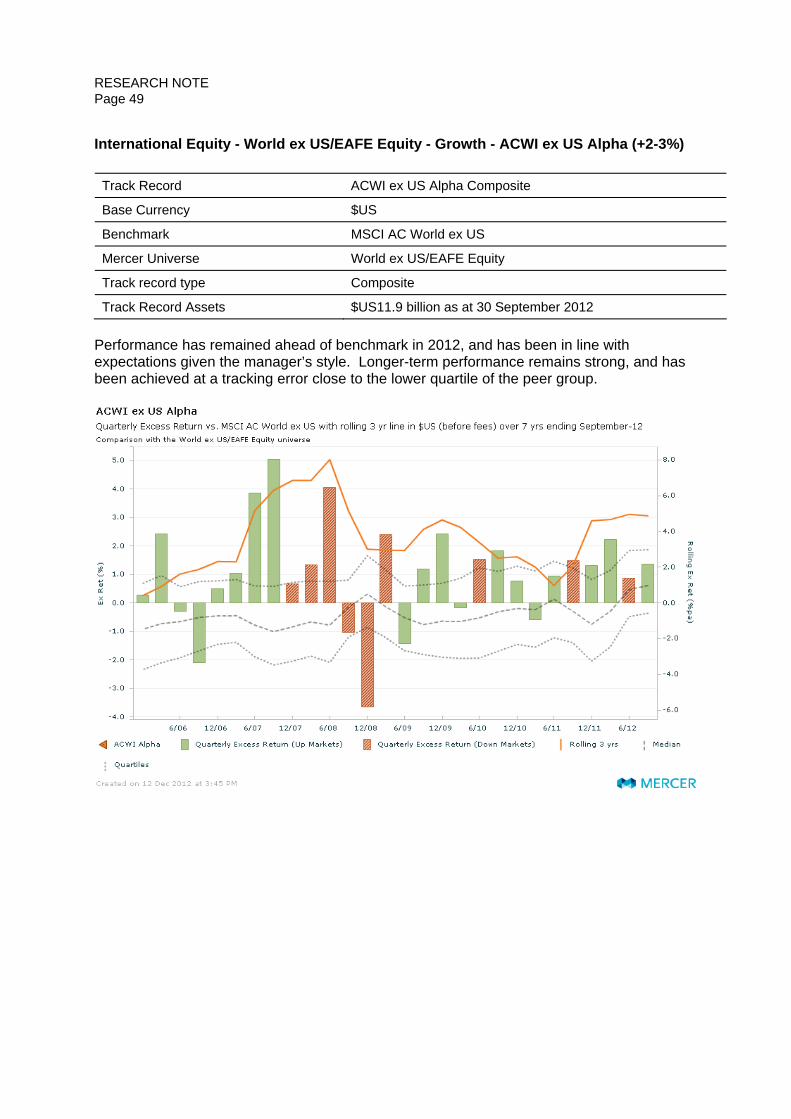
RESEARCH NOTE Page 49
International Equity - World ex US/EAFE Equity - Growth - ACWI ex US Alpha (+2-3%)
Track Record ACWI ex US Alpha Composite
Base Currency $US
Benchmark MSCI AC World ex US
Mercer Universe World ex US/EAFE Equity
Track record type Composite
Track Record Assets $US11.9 billion as at 30 September 2012 Performance has remained ahead of benchmark in 2012, and has been in line with expectations given the manager’s style. Longer-term performance remains strong, and has been achieved at a tracking error close to the lower quartile of the peer group.

RESEARCH NOTE Page 50

RESEARCH NOTE Page 51
International Equity - World ex US/EAFE Equity - Growth - EAFE Plus Alpha (+2-3%)
Track Record EAFE Plus ALPHA composite
Base Currency $US
Benchmark MSCI AC World ex US
Mercer Universe World ex US/EAFE Equity
Track record type Composite
Track Record Assets $US9.1 billion as at 30 September 2012 Performance has remained ahead of benchmark in 2012, and has been in line with expectations given the manager’s style. Longer-term performance remains strong, and has been achieved at a tracking error close to the lower quartile of the peer group.

RESEARCH NOTE Page 52

RESEARCH NOTE Page 53
Emerging Markets - Emerging Markets Equity - Emerging Markets All Cap
Track Record Emerging Markets
Base Currency $US
Benchmark MSCI EM
Mercer Universe Emerging Markets Equity (Emerging Markets)
Track record type Composite
Track Record Assets $US8.4 billion as at 30 September 2012 Performance remains marginally above both index and median over the 5 years to end September 2012. Historic tracking error over the same time period is around lower quartile.

RESEARCH NOTE Page 54

RESEARCH NOTE Page 55
Further Detail ESG and Active Ownership The firm is a signatory to the UN Principles for Responsible Investment, and a statement of the firm’s compliance with the UK Stewardship Code is published on Baillie Gifford’s website (updated October 2012). Baillie Gifford has a dedicated corporate governance and ESG team which draws on data from various voting agencies such as ISS. Although the firm has dedicated ESG resources, in our stock level discussions with portfolio managers it was not clear across the board that ESG consideration is always an integral part of the investment process. We believe there is progress with respect to ESG integration and active ownership, but that this evidence of this in the day-to-day investment progress is more limited, albeit with signs for potential improvement. We believe an ESG score of 3 remains appropriate. International Equity - Global Equity - Core - Global Opportunities The process and team remained unchanged, with the sole exception of the addition of a second analyst, Andrew Hunt. The full team is:
The strategy has struggled since inception in 2011, both in terms of performance and assets. Reasons for relative underperformance are described in the performance section of this note, with the main driver being stock selection. However, we retain our confidence in Smith and MacPhee. We discussed a number of stocks, including IP Group (an idea sourced from the Global Discovery team), Eldorado, IAMGOLD, RIM, and Sky Deutschland. In each case, Smith was able to articulate the source of the stock idea, and the rationale for holding it in the portfolio. It is also clear that they work closely with other teams. We remain comfortable with the quality of work, but do wonder whether Smith is a good communicator, or is engaging as a leader. The strategy has also struggled to raise assets. When the strategy was first launched, the intention was to make it available in pooled fund form only and to decline segregated accounts. However, the strategy has been slow to gain traction in the market and still only had $133m in assets by end Q3 2012. Recognising this may be a barrier to gaining traction, the firm is willing to consider segregated accounts, and particularly so for Australian clients where the tax environment can be an issue for clients investing in the pooled fund. Prospective clients should call for availability of segregated accounts.

RESEARCH NOTE Page 56
The structure for the pooled fund is a Dublin-based QIF, which the firm has also identified as a possible barrier to gaining traction. We also understand it is possible the firm may re-visit the structure of the pooled fund. International Equity - Global Equity - Growth - Global Alpha (+2-3%) There has been no change to the team of Charles Plowden (the ‘wise older head’), Spencer Adair (bullish, growth-oriented, engaging, glass half full), and Malcolm MacColl (focuses on the accounts to look at downside risk, and wonders if the glass may be half empty). We think the team has matured well, they seem to respect each other’s views and they gave good explanations / rationalisations of their holdings. We discussed a number of stocks, including Seattle Genetics (in the US) and Schibsted (in Norway). These are both ideas sourced by the Global Alpha team, but which are now also held in other Baillie Gifford strategies. Seattle Genetics was an idea found by Adair, who used to be a doctor himself. He read a lot of medical papers, talked to the pharma team at BG. He passed the idea over to MacColl who asked different question, e.g. “who are management, and what is their incentivisation?”. We also like the ability for people to travel more and spend time in different regions to become immersed in the local culture. Although we didn’t see evidence, it strikes us the research is of a depth and quality, with a range of inputs and a large element of ‘roll your sleeves up and do the work’, that we can say it is as good as many bigger houses. We like the fact that it is not silo research and people can find themselves working across different sectors / countries. We noted throughout our conversation with Adair and MacColl a healthy rivalry with the LTGG team. International Equity - Global Equity - Growth - Long Term Global Growth (+3%)
International Equity - World ex US/EAFE Equity - Growth - Long Term Global Growth ex NA (+3%) We met with Scott Nisbet, a product specialist in the Institutional Clients Department as none of the investment managers were in Edinburgh on the day of our meeting. Mercer has prepared quarterly updates on the performance of the strategy in recent quarters (see GIMD), and we have no reason to change our positive view of the strategy. The LTGG team has grown by 1, with the addition of Marina Ofrikhter who joined from the Global Discovery team. Wanyi Yao, an existing member of the team has moved to China as Baillie Gifford has have now opened an office in Shanghai. This had been flagged to us at our previous meeting, and so is no surprise. Tom Slater, one of the investment managers on the team, has also spent several months in California to help the firm “keep up” with events on the West Coast (the portfolio has a very strong bias to technology stocks), and we are told his time has been very productive – he has met (and produced research following) meetings with public companies, private companies and venture capital firms. The portfolio still holds Facebook, which was bought at IPO. With hindsight, the team can see this was a mistake. Clients should continue to be aware this is a portfolio with a long-term time horizon, and the Facebook position illustrates how clients should be prepared to

RESEARCH NOTE Page 57
accept the risk of short-term underperformance if the team believes there is upside in the longer term. Decision-making for the strategy does not rest with any one individual, nor are decisions made by a formal voting process by the team. Rather, decisions are made on the basis of enthusiasm. If a member of the team brings an idea, can debate the idea in the face of robust questioning, and is “still left standing” with enthusiasm for the stock, then the stock will be purchased for the portfolio. This is not necessarily a “James Anderson” show. Although we suspect he can be very influential in whether a colleague in the team maintains enthusiasm for a stock. Facebook is an example of how he does not always hold sway, as the stock was championed by Tom Slater and Mark Urquhart. The team continue to make use of investigative journalists to undertake commissioned pieces of writing. We note the large amount of assets in the strategy
International Equity - World ex US/EAFE Equity - Growth - ACWI ex US Alpha (+2-3%) There have been no changes to the membership of the PCG since our last review, which comprises:
Name Joined Industry / Firm Responsibilities
Gerald Smith 1987 / 1987 Chairman & Global Equities Angus Franklin 1994 / 1994 Deputy Chairman & International Research Specialist Elaine Morrison 1989 / 1989 Developed Asian Equities Andrew Strathdee 1995 / 1995 UK Equities Jonathan Bates 1993 / 1993 International Research Specialist Andrew Stobart 1991 / 1991 Emerging Market Equities
RESEARCH NOTE Page 58
The team is further supported by another full time analyst, Andrei Kiselev, who joined the firm in 2009. The strategy has been hard closed to new clients since spring 2012. We met with Jonathan Bates, one of the full time members of the team. The ACWI PCG had once used a majority voting system to take decisions, but like the EAFE PCG and the LTGG team, now takes decisions based on group enthusiasm. (See EAFE Alpha section below for more discussion of this). The size of position of a stock is reflective of the amount of enthusiasm within the team (but this is not formulaic!). Bates, like many others we have spoken to in the firm, believes that too much consensus is not a good thing – and this is entirely consistent with they way in which teams are given autonomy, and how individuals within teams are given autonomy. He says the PCG is able to work in this way because the relationship between each member of the team has been established over many years. It works, in short, because of the culture. Like other PCGs, AWI Alpha has increased the number of dedicated full time members. The reasons for this include making sure that tasks decided upon by the committee are actually followed up on, and that research on stocks held in the portfolio is kept up to date. A stock we discussed was Eldorado, which is also discussed in Global Opportunities. Bates was quick to say this was a stock sponsored by Gerald smith, and not one which he necessarily agreed with. International Equity - World ex US/EAFE Equity - Growth - EAFE Plus Alpha (+2-3%)
International Equity - World ex US/EAFE Equity - Growth - EAFE Pure Alpha (+2-3%) The PCG now comprises:
Name Joined Industry / Firm Responsibilities
James Anderson 1983 / 1983 Chairman & Global Equities Nick Thomas 1998 / 1998 Deputy Chairman & Institutional Clients Department Tom Record 2002 / 2002 International Research Specialist Kavé Sigaroudinia 1999 / 1999 International Research Specialist Tom Coutts 1999 / 1999 European Equities Sarah Whitley 1980 / 1980 Japanese Equities Lawrence Burns 2009 / 2009 International Research Specialist David Salter 1997 / 2001 Institutional Clients Department
Changes since our last review are: - Ed Hocknell (Institutional Clients department) has retired (which was flagged in advance) - Tom Record, who was previously an analyst in the Emerging Markets team, is now a full
time analyst in the EAFE Alpha PCG - Lawrence Burns has joined the PCG The PCG now has three dedicated analysts. They do not assess the analysts based on their individual stock recommendations. Rather, bonus is assessed based 50% on overall team/product performance (based on 3 and 5 years) and 50% on behaviour. Previously, a 1

RESEARCH NOTE Page 59
year figures was also used as part of the performance metric, but this was dropped about 18 months ago. The EAFE Alpha strategies are formally closed, but it does sound like they can be flexible if the client is “interesting”. They mentioned some of the large and well known university foundation investors in the US as an example. We discussed decision-making. As is the case for the ACWI Alpha team, there is no formal lead portfolio manager, and nor is there a formal voting mechanism by which stocks are selected. Rather, decisions are made on a group sense of overall enthusiasm for a stock idea. If a member of the PCG brings a stock idea to the table and, if after rigorous debate and challenge that team member is still convinced of the case for the stock, then the stock will go into the portfolio. We don’t think this approach could work at many investment firms, but the culture at Baillie Gifford does seem to make this possible, and it appears to work. Anderson does not dominate the PCG, and if anything he steps back during meetings and deliberately allows others to give their views. He is conscious of his own perceived status within the firm, and takes steps to offset this. We discussed succession planning on the PCG. Anderson and Whitley are the two members with the longest experience, and who probably have a similar time-horizon to retirement (although we do not expect this soon in either case). Kavé Sigaroudinia is being signalled by some as the next leadership for the team. However, we understand that he is not currently being brought to client/consultant meetings as he has felt uncomfortable in recent client meetings. It remains to be seen how this will affect any potential leadership role. The largest stock position in the portfolio at the time of our meeting was Baidu. Tom Record, who as already mentioned was formerly in the EM team, is confident the company has caught up with the competition in terms of mobile technology. It remains one of the largest positions across all Baillie Gifford portfolios. Emerging Markets - Emerging Markets Equity - Emerging Markets All Cap
Emerging Markets - Emerging Markets Equity - Emerging Markets Leading Companies Both strategies – All Cap and Leading Companies – remain closed to new investors. The philosophy and process remain unchanged, and as discussed in previous research notes. The team has had some (relatively minor) changes:
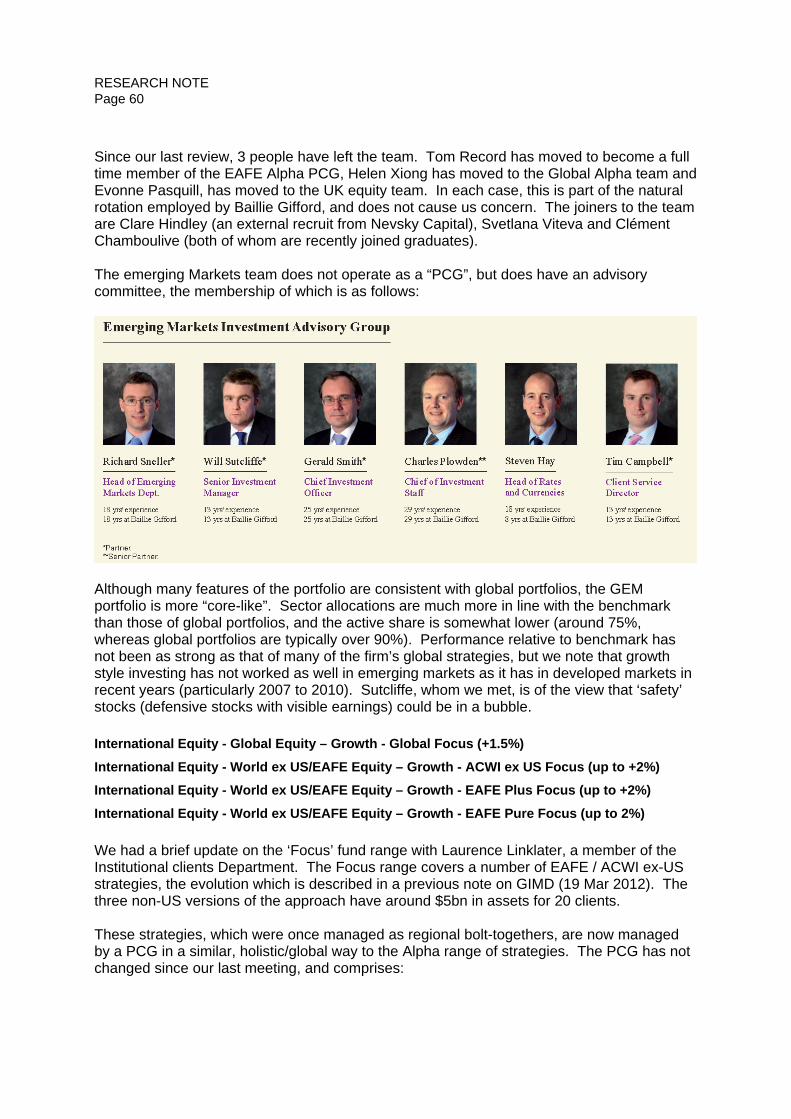
RESEARCH NOTE Page 60
Since our last review, 3 people have left the team. Tom Record has moved to become a full time member of the EAFE Alpha PCG, Helen Xiong has moved to the Global Alpha team and Evonne Pasquill, has moved to the UK equity team. In each case, this is part of the natural rotation employed by Baillie Gifford, and does not cause us concern. The joiners to the team are Clare Hindley (an external recruit from Nevsky Capital), Svetlana Viteva and Clément Chamboulive (both of whom are recently joined graduates). The emerging Markets team does not operate as a “PCG”, but does have an advisory committee, the membership of which is as follows:
Although many features of the portfolio are consistent with global portfolios, the GEM portfolio is more “core-like”. Sector allocations are much more in line with the benchmark than those of global portfolios, and the active share is somewhat lower (around 75%, whereas global portfolios are typically over 90%). Performance relative to benchmark has not been as strong as that of many of the firm’s global strategies, but we note that growth style investing has not worked as well in emerging markets as it has in developed markets in recent years (particularly 2007 to 2010). Sutcliffe, whom we met, is of the view that ‘safety’ stocks (defensive stocks with visible earnings) could be in a bubble. International Equity - Global Equity – Growth - Global Focus (+1.5%)
International Equity - World ex US/EAFE Equity – Growth - ACWI ex US Focus (up to +2%)
International Equity - World ex US/EAFE Equity – Growth - EAFE Plus Focus (up to +2%)
International Equity - World ex US/EAFE Equity – Growth - EAFE Pure Focus (up to 2%) We had a brief update on the ‘Focus’ fund range with Laurence Linklater, a member of the Institutional clients Department. The Focus range covers a number of EAFE / ACWI ex-US strategies, the evolution which is described in a previous note on GIMD (19 Mar 2012). The three non-US versions of the approach have around $5bn in assets for 20 clients. These strategies, which were once managed as regional bolt-togethers, are now managed by a PCG in a similar, holistic/global way to the Alpha range of strategies. The PCG has not changed since our last meeting, and comprises:

RESEARCH NOTE Page 61
Name Joined Industry / Firm Responsibilities
Gerard Callahan 1991 / 1991 Chairman & UK Equities Paul Faulkner 2000 / 2000 European Equities Iain Campbell 2004 / 2004 Developed Asian Equities Joe Faraday 2002 / 2002 Emerging Market Equities
The key differences between the Alpha and Focus products appear to be that: a) Alpha is closed to new business, whereas Focus is open; b) unlike the Alpha teams, Focus PCGs have no dedicated research analysts; and c) the Focus PCG comprises individuals who are perhaps less high profile (in our view) than
those in the Alpha PCG From Baillie Gifford’s perspective, we suspect the Focus strategies are a useful way of creating career opportunities for PCG members and to achieve new business growth whilst the Alpha strategies are closed. Indeed, Linklater said in the meeting that one of the greatest attractions to prospective clients is that “Alpha is closed, but you can have this instead”. We do not propose undertaking further research at this time, and have retained the R rating for all non-US versions of the strategy. There is also a Global Focus strategy, which we did not discuss in this meeting. We understand it is still managed in a regional manger, and we propose moving the rating for this strategy to N. Business Management In the second of our two meetings, we met with Andrew Telfer, CEO, in London. Baillie Gifford has, in many ways, successfully retained the brand of a boutique partnership, yet it is not a small firm (at end June 2012, assets under management were $119bn). We discussed with Telfer the plans for the future development of the firm, its ownership structure, intergenerational issues and any plans for new strategies. Inevitably, with such a large number of clients, products and assets under management, there are continually going to be flows both into and out of the business. Telfer believes that 6% growth in annual net fund sales is a sensible and sustainable target for the firm, and that given the firm will experience outflows then target inflows needs to be greater than 6%. The following table shows actual inflows and outflows in recent years

RESEARCH NOTE Page 62
The firm therefore needs to continue to grow, and this inevitably means that they will develop, and market, new products in due course. They do not have a formal schedule of new product launches, but Telfer mentioned the Global Discovery Team (small cap) and fixed income as potential sources of new product. Telfer is adamant, however, that they will only launch new products in areas that will benefit existing clients (i.e. where the new product will add to collective intellectual capital across the firm to the benefit of established products). Not only will new products be required to sustain asset growth, but they will also be required to provide career opportunities for staff. Whilst we are broadly comfortable with the current number of strategies, growth in products – particularly global equity products – remains an issue to watch. We discussed the partnership structure with Telfer. They have done a lot of thinking about this, and we were intrigued to learn that he has had a number of meetings with senior executives at competitor firms both in the UK and abroad. (It seems a little flattery can go a long way in getting these meetings!). Telfer is conscious that there are potential downsides to the current partnership structure. For example, it is “binary”. One is either a partner, or one is not, which can mean the incentives and interests of these two groups are different. He compares this to, say, a publically listed firm where everybody can have equity. This overcomes the different alignments problem between staff members, but does create other potential problems (e.g. external shareholders with different interests and different time horizons). He also compares it to a private company structure where some staff can be shareholders, but no one necessarily knows who they are (although that depends on the jurisdiction of the company). Another challenge due to the partnership structure is the growth in the number of partners. Currently 37 in number (out of 752 total staff at Dec 2012), this growth has slowed down of late, and the selection process by which someone becomes a partner has become more complex. The number of partners also means they have begun to set up executive committees to avoid business management procrastination. The problem remains, however, that by slowing down the growth in the number of partners, it risks exacerbating this binary partner/non-partner divide, and possibly act as a disincentive to members of staff who might now perceive partnership as being out of their grasp. Aware of this problem, Baillie Gifford has established the “D Scheme” for a small number of people at the firm. This is effectively a deferred compensation scheme in which deferred bonuses are

RESEARCH NOTE Page 63
doubled at outset and then increased during deferment in line with the growth in partnership profits. We remain comfortable with the partnership structure and will be interested to see how they evolve. Idea Generation Global Discovery Team We met with Douglas Brodie, head of the Global Discovery Team, which is a dedicated smaller company resource. As yet, the firm does not populate GIMD with any ‘Discovery’ strategies, but we have become increasingly aware in recent meetings of references to the team by other portfolio managers. It does seem to be respected internally as a source of intellectual capital in the small cap space. The team, including Brodie, comprises 7 (4 investment managers, 3 analysts) and has been in existence for about 3 years. Currently, the team has 2 main purposes a) to generate stock ideas for other teams b) to manage a small number of specialist small cap funds, of around $1.1bn AUM in total:
- $40m, Global Discovery - $$300m UK - $600m Pan Europe - $150m Japan
They believe that 80 to 90% of small cap companies “are rubbish”, and that it is quite quick and easy (“15 minutes”) to work out if a stock merits further research. For example, if they find a company has more than 4 or 5 competitors, they will move on. They look for less mature, entrepreneurial, unique companies with an innovative and differentiated strategy. Hence the approach is bottom up, and the typical hunting ground is stocks with a market cap of $100m-$2bn. The team act as generalists, and for the specialist mandates that they manage will typically let stocks run rather than adjust position sizes. The regional funds have 50-100 names, with around 100 in global, and they tell us portfolios are likely to have overweight positions in IT and Healthcare. We think the Global Discovery team is a valuable resource to Baillie Gifford and the main stream products, and is another factor behind our high ratings for those strategies. However, the concern is it will become an asset gathering machine once they have incubated strategies.

RESEARCH NOTE Page 64
Portfolio Construction The following tables summarise holdings data from the Style Research analysis for each strategy at 30 Sep 2012. (1) Basic holdings data Strategy: Global Opps Global Alpha LTGG ACWI Alpha EAFE+ Alpha EM All Cap Benchmark: MSCI World MSCI World MSCI World MSCI EAFE MSCI EAFE MSCI EM Num stocks: 88 98 31 85 82 96 Predicted Tr. Error 8.0 4.6 10.0 5.6 6.0 5.7 Coverage 1.8 8.7 5.0 10.8 10.8 26.2 Predicted Beta 1.01 1.09 1.12 1.06 1.07 1.01 The table shows that all the active share and predicted tracking error levels for Global Opps and LTGG are particularly high. For other strategies, tracking error is more in line with the relevant peer group. Active share (which is 100% minus coverage) is also relatively high for all strategies, apart from Emerging Markets which at around 74% is more in line with the peer group. (2) Average style tilts Strategy: Global Opps Global Alpha LTGG ACWI Alpha EAFE+ Alpha EM All Cap Value -4.8 -2.8 -3.3 -4.6 -3.3 -2.2 Growth 3.2 0.9 3.7 2.4 3.0 1.4 Quality 0.5 0.8 1.7 2.0 2.0 -0.2 The average value style tilt is negative for all strategies in the table. Similarly, the average growth and quality tilts are positive (with the sole exception of negative quality for Emerging Markets). Amongst the global/international strategies, these overall average style tilts are less emphatic in Global Alpha. (3) Sector exposures relative to benchmark Strategy: Global Opps Global Alpha LTGG ACWI Alpha EAFE+ Alpha EM All Cap Cons Staples -6.0 -0.2 -3.7 2.8 -2.3 0.4 Energy -0.2 -4.6 -10.8 2.6 -4.9 3.3 Health Care 2.2 0.6 1.5 -5.9 -3.5 -0.8 Tel Services -4.1 -1.1 -4.1 -5.4 -5.4 -5.0 Utilities -3.6 -3.6 -3.6 -4.0 -4.0 -1.4 Defensives -11.7 -9.0 -20.6 -9.9 -20.1 -3.5 Cons Disc 4.6 6.8 14.9 0.5 9.8 -0.2 Financials -0.7 0.0 -17.5 -2.5 -6.0 1.8 Industrials 7.9 4.0 1.1 2.9 2.7 0.0 Info Tech -1.8 2.1 25.7 9.7 14.2 9.7 Materials 1.7 -3.9 -3.5 -0.7 -0.6 -7.8 Cyclicals 11.7 9.0 20.6 9.9 20.1 3.5 All 6 strategies have an exposure to cyclicals greater than that of the relevant benchmark. This is particularly noticeable for LTGG and EAFE+ alpha, both of which are managed by committees headed by James Anderson. In both cases, the key overweight sector is information technology. Sector weights relative to benchmark are less significant for the Emerging Markets strategy (which, as already noted, also has a lower active share than the other strategies).

RESEARCH NOTE Page 65
The history of the relative weights of cyclical sectors is shown in the chart. This demonstrates that the relative weight to cyclical sectors has, generally, been persistent.
Cyclical Sector Exposures relative to Benchmark
-10%
-5%
0%
5%
10%
15%
20%
25%
Sep-04
Jan-0
5
May-05
Sep-05
Jan-0
6
May-06
Sep-06
Jan-0
7
May-07
Sep-07
Jan-0
8
May-08
Sep-08
Jan-0
9
May-09
Sep-09
Jan-1
0
May-10
Sep-10
Jan-1
1
May-11
Sep-11
Jan-1
2
May-12
Sep-12
Rel
ativ
e to
Ben
chm
ark
Global OppsGlobal Alpha
LTGGACWI AlphaEAFE+ Alpha
EM All Cap
(4) Emerging market exposure relative to benchmark Strategy: Global Opps Global Alpha LTGG ACWI Alpha EAFE+ Alpha EM All Cap Em Mkts 20.2 17.8 22.3 25.4 19.0 -16.9 For the 5 international/global strategies, the benchmark used in the analysis is developed-markets only, and so the emerging market relative exposure is the same as the absolute exposure. However, in each case this is also greater than the relevant ACWI weighting to emerging markets. For the EM All Cap strategy, the benchmark is 100% emerging markets, so it does not surprise us that the relative exposure is negative. The salient observation from this table, however, is the consistent overweight position in emerging market equities for the global/international strategies.

RESEARCH NOTE Page 66
(5) Number of stocks in common The table shows how many stocks each pair of portfolios has in common. For example, LTGG and Global Alpha have 11 stocks in common. Global Opps Global Alpha LTGG ACWI Alpha EAFE+ Alpha EM All Cap Global Opps 85 16 4 14 8 8 Global Alpha 95 11 25 15 9 LTGG 31 5 11 3 ACWI Alpha 84 26 17 EAFE+ Alpha 77 12 EM All Cap 90 The highest number of “common stocks” is between EAFE+ Alpha and ACWI Alpha at 26. However, each of these portfolios has an even higher number of stocks not held by the other portfolios. Our deduction from the above table is that, despite the consistent style and sector exposures, the different strategies do have their differences at the stock level. We look at this further in the following tables. (6) Weight in common stocks Each cell shows the weight (%) in the ‘row portfolio’ held in stocks which are also held by the ‘column portfolio’. For example, the 11 stocks (see above) held in common by LTGG and global Alpha represent 47% of the LTGG portfolio and 13% of the Global Alpha portfolio. Global Opps Global Alpha LTGG ACWI Alpha EAFE+ Alpha EM All Cap Global Opps 100 21 4 18 11 8Global Alpha 16 100 13 31 19 9LTGG 13 47 100 22 37 15ACWI Alpha 18 38 8 100 37 23EAFE+ Alpha 7 28 25 45 100 16EM All Cap 10 19 4 28 19 100 The table, effectively, gives a portfolio weight to the common stocks in the previous table. Again, we see that the portfolios are not slaves to each other. (7) Unique stocks Strategy: Global Opps Global Alpha LTGG ACWI Alpha EAFE+ Alpha EM All Cap Num stocks: 88 98 31 85 82 96 Num unique 53 45 10 30 35 62 % portfolio 58 44 25 30 33 56 The table shows the number of unique stocks in each portfolio. Note that this means unique to the 6 portfolios in the analysis – it does not mean the stock is unique to all Baillie Gifford portfolios. As well as the number of unique stocks, the table shows the weight of the portfolio in these unique stocks. Global Opps has the highest proportion of unique stocks, 58%. This is closely followed by EM All Cap, although we would expect this to be the case as this strategy has a different opportunity set of stocks to the global/international strategies.

RESEARCH NOTE Page 67
(8) Style tilts (detail) Global Opps Global Alpha LTGG ACWI Alpha EAFE+ Alpha EM All Cap Book to Price -2.2 -1.9 -3.2 -5.3 -3.5 -2.8 Divi Yield -4.0 -3.0 -3.2 -4.2 -4.1 -2.8 C'Flow Yield -5.7 -3.5 -3.5 -4.6 -3.0 -3.1 Sales to Price -3.7 -1.9 -2.6 -4.0 -2.5 -0.3 IBES Engs Yld -8.2 -3.5 -4.1 -4.7 -3.1 -1.9 Engs Growth 2.7 -1.8 3.3 0.0 1.8 0.0 Sales Growth 5.3 1.4 5.5 5.2 4.6 2.2 IBES 12Mth Gr 2.6 1.2 2.8 1.9 2.8 2.6 IBES Eng LTG 3.9 3.1 4.9 2.5 1.9 0.4 Sust Growth 1.8 0.4 2.0 2.5 3.8 1.5 Rtn on Equity -1.0 0.0 1.8 2.5 3.2 -0.4 Low Gearing 3.5 1.9 2.2 2.6 2.0 0.6 Engs Gr Stabi -1.0 0.5 1.2 0.8 0.8 -0.7 Market Cap -4.7 -3.0 0.2 -2.7 -2.0 -0.6 Market Beta -2.1 0.8 -0.6 -0.7 -0.2 -0.3 Momentum ST -2.1 1.0 1.5 2.4 0.5 -0.5 Momentum MT 2.6 1.3 1.4 3.4 1.6 2.6 IBES 1Yr Rev 0.4 -1.0 1.3 0.1 1.4 1.1 The table gives more granularity to the average style tilts show in table (2) earlier. As before, we see a general consistency of style away from value and toward growth and quality. The table also shows that LTGG does not have the bias to small/mid cap stocks that is evident in the other strategies. (9) Largest stock positions We made an analysis of the largest (absolute, not relative) positions for each portfolio - Only 1 stock appears in the top 10 of three portfolios - 15 stocks appear in two portfolios - 27 stocks only appear once Despite the commonality of style, the analysis confirms the scope for individual teams and managers to have differences at the stock level. Implementation We spent time at the desk of Robert Blaikie, head trader at Baillie Gifford. He demonstrated to us the process by which he accepts orders from the portfolio managers, and then executes those orders in the market. We found nothing untoward. We noted that he does not aggregate orders from different teams, but rather executes order in full in the order in which he receives them from the different teams (both purchases and sales).

RESEARCH NOTE Page 68
Important notices References to Mercer shall be construed to include Mercer LLC and/or its associated companies. © 2013 Mercer LLC. All rights reserved. This contains confidential and proprietary information of Mercer and is intended for the exclusive use of the parties to whom it was provided by Mercer. Its content may not be modified, sold or otherwise provided, in whole or in part, to any other person or entity, without Mercer’s written permission. The findings, ratings and/or opinions expressed herein are the intellectual property of Mercer and are subject to change without notice. They are not intended to convey any guarantees as to the future performance of the investment products, asset classes or capital markets discussed. Past performance does not guarantee future results. Mercer’s ratings do not constitute individualized investment advice. This does not contain investment advice relating to your particular circumstances. No investment decision should be made based on this information without first obtaining appropriate professional advice and considering your circumstances. Information contained herein has been obtained from a range of third party sources. While the information is believed to be reliable, Mercer has not sought to verify it independently. As such, Mercer makes no representations or warranties as to the accuracy of the information presented and takes no responsibility or liability (including for indirect, consequential or incidental damages), for any error, omission or inaccuracy in the data supplied by any third party. This does not constitute an offer or a solicitation of an offer to buy or sell securities, commodities and/or any other financial instruments or products or constitute a solicitation on behalf of any of the investment managers, their affiliates, products or strategies that Mercer may evaluate or recommend. Research ratings For the most recent approved ratings of an investment strategy, and a fuller explanation of their meanings, contact your Mercer representative. Conflicts of Interest For Mercer’s conflict of interest disclosures, contact your Mercer representative or see www.mercer.com/conflictsofinterest. Universe notes Mercer’s universes are intended to provide collective samples of strategies that best allow for robust peer group comparisons over a chosen timeframe. Mercer does not assert that the peer groups are wholly representative of and applicable to all strategies available to investors.

RESEARCH NOTE Page 69
Risk warnings The value of stocks and shares, including unit trusts, can go down as well as up and you
may not get back the amount you have invested.
Investments denominated in a foreign currency will fluctuate with the value of the currency.
Certain investments, such as illiquid, leveraged or high-yield instruments or funds and securities issued by small capitalization and emerging market issuers, carry additional risks that should be considered before choosing an investment manager or making an investment decision.
For higher volatility investments, losses on realisation may be high because their value may fall suddenly and substantially.
Where investments are not domiciled and regulated locally, the nature and extent of investor protection will be different to that available in respect of investments domiciled and regulated locally. In particular, the regulatory regimes in some domiciles are considerably lighter than others, and offer substantially less investor protection. Where an investor is considering whether to make a commitment in respect of an investment which is not domiciled and regulated locally, we recommend that legal advice is sought prior to the commitment being made.

NEWS ITEM
Manager: Baillie Gifford & Company
Title: New Partners announced Date: 10th January 2013 Author: Michael Kinney Peer reviewer: Sarika Goel Baillie Gifford has announced that it will appoint three new Partners on 1st May 2013. The text of the announcement follows:
Baillie Gifford, the independent investment partnership, announces today that it will appoint three new Partners on 1st May 2013. The new Partners are: Spencer Adair, investment manager in the Global Alpha team; Kathrin Hamilton, director in the Clients Department responsible for North American clients; and Graham Laybourn, director of Legal and Regulatory Risk. Following the retirement of Angus McLeod (director in the Clients Department responsible for clients in Asia and the Middle East) after 28 years at the firm, the total number of Partners will be 39 from 1st May. Andrew Telfer, Joint Senior Partner, said: “Our focus on generating superior long-term investment results for our clients and the delivery of excellent service continues to be the bedrock of our own growth in terms of clients, staff, and Partners. At a time of widespread pessimism about the outlook for global growth, we are finding many attractive investment opportunities around the world. The appointments of Spencer, Kathrin and Graham to the partnership will help us to continue to capitalise on these opportunities for the long term benefit of our clients.” Baillie Gifford & Co employs 752 people and has assets under management of £85 billion as at 31 December 2012. An asset management firm founded in 1908, it is headquartered in Edinburgh where most of its staff live and work.
Mercer View: A Research Note reviewing many of Baillie Gifford’s global and international equity strategies was recently posted. In that Note, we commented that we remain comfortable with the firm’s partnership structure and business strategy. In the same note, we also proposed retaining the A rating for the Global Alpha strategy. We are further encouraged to see that Spencer Adair is to become a partner of the firm, the other two members of the team, Charles Plowden and Malcolm MacColl, already being Partners. The other two announced appointments do not have a direct bearing on any of our ratings. We do not propose any changes to ratings as a result of this announcement.

RESEARCH VIEW Page 2
Important notices References to Mercer shall be construed to include Mercer LLC and/or its associated companies. © 2013 Mercer LLC. All rights reserved. This contains confidential and proprietary information of Mercer and is intended for the exclusive use of the parties to whom it was provided by Mercer. Its content may not be modified, sold or otherwise provided, in whole or in part, to any other person or entity, without Mercer’s written permission. The findings, ratings and/or opinions expressed herein are the intellectual property of Mercer and are subject to change without notice. They are not intended to convey any guarantees as to the future performance of the investment products, asset classes or capital markets discussed. Past performance does not guarantee future results. Mercer’s ratings do not constitute individualized investment advice. This does not contain investment advice relating to your particular circumstances. No investment decision should be made based on this information without first obtaining appropriate professional advice and considering your circumstances. Information contained herein has been obtained from a range of third party sources. While the information is believed to be reliable, Mercer has not sought to verify it independently. As such, Mercer makes no representations or warranties as to the accuracy of the information presented and takes no responsibility or liability (including for indirect, consequential or incidental damages), for any error, omission or inaccuracy in the data supplied by any third party. This does not constitute an offer or a solicitation of an offer to buy or sell securities, commodities and/or any other financial instruments or products or constitute a solicitation on behalf of any of the investment managers, their affiliates, products or strategies that Mercer may evaluate or recommend. Research ratings For the most recent approved ratings of an investment strategy, and a fuller explanation of their meanings, contact your Mercer representative. Conflicts of Interest For Mercer’s conflict of interest disclosures, contact your Mercer representative or see www.mercer.com/conflictsofinterest. Universe notes Mercer’s universes are intended to provide collective samples of strategies that best allow for robust peer group comparisons over a chosen timeframe. Mercer does not assert that the peer groups are wholly representative of and applicable to all strategies available to investors.

RESEARCH VIEW Page 3
Risk warnings The value of stocks and shares, including unit trusts, can go down as well as up and you
may not get back the amount you have invested.
Investments denominated in a foreign currency will fluctuate with the value of the currency.
Certain investments, such as illiquid, leveraged or high-yield instruments or funds and securities issued by small capitalization and emerging market issuers, carry additional risks that should be considered before choosing an investment manager or making an investment decision.
For higher volatility investments, losses on realisation may be high because their value may fall suddenly and substantially.
Where investments are not domiciled and regulated locally, the nature and extent of investor protection will be different to that available in respect of investments domiciled and regulated locally. In particular, the regulatory regimes in some domiciles are considerably lighter than others, and offer substantially less investor protection. Where an investor is considering whether to make a commitment in respect of an investment which is not domiciled and regulated locally, we recommend that legal advice is sought prior to the commitment being made.

Important notices References to Mercer shall be construed to include Mercer LLC and/or its associated companies. © 2013 Mercer LLC. All rights reserved. This contains confidential and proprietary information of Mercer and is intended for the exclusive use of the parties to whom it was provided by Mercer. Its content may not be modified, sold or otherwise provided, in whole or in part, to any other person or entity, without Mercer’s prior written permission. The findings, ratings and/or opinions expressed herein are the intellectual property of Mercer and are subject to change without notice. They are not intended to convey any guarantees as to the future performance of the investment products, asset classes or capital markets discussed. Past performance does not guarantee future results. Mercer’s ratings do not constitute individualized investment advice. Information contained herein has been obtained from a range of third party sources. While the information is believed to be reliable, Mercer has not sought to verify it independently. As such, Mercer makes no representations or warranties as to the accuracy of the information presented and takes no responsibility or liability (including for indirect, consequential or incidental damages), for any error, omission or inaccuracy in the data supplied by any third party. This does not constitute an offer or a solicitation of an offer to buy or sell securities, commodities and/or any other financial instruments or products or constitute a solicitation on behalf of any of the investment managers, their affiliates, products or strategies that Mercer may evaluate or recommend. For the most recent approved ratings of an investment strategy, and a fuller explanation of their meanings, contact your Mercer representative. For Mercer’s conflict of interest disclosures, contact your Mercer representative or see www.mercer.com/conflictsofinterest. Mercer universes: Mercer’s universes are intended to provide collective samples of strategies that best allow for robust peer group comparisons over a chosen timeframe. Mercer does not assert that the peer groups are wholly representative of and applicable to all strategies available to investors. The value of your investments can go down as well as up, and you may not get back the amount you have invested. Investments denominated in a foreign currency will fluctuate with the value of the currency. Certain investments, such as securities issued by small capitalization, foreign and emerging market issuers, real property, and illiquid, leveraged or high-yield funds, carry additional risks that should be considered before choosing an investment manager or making an investment decision. Returns for periods greater than one year are annualized. Returns are calculated gross of investment management fees, unless noted as net of fees. Style analysis graph time periods may differ reflecting the length of performance history available. THE FOLLOWING PROVISIONS APPLY TO DATA OR OTHER SERVICES PROVIDED BY THE FOLLOWING COMPANIES: Where “End User” appears before the Vendor name, a direct end-user license with the Vendor is required to receive some indices. You are responsible for ensuring you have in place all such licenses as are required by Vendors. BARCLAYS: © Barclays Bank PLC 2013. This data is provided by Barclays Bank PLC. Barclays Bank PLC and its affiliated companies accept no liability for the accuracy, timeliness or completeness of such data which is provided “as is.” All warranties in relation to such data are hereby extended to the fullest extent permitted under applicable law. BARCLAYS CAPITAL: The Barclays Indices are a proprietary product of Barclays. Barclays shall maintain exclusive ownership of and rights to the Barclays Indices and that inclusion of the Barclays Indices in this Service shall not be construed to vest in the subscriber any rights with respect to the Indices. The subscriber agrees that it will not remove any copyright notice or other notification or trade name or marks of Barclays that may appear in the Barclays Indices and that any reproduction and/or distribution of the Barclays Indices (if authorized) shall contain such notices and/or marks. BLOOMBERG L.P.: © 2013 Bloomberg L.P. All rights reserved. BLOOMBERG, BLOOMBERG PROFESSIONAL, BLOOMBERG FINANCIAL MARKETS, BLOOMBERG NEWS, BLOOMBERG TRADEMARK, BLOOMBERG BONDTRADER, AND BLOOMBERG TELEVISION are trademarks and service marks of Bloomberg L.P. a Delaware Limited Partnership. BNY Mellon Asset Servicing: Source: © 2013 BNY Mellon Performance Risk and Analytics, LLC. All Rights Reserved. CITIGROUP GLOBAL MARKETS (formerly SALOMON SMITH BARNEY): Smith Barneysm and Citigroup Global Equity Indexsm are service marks of Citigroup Inc. "BECAUSE ACCURACY COUNTS®" is a registered service mark of Citigroup Inc. FloatWatch© is a trade mark of Citigroup Inc. Citigroup Global Equity Index Systemsm , Citigroup Broad Market Indexsm, Citigroup Primary Market Indexsm, Citigroup Extended Market Indexsm, Citigroup Cap-Range Indexsm, Citigroup Internet Index (NIX)sm, Citigroup Style Indices (Growth/Value)sm, Citigroup Property Indexsm are service marks of Citigroup Inc. ©2013 Citigroup Inc All rights reserved. Any unauthorized use, duplication or disclosure is prohibited by law and may result in prosecution. Citigroup, including its parent, subsidiaries and/or affiliates ("the Firm"), usually makes a market in the securities discussed or recommended in its report and may sell to or buy from customers, as principal, securities discussed or recommended in its report. The Firm or employees preparing its report may have a position in securities or options of any company discussed or recommended in its report. An employee of the Firm may be a director of a company discussed or recommended in its report. The Firm may perform or solicit investment banking or other services from any company discussed or recommended in its report. Securities recommended, offered, or sold by SSB: (i) are not insured by the Federal Deposit Insurance Corporation; (ii) are not deposits or other obligations of any insured depository institution (including Citibank); and (iii) are subject to investment risks, including the possible loss of the principal amount invested. Although information has been obtained from and is based upon sources SSB believes to be reliable, we do not guarantee its accuracy and it may be incomplete or condensed. All opinions and estimates constitute SSB’s judgment as of the date of the report and are subject to change without notice. Its report is for informational purposes only and is not intended as an offer or solicitation for the purchase or sale of a security. Its report does not take into account the investment objectives or financial situation of any particular person. Investors should obtain advice based on their own individual circumstances before making an investment decision. CREDIT SUISSE FIRST BOSTON LLC. (CSFB): Copyright © 1996 – 2013 Credit Suisse First Boston LLC and/or its affiliate companies. All rights reserved. DataStream : Source: ThomsonReuters Datastream Dow Jones: The Dow Jones IndexesSM are proprietary to and distributed by Dow Jones & Company, Inc. and have been licensed for use. All content of Dow Jones IndexesSM © 2013 is proprietary to Dow Jones & Company, Inc.

“End User” FTSE™ : is a trade mark of the London Stock Exchange PLC and The Financial Times Limited and is used by FTSE International Limited under license. Russell Investment Group Europe Ltd is licensed by FTSE International Limited to distribute FTSE Advanced Service and other FTSE indices. FTSE shall not be responsible for any error or omission in FTSE data. All copyright and database rights in FTSE products belong to FTSE or its licensors. Redistribution of the data comprising the FTSE products is not permitted. You agree to comply with any restrictions or conditions imposed upon the use, access, or storage of the data as may be notified to you by FTSE or Russell/Mellon Europe Ltd. You are not permitted to receive the FTSE Advanced Service unless you have a separate agreement with FTSE. “FTSE™”, “FT-SE™” and “Footsie™” are trade marks of London Stock Exchange PLC and The Financial Times Limited and are used by FTSE International Limited under license. The FTSE Private Investor Indices are owned and calculated by FTSE International and are produced in association with APCIMS (Association of Private Client Investment Managers and Stockbrokers). © FTSE International Limited 2013 The UK Value and Growth Indices are owned and calculated by FTSE International Limited in association with Russell Investment Group. © FTSE International Limited 2013. RUSSELL INVESTMENT GROUP: Russell Investment Group is the source and owner of certain of the data contained or reflected in this material and all trademarks and copyrights related thereto. The material may contain confidential information and unauthorized use, disclosure, copying, dissemination or redistribution is strictly prohibited. This is a user presentation of the data. Russell Investment Group is not responsible for the formatting or configuration of this material or for any inaccuracy in presentation thereof. Returns and security data for the Russell indices are provided by Mellon Analytical Solutions. Russell indices are trademarks/service marks of the Russell Investment Group. Russell® is a trademark of the Russell Investment Group. HFRI: Source: Hedge Fund Research, Inc., © HFR, Inc. 2013, www.hedgefundresearch.com JPMORGAN: The JPMorgan EMBI Index (i) is protected by copyright and JPMorgan claims trade secret rights, (ii) is and shall remain the sole property of JPMorgan, and (iii) title and full ownership in the JPMorgan EMBI Index is reserved to and shall remain with JPMorgan. All proprietary and intellectual property rights of any nature, including patents, copyrights, trademarks and trade secrets regarding the JPMorgan EMBI Index, and any and all parts, copies, modifications, enhancements and derivative works are owned by, and shall remain the property of JPMorgan and its affiliates. The JPMorgan EMBI Index and related materials and software were developed, compiled, prepared and arranged by JPMorgan through expenditure of substantial time, effort and money and constitute valuable intellectual property and trade secrets of JPMorgan. The JPMorgan EMBI Index shall not be used in a manner that would infringe the property rights of JPMorgan or others or violate the laws, tariffs, or regulations of any country. LIPPER: Performance data was supplied by Lipper, A Thomson Reuters Company, subject to the following: Copyright 2013 © Thomson Reuters. All rights reserved. Any copying, republication or redistribution of Lipper Information, including by caching, framing or similar means, is expressly prohibited without the prior written consent of Lipper. Lipper shall not be liable for any errors or delays in the Information, or for any actions taken in reliance thereon. Lipper performance data is total return, and is preliminary and subject to revision. The data contained herein has been obtained from company reports, financial reporting services, periodicals, and other resources believed to be reasonable. Although carefully verified, data on compilations is not guaranteed by Lipper Inc. - A Reuters Company and may be incomplete. No offer or solicitations to buy or sell any of the securities herein is being made by Lipper. Portions of the information contained in this report was derived by Mercer using Content supplied by Lipper, A Thomson Reuters Company. MERRILL LYNCH: The Merrill Lynch Indices are used with permission. Copyright 2013, Merrill Lynch, Pierce, Fenner & Smith Incorporated. All rights reserved. The Merrill Lynch Indices may not be copied, used, or distributed without Merrill Lynch’s prior written approval. This Product is not sponsored, endorsed, sold or promoted by Merrill Lynch. Merrill Lynch makes no guarantees, representations or warranties of any kind, express or implied, to any person, including, without limitation, any member of the public regarding the use of the Indices in the Product, the advisability of investing in securities generally or of the ability of the Index to track any market performance. Merrill Lynch’s only relationship to Mellon Analytical Solutions or any other person or entity in respect to this Product is limited to the licensing of the Merrill Lynch Indices, which are determined, composed, and calculated by Merrill Lynch without regard to Mellon Analytical Solutions or this Product. Merrill Lynch retains exclusive ownership of the Indices and the programs and trademarks used in connection with the Indices. Merrill Lynch has no obligation to take the needs of Mellon Analytical Solutions or the purchasers, investors or participants in the Product into consideration in determining, composing or calculating the Indices, nor shall Merrill Lynch have any obligation to continue to calculate or provide the Indices in the future. Merrill Lynch may, in its absolute discretion and without prior notice, revise or terminate the Indices at any time. IN NO EVENT SHALL MERRILL LYNCH OR ANY OF ITS PARTNERS, AFFILIATES, EMPLOYEES, OFFICERS, DIRECTORS OR AGENTS HAVE ANY LIABILITY TO ANY PERSON OR ENTITY FOR ANY INDIRECT, PUNITIVE, SPECIAL, OR CONSEQUENTIAL DAMAGES, INCLUDING LOST PROFITS. MOODY’S INVESTORS SERVICE: Moody’s © Copyright 2013, Moody’s Investors Service, Inc. (“Moody’s). Moody’s ratings (“Ratings”) are proprietary to Moody’s or its affiliates and are protected by copyright and other intellectual property laws. Ratings are licensed to Distributor by Moody’s. RATINGS MAY NOT BE COPIED OR OTHERWISE REPRODUCED, REPACKAGED, FURTHER TRANSMITTED, TRANSFERRED, DISSEMINATED, REDISTRIBUTED OR RESOLD, OR STORED FOR SUBSEQUENT USE FOR ANY SUCH PURPOSE, IN WHOLE OR IN PART, IN ANY FORM OR MANNER OR BY ANY MEANS WHATSOEVER, BY ANY PERSON WITHOUT MOODY’S PRIOR WRITTEN CONSENT. Moody’s® is a registered trademark of Moody’s Investors Service, Inc. MSCI®: Portions of this report are copyright MSCI 2013. Unpublished. All Rights Reserved. This information may only be used for your internal use, may not be reproduced or redisseminated in any form and may not be used to create any financial instruments or products or any indices. This information is provided on an “as is” basis and the user of this information assumes the entire risk of any use it may make or permit to be made of this information. Neither MSCI, any of its affiliates or any other person involved in or related to compiling, computing or creating this information makes any express or implied warranties or representations with respect to such information or the results to be obtained by the use thereof, and MSCI, its affiliates and each such other person hereby expressly disclaim all warranties (including, without limitation, all warranties of originality, accuracy, completeness, timeliness, non-infringement, merchantability and fitness for a particular purpose) with respect to this information. Without limiting any of the foregoing, in no event shall MSCI, any of its affiliates or any other person involved in or related to compiling, computing or creating this information have any liability for any direct, indirect, special, incidental, punitive, consequential or any other damages (including, without limitation, lost profits) even if notified of, or if it might otherwise have anticipated, the possibility of such damages. MSCI is a registered trademark of MSCI, Inc. NAREIT: NAREIT® is the exclusive registered mark of the National Association of Real Estate Investment Trusts. NCREIF: All NCREIF Data - Copyright by the National Council of Real Estate Investment Fiduciaries. This information is proprietary and may not be reported in whole or in part without written permission. STANDARD & POOR’S: Standard & Poor’s information contained in this document is subject to change without notice. Standard & Poor’s cannot guarantee the accuracy, adequacy or completeness of the information and is not responsible for any errors or omissions or for results obtained from use of such information. Standard & Poor’s makes no warranties or merchantability or fitness for a particular purpose. In no event shall Standard & Poor’s be liable for direct, indirect or incidental, special or consequential damages from the information here regardless or whether such damages were foreseen or unforeseen. WILSHIRE ASSOCIATES: Copyright © 2013 Wilshire Associates Incorporated. Services provided by Mercer Investment Consulting, Inc.

Mercer Investment Consulting, Inc. 3560 Lenox Road, Suite 2400 Atlanta, GA 30326 +1 404 442 3100
Services provided by Mercer Investment Consulting, Inc.