north carolina solid waste and materials … management/dwm/sw/reports and...north carolina solid...
TRANSCRIPT

North Carolina Solid Waste and Materials Management Annual Report
FY 2011-2012
A comprehensive report outlining the state’s efforts regarding solid waste and materials management, recycling and the status of waste management facilities, with additional report contributions from the state departments of Administration and Transportation.
North Carolina Solid Waste and Materials Management Annual Report FY 2011-2012 2
NORTH CAROLINA SOLID WASTE AND MATERIALS MANAGEMENT ANNUAL REPORT FY 2011-2012
State of North Carolina
N.C. Department of Environment and Natural Resources N.C. Division of Waste Management
N.C. Division of Environmental Assistance and Outreach
N.C. Department of Administration N.C. Department of Transportation
Acknowledgments The North Carolina Department of Environment and Natural Resources’ (DENR) divisions of Waste Management (DWM) and Environmental Assistance and Outreach (DEAO) thank the county and municipal officials, solid waste directors and recycling coordinators who provided much of this information. Special thanks to the following staff of DENR, the Department of Administration (DOA) and the Department of Transportation (DOT) for providing data and information for this annual report.
North Carolina Department of Environment and Natural Resources N.C. Division of Waste Management 1646 Mail Service Center Raleigh, N.C. 27699-1646 919-707-8200 http://portal.ncdenr.org/web/wm
Dexter Matthews, Director Michael E. Scott, Solid Waste Section Chief Ellen Lorscheider, Planning and Programs
Branch Head Bill Patrakis, Environmental Senior
Specialist Ethan Brown, Environmental Senior
Specialist North Carolina Department of Environment and Natural Resources N.C. Division of Environmental Assistance and Outreach 1639 Mail Service Center Raleigh, N.C. 27699-1639 919-707-8100 http://portal.ncdenr.org/web/deao
Edythe McKinney, Director Scott Mouw, Community and Business
Section Chief Rob Taylor, Local Government Assistance
Team Leader
North Carolina Department of Administration 1305 Mail Service Center Raleigh, N.C. 27699-1301 919-807-4544 http://www.doa.state.nc.us
Robert Matney, Standards Engineer
North Carolina Department of Transportation 1591 Mail Service Center Raleigh, N.C. 27699-1591 919-250-4128 http://doh.dot.state.nc.us
John Sharp, Waste Management Analyst
On the Cover: Pre-approved temporary disaster debris staging sites. These sites are activated in cases of emergencies requiring large clean-up efforts.
North Carolina Solid Waste and Materials Management Annual Report FY 2011-2012 3
North Carolina Solid Waste and Materials Management Annual Report This consolidated annual report is required by the North Carolina General Assembly. The report combines several annual reports that were once issued separately by the N.C. Department of Environment and Natural Resources. The reports were the Comprehensive Solid Waste Management Report, the Scrap Tire Disposal Account Report, the White Goods Management Report and the Solid Waste Management Trust Fund Report. This report also includes information from the N.C. Department of Transportation regarding its use of recycled materials in contracts and data from the N.C. Department of Administration on bid procedures and purchases of sustainable and efficient supplies and materials. Solid waste and materials management information presented comes from 644 (100 county and 544 municipal) local government annual reports and 370 (including 18 out-of-state) solid waste management facilities. These reports represent activities related to the management of solid waste for the period July 1, 2011, through June 30, 2012.

North Carolina Solid Waste and Materials Management Annual Report FY 2011-2012 4
Contents North Carolina Solid Waste and Materials Management Annual Report ............................................................... 3 Executive Summary ................................................................................................................................................ 6 Solid Waste Management ....................................................................................................................................... 8
Key Findings ................................................................................................................................................... 8 Departmental Considerations .......................................................................................................................... 8 Municipal Solid Waste .................................................................................................................................... 9 Construction and Demolition Waste ............................................................................................................. 10 Industrial Waste ............................................................................................................................................. 11 Household Hazardous Waste Collection ....................................................................................................... 11 Medical Waste Collection and Processing .................................................................................................... 11 Solid Waste Management Account ............................................................................................................... 12 Solid Waste Program ..................................................................................................................................... 13
Solid Waste Management Trust Fund ................................................................................................................... 20 Trust Fund Revenue Sources ......................................................................................................................... 20 Trust Fund Expenditures ............................................................................................................................... 21 Planned Expenditures and Changes to Trust Fund Revenues for FY 2012-2013 ......................................... 24
Attachment A: Annual Statutory Trust Fund Revenue Sources ....................................................................... 25 Attachment B: 2012 Community Waste Reduction and Recycling Grants ...................................................... 26 Attachment C: 2012 Curbside Rollout Cart Grants .......................................................................................... 29 Attachment D: 2012 Abandoned Manufactured Homes Grants ....................................................................... 29 Attachment E: 2012 State Agency Grant Projects ............................................................................................ 30 Attachment F: 2012 Recycling Business Grant Projects .................................................................................. 31
Local Government Waste Reduction Activities and Recycling Markets ............................................................. 33 Source Reduction and Reuse Programs ......................................................................................................... 33 Local Government Recovery ......................................................................................................................... 34 Recovery of Particular Materials ................................................................................................................... 35 Recovery of Traditional Materials ................................................................................................................. 36 Plastic Recycling In North Carolina .............................................................................................................. 37 Focus on Electronics...................................................................................................................................... 38 Local Government Recycling Program Management ................................................................................... 40 A Focus on Carts ........................................................................................................................................... 40 Types of Public Recycling Efforts ................................................................................................................ 41 Special Waste Management .......................................................................................................................... 42 Yard Waste Management .............................................................................................................................. 43 Recycling Markets and Prices ....................................................................................................................... 44 Recycling Market Developments in FY 2011-12 .......................................................................................... 46
Scrap Tire Management ........................................................................................................................................ 48 Scrap Tire Disposal Account ......................................................................................................................... 48 Processed Tire Material Market Development Grants .................................................................................. 48 Tire Cleanup Program ................................................................................................................................... 49 Scrap Tire Generation .................................................................................................................................... 49 Scrap Tire Collection ..................................................................................................................................... 49 County Tire Disposal ..................................................................................................................................... 50 County Reports of Scrap Tire Disposal for FY 2011-12 ............................................................................... 50 Tire Recycling ............................................................................................................................................... 50
Attachment A: County Tire Grants for October – March 2012 ........................................................................ 52 Attachment B: County Tire Grants for April - September 2012 ....................................................................... 53
White Goods Management ................................................................................................................................... 54
North Carolina Solid Waste and Materials Management Annual Report FY 2011-2012 5
White Goods Management by County Governments .................................................................................... 54 White Goods Management Costs .................................................................................................................. 54 CFC Collection .............................................................................................................................................. 54 Current Trends in White Goods Management ............................................................................................... 55 White Goods Management Account ............................................................................................................. 55
Attachment A: Grant Payments Issued, August 9, 2012 ................................................................................... 60 Attachment B: Grant Payments Issued, November 1, 2012 .............................................................................. 60 Attachment C: Grant Payments Issued, April 10, 2011 .................................................................................... 61 Attachment D: Capital Improvement Grant Paid to Counties ........................................................................... 61
Electronics Management Program ........................................................................................................................ 62 Manufacturers’ Responsibilities .................................................................................................................... 62 Electronics Management Fund ...................................................................................................................... 63 Distributions to Local Governments from the Electronics Management Fund ............................................. 63 Retailer’s Responsibilities ............................................................................................................................. 63 State Agencies and Governmental Entities Responsibilities ......................................................................... 63 Recycling Rates within North Carolina ......................................................................................................... 64 Compliance and Enforcement of Electronics Laws ...................................................................................... 64
Abandoned Manufactured Homes Program .......................................................................................................... 66 Additional Information on the AMH program and support from the Solid Waste Trust Fund ..................... 67
Environmentally Preferred Purchasing ................................................................................................................. 69 Solicitations advertised by the Division to Comply with the Session Laws 1993 {G.S. 130A - 309.14(a3)} ....................................................................................................................................................................... 69 NC E-Procurement @ Your Service ............................................................................................................. 69 Purchasing Compliance Reviews .................................................................................................................. 70 IPS (Interactive Purchasing System) & Vendor Link NC ............................................................................. 70 Examples of Sustainable Open Market ......................................................................................................... 70 Statewide Term Contracts ............................................................................................................................. 72 Items Aiding Waste Reduction Purchased By State Agencies Through Term Contracts and Open Market Purchases ....................................................................................................................................................... 79
NCDOT - Reduce/Reuse/Recycle Report ............................................................................................................. 80 Recycling and Solid Waste Management Report for Highway Construction and Maintenance Projects State Fiscal Year 2011 – 2012 ................................................................................................................................ 86

North Carolina Solid Waste and Materials Management Annual Report FY 2011-2012 6
Executive Summary DENR’s Division of Waste Management and Division of Environmental Assistance and Outreach provide technical assistance related to reduction and management of discarded materials to businesses, industries, local governments and individual citizens. This assistance protects public health and improves the state’s natural environment by preventing contamination that can result from improper waste disposal. By reducing waste and increasing reuse of discarded materials, the programs also reduce waste disposal costs and contribute to economic development. The Solid Waste program in the Division of Waste Management ensures safe management of solid waste through guidance, technical assistance, regulation, permitting, environmental monitoring, compliance evaluation and enforcement. Waste types handled at North Carolina facilities include municipal solid waste, industrial waste, construction and demolition waste, land-clearing waste, scrap tires, medical waste, compost and septage. The Division of Environmental Assistance and Outreach offers environmental sustainability assistance, including recycling, waste reduction and composting, water and energy efficiency, and education on how to prevent waste and pollution. Solid Waste program continues to have a key role in the state’s disaster and emergency response needs. Staff evaluate and approve temporary disaster debris staging sites for local governments; plan for and respond to natural and man-made disasters such as tornados, hurricanes, ice storms, explosions and fires; staff the Emergency Operations Center; field calls; assess damage, waste amount and waste types; compile daily reports during cleanup; and assist governments, facilities and other customers in preparation prior to the disaster or emergency. Currently, 458 disaster debris sites for North Carolina local governments are approved in case of emergency. North Carolina has 40 permitted municipal solid waste landfills that take waste at approximately $40 per ton – one of the lowest costs for waste disposal on the east coast. Owners and operators of North Carolina landfills are required to monitor landfills to detect and respond to releases of contaminants to the environment. Last year (FY2010-11), the state per capita disposal rate fell below one ton per person per year for the first time since base year 1991-92. In FY 2011-12 (July 1, 2011 – June 30, 2012), the state per capita disposal rate dropped slightly again and North Carolina continued to dispose of solid waste at a lower rate relative to the last decade. This is most likely due to recycling programs and the ongoing effects of the economic downturn, particularly in the construction industry. North Carolina disposed of 9,443,380 tons of waste at in-state and out-of-state facilities. This represents a small decrease of 23,665 tons from the previous fiscal year. Although per capita disposal has continued to fall, the total waste received at in-state North Carolina MSW landfills indicates a one percent increase in disposal when compared to last year’s figures. The increase correlates with a one percent increase in population and a slight upturn in the economy. A linear model suggests that the state will continue to see an increase in waste disposed. Relative to the previous decade waste disposal during the last three years has been down, due in large part to suppressed construction and demolition activity because of the economic downturn. Historically, good economic growth has lead to increased waste disposal. Landfill bans (such as those for plastic bottles, aluminum and electronics) and an increase in recycling activity, including continued upward progress in local program performance, may also be keeping waste disposal from rising. The N.C. Department of Revenue reported Solid Waste Tax collection of $18,742,887, which equates to 9,371,444 tons of taxable solid waste going into landfills within North Carolina and, through transfer stations,
North Carolina Solid Waste and Materials Management Annual Report FY 2011-2012 7
going to landfills in neighboring states. The gap between the tons of taxable waste and the actual disposed figure of 9,443,380 equates to a possible loss of just under $144,000 in disposal tax revenue and may signal a need to examine reported disposal tons and tax payments. It is recommended that the department continue to strengthen local recycling programs, helping them expand public recycling opportunities and become more efficient in their collection efforts. The department should coordinate efforts among local governments and industry to ensure disposal capacity is available in all areas within North Carolina. It is also recommended that the department continue to try to expand the private recycling economy and encourage the diversion of identified large solid waste streams, such as food and wood wastes, from large generators of these wastes. Continued work towards expansion of the collection of plastic bottles and other recyclables is advised in order to ensure that capacity of the growing recycling markets in North Carolina is met.

North Carolina Solid Waste and Materials Management Annual Report FY 2011-2012 8
Solid Waste Management The Division of Waste Management provides technical assistance related to reduction and management of discarded materials to businesses, industries, local governments and individual citizens. This assistance helps protect public health and improve the state’s natural environment by preventing contamination that can result from improper waste disposal. Reducing waste and increasing reuse of discarded materials also lowers waste disposal costs and contributes to economic development. Within the Division of Waste Management, the Solid Waste Section manages disposal of specific types of waste, including household and industrial wastes to prevent the harmful release of waste to the environment and to clean up existing contamination. The Solid Waste Program uses a number of tools to ensure the safe management of solid waste, including guidance, technical assistance, regulation, permitting, environmental monitoring, compliance evaluation and enforcement. Waste types handled at North Carolina facilities include municipal solid waste, industrial waste, construction and demolition waste, land-clearing waste, scrap tires, medical waste, compost, and septage. North Carolina has 40 permitted municipal solid waste landfills, which take waste at approximately $40 per ton – one of the lowest costs for waste disposal on the east coast. Owners and operators of North Carolina landfills are required to monitor to detect and respond to releases of contaminants to the environment. Key Findings Local governments have 458 disaster debris sites approved by division staff in case of emergency. The state per capita disposal rate continued to decline and remains below one ton per person. North Carolina disposed of a total of 9,443,380 tons of municipal solid waste [MSW] and construction
and demolition [C&D] waste in waste management facilities located within the state and out-of-state. This represents a small decrease of 23,665 tons from the previous fiscal year.
The N.C. Department of Revenue reported Solid Waste Tax collection of $18,742,887 which equates to 9,371,444 tons of taxable solid waste going into landfills within North Carolina and, through transfer stations, going to landfills in neighboring states.
North Carolina-permitted solid waste management MSW and C&D landfills and an incinerator received a total of 9,021,530 tons of solid waste for fiscal year 2011-12. Waste originating from South Carolina and Virginia and disposed in North Carolina equaled 173,541 tons.
North Carolina exported 596,283 tons for fiscal year 2011-12, a 21,734 ton decrease from the previous year. Exported solid waste was sent to South Carolina, Virginia, Tennessee and Georgia.
Recycling of traditional recyclable materials, such as paper, glass, aluminum and steel cans, and plastic, in local government programs increased 1.8 percent from fiscal year 2010-11 to fiscal year 2011-12.
Electronics material collected by local programs has increased to 4.4 pounds per capita in fiscal year 2011-12.
Departmental Considerations The department should continue to try to strengthen local recycling programs, helping them expand
public recycling opportunities and become more efficient in their collection efforts. The department should coordinate efforts among local government and industry to ensure disposal
capacity is available in all areas within North Carolina.
69%
14%
17%
Waste Disposal in N.C.
Municipal SolidWaste Landfill
Construction &DemolitionLandfill
Industrial Landfill

North Carolina Solid Waste and Materials Management Annual Report FY 2011-2012 9
The department should help expand the private recycling economy in North Carolina and encourage the diversion of identified large solid waste streams, such as food and wood wastes, from large generators of these wastes.
The department should work to expand collection of plastic bottles and other recyclables in order to ensure that the capacity of the growing recycling markets in North Carolina is met.
The department is currently evaluating the funding needs of the scrap tire program to ensure the ongoing effectiveness of the program and to propose adjustments, if needed, to current distributions.
The department is currently evaluating the funding needs of the white goods program to ensure the ongoing effectiveness of the program and to propose changes, if needed, to distributions.
Municipal Solid Waste North Carolina has 40 operational municipal solid waste landfills and one municipal solid waste
incinerator. Waste reported from North Carolina in MSW landfills totaled 7,875,720 tons for FY 2011-12 (7,367,023
in landfills within the state and 508,697 in landfills in Virginia, South Carolina, Georgia, and Tennessee).
173,489 tons of waste from other states went to North Carolina MSW landfills. Analysis of the North Carolina MSW landfill’s reporting data indicates a one percent decrease in
disposal when compared to last year’s figures.
Fiscal Year Tons of waste
disposed NC
population
Tons of waste per person in a
year
Per capita waste change from Base
Year 91-92
Per capita waste change from previous year
2011-2012 9,443,380 9,669,244 0.98 -9.0% -1.0% 2010-2011 9,467,045 9,586,227 0.99 -8.0% -1.0% 2009-2010 9,395,457 9,382,609 1.00 -6.4% -6.8% 2008-2009 9,910,031 9,227,016 1.07 0.4% -13.7% 2007-2008 11,284,712 9,069,398 1.24 16.3% -6.9% 2006-2007 11,837,104 8,860,341 1.34 24.8% -1.4% 2005-2006 11,765,183 8,682,066 1.36 26.6% 4.9% 1991-1992* 7,257,428 6,781,321 1.07 1990-1991 7,161,455 6,632,448 1.08 * Baseline Year

North Carolina Solid Waste and Materials Management Annual Report FY 2011-2012 10
In the past, solid waste disposal data showed a strong upward trend However, beginning in FY 2006-07, before the 2008 recession, disposal rates started to fall and have declined every year since on a per capita basis. This decline may be in large part because construction and demolition activity has slowed, which directly relates to the economy. However, recycling activity has also accelerated in this period and contributes to disposal reduction.
Landfill bans (such as recent measures for plastic bottles, aluminum and electronics) have been instrumental in increasing recycling program development and participation.
The total remaining capacity of all North Carolina MSW landfills measures approximately 358 million cubic yards, equating to approximately 223 million tons. The estimate was obtained using 0.62 tons of waste per cubic yard of air space. The capacity does not include waste exported to out-of-state landfills.
State capacity equals 30 years of waste disposal if North Carolina’s rate of landfill use remains steady at approximately 7.5 million tons per year. Continued efforts to increase recycling and material diversion should help the state maintain strong landfill capacity.
Much of the state’s capacity is not available statewide due to permit conditions, franchise arrangements, service areas and distance. Although overall state capacity is sufficient, some regions have limited waste disposal capacity. Those areas may experience higher disposal costs and possible disruptions in service as facilities close or fuel costs make transport of waste to distant facilities prohibitive.
See webpage http://portal.ncdenr.org/web/wm/sw/swmar/2012 for a listing of all active MSW landfills and corresponding disposal figures.
Construction and Demolition Waste North Carolina has 53 operational C&D landfills. C&D landfills permitted prior to August 1, 2007 are not required to have liners and leachate collection
and removal systems. C&D landfills permitted after August 1, 2007 at new sites are required to have liners and leachate collection and removal systems pursuant to Session Law 2007-550..
All C&D landfills require groundwater and methane monitoring. Analysis of the North Carolina C&D landfill’s reporting data shows an increase in disposal when
compared to last year’s data. Disposal of C&D waste reported at C&D landfills totaled 1,487,982 tons. C&D waste is also received at MSW landfills in North Carolina.
The tonnage of materials recovered at private C&D facilities reached a record high of 213,776 tons in FY2011-12, increasing by 34 percent in the last two fiscal years. Increased C&D recycling is one of the
7,161,455
8,741,727
10,267,137
11,837,104
9,443,380
13,121,109
14,977,118
6,632,448
9,669,244
11,075,255
12,514,871
6,000,000
7,000,000
8,000,000
9,000,000
10,000,000
11,000,000
12,000,000
13,000,000
14,000,000
15,000,000
16,000,000
1991
1992
1993
1994
1995
1996
1997
1998
1999
2000
2001
2002
2003
2004
2005
2006
2007
2008
2009
2010
2011
2012
2013
2014
2015
2016
2017
2018
2019
2020
2021
2022
2023
2024
2025
2026
2027
2028
2029
2030
2031
2032
Popu
latio
n / T
ons
Dis
pose
d
North Carolina Solid Waste Disposal 20-Year Forecast
WasteDisposedPopulation
ACTUAL FORECAST

North Carolina Solid Waste and Materials Management Annual Report FY 2011-2012 11
leading factors in the decline of overall waste disposal. See webpage http://portal.ncdenr.org/web/wm/sw/swmar/2012 for a listing of all active C&D landfills
and corresponding disposal figures. Industrial Waste In North Carolina, there were 16 active industrial landfills receiving only industrial waste during FY
2011-12. All industrial landfills are constructed with liners and leachate collection and removal systems and are monitored to detect releases.
Eleven of the industrial landfills serve the electric power industry. Three of the industrial landfills serve the pulp and paper industry. One of the industrial landfills serves the automotive industry and one serves the battery industry. See webpage http://portal.ncdenr.org/web/wm/sw/swmar and click on FY 2011-12 for a listing of all
active industrial landfills and corresponding disposal figures. Household Hazardous Waste Collection Household hazardous wastes (HHW) are household chemicals that are poisonous and/or toxic, ignitable,
corrosive or reactive with other chemicals. HHW includes items such as pharmaceuticals, household cleaners, pesticides, herbicides, fertilizers, pool chemicals, paints, automotive fluids and batteries. These chemicals are dangerous to human health and the environment. The Division of Waste Management recommends that citizens properly dispose of HHW at a HHW collection site. Local HHW collection sites may be temporary, one-day events or permanent, on-going collection sites.
Of the 100 counties in North Carolina, only 15 have permanent household hazardous waste collection sites (19 total).
These 15 counties alone collected 3,720,418 pounds of household hazardous wastes, among which were 2,124,966 pounds of various paints; 808,321 pounds of flammable liquids; 186,404 pounds of automotive fluids and filters; 122,505 pounds of various lead-acid, cadmium, lithium and alkaline batteries, 92,177 pounds of mercury-containing fluorescent light bulbs; 83,663 pounds of compressed gasses; 82,560 pounds of poisonous materials; 69,688 pounds of corrosive materials; 45,317 pounds of flammable solids; 38,380 pounds of oxidizing substances; 1,464 pounds of pesticides and 64,973 pounds of other non-specific regulated hazardous wastes.
Nineteen counties held 27 temporary collection events. An average one-day events costs $29,568.83, with an average citizen participation rate of 516 citizens. This represents roughly 487 households per event.
A complete listing of locations of permanent HHW sites, as well as one-day events, can be found at http://portal.ncdenr.org/web/wm/sw/hhw.
Medical Waste Collection and Processing North Carolina has experienced an increase in the number of regulated medical waste treatment facilities
this year. A new facility in Gastonia commenced operations in November 2011. This brings the number of permitted medical waste treatment facilities in North Carolina to five.
Two new medical waste treatment technologies were approved for use in the state in 2011-12. The first technology shreds the medical waste and then applies steam sterilization to treat the waste. The second technology uses a chemical solidification and disinfection compound to treat liquid waste in suction canisters. This brings the number of available technologies to treat regulated medical waste in the state to thirteen. Other types of technologies approved can be viewed at this website: http://portal.ncdenr.org/web/wm/sw/medicalwaste/technologies.
All of North Carolina’s regulated medical waste treatment facilities reported treating a total of 32,962 tons of regulated medical waste, with about half of the waste originating in North Carolina.
The graph below shows the trend of the amounts of regulated medical waste North Carolina’s permitted medical waste treatment facilities treated, starting in 2006-07. Trends demonstrate increases and

North Carolina Solid Waste and Materials Management Annual Report FY 2011-2012 12
decreases in North Carolina’s medical waste processors’ treatment capacity. Companies added capacity from 2006-2009. Treatment capacity began to decline when some companies ceased operations around 2010. Medical waste generated in North Carolina may be going to other states for treatment and disposal.
Solid Waste Management Account North Carolina Session Law 2007-550 established a Solid Waste Management Permitting Fee Fund
effective July 1, 2007. Account revenue consists of solid waste management facility permit and operational fees.
In FY 2011-12, $910,125 was collected into the Permitting Fee Fund from the following types of facilities:
Waste is managed by 2711 facilities in NC as shown in the following table. Waste Facilities FY 2011-12 Number Annual Fee Charged? Coal Ash Structural Fills 74 No Compost Large Type I 18 Yes Compost Large Type II 3 Yes Compost Large Type III 10 Yes Compost Large Type IV 3 Yes Compost Small Type I 1 No Compost Small Type II 13 No Household Hazardous Waste Collection Sites 18 No Incinerator – Industrial Waste 1 Yes Incinerator – Medical Waste 2 Yes Landfills - Closed which require inspection 479 Yes Landfills - Construction & Demolition (C&D) 36 Yes Landfills - Industrial 16 Yes Landfills - Land Clearing and Inert Debris (LCID) 64 Yes Landfills - Municipal Solid Waste (MSW) 43 Yes Landfills C&D over MSW 17 Yes Material Recovery Facilities 11 Yes
0
5,000
10,000
15,000
20,000
25,000
30,000
35,000
40,000
2006-07 2007-08 2008-09 2009-10 2010-11 2011-12
Regulated Medical Waste in North Carolina total tons
North Carolina Solid Waste and Materials Management Annual Report FY 2011-2012 13
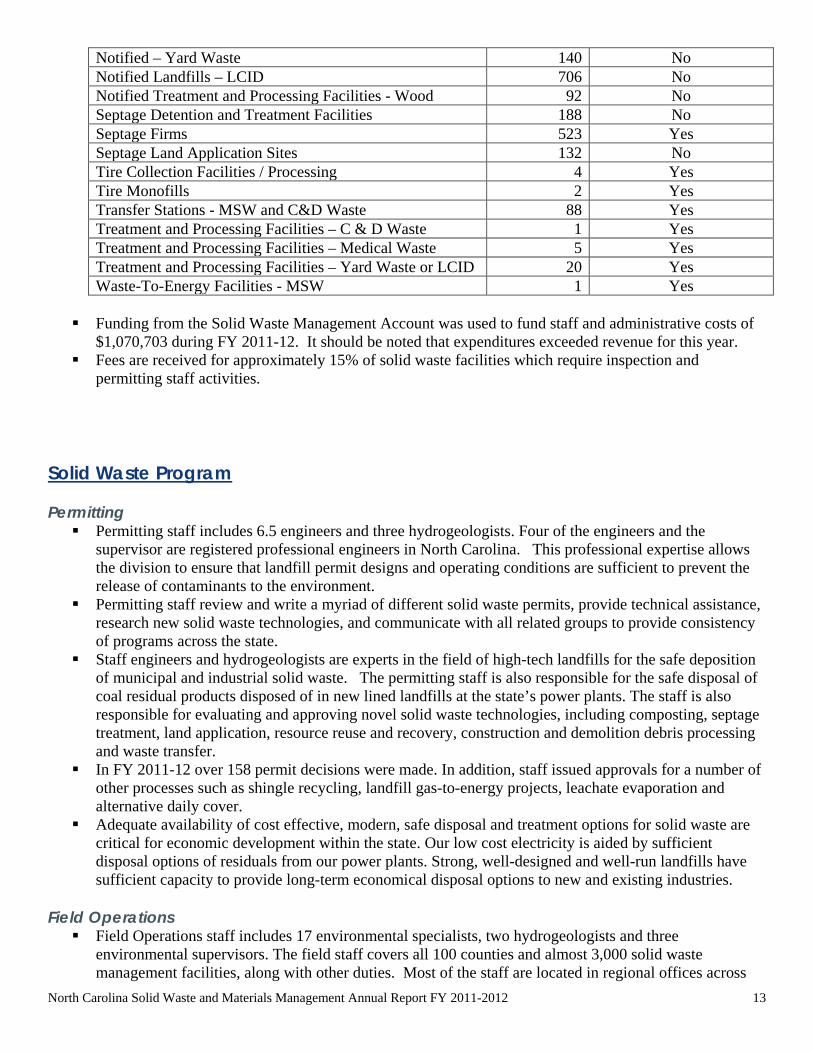
Notified – Yard Waste 140 No Notified Landfills – LCID 706 No Notified Treatment and Processing Facilities - Wood 92 No Septage Detention and Treatment Facilities 188 No Septage Firms 523 Yes Septage Land Application Sites 132 No Tire Collection Facilities / Processing 4 Yes Tire Monofills 2 Yes Transfer Stations - MSW and C&D Waste 88 Yes Treatment and Processing Facilities – C & D Waste 1 Yes Treatment and Processing Facilities – Medical Waste 5 Yes Treatment and Processing Facilities – Yard Waste or LCID 20 Yes Waste-To-Energy Facilities - MSW 1 Yes
Funding from the Solid Waste Management Account was used to fund staff and administrative costs of $1,070,703 during FY 2011-12. It should be noted that expenditures exceeded revenue for this year.
Fees are received for approximately 15% of solid waste facilities which require inspection and permitting staff activities.
Solid Waste Program Permitting Permitting staff includes 6.5 engineers and three hydrogeologists. Four of the engineers and the
supervisor are registered professional engineers in North Carolina. This professional expertise allows the division to ensure that landfill permit designs and operating conditions are sufficient to prevent the release of contaminants to the environment.
Permitting staff review and write a myriad of different solid waste permits, provide technical assistance, research new solid waste technologies, and communicate with all related groups to provide consistency of programs across the state.
Staff engineers and hydrogeologists are experts in the field of high-tech landfills for the safe deposition of municipal and industrial solid waste. The permitting staff is also responsible for the safe disposal of coal residual products disposed of in new lined landfills at the state’s power plants. The staff is also responsible for evaluating and approving novel solid waste technologies, including composting, septage treatment, land application, resource reuse and recovery, construction and demolition debris processing and waste transfer.
In FY 2011-12 over 158 permit decisions were made. In addition, staff issued approvals for a number of other processes such as shingle recycling, landfill gas-to-energy projects, leachate evaporation and alternative daily cover.
Adequate availability of cost effective, modern, safe disposal and treatment options for solid waste are critical for economic development within the state. Our low cost electricity is aided by sufficient disposal options of residuals from our power plants. Strong, well-designed and well-run landfills have sufficient capacity to provide long-term economical disposal options to new and existing industries.
Field Operations Field Operations staff includes 17 environmental specialists, two hydrogeologists and three
environmental supervisors. The field staff covers all 100 counties and almost 3,000 solid waste management facilities, along with other duties. Most of the staff are located in regional offices across

North Carolina Solid Waste and Materials Management Annual Report FY 2011-2012 14
the state to be more accessible to their customers, living and working in the areas for which they are responsible. The Environmental Specialists are independently responsible for the protection and safeguarding of human health and the environment from the potential adverse effects to off-site public entities, releases to air, soil, surface water and ground water and vector control due to the improper management of solid waste.
Field Operations staff accomplished their statutory responsibilities by: 1. Providing technical assistance/training, targeted strategic inspections, comprehensive site audits,
complaint investigations and responses to solid waste exposures, spills, fires, and explosions. 2. Initiating enforcement actions when necessary to address violations of the North Carolina
General Statutes and/or solid waste management rules and regulations. 3. Inspecting operations and reviewing records at solid waste management facilities to insure that
adequate strategies are in place to properly screen and manage wastes that could otherwise go to uncontrolled/illegal sites. Examples of such wastes include asbestos, mixed radioactive/ hazardous waste, medical waste, biohazards, flammables, corrosives, heavy metals (arsenic, lead, mercury, etc.), pesticides, and toxic/carcinogenic chemicals.
In carrying out the program’s oversight responsibility, staff are able to identify hazardous conditions that exist due to improper/inadequate personnel training, contingency planning, or criminal intent that may lead to exposures to biohazards, migration of contaminants/explosive gases off-site, and toxic emissions. All of these are capable of causing injury, illness or death through inhalation, absorption, ingestion or direct contact. The data demonstrate that more inspections and technical assistance equates to fewer compliance actions.
The 22 Field Operations staff serve 9.7 million citizens (including the neighbors of permitted facilities), 100 counties, 560 municipalities, approximately 2,000 solid waste facilities, and permit holders. Permit holders include: private waste management companies, local governments, and individuals). Other business entities that may not have permits but rely on the field staff for technical assistance, guidance and answers to various questions include waste haulers, health care facilities, scrap tire haulers, tire dealers, other state and federal agencies, emergency response coordinators, green energy companies, the media, regulated recycling recovery sites, and the legal community.
Field Operations Staff Primary Responsibilities Facility Compliance Assurance (for the protection of public health and the environment). There are 29 Permitted Solid Waste Facility types – Open and Closed MSWs, open and closed C&Ds,
open and closed Industrial landfills, open and closed LCIDs, 2 different types of Transfer facilities (MSW, C&D), 8 different types of Compost facilities (Small and Large Type 1, Small and Large Type 2, Small and Large Type 3, Type 4, Demonstration Composting facilities), Material Recovery Facilities, 4 different types of T&Ps (C&D, LCID, Tires, Notified T&P), HHW, Structural Fills, Medical Waste Incinerators, Tire Disposal facilities and 2-acre Notified LCID Sites. The specialist must have extensive knowledge of all the different types of solid waste facilities, waste streams and the proper management of the different types of wastes, facilities and operations.
The field staff also provide technical assistance and training for a variety of individuals and groups including local businesses, facility owners and operators, individual citizens and citizen groups, local governments (Solid Waste Directors, County Managers, Mayors, Sheriff’s Departments, solid waste enforcement officers, local district attorneys, local health departments, and Register of Deeds), consultants, other state agencies, attorneys and the news media.
Illegal Dumping Illegal dumping is the disposal of waste in unpermitted areas. In North Carolina, illegal dumping has
been a problem for years, requiring vast amounts of staff time and resources. No other state or federal agency addresses illegal dumping of solid waste. DWM responds to and addresses 100-200 illegal dumping complaints each year. Illegal dumping has potential to compromise human health, the environment, and economic development. As the state continues to grow and development expands into
North Carolina Solid Waste and Materials Management Annual Report FY 2011-2012 15
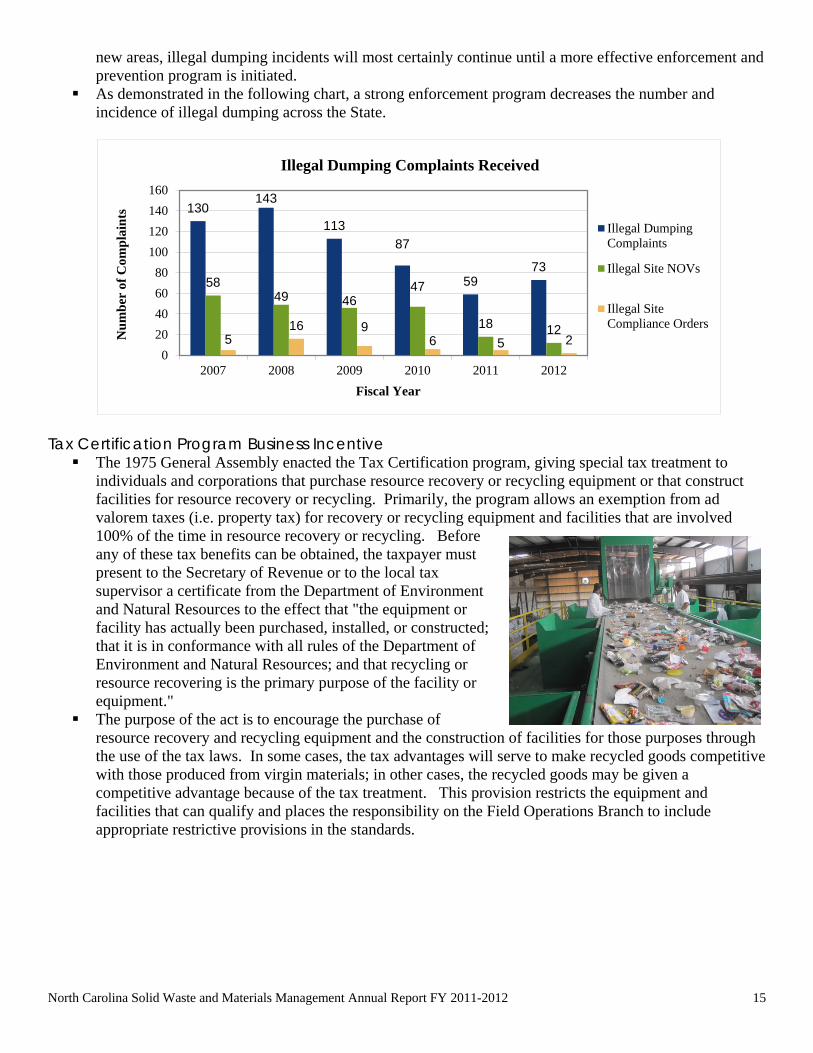
new areas, illegal dumping incidents will most certainly continue until a more effective enforcement and prevention program is initiated.
As demonstrated in the following chart, a strong enforcement program decreases the number and incidence of illegal dumping across the State.
Tax Certification Program Business Incentive The 1975 General Assembly enacted the Tax Certification program, giving special tax treatment to
individuals and corporations that purchase resource recovery or recycling equipment or that construct facilities for resource recovery or recycling. Primarily, the program allows an exemption from ad valorem taxes (i.e. property tax) for recovery or recycling equipment and facilities that are involved 100% of the time in resource recovery or recycling. Before any of these tax benefits can be obtained, the taxpayer must present to the Secretary of Revenue or to the local tax supervisor a certificate from the Department of Environment and Natural Resources to the effect that "the equipment or facility has actually been purchased, installed, or constructed; that it is in conformance with all rules of the Department of Environment and Natural Resources; and that recycling or resource recovering is the primary purpose of the facility or equipment."
The purpose of the act is to encourage the purchase of resource recovery and recycling equipment and the construction of facilities for those purposes through the use of the tax laws. In some cases, the tax advantages will serve to make recycled goods competitive with those produced from virgin materials; in other cases, the recycled goods may be given a competitive advantage because of the tax treatment. This provision restricts the equipment and facilities that can qualify and places the responsibility on the Field Operations Branch to include appropriate restrictive provisions in the standards.
130 143
113 87
59 73
58 49 46
47
18 12 5
16 9 6 5 2
020406080
100120140160
2007 2008 2009 2010 2011 2012
Num
ber
of C
ompl
aint
s
Fiscal Year
Illegal Dumping Complaints Received
Illegal DumpingComplaints
Illegal Site NOVs
Illegal SiteCompliance Orders

North Carolina Solid Waste and Materials Management Annual Report FY 2011-2012 16
Emergency and Disaster Response Field Operations staff are also involved in the division’s response to disasters and emergencies. This
responsibility includes planning and responding to natural and man-made disasters such as tornados, hurricanes, ice storms, explosions and fires, staffing of the Emergency Operations Center, fielding calls, evaluating Disaster Debris Staging Sites for approval, assessing damage, waste amount and waste types, compiling daily reports during cleanup periods and assisting governments, facilities and other customers in preparation for such events. This includes calling all open facilities in advance of storms to ensure preparation measures are in place. Field Operations staff are on call 24 hours a day, every day. Currently, staff have vetted and approved 458 temporary disaster debris staging sites.
Environmental Compliance Landfills contain numerous substances that can release, leak or migrate, posing a significant threat to
human health and the environment. Modern landfill designs include liners and leachate collection systems to contain waste and prevent the
release of these dangerous substances.
161 179
272 259
182 192
0
50
100
150
200
250
300
2007 2008 2009 2010 2011 2012
App
licat
ions
Rec
eive
d
Tax Certifications For Local Businesses

North Carolina Solid Waste and Materials Management Annual Report FY 2011-2012 17
Standard Landfill Design
Protection of Public Health, the Environment and the State’s Resources Groundwater is a valuable resource of the state. It is the source of drinking water for approximately half
the citizens of North Carolina. Therefore, ensuring that the hundreds of solid waste facilities across the state do not contaminate this valuable resource is a primary responsibility of the Division.
Since most landfills that opened in North Carolina prior to 1993 were not constructed with liners and leachate collection systems, groundwater contamination and landfill gas are detected at a growing number of closed, unlined landfill sites.
The high probability that unlined landfills will eventually leak one or more times increases the risk of groundwater and surface water contamination that can impact public water supplies, residential water supply wells, and community wells. Metals and volatile organic compounds (“VOCs” a group of common industrial and household chemicals including gasoline, industrial solvents, paints, drain cleaners, and household products), are significant contributors to groundwater contamination at unlined landfills. Long term exposure to some volatile organic compounds and metals may cause health problems, including cancer. Currently, water quality monitoring, consisting of groundwater and surface water monitoring, is being conducted at 275 landfills.
Landfill gas, primarily methane, is a concern at both active and closed landfills because (1) it can migrate offsite and become an explosive hazard, and (2) it is a greenhouse gas. Methane is generated as landfill waste decomposes and needs to be managed, because it accumulates beneath the landfill cover. Therefore, consistent routine methane monitoring as required by rule and the landfill’s solid waste permit at all landfills in the State, except land clearing and inert debris landfills, and the installation of passive or active landfill gas extraction systems to collect and exhaust the methane gases to mitigate the gases are critical in the protection of public health. Division of Waste Management hydrogeologists are assigned to address environmental compliance issues involving water quality and landfill gas at solid waste management facilities across the state, to oversee environmental monitoring and detection of contaminant releases, along with assessment and remediation as required.
231 solid waste facilities have reported volatile organic and/or inorganic compound groundwater violations. In addition, two transfer stations had leachate releases where untreated leachate was discharged to surface water via onsite engineered stormwater features or to areas around the facility potentially affecting groundwater.

North Carolina Solid Waste and Materials Management Annual Report FY 2011-2012 18
Groundwater corrective action is ongoing at 43 solid waste management facilities this year. Recent changes in environmental data reporting and subsequent creation of databases allowed staff to
review data without investing as much time and resources as was previously required, allowing for the focus of their time on assessment and remediation projects across the state. This also allows staff to measure a facility’s impact on groundwater in the state.
Composting and Land Application (CLA) The major areas of emphasis include permitting septage land
application sites, septage detention and treatment facilities, septage management firms, solid waste compost facilities and treatment and processing facilities. Staff are responsible for determining whether certain wastes and by-products can be land-applied for beneficial uses and the best management practices to be followed for each by-product to ensure protection of public health and the environment.
The volume of septage pumped in 2011-12 (158,000,000 gallons total) indicates that overall septage rates are increasing towards the industry high realized in FY 2006-07. The decline in recent years in volume of septage managed was attributed to the recent economic downturn; lower portable toilet waste volumes were a direct result of the depressed building market. Domestic septage volumes are influenced by a variety of economic factors including postponement of costs for preventative maintenance of onsite systems.
Grease septage volumes managed by permitted septage firms continue to increase in part due to local government programs that require restaurants to have their grease traps pumped more frequently. The septage industry has implemented other alternative grease management options other than discharging grease waste at municipal wastewater treatment plants and land application. Grease treatment facilities have been built and permitted to manage this difficult waste stream across the state.
Training of septage management firms and septage land application site operators continues to be a core
component of staff activities. Staff participates in 12 to 14 training events each year across the state involving personnel from 524 septage firms and 132 land application sites. Annual training events are coupled with new operator training for individuals who are new to the pumping industry in North
CLA Facility Types Solid Waste Compost Facilities
Yard Waste Notifications Treatment & Processing Facilities
Treatment & Processing Notifications Compost Demonstration Projects Septage Management Facilities
0
20
40
60
80
100
120
1997 1998 1999 2000 2001 2002 2003 2004 2005 2006 2007 2008 2009 2010 2011
Gal
lons
( in
Mill
ions
)
Domestic Grease Portable Toilet
Septage Pumped Per Year

North Carolina Solid Waste and Materials Management Annual Report FY 2011-2012 19
Carolina. Advancements in the onsite wastewater sector have introduced new waste-streams to be managed, such as peat and other media types. These new waste-streams have required specific training on the replacement and disposal of these materials.
In FY 2011-12, compost facilities saw continued interest in the diversion of organics from the municipal solid waste-stream. Thirteen solid waste compost facilities accepted food waste in FY 2011-12 for a total reported tonnage of 29,428. An additional 19,064 tons of food processing residuals were accepted by solid waste compost facilities. Compost demonstration approvals provide the unique opportunity for individuals to learn additional information about composting, reducing the amount of solid waste in our landfills while having regulatory oversight for distribution of the finished compost product.

North Carolina Solid Waste and Materials Management Annual Report FY 2011-2012 20
Solid Waste Management Trust Fund This report details the activities and expenditures of the Solid Waste Management Trust Fund for FY 2011-12 (July 1, 2011 - June 30, 2012). The Trust Fund is administered by the N.C. Division of Environmental Assistance and Outreach (DEAO) in the Department of Environment and Natural Resources. The Trust Fund was created by the Solid Waste Management Act of 1989 (SB 111). It is funded primarily by a portion of the revenues from advanced disposal fees on the sale of new tires and white goods (appliances), the tax on solid waste disposal and a tax on virgin newsprint. Additional revenues can come from appropriations, contributions and fund transfers. The purpose of the Trust Fund, as detailed in G.S. 130A-309.12, is to support a range of solid waste management activities including: technical assistance to local governments, businesses, and other entities on solid waste issues; public educational programs; research and demonstration projects; recycling market development, and support of the operational costs of the Division of Environmental Assistance and Outreach. As noted in the table below, the Solid Waste Management Trust Fund received $4,261,986 in revenues in FY 2011-12. When added to the beginning balance on July 1, 2011 of $4,076,135, a total of $8,338,121 was managed in the Trust Fund for FY 2011-12. Actual expenditures were $3,232,250, leaving a fund balance at the end of FY 2011-12 of $5,105,871. However, a total of $1,538,222 of that balance was encumbered to cover disbursements for existing grants (grant contracts are paid on a reimbursement basis). The unencumbered balance at the end of FY 2011-12 was $3,567,649. Two major grant cycles were completed in the last quarter of FY 2011-12 and grant contracts totaling $1,742,783 were initiated, but changes in the DENR accounting system prevented the grants from being encumbered until the beginning of FY 2011-12. FY 2011-12 Trust Fund Expenditures and Revenues Breakdown of FY 2011-12 Revenue Sources Beginning Balance $ 4,076,135 Tire Tax $ 1,325,818 + Revenue $ 4,261,986 White Goods ADF $ 324,053 - Expenditures $ 3,232,250 Newsprint Tax $ 20,370 Ending Balance $ 5,105,871 Solid Waste Disposal Tax $ 2,340,728 Encumbrances $ 1,538,222 Appropriations $ 0 Unencumbered funds on 6/30/12 $ 3,567,649 Contributions and Misc. $ 1,017 Fund Transfer $ 250,000 Total Revenues $ 4,261,986 Trust Fund Revenue Sources As noted in the table above, Trust Fund revenues in FY 2011-12 came from six of seven possible sources. Activity from each revenue source is described below and additional details on the funding sources are available in Attachment A. 2% Tire Tax Trust Fund revenues from the tax on the sale of new tires accounted for $1,325,818 in FY 2011-12, an increase of six percent from FY 2010-11. Tire revenue accounted for 31 percent of total Trust Fund revenues for FY 2011-12. White Goods Tax Proceeds from the advanced disposal fee on white goods accounted for $324,053 or just under eight percent of total revenues for FY 2011-12. White goods revenues were down three percent in FY 2011-12 from the previous year.

North Carolina Solid Waste and Materials Management Annual Report FY 2011-2012 21
Virgin Newsprint Tax During FY 2011-12, $20,370 was received from the virgin newsprint tax, the highest total by far ever received from the tax. In the previous fifteen years, the annual revenue from the newsprint tax has never been higher than $3,000. Solid Waste Disposal Tax The solid waste disposal tax generated $2,340,728 in revenues to the Solid Waste Trust Fund in FY 2011-12. The disposal tax revenues accounted for 55 percent of all Trust Fund income for FY 2011-12 and were up four percent from FY 11. General Appropriations When the Trust Fund was first established in 1989, a one-time appropriation of $300,000 was allocated to provide an initial fund balance. Since that time there have been no further appropriations to the Trust Fund. Contributions to the Trust Fund and Miscellaneous Revenues – In FY 2011-12, the Trust Fund received a $1,000 contribution from the national Keep America Beautiful organization to support DEAO’s recycling promotional efforts around America Recycles Day. DEAO also received a very small refund in FY 2012-13 of just under $17. Fund Transfer North Carolina General Statute 130A-310.54 directed DENR to use funds from the Mercury Pollution Prevention Fund to “establish and implement recycling programs for products containing mercury, including at least, recycling programs for light bulbs and thermostats.” The Division of Waste Management and the Division of Environmental Assistance and Outreach initiated action on this requirement by transferring $250,000 in FY 2011-12 to the Solid Waste Management Trust Fund to offer grants to develop municipal and county mercury product collection programs. DEAO released the application for program funding to North Carolina local governments in early FY 2012-13.
Trust Fund Expenditures The majority of Trust Fund expenditures in FY 2011-12 were grants to municipalities, counties, and recycling businesses. Trust Fund resources were also used to continue delivery of technical assistance to communities, recycling businesses and waste generators. As per statutory changes made in 2009, the Trust Fund was also used to cover operational expenses of the Division. These activities are among the explicit purposes noted for the Trust Fund in G.S. 130A- 309.12, and are described in more detail below. Community Waste Reduction and Recycling Grants As directed by statute and, in particular, by provisions of the solid waste disposal tax, the division offers local governments an annual general grant cycle to fund recycling initiatives and program expansions. The Community Waste Reduction and Recycling Grants for FY 2011-12 were initiated by a Request for Proposals released in December 2011, with a due date for proposals in March of 2012. DEAO received and evaluated a total of 60 proposals requesting $1,312,399 in funding, and selected 53 proposals for a total of $922,783 in grant awards. Three communities - Charlotte, Alamance County, and Archdale - subsequently declined their grant awards. Details on the grantees and their projects are provided under Attachment B to this report. Curbside Rollout Cart Grants Community recycling programs in North Carolina continue to make a transition from using bins to using larger and more convenient wheeled carts to provide curbside service. To encourage this trend, DEAO maintained its grant program for cart purchases in FY 2011-12. Over the course of the fiscal year, 13 municipalities submitted

North Carolina Solid Waste and Materials Management Annual Report FY 2011-2012 22
proposals and all were funded for a total of $734,000 in grant awards. In many cases, the grants supported the start-up of new recycling programs in small towns. The recipients, funding amounts, and project descriptions are detailed in Attachment C to this report. Abandoned Manufactured Home Grants As directed in statute, DEAO provides grants from the Solid Waste Management Trust Fund toward the clean-up of abandoned manufactured homes (AMH). In FY 2011-12, the third year of the program, the division maintained an open Request for Proposal for AMH projects. A total of four abandoned manufactured home grants totaling $150,000 were funded in FY 2011-12, which are listed in Attachment D to this report. State Agency Recycling Grants General Statute 130A-295.9(2) directs DENR to use some of the proceeds from the state $2 disposal tax to fund grants for recycling programs in state agencies, which would include community colleges, universities, and state departments. DEAO implemented this requirement through the release of a Request for Proposals to state agencies in October 2011. The grant cycle received ten proposals and all of them were funded for a total of $46,537 in awards. Details on the grantees and their projects are provided in Attachment E to this report. Recycling Business Grants DEAO conducts an annual grant cycle open to for-profit and non-profit recycling businesses to help expand the state’s available collection, processing and end-use capacity. The Recycling Business Grant cycle for FY 2011-12 was initiated by the November 2011 release of a Request for Proposal, with proposals due by February 2012. The grant cycle attracted 72 proposals requesting a total of $2,335,041. Thirty-seven of these proposals were awarded grants for $820,000 in overall funding. Details on the grantees and their projects are provided in Attachment F to this report. Recycling Guys, RE3, and RecycleMore Outreach Campaigns To implement the Trust Fund statutory provisions aimed at public recycling education, the Division of Environmental Assistance and Outreach conducted a range of education and outreach activities statewide during FY 2011-12. Three campaigns intended for different demographic ages groups - Recycle Guys, RE3.org, and RecycleMore – were used to boost public recycling participation and to support local government recycling education efforts. Outreach activities funded by the Trust Fund in FY 2011-12 included the launching of a television advertising campaign through Time Warner cable covering most of the state, the coordination of an educational recycling programs for the N.C. State Fair and the Nature Research Center grand opening, production of promotional materials for use by local government recycling programs, and continued usage of media outlets such as websites, Blogspot, Facebook, Twitter, Flickr, YouTube, and LinkedIn to spread recycling messages to the public.
Technical Assistance Activities The General Statutes direct the Trust Fund to be used to promote waste reduction and recycling generally, and specifically to provide technical assistance to local governments and to develop recycling markets. The following section lists a number of activities that DPPEA pursued in FY 2011-12 to accomplish these requirements. Waste Reduction Partners Program The Waste Reduction Partners (WRP) is a highly successful program using retired engineers and business professionals to provide environmental technical assistance to companies and local governments in North Carolina. Through two ongoing grant contracts, the Solid Waste Trust Fund continued to support WRP in FY 2011-12 at its Land-of-Sky and Triangle J COG offices. With this funding and other matching money, WRP helped North Carolina businesses and other entities reduce or recycle 8,346 tons of solid waste in FY 2011-12 for an approximate cost savings to clients of $552,950.

North Carolina Solid Waste and Materials Management Annual Report FY 2011-2012 23
Staff Support To accomplish the technical assistance, public education and recycling market development requirements in the General Statutes, the Trust Fund was used in FY 2011-12 to support staff positions in the Division of Environmental Assistance and Outreach. A total of $1,053,856 was expended to pay for salaries, benefits and some limited operational support. Staff activities included: Implementation of grant programs for local governments and recycling businesses, including
administration of over 120 individual recycling grant contracts. Training and direct assistance to county and municipal recycling programs. Technical assistance, recruitment, and business development support for recycling companies. Implementation of the statewide recycling outreach campaigns. Training and assistance to recycling and environmental education coordinators. Completion of statutory data and reporting processes on solid waste and recycling issues. Waste assessment and material marketing assistance to business and industrial waste generators. Promotion of environmentally preferable and recycled content purchasing, as encouraged by statute and
executive order. Development of infrastructure and programs to divert organic wastes to compost and digestion facilities. Implementation of a technical assistance and environmental recognition program for the hospitality and
tourism industry in North Carolina. Coordination of a construction and demolition conference with the Carolina Recycling Association and
ongoing development activities for the C&D recycling infrastructure. The Trust Fund was also used to support graduate student interns. Student projects in FY 2011-12 included research on construction and demolition waste recycling, development of recycling outreach and educational materials on behalf of municipal and county governments, support of the state recycling promotion campaigns and the DEAO Website, research on the generation and management of food waste, and general assistance to local government recycling programs. Product Stewardship Initiatives “Product Stewardship” is a policy and programmatic tool used by state and local governments to increase manufacturer and retailer responsibility for the environmental impacts of products, including the diversion of those products from disposal. Expanding responsibility for end-of-life products is expected to reduce cost and tax burdens on state and local governments. In FY 2011-12, North Carolina participated in product stewardship initiatives by supporting the activities of the Product Stewardship Institute, maintaining involvement in the Carpet America Recovery Effort, participating in efforts to address packaging wastes, and helping to implement the state’s producer responsibility electronics recycling law. Workshops and Training To encourage the professional development of local recycling coordinators and solid waste directors, Trust Fund resources supported registration scholarships for county and municipal staff to the 2011 Southeast Construction and Demolition Recycling Conference and the 2012 Carolina Recycling Association conference. DEAO also supported training of North Carolina local government staff on solid waste convenience center operations in conjunction with the N.C. Chapter of the Solid Waste Association of North America and conducted a series of recycling coordinator networking meetings around the state.
Operational Support for the Division of Environmental Assistance and Outreach As per a statutory change made in 2009, the General Assembly assigned the general operating costs of the Division of Environmental Assistance and Outreach to the Solid Waste Trust Fund, including payment of office rent, cost of vehicle use and other travel, computer and printing equipment purchase and use, and other miscellaneous costs. Total expenditures to support the division in FY 2011-12 were $235,656.

North Carolina Solid Waste and Materials Management Annual Report FY 2011-2012 24
Clean-up of the Texfi Industrial Site A line item in the FY 2011-12 state budget diverted $50,000 toward clean-up of the Texfi industrial site in Fayetteville. Funds were transferred to the Division of Waste Management for this purpose.
Planned Expenditures and Changes to Trust Fund Revenues for FY 2012-2013 In FY 2012-13, the Solid Waste Management Trust Fund will focus grant attention in six main areas: 1) general support for expansion of local recycling programs, 2) cart grants to encourage modernization of curbside recycling programs, 3) local clean-up programs for abandoned manufactured homes, 4) recycling business grants to grow private sector collection, processing and end-use capacity across the state, 5) state agency recycling grants to improve collection programs at community colleges, universities and department locations, and 6) mercury product collection program grants to fulfill the mandate in G.S. 130A-310.54. In addition, the Trust Fund will be used to continue to promote widespread public participation in recycling through the Recycle Guys, RE3, and RecycleMore campaigns. The Trust Fund will also be used to support the Waste Reduction Partners program and to provide recycling technical assistance to local governments, recycling businesses, and waste generators. In addition, North Carolina will help lead an inaugural regional conference on food waste and will work to expand training opportunities for local solid waste and recycling staff. Finally, a portion of the Trust Fund will support the operations of the Division of Environmental Assistance and Outreach. Questions regarding the North Carolina Solid Waste Management Trust Fund may be directed to Scott Mouw, Chief, Community and Business Assistance Section, N.C. Division of Environmental Assistance and Outreach, at 919-707-8114.
North Carolina Solid Waste and Materials Management Annual Report FY 2011-2012 25
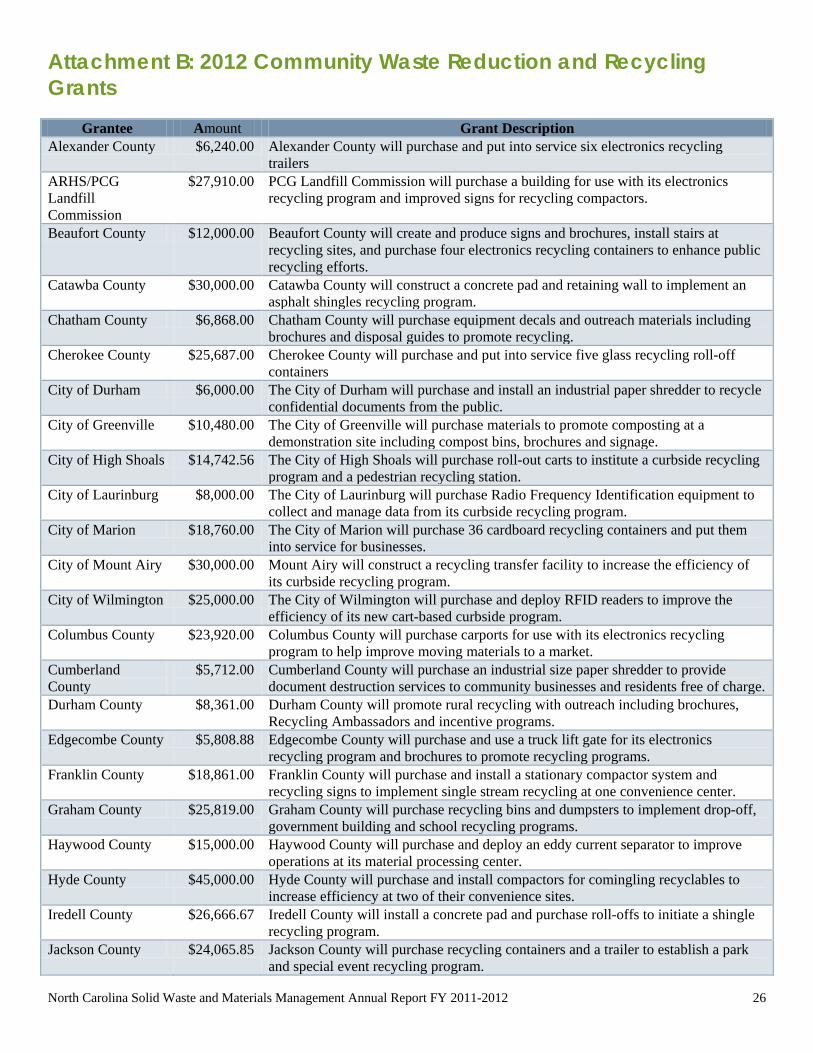
Attachment A: Annual Statutory Trust Fund Revenue Sources The North Carolina Solid Waste Management Trust Fund receives the bulk of its revenues from four main statutory sources. Details on these sources are provided below. Scrap Tire Tax A two percent fee is levied on the purchase of new tires in North Carolina, with revenues distributed to five main purposes. The tire tax allocation is as follows: 70% of revenues are distributed to the counties on a per capita basis to pay for the proper management
of discarded tires. 17% of revenues are credited to the Scrap Tire Disposal Account (administered by the Division of Waste
Management’s Solid Waste Section) for local government grants and nuisance tire site cleanup. 8% of revenues are credited to the Solid Waste Management Trust Fund. 2.5% to the Bernard Allen Memorial Emergency Drinking Water Fund 2.5% to the Inactive Hazardous Sites Cleanup Fund
White Goods Tax A $3 fee is levied on the purchase of major appliance in North Carolina, with revenues distributed to three main purposes. The white goods tax allocation is as follows: 72% of revenues are distributed to the counties on a per capita basis to pay for the proper management
of discarded white goods. 20% of revenues are credited to the White Goods Management Account (administered by the Division
of Waste Management’s Solid Waste Section) for grants to local governments for managing discarded white goods.
8% of revenues are credited to the Solid Waste Management Trust Fund. Solid Waste Disposal Tax A $2 per ton fee is levied on disposed solid waste at North Carolina landfills and at transfer stations that send solid waste out-of-state for disposal. The disposal tax revenues are distributed to three main purposes: 50% is distributed to the Division of Waste Management’s Inactive Hazardous Waste Sites clean-up
program to assess and remediate contamination at older, unlined landfills. 37.5% is distributed directly to municipalities and counties for operation of solid waste and recycling
programs. 12.5% is distributed to the Solid Waste Trust Fund for local government recycling grants.
Virgin Newsprint Tax North Carolina newspaper publishers who fail to meet state-required purchasing goals for recycled content newsprint must pay a $15 per ton tax on the virgin newsprint they consume. The law allows wide exemptions for companies who are unable to purchase recycled content newsprint due to availability or pricing constraints, or who are actively involved in the recovery of newspaper for recycling.
North Carolina Solid Waste and Materials Management Annual Report FY 2011-2012 26
Attachment B: 2012 Community Waste Reduction and Recycling Grants
Grantee Amount Grant Description Alexander County $6,240.00 Alexander County will purchase and put into service six electronics recycling
trailers ARHS/PCG Landfill Commission
$27,910.00 PCG Landfill Commission will purchase a building for use with its electronics recycling program and improved signs for recycling compactors.
Beaufort County $12,000.00 Beaufort County will create and produce signs and brochures, install stairs at recycling sites, and purchase four electronics recycling containers to enhance public recycling efforts.
Catawba County $30,000.00 Catawba County will construct a concrete pad and retaining wall to implement an asphalt shingles recycling program.
Chatham County $6,868.00 Chatham County will purchase equipment decals and outreach materials including brochures and disposal guides to promote recycling.
Cherokee County $25,687.00 Cherokee County will purchase and put into service five glass recycling roll-off containers
City of Durham $6,000.00 The City of Durham will purchase and install an industrial paper shredder to recycle confidential documents from the public.
City of Greenville $10,480.00 The City of Greenville will purchase materials to promote composting at a demonstration site including compost bins, brochures and signage.
City of High Shoals $14,742.56 The City of High Shoals will purchase roll-out carts to institute a curbside recycling program and a pedestrian recycling station.
City of Laurinburg $8,000.00 The City of Laurinburg will purchase Radio Frequency Identification equipment to collect and manage data from its curbside recycling program.
City of Marion $18,760.00 The City of Marion will purchase 36 cardboard recycling containers and put them into service for businesses.
City of Mount Airy $30,000.00 Mount Airy will construct a recycling transfer facility to increase the efficiency of its curbside recycling program.
City of Wilmington $25,000.00 The City of Wilmington will purchase and deploy RFID readers to improve the efficiency of its new cart-based curbside program.
Columbus County $23,920.00 Columbus County will purchase carports for use with its electronics recycling program to help improve moving materials to a market.
Cumberland County
$5,712.00 Cumberland County will purchase an industrial size paper shredder to provide document destruction services to community businesses and residents free of charge.
Durham County $8,361.00 Durham County will promote rural recycling with outreach including brochures, Recycling Ambassadors and incentive programs.
Edgecombe County $5,808.88 Edgecombe County will purchase and use a truck lift gate for its electronics recycling program and brochures to promote recycling programs.
Franklin County $18,861.00 Franklin County will purchase and install a stationary compactor system and recycling signs to implement single stream recycling at one convenience center.
Graham County $25,819.00 Graham County will purchase recycling bins and dumpsters to implement drop-off, government building and school recycling programs.
Haywood County $15,000.00 Haywood County will purchase and deploy an eddy current separator to improve operations at its material processing center.
Hyde County $45,000.00 Hyde County will purchase and install compactors for comingling recyclables to increase efficiency at two of their convenience sites.
Iredell County $26,666.67 Iredell County will install a concrete pad and purchase roll-offs to initiate a shingle recycling program.
Jackson County $24,065.85 Jackson County will purchase recycling containers and a trailer to establish a park and special event recycling program.

North Carolina Solid Waste and Materials Management Annual Report FY 2011-2012 27
Grantee Amount Grant Description Lincoln County $15,000.00 Lincoln County will construct a building to house a baler to improve cardboard
recycling operations. Madison County $8,000.00 Madison County will purchase and put into use poly bulk containers and labels to
improve recycling collection operations. Mitchell County $9,106.66 Mitchell County will purchase roll-off containers with lids for use in its cardboard
recycling program. Moore County $89,166.00 Moore County in conjunction with the Village of Pinehurst will purchase building
materials and equipment to operate a recyclables transfer station. Nash County $22,500.00 Nash County will purchase and install two stationary compactor systems to
implement single stream recycling at two convenience centers. Onslow County $20,000.00 Onslow County will install bunkers to improve and expand throughput at its material
recovery facility. Pasquotank County $27,083.00 Pasquotank County will build storage and handling capacity to start recycling of
shingles and carpet. Person County $17,342.00 Person County will purchase a box handler to increase the efficiency of its plastics
recycling and will purchase equipment needed to implement a program to collect used motor oil, used antifreeze, and used oil filters.
Pitt County $25,000.00 Pitt County will install a cement pad and concrete barriers to facilitate the recycling of construction and demolition materials.
Rutherford County $8,160.00 Rutherford County will purchase and put into service two swap sheds, a truck lift gate, 40 - 44 gallon recycling bins, and 5 - 95 gallon rollout bins.
Stokes County $20,000.00 Stokes County will purchase a skid steer to assist in handling recycled electronics. Town of Davidson $11,225.00 City of Davidson will purchase recycling containers for pedestrians and event
recycling in its downtown business district. Town of Dobson $8,720.00 The Town of Dobson will purchase and put into service 10 pedestrian recycling
collection containers. Town of Edenton $10,681.00 The Town of Edenton will buy recycling receptacles, signs, and educational
materials to implement a pedestrian recycling program. Town of Fontana Dam
$8,758.00 Fontana Dam will purchase recycling bins and dumpsters to implement a municipal recycling program.
Town of Hayesville $3,800.00 The Town of Hayesville will purchase and put into service 320 recycling collection containers for town residents.
Town of Kure Beach
$800.00 The Town of Kure Beach will design print and distribute brochures to educate citizens on recycling opportunities.
Town of Lake Santeetlah
$11,513.00 Lake Santeetlah will purchase recycling bins and a recycling trailer to implement a drop-off recycling program.
Town of Nashville $1,613.00 The Town of Nashville will purchase, install and promote four downtown pedestrian recycling containers.
Town of Robbinsville
$12,824.00 The Town of Robbinsville will purchase recycling bins and a trailer to implement a town-wide curbside and government building recycling program.
Town of Sunset Beach
$2,606.00 The Town of Sunset Beach will purchase, install and promote a Solar Belly recycling station at a beach access.
Town of Tarboro $10,833.33 The Town of Tarboro will purchase a portable recycling trailer for citizens to use for drop-off recycling at its public works office, and can be moved to provide special event recycling as needed.
Town of Walkertown
$2,950.00 The Town of Walkertown will purchase recycling carts and a dumpster in order to implement park recycling and recycling at special events.
Watauga County $14,200.00 Watauga County will purchase and put into use a forklift to improve operations at its recycling center.
Wayne County $20,000.00 Wayne County will purchase a skid steer to assist in carpet loading and recycling. Wilkes County $20,000.00 Wilkes County will purchase a skid-steer with bucket and pallet fork attachments to
manage electronics and other recyclables.

North Carolina Solid Waste and Materials Management Annual Report FY 2011-2012 28
Grantee Amount Grant Description Wilson County $100,000.00 Wilson County will construct a recycling transfer facility to increase program
efficiency for both county and municipal recycling programs.
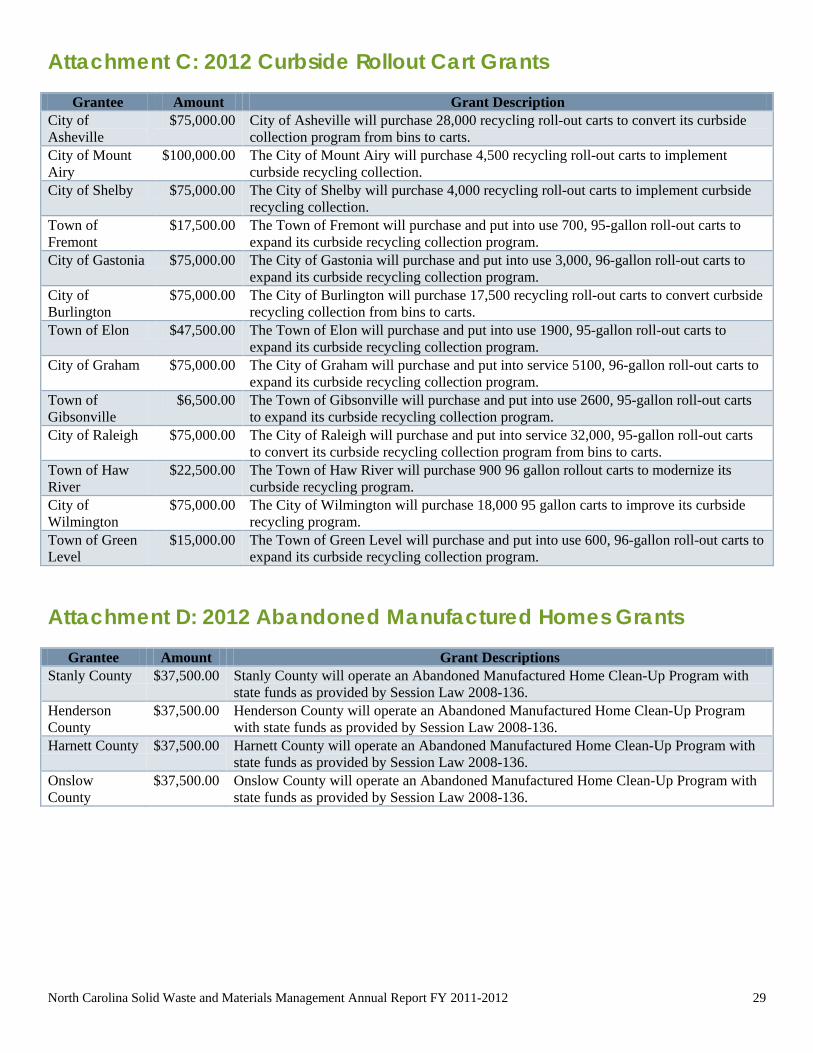
North Carolina Solid Waste and Materials Management Annual Report FY 2011-2012 29
Attachment C: 2012 Curbside Rollout Cart Grants
Grantee Amount Grant Description City of Asheville
$75,000.00 City of Asheville will purchase 28,000 recycling roll-out carts to convert its curbside collection program from bins to carts.
City of Mount Airy
$100,000.00 The City of Mount Airy will purchase 4,500 recycling roll-out carts to implement curbside recycling collection.
City of Shelby $75,000.00 The City of Shelby will purchase 4,000 recycling roll-out carts to implement curbside recycling collection.
Town of Fremont
$17,500.00 The Town of Fremont will purchase and put into use 700, 95-gallon roll-out carts to expand its curbside recycling collection program.
City of Gastonia $75,000.00 The City of Gastonia will purchase and put into use 3,000, 96-gallon roll-out carts to expand its curbside recycling collection program.
City of Burlington
$75,000.00 The City of Burlington will purchase 17,500 recycling roll-out carts to convert curbside recycling collection from bins to carts.
Town of Elon $47,500.00 The Town of Elon will purchase and put into use 1900, 95-gallon roll-out carts to expand its curbside recycling collection program.
City of Graham $75,000.00 The City of Graham will purchase and put into service 5100, 96-gallon roll-out carts to expand its curbside recycling collection program.
Town of Gibsonville
$6,500.00 The Town of Gibsonville will purchase and put into use 2600, 95-gallon roll-out carts to expand its curbside recycling collection program.
City of Raleigh $75,000.00 The City of Raleigh will purchase and put into service 32,000, 95-gallon roll-out carts to convert its curbside recycling collection program from bins to carts.
Town of Haw River
$22,500.00 The Town of Haw River will purchase 900 96 gallon rollout carts to modernize its curbside recycling program.
City of Wilmington
$75,000.00 The City of Wilmington will purchase 18,000 95 gallon carts to improve its curbside recycling program.
Town of Green Level
$15,000.00 The Town of Green Level will purchase and put into use 600, 96-gallon roll-out carts to expand its curbside recycling collection program.
Attachment D: 2012 Abandoned Manufactured Homes Grants
Grantee Amount Grant Descriptions Stanly County $37,500.00 Stanly County will operate an Abandoned Manufactured Home Clean-Up Program with
state funds as provided by Session Law 2008-136. Henderson County
$37,500.00 Henderson County will operate an Abandoned Manufactured Home Clean-Up Program with state funds as provided by Session Law 2008-136.
Harnett County $37,500.00 Harnett County will operate an Abandoned Manufactured Home Clean-Up Program with state funds as provided by Session Law 2008-136.
Onslow County
$37,500.00 Onslow County will operate an Abandoned Manufactured Home Clean-Up Program with state funds as provided by Session Law 2008-136.
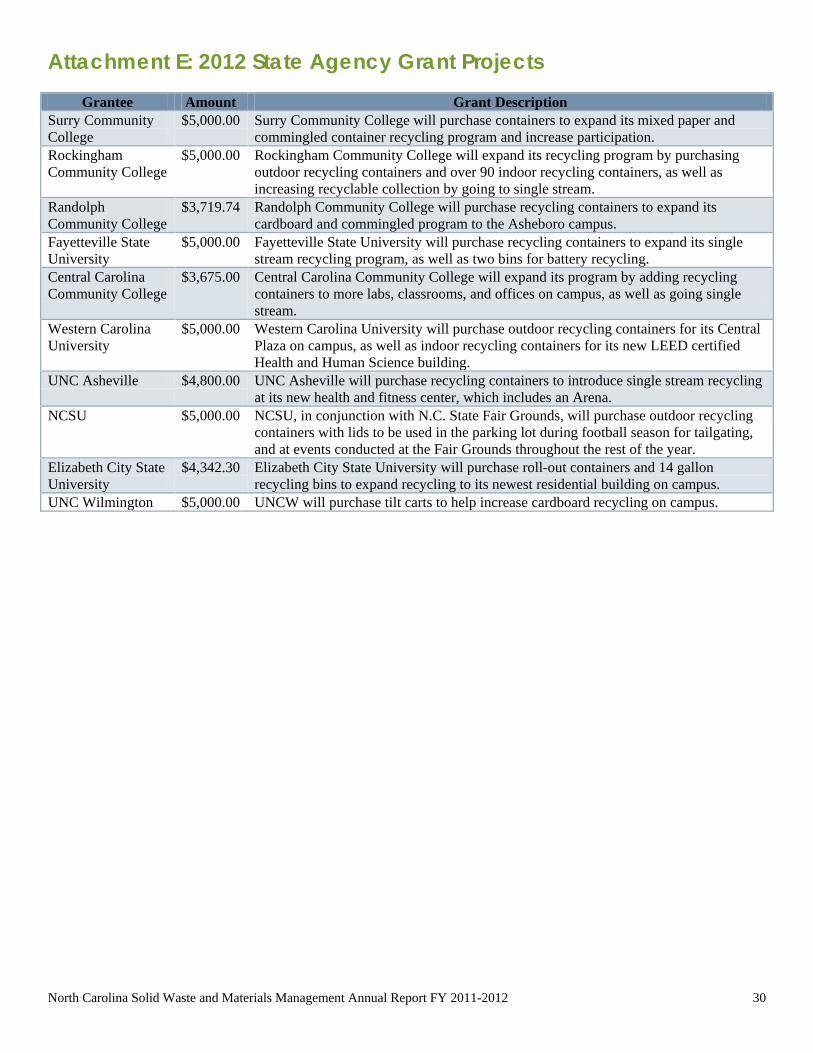
North Carolina Solid Waste and Materials Management Annual Report FY 2011-2012 30
Attachment E: 2012 State Agency Grant Projects
Grantee Amount Grant Description Surry Community College
$5,000.00 Surry Community College will purchase containers to expand its mixed paper and commingled container recycling program and increase participation.
Rockingham Community College
$5,000.00 Rockingham Community College will expand its recycling program by purchasing outdoor recycling containers and over 90 indoor recycling containers, as well as increasing recyclable collection by going to single stream.
Randolph Community College
$3,719.74 Randolph Community College will purchase recycling containers to expand its cardboard and commingled program to the Asheboro campus.
Fayetteville State University
$5,000.00 Fayetteville State University will purchase recycling containers to expand its single stream recycling program, as well as two bins for battery recycling.
Central Carolina Community College
$3,675.00 Central Carolina Community College will expand its program by adding recycling containers to more labs, classrooms, and offices on campus, as well as going single stream.
Western Carolina University
$5,000.00 Western Carolina University will purchase outdoor recycling containers for its Central Plaza on campus, as well as indoor recycling containers for its new LEED certified Health and Human Science building.
UNC Asheville $4,800.00 UNC Asheville will purchase recycling containers to introduce single stream recycling at its new health and fitness center, which includes an Arena.
NCSU $5,000.00 NCSU, in conjunction with N.C. State Fair Grounds, will purchase outdoor recycling containers with lids to be used in the parking lot during football season for tailgating, and at events conducted at the Fair Grounds throughout the rest of the year.
Elizabeth City State University
$4,342.30 Elizabeth City State University will purchase roll-out containers and 14 gallon recycling bins to expand recycling to its newest residential building on campus.
UNC Wilmington $5,000.00 UNCW will purchase tilt carts to help increase cardboard recycling on campus.

North Carolina Solid Waste and Materials Management Annual Report FY 2011-2012 31
Attachment F: 2012 Recycling Business Grant Projects
Grantee Amount Grant Description A Greener World Recycling
$2,800.00 A Greener World will purchase recycling bins and a dependable collection vehicle to assist in servicing its expanding customer base.
AAA Hauling of NC $40,000.00 AAA Hauling will purchase mobile material handling equipment to more efficiently move incoming loads of C&D and sorted material.
Abbey Green $40,000.00 Abbey Green will install a fixed trommel section to its fines line to enhance the screening on their production line.
American Recycling of WNC
$20,000.00 American Recycling will purchase a skid steer loader to handle material in the Asheville facility
Antique Reclaimed Lumber
$23,000.00 Antique Reclaimed Lumber will purchase equipment and expand the processing capabilities at its existing wood reclamation facility.
APAC Atlantic, Inc. - Asheboro
$20,000.00 APAC-Atlantic will install a clear-span fabric building at is asphalt plant, allowing for storage of processed recycled shingles for use in hot mix asphalt.
Barnhill Contracting $25,000.00 Barnhill Contracting will install a recycling bin, conveyor and other components to produce asphalt mixes using recycled shingles at its asphalt plant in Rocky Mount.
Benfield Sanitation Serivices
$20,000.00 Benfield Sanitation Services will install a conveyor system under the glass breaker at its existing MRF in Mooresville.
BevCon, LLC $10,000.00 BevCon will establish an aggregation facility to hold the daily collections of BevCon LLC and other small collectors in the southeastern region of NC.
BlackGold Operating Services , LLC
$20,000.00 Black-Gold will purchase and put into use equipment for commercial haulers to recycle its fats, oils, and grease waste from restaurant grease traps to be processed into a bio-fuel for use in industrial boilers.
Boggs Paving $30,000.00 Boggs Paving will invest in a set of truck scales at its asphalt shingle recycling plant. Coastal Ladies Carting
$10,000.00 Coastal Ladies Carting will purchase front-load dumpsters and residential containers for recycling.
DC Foam $10,000.00 DC Foam will purchase a collection truck to expand carpet recovery in the Greensboro and Winston-Salem market areas.
Elastrix, LLC $20,000.00 Elastrix will purchase eight Smooth Mills that will be used for loop milling in its rubber recycling plant.
Envision Plastics $15,000.00 Envision will purchase and install batch mixers with air inducers, dryers and vacuum equipment to allow the facilitate to clean and dry more plastic residuals.
Foster-Caviness Foodservice
$40,000.00 Foster-Caviness will purchase and install additional worm bins, worms and other equipment to increase its food diversion program.
Gallins Family Farm $38,700.00 Gallins Family Farm will purchase food collection containers and a front end loader and modify a truck to increase its compost production.
Greasecycle, LLC $25,000.00 Greasecycle will purchase 3 10,000 gallon storage tanks to increase its grease trap handling capacity.
Green Recycling Solutions
$40,000.00 Green Recycling Solutions will purchase recycling equipment and rolling stock to assist in the development of its construction and demolition processing facility.
Jackson Paper Manufacturing
$40,000.00 Jackson Paper will install equipment to convert waste "rag rope" generated from its recycled fiber mill operations into separate streams of scrap metal and boiler fuel.
Junk Rescue Co. $15,000.00 Junk Rescue will purchase 15 hook lift containers for use in its recycling facility to assist in the sorting, storage and movement of material.
Kemp Recyclers $20,000.00 Kemp Recyclers will purchase an eddy current and cross-belt magnet to assist in the recovery of aluminum and metal at its existing material recovery facility.
Marves Industries $10,000.00 Marves Industries will install a recycling line to handle post-production scrap and the return of its customers’ scrap to be processed and incorporated into new production.
MAYtime Composting Systems
$25,000.00 Maytime will have a building constructed, and will purchase and install assorted vermicomposting equipment and worms for their composting operation.
Metech Recycling $10,000.00 Metech will rebuild a shear shredder at its recycling facility to assist in the
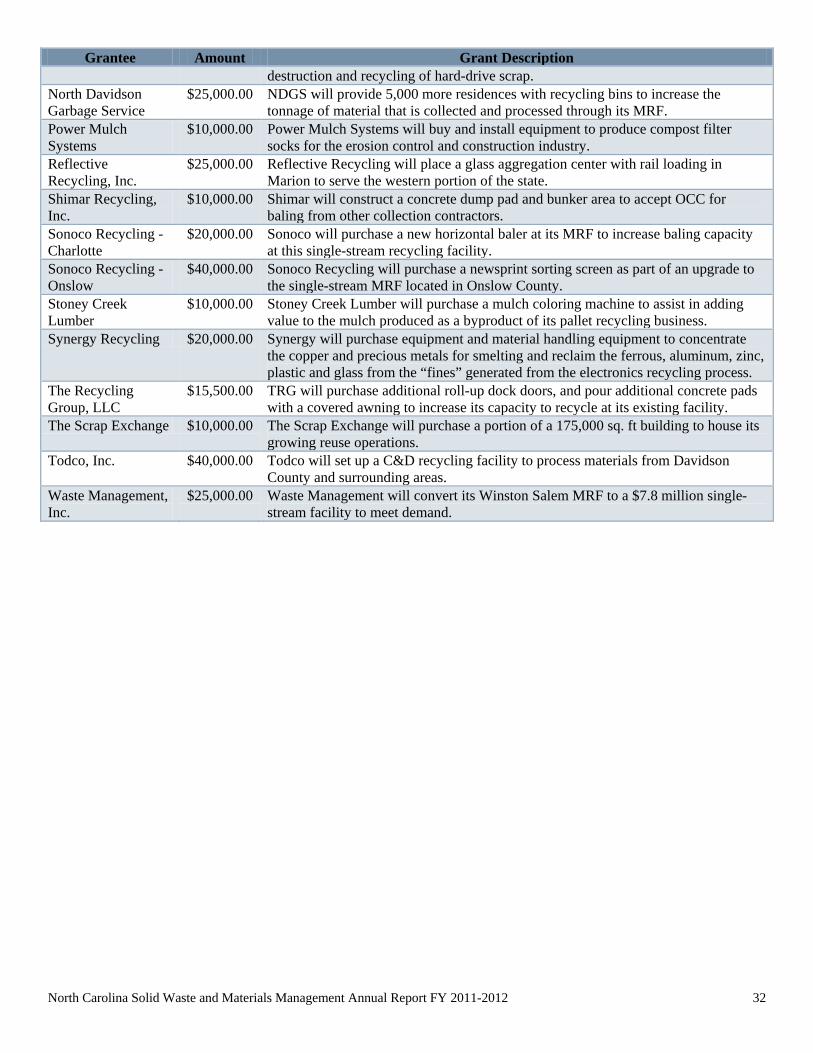
North Carolina Solid Waste and Materials Management Annual Report FY 2011-2012 32
Grantee Amount Grant Description destruction and recycling of hard-drive scrap.
North Davidson Garbage Service
$25,000.00 NDGS will provide 5,000 more residences with recycling bins to increase the tonnage of material that is collected and processed through its MRF.
Power Mulch Systems
$10,000.00 Power Mulch Systems will buy and install equipment to produce compost filter socks for the erosion control and construction industry.
Reflective Recycling, Inc.
$25,000.00 Reflective Recycling will place a glass aggregation center with rail loading in Marion to serve the western portion of the state.
Shimar Recycling, Inc.
$10,000.00 Shimar will construct a concrete dump pad and bunker area to accept OCC for baling from other collection contractors.
Sonoco Recycling - Charlotte
$20,000.00 Sonoco will purchase a new horizontal baler at its MRF to increase baling capacity at this single-stream recycling facility.
Sonoco Recycling - Onslow
$40,000.00 Sonoco Recycling will purchase a newsprint sorting screen as part of an upgrade to the single-stream MRF located in Onslow County.
Stoney Creek Lumber
$10,000.00 Stoney Creek Lumber will purchase a mulch coloring machine to assist in adding value to the mulch produced as a byproduct of its pallet recycling business.
Synergy Recycling $20,000.00 Synergy will purchase equipment and material handling equipment to concentrate the copper and precious metals for smelting and reclaim the ferrous, aluminum, zinc, plastic and glass from the “fines” generated from the electronics recycling process.
The Recycling Group, LLC
$15,500.00 TRG will purchase additional roll-up dock doors, and pour additional concrete pads with a covered awning to increase its capacity to recycle at its existing facility.
The Scrap Exchange $10,000.00 The Scrap Exchange will purchase a portion of a 175,000 sq. ft building to house its growing reuse operations.
Todco, Inc. $40,000.00 Todco will set up a C&D recycling facility to process materials from Davidson County and surrounding areas.
Waste Management, Inc.
$25,000.00 Waste Management will convert its Winston Salem MRF to a $7.8 million single-stream facility to meet demand.

North Carolina Solid Waste and Materials Management Annual Report FY 2011-2012 33
Local Government Waste Reduction Activities and Recycling Markets Annual reports received from local governments provide data on public source reduction, reuse, recycling and composting activities statewide as well as other aspects of solid waste management. Data from these reports helps to produce a picture of waste reduction, recycling and materials management efforts in North Carolina. This data offers information that helps to gauge the relative effectiveness of local government programs in diverting materials from disposal and delivering them to industry for reprocessing. Data from these annual reports also helps to documents the trends in recycling and reuse program implementation. Source Reduction and Reuse Programs The total number of local governments with source reduction and/or reuse programs grew slightly during Fiscal Year 2011-12 (July 1, 2011 – June 30, 2012) to an all time high of 113 total programs. Promoting source reduction and local reuse options continues to be a cost effective method for helping citizens reduce the amount of solid waste discarded. A core group of local governments has shown continued interest in operating swap shop programs that allow for very cost-effective diversion of reusable products from disposal. During FY 2011-12, local governments reported operating 97 individual swap shops across the state. These swap-shop programs are local government sponsored locations for citizens to drop-off unwanted but re-useable goods and allowing others to collect those items for personal use. Swap-shop programs often involve minimal expense to initiate though they do typically require well thought-out ground rules and ongoing monitoring and maintenance to remain high-functioning. In FY 2011-12 data was gathered for the first time on the promotion of the phone book opt-out program. There were 27 local governments that reported the promotion of phone book opt-out programs through the industry sponsored consumer choice web site www.yellowpagesoptout.com. This program allows citizens to register to opt-out of receiving unwanted phone directories. Source reduction and reuse programs tend to be very popular with citizens in the communities where they are operated. On a cost per-ton basis these programs are typically one of most efficient diversion efforts a public recycling program can undertake. Despite this, less than 20% of local governments in North Carolina report promoting or operating waste reduction or reuse programs. Local Reduction/Reuse Programs Program Type FY
2005-06 FY 2006-07
FY 2007-08
FY 2008-09
FY 2009-10
FY 2010-11
FY 2011-12
Source Reduction Programs Backyard Composting 55 53 48 53 54 54 48 Grass Cycling 33 32 34 33 33 28 30 Junk Mail Reduction 59 55 59 57 60 62 61 Enviroshopping 25 26 21 23 29 29 28 Promotion of Non-toxics 23 22 17 18 26 24 24 Phone Book Opt-Out N/A N/A N/A N/A N/A N/A 27 Other 1 3 1 9 14 19 18
Reuse Programs Swap Shop Programs 37 32 31 32 29 31 31 Paint Exchange 18 19 18 18 17 17 20 Waste Exchange 3 3 2 2 2 3 4 Pallet Exchange 4 5 3 6 10 9 10 Other 5 4 8 8 6 9 11 Local Governments with Programs 102 95 97 96 105 108 113

North Carolina Solid Waste and Materials Management Annual Report FY 2011-2012 34
Local Government Recovery Materials recovery operations by local governments showed strong growth during FY 2011-12. Net local government recovery as demonstrated in the table below shows an increase in the total number of tons captured compared to FY 2010-11, with notable growth in the recovery of organics, electronics and construction and demolition debris. Several of these individual materials categories will be examined more closely later in this chapter. The increase in organics recovery can be attributed at least in part to the overall increase in vegetative debris resulting from the impact of Hurricane Irene in August of 2011. Local Government Recovery (Tons) and Performance Measures
Material FY 2002-03 FY 2003-04 FY 2004-05 FY 2005-06 FY 2006-07 Total Paper 275,538 267,371 303,514 292,641 305,615 Total Glass 51,433 52,117 44,003 45,421 51,883 Total Plastics 16,807 18,679 18,320 18,177 19,373 Total Metal* 109,723 114,097 109,612 108,488 96,884 Total Organics** 689,027 589,124 583,101 619,494 631,393 Special Wastes*** 5,926 6,271 6,690 6,955 8,304 Electronics and Televisions*** N/A N/A N/A N/A N/A Construction and Demolition Debris 20,002 24,084 20,292 24,001 40,352 Tires**** N/A N/A 113,670 146,177 187,273 Other 4,626 4,773 5,677 7,743 5,558 Totals 1,173,082 1,076,516 1,204,879 1,269,097 1,346,635 Per Capita Recovery (lbs.) 281.88 255.76 282.13 292.35 303.97 Recovery Ratio (Recycling:Disposal) 0.11 0.10 0.11 0.11 0.11
Local Government Recovery (Tons) and Performance Measures (continued)
Material FY 2007-08 FY 2008-09 FY 2009-10 FY 2010-11 FY 2011-12 Total Paper 321,019 342,008 343,031 347,622 344,758 Total Glass 56,837 69,446 75,124 86,163 96,819 Total Plastics 22,298 23,947 29,206 36,047 36,670 Total Metal* 84,740 69,242 61,251 57,681 51,545 Total Organics** 554,576 593,323 589,482 635,495 706,560 Special Wastes*** 7,195 8,433 7,225 7,085 6,914 Electronics and Televisions*** N/A N/A 4,574 7,452 14,688 Construction and Demolition Debris 59,501 33,209 41,400 48,748 116,124 Tires**** 142,160 147,055 119,177 97,323 121,552 Other 6,753 8,474 1,948 1,098 1,616 Totals 1,255,079 1,295,173 1,272,416 1,324,716 1,497,247 Per Capita Recovery (lbs.) 276.77 280.73 271.23 276.38 309.69 Recovery Ratio (Recycling:Disposal) 0.11 0.13 0.14 0.14 0.16
* Includes white goods, aluminum cans, steel cans and other metals. ** Includes yard waste, pallets, wood waste and food waste. *** For FY 2000-01 through FY 2008-09 Special Wastes includes electronics, used oil, oil filters, antifreeze, paint and batteries. Beginning in FY 2009-10 Special Wastes includes recovery from household hazardous waste programs, used motor oil, used oil filters, used antifreeze, lights containing mercury, pesticides and pesticide containers and specifically excludes electronics and televisions, which began being reported separately in FY 2009-10. **** For FY 2010-11 the tons of tires recovered include only those tires generated by N.C. local governments. In FY2009-10, this figure inadvertently included some tires from out-of-state sources and in fiscal years prior to FY 2009-10 the Tires figure has included all tires recovered at the private tire facilities in North Carolina, including those tires received at those facilities from sources outside of North Carolina.
The ratio of recycling to disposal increased to a new all-time high of 0.16 during FY 2011-12. This ratio is used to examine the success of materials recovery from year to year when compared to disposal, and is determined

North Carolina Solid Waste and Materials Management Annual Report FY 2011-2012 35
by comparing the amount of materials recovered by local governments to the amount of total waste disposal during any one year. The following chart demonstrates the increasing success of materials recovery programs in North Carolina over the past several years. Ratio of Recycling to Disposal – FY 1991-92 to FY 2011-12
Recovery of Particular Materials Significant demand exists in North Carolina and beyond for recovered materials as feedstock for a wide variety of industries. Although the generation of organic materials is erratic due to annual weather conditions and storm events, the recovery of organics primarily through mulching and composting, though increasingly from the recovery of food waste, remains the single largest component of local government recycling programs. During FY 2011-12 the recovery of organics constituted 47.2 percent of total local government recovery. Fiber and tires were the next two largest categories of materials recovered, contributing 23.0 percent and 8.1 percent respectively. Electronics and televisions are measured separately from other special wastes for the third year in a row as a result of the disposal ban on these materials that became effective on July 1, 2011, and combined represent 1.0% of total recovery. The following chart provides a material-specific look at local government recovery operations in FY 2011-12.
0.00
0.02
0.04
0.06
0.08
0.10
0.12
0.14
0.16
0.18

North Carolina Solid Waste and Materials Management Annual Report FY 2011-2012 36
Characterization of Local Government Recovery
Recovery of Traditional Materials Traditional recyclable materials include fiber or paper (corrugated cardboard, magazines, newspapers, office fiber and residential mixed paper) and containers (aluminum beverage cans, glass bottles and jars, plastic bottles and steel food containers). FY 2011-12 continued the steady growth in the successful capture of traditional materials with an overall 1.8 percent increase over FY 2010-11. The amount of containers recovered increased substantially, while the total fiber or paper recovery actually declined slightly reflecting the continued decrease in the circulation of printed newspapers and downsizing of those papers still in print. Tradition Recyclable Material Recovery FY 2000-01 to FY 2011-12
Glass 6.5% Plastic
2.4%
Metals 3.4%
Fiber 23.0%
Other 0.1% Electronics
1.0%
Special Wastes 0.5%
C&D 7.8%
Organics 47.2%
Tires 8.1%
-
100,000.00
200,000.00
300,000.00
400,000.00
500,000.00
600,000.00
Fiber (Tons)
Containers (Tons)
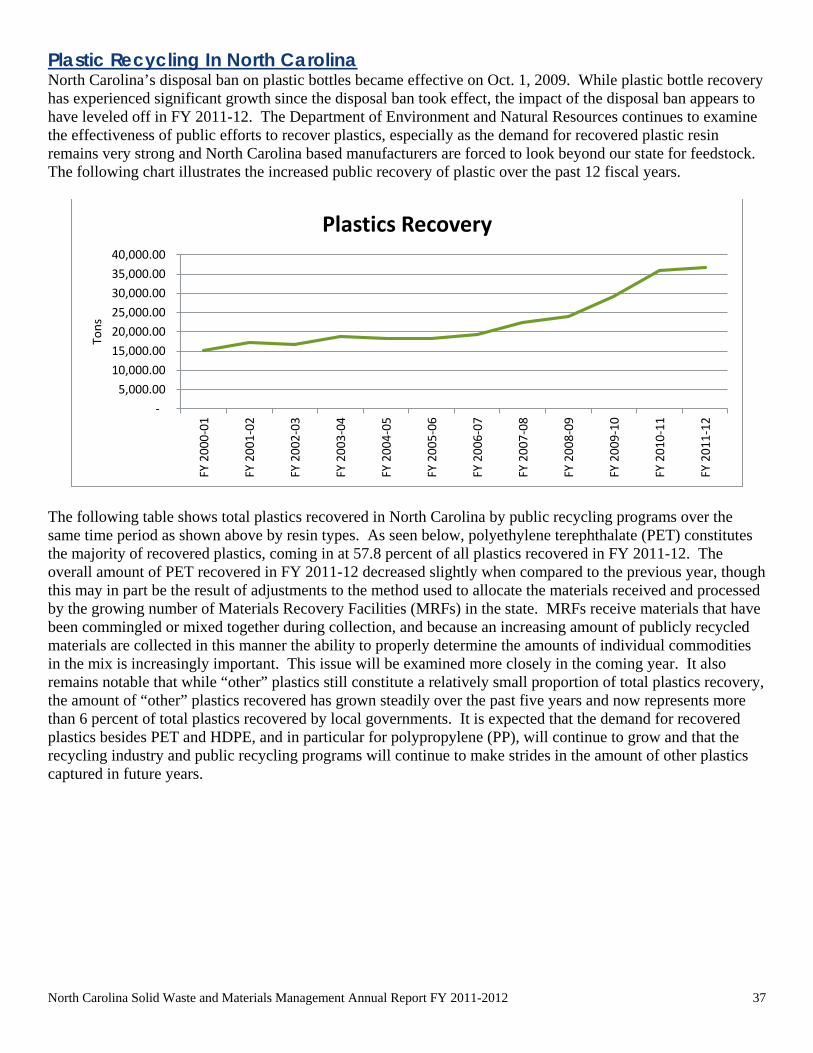
North Carolina Solid Waste and Materials Management Annual Report FY 2011-2012 37
Plastic Recycling In North Carolina North Carolina’s disposal ban on plastic bottles became effective on Oct. 1, 2009. While plastic bottle recovery has experienced significant growth since the disposal ban took effect, the impact of the disposal ban appears to have leveled off in FY 2011-12. The Department of Environment and Natural Resources continues to examine the effectiveness of public efforts to recover plastics, especially as the demand for recovered plastic resin remains very strong and North Carolina based manufacturers are forced to look beyond our state for feedstock. The following chart illustrates the increased public recovery of plastic over the past 12 fiscal years.
The following table shows total plastics recovered in North Carolina by public recycling programs over the same time period as shown above by resin types. As seen below, polyethylene terephthalate (PET) constitutes the majority of recovered plastics, coming in at 57.8 percent of all plastics recovered in FY 2011-12. The overall amount of PET recovered in FY 2011-12 decreased slightly when compared to the previous year, though this may in part be the result of adjustments to the method used to allocate the materials received and processed by the growing number of Materials Recovery Facilities (MRFs) in the state. MRFs receive materials that have been commingled or mixed together during collection, and because an increasing amount of publicly recycled materials are collected in this manner the ability to properly determine the amounts of individual commodities in the mix is increasingly important. This issue will be examined more closely in the coming year. It also remains notable that while “other” plastics still constitute a relatively small proportion of total plastics recovery, the amount of “other” plastics recovered has grown steadily over the past five years and now represents more than 6 percent of total plastics recovered by local governments. It is expected that the demand for recovered plastics besides PET and HDPE, and in particular for polypropylene (PP), will continue to grow and that the recycling industry and public recycling programs will continue to make strides in the amount of other plastics captured in future years.
- 5,000.00
10,000.00 15,000.00 20,000.00 25,000.00 30,000.00 35,000.00 40,000.00
FY 2
000-
01
FY 2
001-
02
FY 2
002-
03
FY 2
003-
04
FY 2
004-
05
FY 2
005-
06
FY 2
006-
07
FY 2
007-
08
FY 2
008-
09
FY 2
009-
10
FY 2
010-
11
FY 2
011-
12
Tons
Plastics Recovery

North Carolina Solid Waste and Materials Management Annual Report FY 2011-2012 38
Focus on Electronics The number of local governments operating an electronics recycling program has increased nearly four-fold in the past six years, adding twenty six (26) new programs in Fiscal Year 2011-12, the first full year since the implementation of North Carolina’s disposal ban on computer equipment and televisions became effective on July 1, 2011. The following chart examines the number of public electronics recycling programs over the past six fiscal years:
In addition to the strong growth in the number of electronics recycling programs, the amount of tons of electronics and televisions recovered by local governments during FY 2011-12 nearly doubled when compared to FY 2010-11. This increase can be directly attributed to the disposal ban and the implementation of the North Carolina Electronics Management Program. Most notable in the electronics recycling data for FY 2011-12 is the 174% increase in the amount of televisions recycled compared to the previous year.
-
5,000.00
10,000.00
15,000.00
20,000.00
25,000.00
30,000.00
35,000.00
40,000.00
Other Plastics
HDPE Bottles
PET Bottles
0
20
40
60
80
100
120
FY 2006-07 FY 2007-08 FY 2008-09 FY 2009-10 FY 2010-11 FY 2011-12
# Local Government Electronics Recycling Programs

North Carolina Solid Waste and Materials Management Annual Report FY 2011-2012 39
Electronics Recovery (Tons) FY 2008-09 – FY 2011-12
One of the ways to measure the success of publicly sponsored electronics recycling programs is to measure the pounds of electronic goods, including televisions, which are recovered per person. The following table illustrates the growth in per capita recovery of publically operated electronics recycling in North Carolina over the past four years.
As illustrated above, local governments in North Carolina have tripled their per capita recovery of electronics (including televisions) in the past four fiscal years, increasing from 0.84 pounds per person in FY 2008-09 to 3.04 pounds per person in FY 2011-12. The total recovery of electronics in North Carolina includes local government programs (shown above) plus materials recovered by the private sector through charities such as Goodwill, plus materials recovered through retail and manufacturer sponsored take-back programs. Data gathered as a part of North Carolina’s Electronics Management Program suggests that when combining public and private efforts, the total recovery of electronics in North Carolina in FY 2011-12 was more than 21,000 tons or 4.43 pounds per person. Despite this commendable progress in the effectiveness of overall efforts to recover electronics in North Carolina, total recovery in our state still lags somewhat behind when compared to states that have taken leadership roles in
-
2,000.00
4,000.00
6,000.00
8,000.00
10,000.00
12,000.00
14,000.00
16,000.00
FY 2008-09 FY 2009-10 FY 2010-11 FY 2011-12
Televisions (Tons)
Other Electronics (Tons)
-
0.50
1.00
1.50
2.00
2.50
3.00
3.50
FY 2008-09 FY 2009-10 FY 2010-11 FY 2011-12
Local Government Electronics Recycling Programs lbs per capita recovery

North Carolina Solid Waste and Materials Management Annual Report FY 2011-2012 40
managing electronics. For comparison, Oregon reported per-capita recovery of 6.3 lbs in 2010 and Washington reported 5.6 lbs per person in 2010. Local Government Recycling Program Management In FY 2011-12, the number of publicly operated curbside recycling programs in North Carolina continued a prominent growth trend for the fourth year in a row, climbing to a new high of 298 total programs. Access to efficient recyclable materials processing facilities coupled with the ease and efficiency of collecting commingled (single-stream) recyclables using carts remain important enablers for the growth and effectiveness of curbside recycling programs across North Carolina. As more communities gain access to single-stream processing and are therefore able to implement cart-based recycling programs, the number of public curbside recycling programs is expected to continue this promising growth.
The number of North Carolina households served by curbside recycling in FY 2011-12 grew to nearly 1.8 million, up from 1.68 million during FY 2010-11. According to the U.S. Census 2011 population estimate, there were 4.36 million housing units in North Carolina. Thus, 41.2 percent of households in the state have access to curbside recycling service. The continued growth in the number of households served by curbside recycling has been an ongoing trend, even during years when the state experienced a decrease in the total number of curbside recycling programs operated by local governments. In FY 2011-12 newly implemented curbside programs contributed to the above-described overall growth in the number of households with access to curbside recycling service. Communities implementing new curbside recycling programs are responding to a variety of factors including public demand for recycling services, increased ease and affordability of providing recycling services, access to single-stream processing, and a desire to comply with state disposal bans. Many of the new programs in FY 2011-12 continued to be programs serving smaller communities, though a portion of the growth in the number of households served by curbside recycling is still occurring at least in part due to growth in communities with existing curbside recycling programs. Four of the new curbside recycling programs established in FY 2011-12 were implemented with the assistance of the state’s Cart Grant Program operated by the Division of Environmental Assistance and Outreach, including the recycling programs in Kannapolis, Mount Airy, Red Cross and Shelby. A Focus on Carts As mentioned earlier, the ability to implement cart-based recycling programs has been an important development. Cart-based collection has contributed to expanding the ability of local governments to offer curbside recycling services and in helping to increase the effectiveness of existing curbside recycling programs.
0
50
100
150
200
250
300
350
# of Curbside Recycling Programs
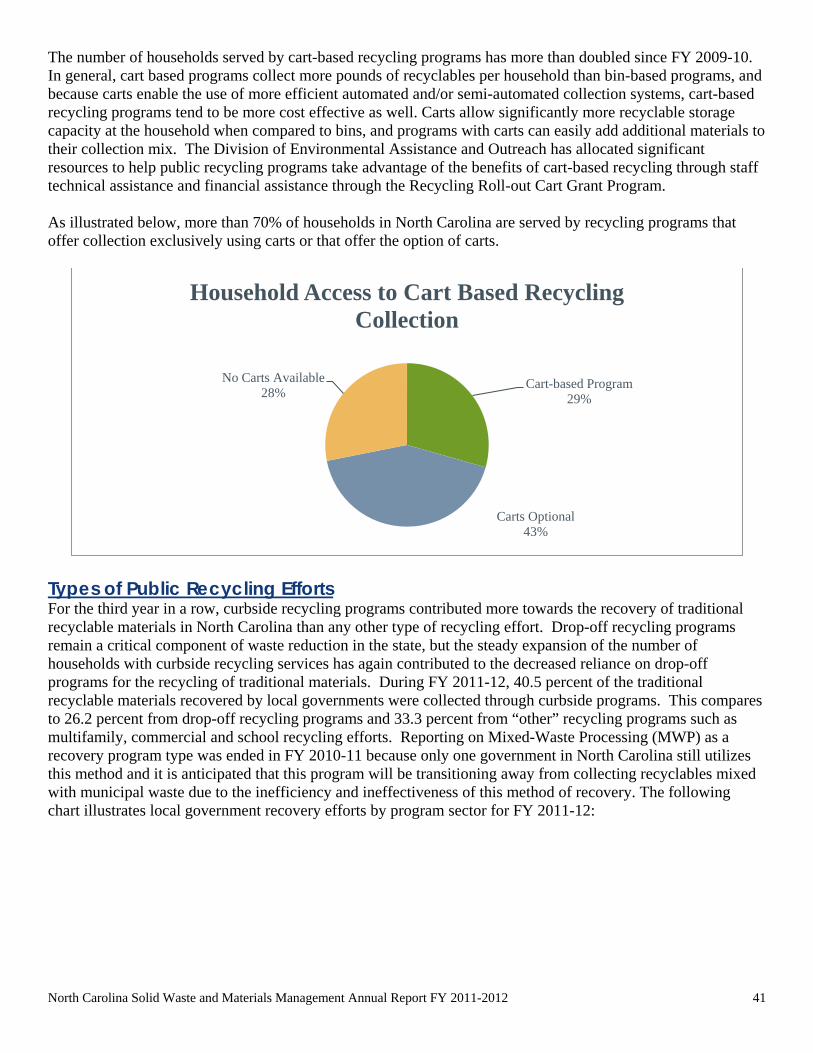
North Carolina Solid Waste and Materials Management Annual Report FY 2011-2012 41
The number of households served by cart-based recycling programs has more than doubled since FY 2009-10. In general, cart based programs collect more pounds of recyclables per household than bin-based programs, and because carts enable the use of more efficient automated and/or semi-automated collection systems, cart-based recycling programs tend to be more cost effective as well. Carts allow significantly more recyclable storage capacity at the household when compared to bins, and programs with carts can easily add additional materials to their collection mix. The Division of Environmental Assistance and Outreach has allocated significant resources to help public recycling programs take advantage of the benefits of cart-based recycling through staff technical assistance and financial assistance through the Recycling Roll-out Cart Grant Program. As illustrated below, more than 70% of households in North Carolina are served by recycling programs that offer collection exclusively using carts or that offer the option of carts.
Types of Public Recycling Efforts For the third year in a row, curbside recycling programs contributed more towards the recovery of traditional recyclable materials in North Carolina than any other type of recycling effort. Drop-off recycling programs remain a critical component of waste reduction in the state, but the steady expansion of the number of households with curbside recycling services has again contributed to the decreased reliance on drop-off programs for the recycling of traditional materials. During FY 2011-12, 40.5 percent of the traditional recyclable materials recovered by local governments were collected through curbside programs. This compares to 26.2 percent from drop-off recycling programs and 33.3 percent from “other” recycling programs such as multifamily, commercial and school recycling efforts. Reporting on Mixed-Waste Processing (MWP) as a recovery program type was ended in FY 2010-11 because only one government in North Carolina still utilizes this method and it is anticipated that this program will be transitioning away from collecting recyclables mixed with municipal waste due to the inefficiency and ineffectiveness of this method of recovery. The following chart illustrates local government recovery efforts by program sector for FY 2011-12:
Cart-based Program 29%
Carts Optional 43%
No Carts Available 28%
Household Access to Cart Based Recycling Collection

North Carolina Solid Waste and Materials Management Annual Report FY 2011-2012 42
Special Waste Management Management of special wastes remains an important role for municipalities and counties. Many programs that collect materials such as used oil, lead acid batteries, and household hazardous waste are now over two decades old. In FY 2012-12, the collection of automotive-related materials was a mixed picture. Used oil and oil filter collections were up while antifreeze declined slightly. Lead acid batteries collected through local programs continued to drop but that does not mean fewer batteries were recycled by the public. Because of positive market value of batteries, it is likely that more citizens are directly selling them at scrap yards and other recycling outlets. DENR requested data from communities on the collection of two additional materials for FY 2011-12: propane tanks and waste vegetable oil. Both materials have established markets and are becoming more common in municipal and county collection programs. Citizens brought in 47 tons of propane tanks and 142 tons of used cooking oil (the equivalent of 37,900 gallons) to local governments recycling sites in FY 2011-12. Many of the propane tanks went to reuse markets while much of the vegetable oil went to the manufacturing of biodiesel fuel. FY 2011-12 also saw an increase in the number of recycling programs collecting spent fluorescent tubes and compact fluorescent bulbs and a related increase in the tonnage of these materials, known as “lights containing mercury “ or LCMs. The 37.93 tons of LCMs recycled in local programs in FY 2011-12 represented a 20 percent increase over FY 2010-11. The expansion of recycling options for LCMs, which now includes acceptance at most major home improvement stores, will be assisted in FY 2012-13 by a new DENR LCM grant program for local governments. Pesticide and pesticide container programs are supported by long-standing assistance from the North Carolina Department of Agriculture and Consumer Services. Sixty-six pesticide container programs collection just over 118 tons in FY 2011-12, while 16 pesticide collection programs brought in 14.03 tons. The recycling of dry cell batteries increased but dedicated paint collection programs collected fewer gallons in FY 2011-12 compared to FY 2010-11. Eight local governments accepted another 1.7 tons of other special wastes, which included a mix of materials such as mercury thermostats and prescription drugs. Finally, as in years past, household hazardous waste programs continued to be operated by a minority of local governments in North Carolina. The performance of these programs has been fairly steady but total tonnage dropped slightly from FY 2010-11 to FY 2011-12, even though the total number of programs increased (programs were counted if a local government either conducted its own collection or contributed funding toward a partner program). The expense of HHW programs remains a barrier to their implementation.
Curbside Tons 40.5%
Drop-off tons 26.2%
Other Tons 33.3%
Local Government Recovery by Program Type

North Carolina Solid Waste and Materials Management Annual Report FY 2011-2012 43
Local Government Special Waste Management, FY 2007-08 to FY 2011-12 FY 2007-08 FY 2008-09 FY2009-10 FY 2010-11 FY 2011-12 Used Motor Oil
Number of programs 124 125 131 129 129 Gallons collected 901,565 822,748 845,270 858,389 860,785
Oil Filters Number of programs 32 62 103 106 105 Tons collected 37.94 56.29 137.2 167.89 184.41
Antifreeze Number of programs 62 68 74 72 74 Gallons collected 33,393 26,482 28,054 39,089 35,159
Lead Acid Batteries Number of programs 90 91 98 96 93 Tons collected 1,215 1,201 788 501 363
Dry Cell Batteries Number of programs NA NA NA 36 37 Tons collected NA NA NA 41.30 45.37
Paint Number of exchange programs NA NA NA 17 21 Number of other collection programs
NA NA NA 13 13
Total tons collected NA NA NA 143.27 117.94 Pesticide Containers
Number of programs NA NA NA 60 66 Tons collected NA NA NA 105.49 118.32
Pesticides Number of programs NA NA NA 16 16 Tons collected NA NA NA 7.48 14.03
Lights Containing Mercury Number of programs NA NA NA 33 48 Tons collected NA NA NA 28.81 37.93
Propane Tanks Number of programs NA NA NA NA 37 Tons collected NA NA NA NA 47.22
Special Wastes Number of programs NA NA NA 6 8 Tons collected NA NA NA 7.14 1.71
Household Haz. Waste Number of programs 34 40 52 53 57 Number of permanent sites 20 21 20 20 20 HHW tons collected 2,281.75 2,733.68 3,382.74 3,116.44 2,905.63 Total cost reported $2,849,781 $3,123,480 $3,787,369 $3,763,970 $3,860,467
Conversions: Oil, 1 gal = 7.4 lbs; Antifreeze, 1 gal = 8.42 lbs; Lead Acid Battery, 1 battery = 35.9 lbs; Paint, 1 gal = 11.5lbs; propane tank = 18 lbs; 1 gallon of waste vegetable oil = 7.5 lbs. Yard Waste Management Municipalities and counties managed a larger amount of yard waste in FY 2011-12 compared to FY 2010-11. Hurricane Irene played a role in some big jumps in tonnage, especially for eastern counties such as Edgecombe, Halifax, and Greene. The state’s yard waste disposal ban has now kept a cumulative 9.4 million tons out of landfills over the past 17 years.
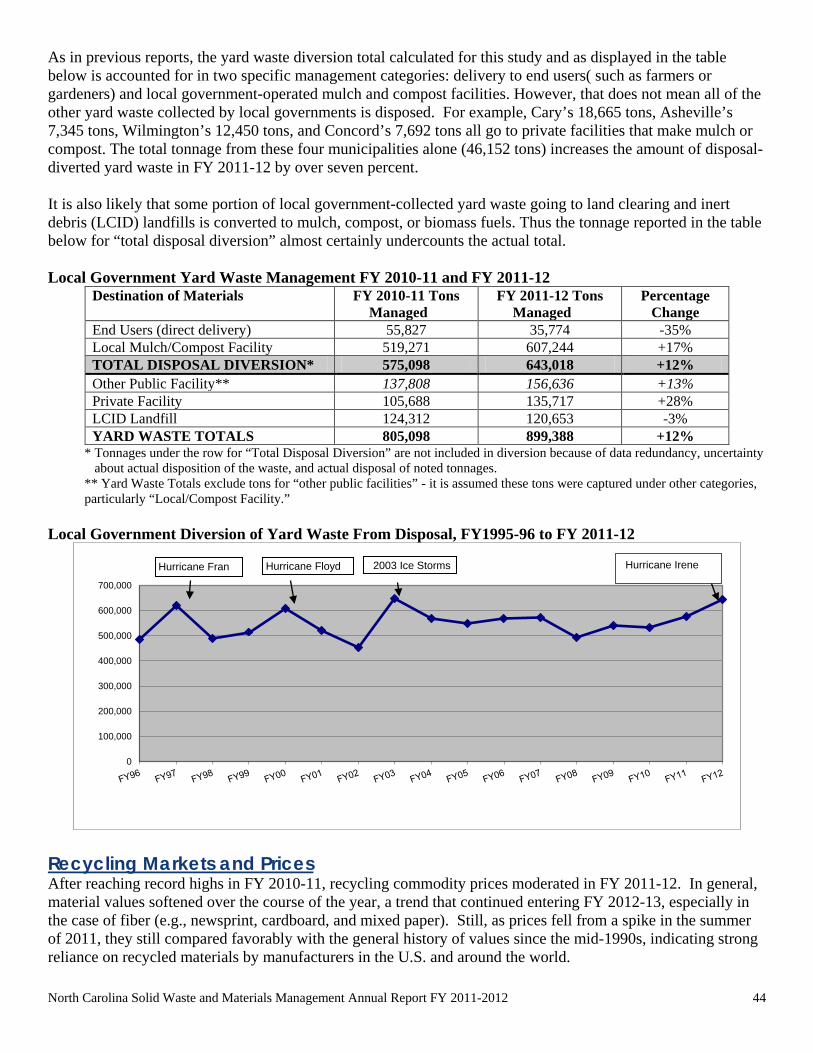
North Carolina Solid Waste and Materials Management Annual Report FY 2011-2012 44
As in previous reports, the yard waste diversion total calculated for this study and as displayed in the table below is accounted for in two specific management categories: delivery to end users( such as farmers or gardeners) and local government-operated mulch and compost facilities. However, that does not mean all of the other yard waste collected by local governments is disposed. For example, Cary’s 18,665 tons, Asheville’s 7,345 tons, Wilmington’s 12,450 tons, and Concord’s 7,692 tons all go to private facilities that make mulch or compost. The total tonnage from these four municipalities alone (46,152 tons) increases the amount of disposal-diverted yard waste in FY 2011-12 by over seven percent. It is also likely that some portion of local government-collected yard waste going to land clearing and inert debris (LCID) landfills is converted to mulch, compost, or biomass fuels. Thus the tonnage reported in the table below for “total disposal diversion” almost certainly undercounts the actual total. Local Government Yard Waste Management FY 2010-11 and FY 2011-12
Destination of Materials FY 2010-11 Tons Managed
FY 2011-12 Tons Managed
Percentage Change
End Users (direct delivery) 55,827 35,774 -35% Local Mulch/Compost Facility 519,271 607,244 +17% TOTAL DISPOSAL DIVERSION* 575,098 643,018 +12% Other Public Facility** 137,808 156,636 +13% Private Facility 105,688 135,717 +28% LCID Landfill 124,312 120,653 -3% YARD WASTE TOTALS 805,098 899,388 +12%
* Tonnages under the row for “Total Disposal Diversion” are not included in diversion because of data redundancy, uncertainty about actual disposition of the waste, and actual disposal of noted tonnages. ** Yard Waste Totals exclude tons for “other public facilities” - it is assumed these tons were captured under other categories, particularly “Local/Compost Facility.”
Local Government Diversion of Yard Waste From Disposal, FY1995-96 to FY 2011-12
Recycling Markets and Prices After reaching record highs in FY 2010-11, recycling commodity prices moderated in FY 2011-12. In general, material values softened over the course of the year, a trend that continued entering FY 2012-13, especially in the case of fiber (e.g., newsprint, cardboard, and mixed paper). Still, as prices fell from a spike in the summer of 2011, they still compared favorably with the general history of values since the mid-1990s, indicating strong reliance on recycled materials by manufacturers in the U.S. and around the world.
0
100,000
200,000
300,000
400,000
500,000
600,000
700,000
Hurricane Fran Hurricane Floyd 2003 Ice Storms Hurricane Irene

North Carolina Solid Waste and Materials Management Annual Report FY 2011-2012 45
The table below, which reports the results of quarterly surveys of material recovery facilities (MRFs) in three regions in North Carolina, shows the price trends in FY 2011-12. While there was some steadiness for commodities such as glass and HDPE, most of the other materials saw a decline in value of between 20 to 50 percent. The overall “basket” of prices ended up much lower for FY 2011-12 than the year previous, perhaps reflecting a return to more normal expectations. Recycling Market Prices Received by Major N.C. Processors, FY 2011-12
Material Summer
2011 Fall 2011
Winter 2011-12
Spring 2012
Summer 2012
Aluminum Cans, lbs., loose $.91 $.79 $.80 $.77 $.72 Steel Cans, gross tons, baled $273 $220 $220 $221 $137 PET, lbs. baled $.30 $.29 $.21 $.30 $.16 HDPE Natural, lbs., baled $.34 $.34 $.30 $.36 $.29 Newsprint, ton, baled $146 $106 $78 $95 $85 Corrugated, ton, baled $183 $118 $127 $136 $120 Office paper, ton, baled $300 $168 $162 $170 $190 Mixed paper, ton, baled $155 $97 $82 $96 $86 Clear glass, ton $25 $25 $25 $25 $25 Brown glass, ton $18 $18 $18 $18 $18 Green glass, ton -$1 $7.50 $4 $7.50 $2.50
The graph below shows prices received for fiber materials by North Carolina MRFs since 1996, testifying to the relative volatility in paper markets over the past 16 years. Fiber has seen some dramatic swings in the past four years, in part due to the 2008 recession, then a very quick and strong rebound, followed by what may be a market correction due to the lackluster overall economy. The up-and-down nature of paper pricing can be especially challenging for MRFs. Typically, two thirds of their throughput is fiber and it is a main driver of both profitability and the ability to attract and pay suppliers. Market Prices Received for Fiber Materials by Major N.C. Processors, 1996 – 2012
0.00
50.00
100.00
150.00
200.00
250.00
300.00
350.00
Mar
-96
Aug
-96
Jan-
97Ju
n-97
Nov
-97
Apr
-98
Sep
-98
Feb-
99Ju
l-99
Dec
-99
May
-00
Oct
-00
Mar
-01
Aug
-01
Jan-
02Ju
n-02
Nov
-02
Apr
-03
Sep
-03
Feb-
04Ju
l-04
Dec
-04
May
-05
Oct
-05
Mar
-06
Aug
-06
Jan-
07Ju
n-07
Nov
-07
Apr
-08
Sep
-08
Feb-
09Ju
l-09
Dec
-09
May
-10
Oct
-10
Mar
-11
Aug
-11
Jan-
12Ju
n-12
Newsprint Cardboard Office Paper Mixed Paper
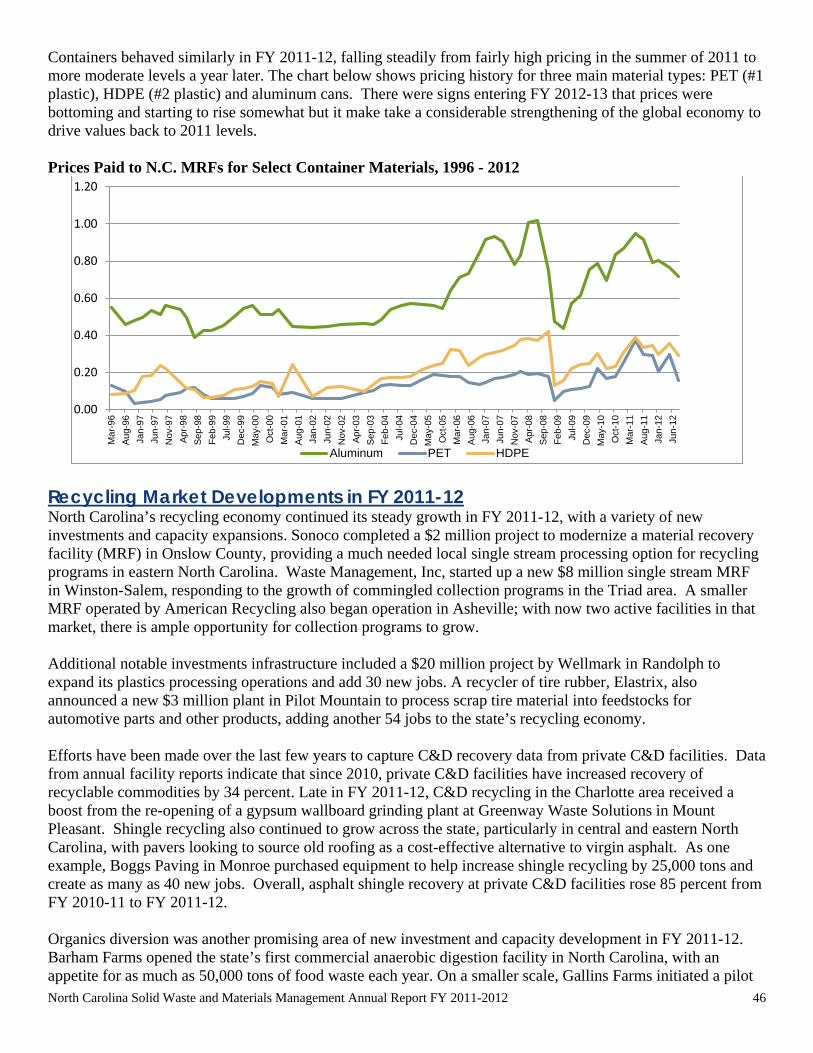
North Carolina Solid Waste and Materials Management Annual Report FY 2011-2012 46
Containers behaved similarly in FY 2011-12, falling steadily from fairly high pricing in the summer of 2011 to more moderate levels a year later. The chart below shows pricing history for three main material types: PET (#1 plastic), HDPE (#2 plastic) and aluminum cans. There were signs entering FY 2012-13 that prices were bottoming and starting to rise somewhat but it make take a considerable strengthening of the global economy to drive values back to 2011 levels. Prices Paid to N.C. MRFs for Select Container Materials, 1996 - 2012
Recycling Market Developments in FY 2011-12 North Carolina’s recycling economy continued its steady growth in FY 2011-12, with a variety of new investments and capacity expansions. Sonoco completed a $2 million project to modernize a material recovery facility (MRF) in Onslow County, providing a much needed local single stream processing option for recycling programs in eastern North Carolina. Waste Management, Inc, started up a new $8 million single stream MRF in Winston-Salem, responding to the growth of commingled collection programs in the Triad area. A smaller MRF operated by American Recycling also began operation in Asheville; with now two active facilities in that market, there is ample opportunity for collection programs to grow. Additional notable investments infrastructure included a $20 million project by Wellmark in Randolph to expand its plastics processing operations and add 30 new jobs. A recycler of tire rubber, Elastrix, also announced a new $3 million plant in Pilot Mountain to process scrap tire material into feedstocks for automotive parts and other products, adding another 54 jobs to the state’s recycling economy. Efforts have been made over the last few years to capture C&D recovery data from private C&D facilities. Data from annual facility reports indicate that since 2010, private C&D facilities have increased recovery of recyclable commodities by 34 percent. Late in FY 2011-12, C&D recycling in the Charlotte area received a boost from the re-opening of a gypsum wallboard grinding plant at Greenway Waste Solutions in Mount Pleasant. Shingle recycling also continued to grow across the state, particularly in central and eastern North Carolina, with pavers looking to source old roofing as a cost-effective alternative to virgin asphalt. As one example, Boggs Paving in Monroe purchased equipment to help increase shingle recycling by 25,000 tons and create as many as 40 new jobs. Overall, asphalt shingle recovery at private C&D facilities rose 85 percent from FY 2010-11 to FY 2011-12. Organics diversion was another promising area of new investment and capacity development in FY 2011-12. Barham Farms opened the state’s first commercial anaerobic digestion facility in North Carolina, with an appetite for as much as 50,000 tons of food waste each year. On a smaller scale, Gallins Farms initiated a pilot
0.00
0.20
0.40
0.60
0.80
1.00
1.20
Mar
-96
Aug
-96
Jan-
97Ju
n-97
Nov
-97
Apr
-98
Sep
-98
Feb-
99Ju
l-99
Dec
-99
May
-00
Oct
-00
Mar
-01
Aug
-01
Jan-
02Ju
n-02
Nov
-02
Apr
-03
Sep
-03
Feb-
04Ju
l-04
Dec
-04
May
-05
Oct
-05
Mar
-06
Aug
-06
Jan-
07Ju
n-07
Nov
-07
Apr
-08
Sep
-08
Feb-
09Ju
l-09
Dec
-09
May
-10
Oct
-10
Mar
-11
Aug
-11
Jan-
12Ju
n-12
Aluminum PET HDPE

North Carolina Solid Waste and Materials Management Annual Report FY 2011-2012 47
composting facility south of Winston-Salem, giving the Triad its first commercial food waste diversion operation. In Asheville, the sudden demise of a key composter posed challenges to a growing regional movement to collect food waste from restaurants and other food waste generators; the startup of a new facility in early FY 2012-13 by the leading food waste collector in Asheville appeared to fill the void. Additional recycling expansions across the state were partially assisted by the state’s Recycling Business Development Grant program. Projects included new investments at electronics processing facilities and a few key plastics reclaimers. A number of small regional haulers also increased their ability to offer recycling to residential subscription customers and a few of the state’s leading MRFs installed equipment to streamline material flow and to sort a broader array of materials. Rolltech, a manufacturer of molded wheels for garbage and recycling carts, also increased its production capacity, introducing a new wheel design with 100 percent recycled content. Despite some ups-and-downs in material pricing, the state’s private recycling infrastructure enjoyed progress on a number of fronts in FY 2011-12. Business activity was at a high level and a range of investments added new depth and strength to North Carolina’s recycling economy. The healthy demand for recyclable materials provides the state with opportunities to further reduce its dependence on landfill disposal and to further lengthen the service life of its existing landfills.
North Carolina Solid Waste and Materials Management Annual Report FY 2011-2012 48
Scrap Tire Management Scrap Tire Disposal Account The Scrap Tire Disposal Account was created by the 1993 General Assembly. The purpose of the account is to provide each county with funds for the disposal of scrap tires at no cost to citizens and businesses. The Division of Waste Management administers the program by providing additional funding grants to counties for the cleanup of illegal tire dumps and to repay cost overruns. Revenue for the scrap tire management program is derived from a one percent tax on the sale of new large tires and two percent tax on small tires.
Scrap Tire Disposal Account Balance FY 2011-12 Revenues Balance of Funds as of July 1, 2011 $2,299,553.42 Deposits Received FY 2011-12 685,812.62
Total Funds Available 2,985,366.04 Expenditures Cost Overrun Grants to County Programs $1,003,499.97 Nuisance Tire Site Cleanup Grants 121,560.75 Processed Tire Material Grants 0.00 Administrative Costs 92,576.28
Total Expenditures 1,217,637.00 Balance of Funds as of June 30, 2012 $1,767,729.04
Tire Tax Distributions FY 2011-12
Dept. of Revenue Cost of Collection $ 243,690.99 Scrap Tire Disposal Account* (17 percent) 2,817,364.03 Solid Waste Management Trust Fund (8 percent) 1,325,818.37 Distributed to Counties (70 percent) 11,600,910.66 Inactive Hazardous Sites Cleanup Fund (2.5 percent) 414,318.24 Bernard Allen Memorial Drinking Water Fund (2.5 percent)
414,318.24
Total Distributions $16,816,420.53 *The Scrap Tire Disposal Account received $685,812.62 for the FY2011-12. The amount of $2,131,551.41 was transferred by the General Assembly to the general fund.
Of the state's tire disposal tax revenue, 70 percent or $11,600,910.66 was distributed to counties on a per capita basis. This subsidized tire disposal costs for the counties, but did not cover the total expenses of some counties. Counties whose scrap tire disposal costs exceed the amount they receive in their allocation of the tire tax can apply for a grant from the scrap tire disposal account to cover the deficit. Historically, the amount of grant funds requested by counties has surpassed availability. Scrap tire legislation requires the division to consider county efforts to avoid free disposal of out-of-state tires and other ineligible tires and county program efficiency in using their allocated funds when making decisions about grant awards. The first grant cycle for the FY 2011-12 included grants to 45 counties totaling $408,467.41. The second grant cycle included grants to 41 counties totaling $595,032.56. The two grant cycles in 2011-12 totaling $1,003,499.97 are shown as Attachments A and B to this chapter. Processed Tire Material Market Development Grants The goal of the Division of Waste Management’s processed tire material market development grant program is to make scrap tire recycling sustainable in North Carolina. Since receiving its first allocation of funds in August 1997, the program has spent $4,475,883 on nine projects that created new or expanded existing markets
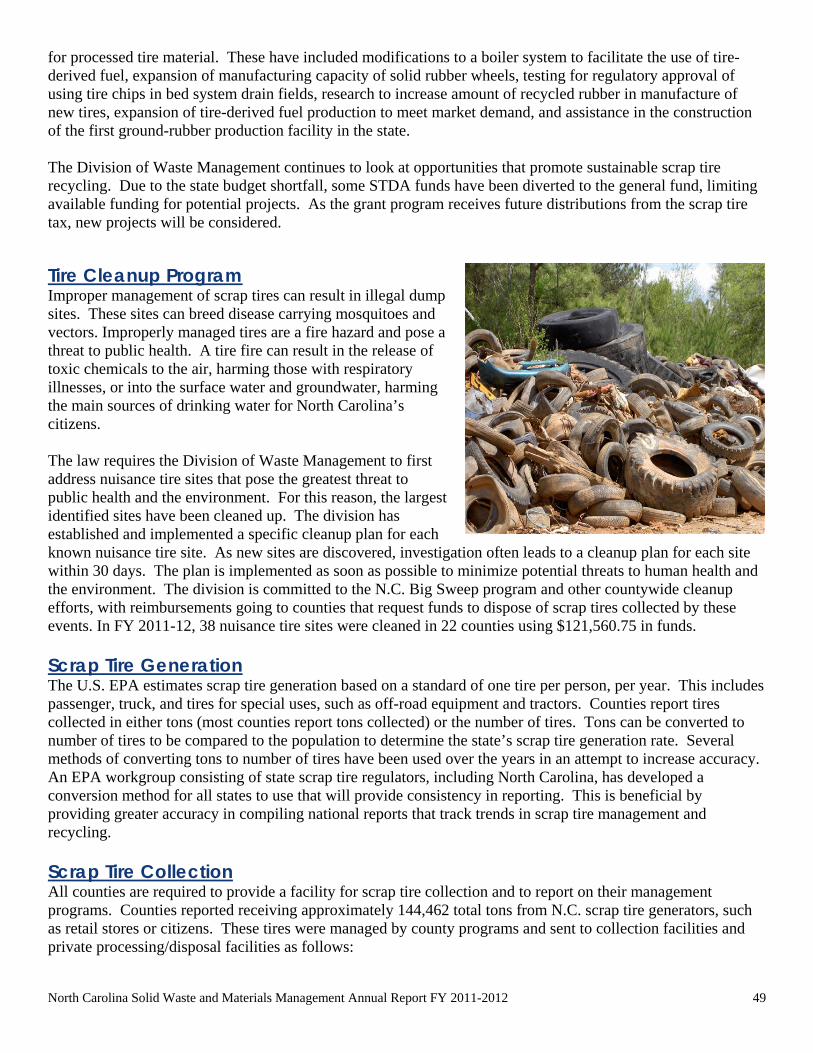
North Carolina Solid Waste and Materials Management Annual Report FY 2011-2012 49
for processed tire material. These have included modifications to a boiler system to facilitate the use of tire-derived fuel, expansion of manufacturing capacity of solid rubber wheels, testing for regulatory approval of using tire chips in bed system drain fields, research to increase amount of recycled rubber in manufacture of new tires, expansion of tire-derived fuel production to meet market demand, and assistance in the construction of the first ground-rubber production facility in the state. The Division of Waste Management continues to look at opportunities that promote sustainable scrap tire recycling. Due to the state budget shortfall, some STDA funds have been diverted to the general fund, limiting available funding for potential projects. As the grant program receives future distributions from the scrap tire tax, new projects will be considered.
Tire Cleanup Program Improper management of scrap tires can result in illegal dump sites. These sites can breed disease carrying mosquitoes and vectors. Improperly managed tires are a fire hazard and pose a threat to public health. A tire fire can result in the release of toxic chemicals to the air, harming those with respiratory illnesses, or into the surface water and groundwater, harming the main sources of drinking water for North Carolina’s citizens. The law requires the Division of Waste Management to first address nuisance tire sites that pose the greatest threat to public health and the environment. For this reason, the largest identified sites have been cleaned up. The division has established and implemented a specific cleanup plan for each known nuisance tire site. As new sites are discovered, investigation often leads to a cleanup plan for each site within 30 days. The plan is implemented as soon as possible to minimize potential threats to human health and the environment. The division is committed to the N.C. Big Sweep program and other countywide cleanup efforts, with reimbursements going to counties that request funds to dispose of scrap tires collected by these events. In FY 2011-12, 38 nuisance tire sites were cleaned in 22 counties using $121,560.75 in funds. Scrap Tire Generation The U.S. EPA estimates scrap tire generation based on a standard of one tire per person, per year. This includes passenger, truck, and tires for special uses, such as off-road equipment and tractors. Counties report tires collected in either tons (most counties report tons collected) or the number of tires. Tons can be converted to number of tires to be compared to the population to determine the state’s scrap tire generation rate. Several methods of converting tons to number of tires have been used over the years in an attempt to increase accuracy. An EPA workgroup consisting of state scrap tire regulators, including North Carolina, has developed a conversion method for all states to use that will provide consistency in reporting. This is beneficial by providing greater accuracy in compiling national reports that track trends in scrap tire management and recycling. Scrap Tire Collection All counties are required to provide a facility for scrap tire collection and to report on their management programs. Counties reported receiving approximately 144,462 total tons from N.C. scrap tire generators, such as retail stores or citizens. These tires were managed by county programs and sent to collection facilities and private processing/disposal facilities as follows:
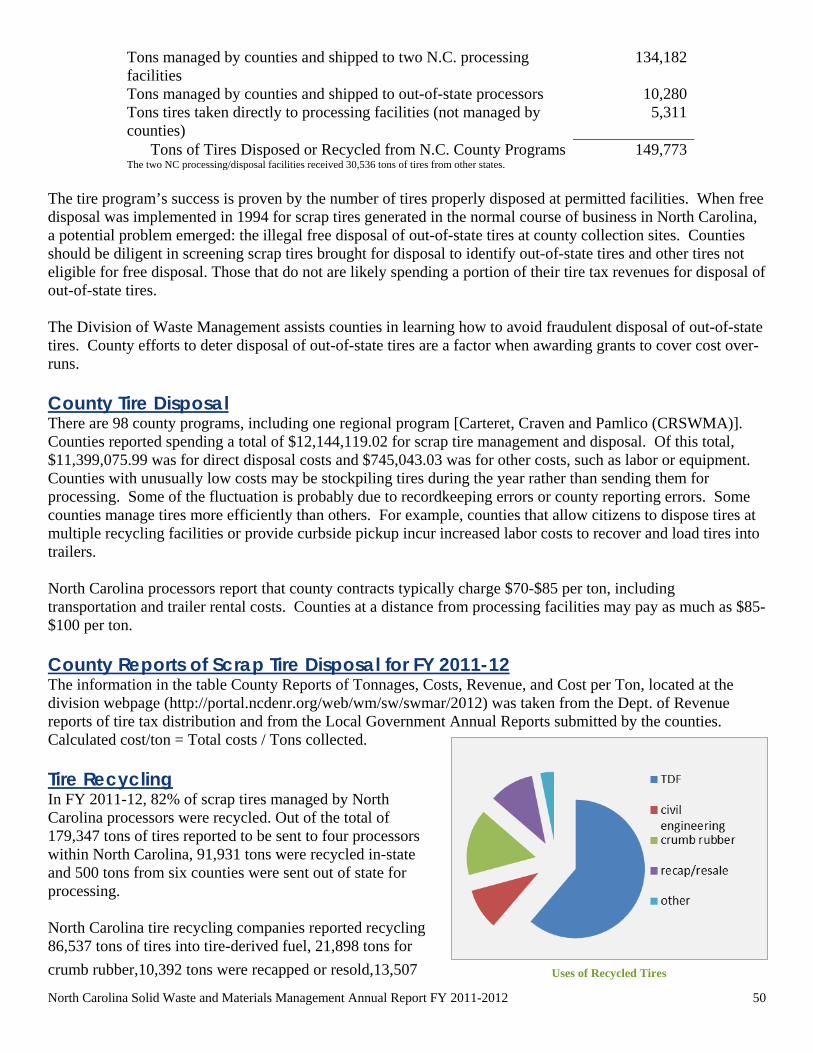
North Carolina Solid Waste and Materials Management Annual Report FY 2011-2012 50
Tons managed by counties and shipped to two N.C. processing facilities
134,182
Tons managed by counties and shipped to out-of-state processors 10,280 Tons tires taken directly to processing facilities (not managed by counties)
5,311
Tons of Tires Disposed or Recycled from N.C. County Programs 149,773 The two NC processing/disposal facilities received 30,536 tons of tires from other states.
The tire program’s success is proven by the number of tires properly disposed at permitted facilities. When free disposal was implemented in 1994 for scrap tires generated in the normal course of business in North Carolina, a potential problem emerged: the illegal free disposal of out-of-state tires at county collection sites. Counties should be diligent in screening scrap tires brought for disposal to identify out-of-state tires and other tires not eligible for free disposal. Those that do not are likely spending a portion of their tire tax revenues for disposal of out-of-state tires. The Division of Waste Management assists counties in learning how to avoid fraudulent disposal of out-of-state tires. County efforts to deter disposal of out-of-state tires are a factor when awarding grants to cover cost over-runs. County Tire Disposal There are 98 county programs, including one regional program [Carteret, Craven and Pamlico (CRSWMA)]. Counties reported spending a total of $12,144,119.02 for scrap tire management and disposal. Of this total, $11,399,075.99 was for direct disposal costs and $745,043.03 was for other costs, such as labor or equipment. Counties with unusually low costs may be stockpiling tires during the year rather than sending them for processing. Some of the fluctuation is probably due to recordkeeping errors or county reporting errors. Some counties manage tires more efficiently than others. For example, counties that allow citizens to dispose tires at multiple recycling facilities or provide curbside pickup incur increased labor costs to recover and load tires into trailers. North Carolina processors report that county contracts typically charge $70-$85 per ton, including transportation and trailer rental costs. Counties at a distance from processing facilities may pay as much as $85-$100 per ton. County Reports of Scrap Tire Disposal for FY 2011-12 The information in the table County Reports of Tonnages, Costs, Revenue, and Cost per Ton, located at the division webpage (http://portal.ncdenr.org/web/wm/sw/swmar/2012) was taken from the Dept. of Revenue reports of tire tax distribution and from the Local Government Annual Reports submitted by the counties. Calculated cost/ton = Total costs / Tons collected. Tire Recycling In FY 2011-12, 82% of scrap tires managed by North Carolina processors were recycled. Out of the total of 179,347 tons of tires reported to be sent to four processors within North Carolina, 91,931 tons were recycled in-state and 500 tons from six counties were sent out of state for processing. North Carolina tire recycling companies reported recycling 86,537 tons of tires into tire-derived fuel, 21,898 tons for crumb rubber,10,392 tons were recapped or resold,13,507 Uses of Recycled Tires

North Carolina Solid Waste and Materials Management Annual Report FY 2011-2012 51
tons were recycled for civil engineering purposes and 10,658 tons were recycled for other purposes or are stockpiled for processing. The remaining 31,364 tons of tires go to the two permitted tire monofills in the state. The division continues to pursue new opportunities for sustainable scrap tire recycling.
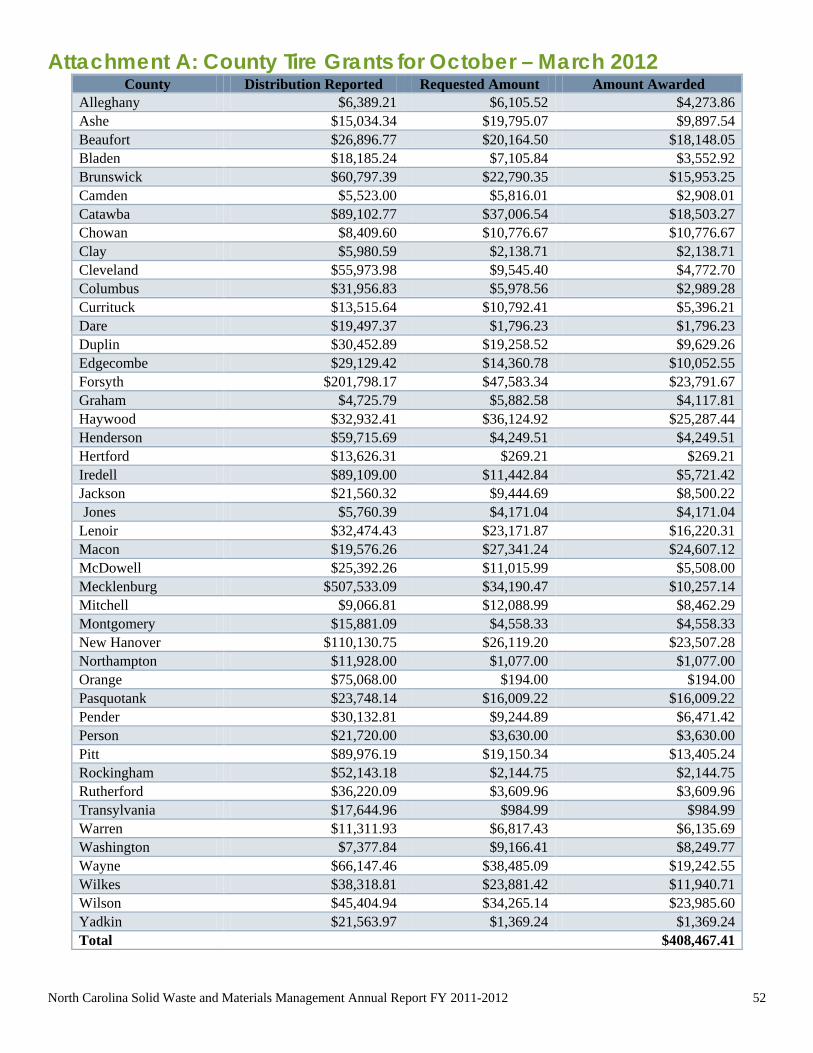
North Carolina Solid Waste and Materials Management Annual Report FY 2011-2012 52
Attachment A: County Tire Grants for October – March 2012 County Distribution Reported Requested Amount Amount Awarded
Alleghany $6,389.21 $6,105.52 $4,273.86 Ashe $15,034.34 $19,795.07 $9,897.54 Beaufort $26,896.77 $20,164.50 $18,148.05 Bladen $18,185.24 $7,105.84 $3,552.92 Brunswick $60,797.39 $22,790.35 $15,953.25 Camden $5,523.00 $5,816.01 $2,908.01 Catawba $89,102.77 $37,006.54 $18,503.27 Chowan $8,409.60 $10,776.67 $10,776.67 Clay $5,980.59 $2,138.71 $2,138.71 Cleveland $55,973.98 $9,545.40 $4,772.70 Columbus $31,956.83 $5,978.56 $2,989.28 Currituck $13,515.64 $10,792.41 $5,396.21 Dare $19,497.37 $1,796.23 $1,796.23 Duplin $30,452.89 $19,258.52 $9,629.26 Edgecombe $29,129.42 $14,360.78 $10,052.55 Forsyth $201,798.17 $47,583.34 $23,791.67 Graham $4,725.79 $5,882.58 $4,117.81 Haywood $32,932.41 $36,124.92 $25,287.44 Henderson $59,715.69 $4,249.51 $4,249.51 Hertford $13,626.31 $269.21 $269.21 Iredell $89,109.00 $11,442.84 $5,721.42 Jackson $21,560.32 $9,444.69 $8,500.22 Jones $5,760.39 $4,171.04 $4,171.04
Lenoir $32,474.43 $23,171.87 $16,220.31 Macon $19,576.26 $27,341.24 $24,607.12 McDowell $25,392.26 $11,015.99 $5,508.00 Mecklenburg $507,533.09 $34,190.47 $10,257.14 Mitchell $9,066.81 $12,088.99 $8,462.29 Montgomery $15,881.09 $4,558.33 $4,558.33 New Hanover $110,130.75 $26,119.20 $23,507.28 Northampton $11,928.00 $1,077.00 $1,077.00 Orange $75,068.00 $194.00 $194.00 Pasquotank $23,748.14 $16,009.22 $16,009.22 Pender $30,132.81 $9,244.89 $6,471.42 Person $21,720.00 $3,630.00 $3,630.00 Pitt $89,976.19 $19,150.34 $13,405.24 Rockingham $52,143.18 $2,144.75 $2,144.75 Rutherford $36,220.09 $3,609.96 $3,609.96 Transylvania $17,644.96 $984.99 $984.99 Warren $11,311.93 $6,817.43 $6,135.69 Washington $7,377.84 $9,166.41 $8,249.77 Wayne $66,147.46 $38,485.09 $19,242.55 Wilkes $38,318.81 $23,881.42 $11,940.71 Wilson $45,404.94 $34,265.14 $23,985.60 Yadkin $21,563.97 $1,369.24 $1,369.24 Total $408,467.41
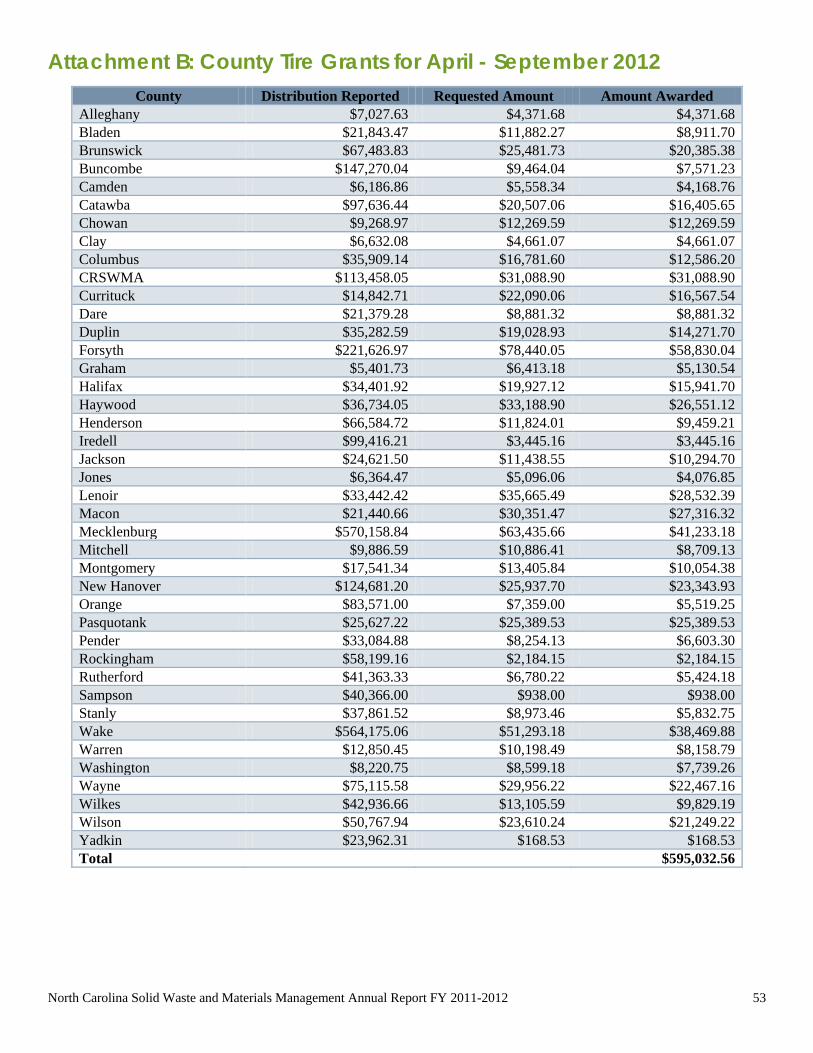
North Carolina Solid Waste and Materials Management Annual Report FY 2011-2012 53
Attachment B: County Tire Grants for April - September 2012
County Distribution Reported Requested Amount Amount Awarded Alleghany $7,027.63 $4,371.68 $4,371.68 Bladen $21,843.47 $11,882.27 $8,911.70 Brunswick $67,483.83 $25,481.73 $20,385.38 Buncombe $147,270.04 $9,464.04 $7,571.23 Camden $6,186.86 $5,558.34 $4,168.76 Catawba $97,636.44 $20,507.06 $16,405.65 Chowan $9,268.97 $12,269.59 $12,269.59 Clay $6,632.08 $4,661.07 $4,661.07 Columbus $35,909.14 $16,781.60 $12,586.20 CRSWMA $113,458.05 $31,088.90 $31,088.90 Currituck $14,842.71 $22,090.06 $16,567.54 Dare $21,379.28 $8,881.32 $8,881.32 Duplin $35,282.59 $19,028.93 $14,271.70 Forsyth $221,626.97 $78,440.05 $58,830.04 Graham $5,401.73 $6,413.18 $5,130.54 Halifax $34,401.92 $19,927.12 $15,941.70 Haywood $36,734.05 $33,188.90 $26,551.12 Henderson $66,584.72 $11,824.01 $9,459.21 Iredell $99,416.21 $3,445.16 $3,445.16 Jackson $24,621.50 $11,438.55 $10,294.70 Jones $6,364.47 $5,096.06 $4,076.85 Lenoir $33,442.42 $35,665.49 $28,532.39 Macon $21,440.66 $30,351.47 $27,316.32 Mecklenburg $570,158.84 $63,435.66 $41,233.18 Mitchell $9,886.59 $10,886.41 $8,709.13 Montgomery $17,541.34 $13,405.84 $10,054.38 New Hanover $124,681.20 $25,937.70 $23,343.93 Orange $83,571.00 $7,359.00 $5,519.25 Pasquotank $25,627.22 $25,389.53 $25,389.53 Pender $33,084.88 $8,254.13 $6,603.30 Rockingham $58,199.16 $2,184.15 $2,184.15 Rutherford $41,363.33 $6,780.22 $5,424.18 Sampson $40,366.00 $938.00 $938.00 Stanly $37,861.52 $8,973.46 $5,832.75 Wake $564,175.06 $51,293.18 $38,469.88 Warren $12,850.45 $10,198.49 $8,158.79 Washington $8,220.75 $8,599.18 $7,739.26 Wayne $75,115.58 $29,956.22 $22,467.16 Wilkes $42,936.66 $13,105.59 $9,829.19 Wilson $50,767.94 $23,610.24 $21,249.22 Yadkin $23,962.31 $168.53 $168.53 Total $595,032.56
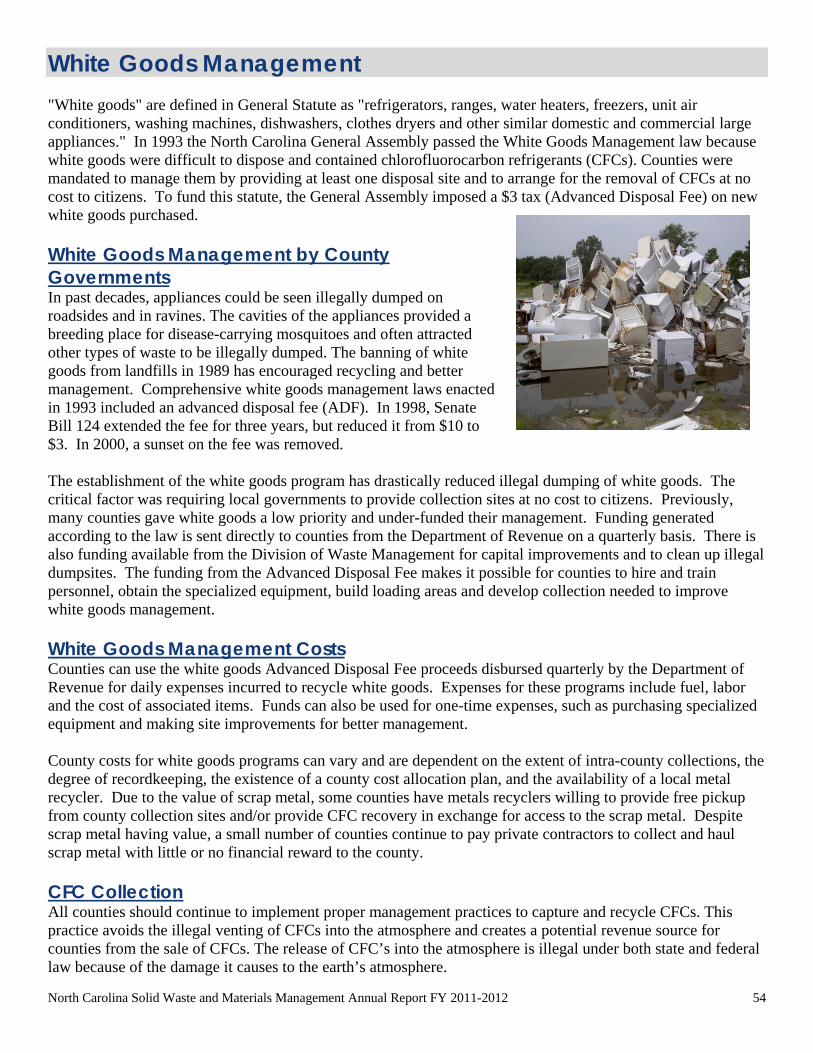
North Carolina Solid Waste and Materials Management Annual Report FY 2011-2012 54
White Goods Management "White goods" are defined in General Statute as "refrigerators, ranges, water heaters, freezers, unit air conditioners, washing machines, dishwashers, clothes dryers and other similar domestic and commercial large appliances." In 1993 the North Carolina General Assembly passed the White Goods Management law because white goods were difficult to dispose and contained chlorofluorocarbon refrigerants (CFCs). Counties were mandated to manage them by providing at least one disposal site and to arrange for the removal of CFCs at no cost to citizens. To fund this statute, the General Assembly imposed a $3 tax (Advanced Disposal Fee) on new white goods purchased. White Goods Management by County Governments In past decades, appliances could be seen illegally dumped on roadsides and in ravines. The cavities of the appliances provided a breeding place for disease-carrying mosquitoes and often attracted other types of waste to be illegally dumped. The banning of white goods from landfills in 1989 has encouraged recycling and better management. Comprehensive white goods management laws enacted in 1993 included an advanced disposal fee (ADF). In 1998, Senate Bill 124 extended the fee for three years, but reduced it from $10 to $3. In 2000, a sunset on the fee was removed. The establishment of the white goods program has drastically reduced illegal dumping of white goods. The critical factor was requiring local governments to provide collection sites at no cost to citizens. Previously, many counties gave white goods a low priority and under-funded their management. Funding generated according to the law is sent directly to counties from the Department of Revenue on a quarterly basis. There is also funding available from the Division of Waste Management for capital improvements and to clean up illegal dumpsites. The funding from the Advanced Disposal Fee makes it possible for counties to hire and train personnel, obtain the specialized equipment, build loading areas and develop collection needed to improve white goods management. White Goods Management Costs Counties can use the white goods Advanced Disposal Fee proceeds disbursed quarterly by the Department of Revenue for daily expenses incurred to recycle white goods. Expenses for these programs include fuel, labor and the cost of associated items. Funds can also be used for one-time expenses, such as purchasing specialized equipment and making site improvements for better management. County costs for white goods programs can vary and are dependent on the extent of intra-county collections, the degree of recordkeeping, the existence of a county cost allocation plan, and the availability of a local metal recycler. Due to the value of scrap metal, some counties have metals recyclers willing to provide free pickup from county collection sites and/or provide CFC recovery in exchange for access to the scrap metal. Despite scrap metal having value, a small number of counties continue to pay private contractors to collect and haul scrap metal with little or no financial reward to the county. CFC Collection All counties should continue to implement proper management practices to capture and recycle CFCs. This practice avoids the illegal venting of CFCs into the atmosphere and creates a potential revenue source for counties from the sale of CFCs. The release of CFC’s into the atmosphere is illegal under both state and federal law because of the damage it causes to the earth’s atmosphere.

North Carolina Solid Waste and Materials Management Annual Report FY 2011-2012 55
The accidental and intentional venting of CFCs due to poor management practices may be more widespread than previously thought. Even though gas venting is prohibited under state and federal law and markets exist for reclaimed CFCs, reports from sources in the field indicate that some counties and metal recyclers contracted by counties accidentally or intentionally vent CFCs into the atmosphere. Proper extraction of CFCs from appliances is considered to be time-consuming, requires trained personnel and specialized equipment and may be given low priority among solid waste programs. The white goods program is actively encouraging and promoting counties to reclaim more refrigerant gases from appliances. This is being done by emphasizing that the program can provide funding for equipment purchases, personnel training and information supply for private sector sources to help counties find markets for reclaimed CFCs. It is hoped that the net result will be a decrease in the amounts of ozone depleting CFCs released into the environment, while at the same time providing a new revenue source for counties through the sale of reclaimed CFCs. Current Trends in White Goods Management Even though general economic conditions in the U.S. have not greatly improved, the value for scrap
metal, driven by overseas demand, remains strong. As a result, many counties enjoy good returns on their recycled appliances and other scrap metal when sold.
Due to sparse populations and small tax bases, a few rural counties will continue to require support of their white goods programs with cost-overrun grants from the program.
Counties should only use the white goods tax money for its intended purpose. The money should not be deposited into the county’s general fund.
White Goods Management Account The White Goods Management Account (WGMA) was established to help counties whose costs exceed their share of Advanced Disposal Fee revenue. Although 72 percent of the net disposal fee collections were allotted for distribution, ineligible counties forfeited some of that money. In past years, the white goods management account received 20 percent of net collections as well as these forfeited funds. This year the funds were instead allocated to the General Fund for three of the four quarters. Department of Revenue White Good Tax Distributions FY 2011-12
Date Net
Collections
WGMA or General
Fund
Forfeited Funds to
WGMA or General Fund
Solid Waste Trust Fund
DOR Cost Collection
Amount Allocated to
Counties Aug 2011 $1,017,450.69 $189,081.00 $68,634.24 $75,632.40 $72,045.69 $680,632.40 Nov 2011 $1,241,388.66 $236,818.87 $74,614.67 $94,727.55 $57,294.32 $852,547.92 Feb 2012 $1,079,123.61 $204,069.10 $64,296.17 $81,627.64 $58,778.13 $734,648.74 May 2012 $963,648.69 $180,161.98 $78,930.41 $72,064.79 $62,838.79 $648,583.13
TOTAL $4,301,611.65 $810,130.95 $286,475.49 $324,052.38 $250,956.93 $2,916,412.19 For the period of FY2011-12 the White Goods Management Account received $189,081.00 in regular revenues and $68,634.24 in funds forfeited by ineligible counties, totaling $257,715.24. The remainder of the funds in the amount of $621,049.95 for regular income and $217,841.25 for forfeited income, totaling $1,096,606.44, went into the North Carolina General Fund.

North Carolina Solid Waste and Materials Management Annual Report FY 2011-2012 56
Utilization of Funds Counties who are or will be experiencing moderate to high growth rates in the coming years would benefit greatly from upgrades in their facilities in anticipation of the growth in their populations. Improved infrastructure for white goods means that it costs less for counties to manage their white goods, decreases the environmental impact of white goods, and improves the returns the counties receive for the value of their white goods as scrap metal. This has the effect of easing constraints on limited local funding. Though the white goods program has had many accomplishments, some problems remain. Some counties ignore the white goods law by not allocating white goods tax distributions to their white goods programs. This means that some county white goods programs are underfunded. Many local governments are privatizing their white goods management. Privatization does not necessarily mean that programs are more efficient. In many instances, privatized white goods management is incorporated into a more comprehensive solid waste contract between a local government and a private firm, making it more difficult to measure program efficiency and accountability. The first grant period is for July through December and the second is for January through June. As the price of scrap metal rises, counties use the added revenue to pay for operational expenditures. When scrap prices fall, counties require cost overrun grants to meet expenditures. The July-December 2010 cost overrun grant round totaled $137,969.57. The January- June 2011 cost overrun grant round totaled $107,425.20. The grants for July-December 2011 totaled $125,223.83 and capital improvement grants totaled $146,140.00. Attachments A through D to this chapter list the funding provided to county white goods management, three cost overrun grant rounds and two capital improvement expenditure grants, which together totaled $516,522.08. Rough handling of white goods, before CFCs are extracted, leads to damaged coolant systems and may release CFCs into the atmosphere. The use of capital improvement grants continues to bring necessary upgrades to the county programs. This will help them save money and save the quality of the air and save the esthetic value of North Carolina roads and natural settings.
White Goods Management Account FY 2011-12 Beginning Balance (July 1, 2011) $ 1,936,948.95 Plus: Funds Received* 257,715.24 Less: Capital Improvement and Cost Overrun Grants 516,522.08 Ending Balance (June 30, 2012) $ 1,678,142.11
Moneys Reserved for Future Grant Awards** $ 1,000,000.00 Unreserved Balance $ 678,142.11
*The White Goods Management Account received $189,081.00 in regular revenue and $68,634.24 in forfeited funds by ineligible counties during the 2011-12 FY. ** $500,000 reserved for capital improvement grants and $500,000 reserved for overrun grants.
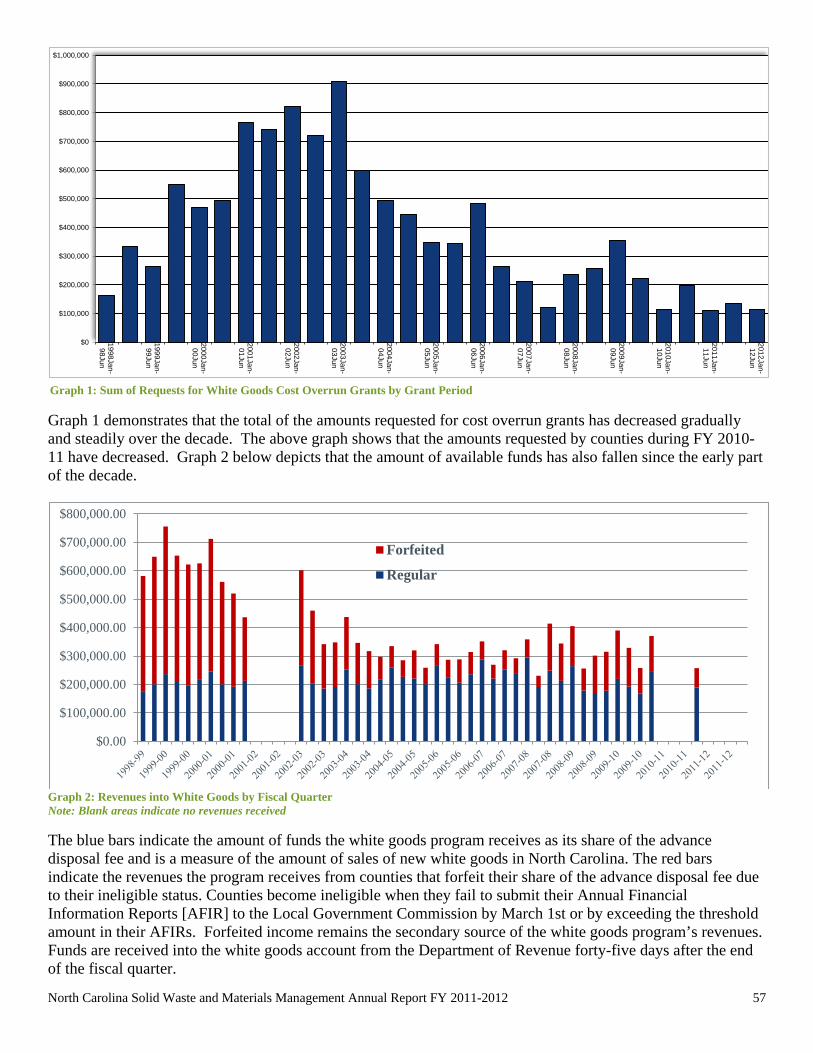
North Carolina Solid Waste and Materials Management Annual Report FY 2011-2012 57
Graph 1 demonstrates that the total of the amounts requested for cost overrun grants has decreased gradually and steadily over the decade. The above graph shows that the amounts requested by counties during FY 2010-11 have decreased. Graph 2 below depicts that the amount of available funds has also fallen since the early part of the decade.
Graph 2: Revenues into White Goods by Fiscal Quarter Note: Blank areas indicate no revenues received
The blue bars indicate the amount of funds the white goods program receives as its share of the advance disposal fee and is a measure of the amount of sales of new white goods in North Carolina. The red bars indicate the revenues the program receives from counties that forfeit their share of the advance disposal fee due to their ineligible status. Counties become ineligible when they fail to submit their Annual Financial Information Reports [AFIR] to the Local Government Commission by March 1st or by exceeding the threshold amount in their AFIRs. Forfeited income remains the secondary source of the white goods program’s revenues. Funds are received into the white goods account from the Department of Revenue forty-five days after the end of the fiscal quarter.
$0.00
$100,000.00
$200,000.00
$300,000.00
$400,000.00
$500,000.00
$600,000.00
$700,000.00
$800,000.00
Forfeited
Regular
$0
$100,000
$200,000
$300,000
$400,000
$500,000
$600,000
$700,000
$800,000
$900,000
$1,000,000
1998Jan-98Jun
1999Jan-99Jun
2000Jan-00Jun
2001Jan-01Jun
2002Jan-02Jun
2003Jan-03Jun
2004Jan-04Jun
2005Jan-05Jun
2006Jan-06Jun
2007Jan-07Jun
2008Jan-08Jun
2009Jan-09Jun
2010Jan-10Jun
2011Jan-11Jun
2012Jan-12Jun
Graph 1: Sum of Requests for White Goods Cost Overrun Grants by Grant Period

North Carolina Solid Waste and Materials Management Annual Report FY 2011-2012 58
Graph 3 shows the average revenues collected by counties on the sale of a ton of scrap metal biannually from FY2000-01 to the first half of FY2010-11. The graph clearly shows a continuous increase in the value of scrap metal through the decade with dips in FY2001-02 and FY2009-10, coinciding with both national recessions, which occurred during that time. Comparing this graph with Graph 1 shows that as counties have increased revenues from scrap sales they have also decreased grant requests from the White Goods Management Program over that time. Other factors which may have influenced the value of the scrap metal sold by counties include the increase in efficiencies counties have seen from improvements in funding and infrastructure. However, the overriding factor influencing the value of scrap metal lies in the demand from overseas markets. Strong and sustained demand from overseas markets drives scrap metal values almost entirely. The question remains as to how long the demand from those markets will be maintained. If the demand begins to wane then it can be expected that the value of the scrap will also diminish.
Graph 4 shows that over the decade the counties’ collection quantity of scrap has changed. Beginning in about FY 2005-06 counties began to collect roughly 50% less scrap even as the value of the scrap they did collect, as shown in Graph 3, increased in value. The reason for this is believed to be that as the value of scrap metal began to increasingly rise it became more profitable for citizens to bring their scrap directly to metal recyclers for cash bypassing county collection sites.
$0.00
$20.00
$40.00
$60.00
$80.00
$100.00
$120.00
$140.00
$160.00
Rev/ton
Graph 3: Average Revenue from the Sale of a Ton of Scrap Metal by Counties
0
5,000
10,000
15,000
20,000
Graph 4: Sum of Tons of Scrap Metal Collected by Counties on a Biannual Basis
North Carolina Solid Waste and Materials Management Annual Report FY 2011-2012 59
Economic conditions affect costs related to white goods. When economic conditions are poor, county solid waste departments collect less white goods and average per ton costs increase, because citizens have less to spend and may put off making new white goods purchases. These costs are tied to the general price paid for scrap metals and to the overall amounts of white goods collected. When economic conditions improve, more money becomes available and citizens look to replace appliances. Forfeited Funds Determination of forfeited funds is based on information supplied by counties' Annual Financial Information Reports (AFIRs). AFIRs are submitted to the Office of the State Treasurer. AFIRs are due by November 1st. Counties that did not submit their AFIR last year became ineligible to receive tax proceeds in March 2012. The forfeited funds were deposited into the general fund (based on FY 2010-11 AFIR Reports see webpage for details County White Goods Tonnages, Expenditures, Advanced Disposal Fees (ADF) for FY2011-12. County Funds Forfeited for FY 2010-2011 Alexander, Avery, Beaufort, Bertie, Burke, Cherokee, Edgecombe, Forsyth, Harnett, Henderson, Hoke, Hyde, Jones, Lincoln, Martin, Northampton, and Sampson
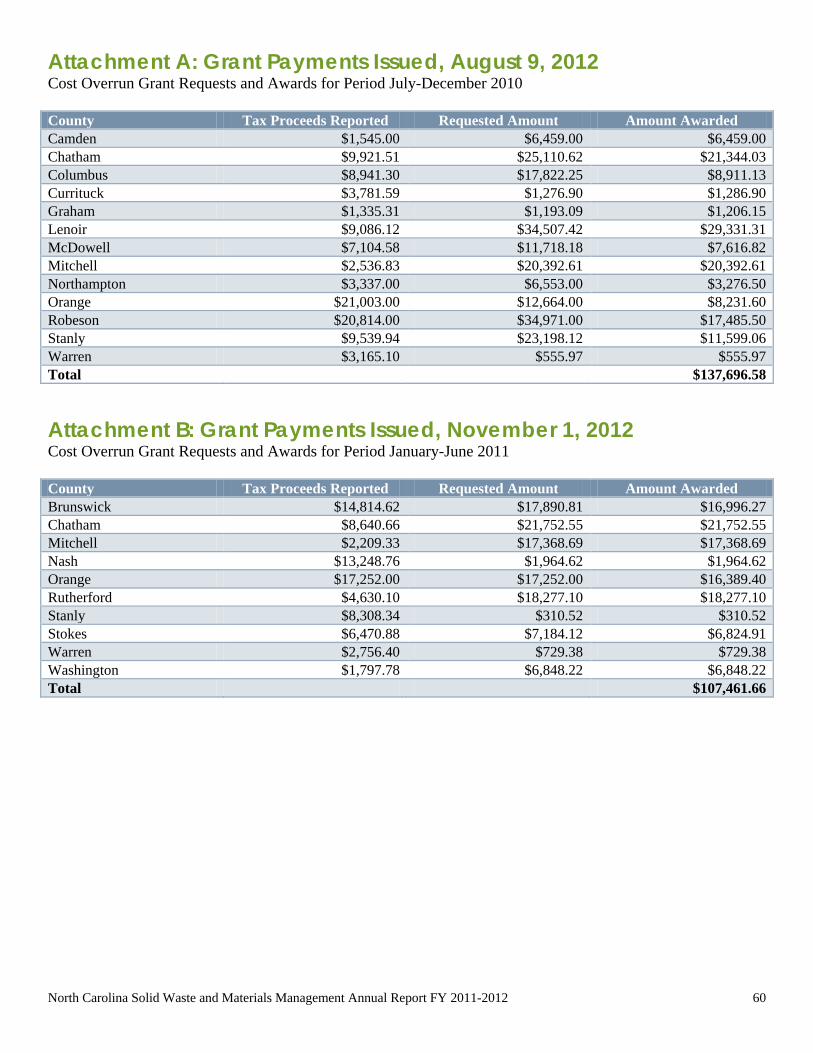
North Carolina Solid Waste and Materials Management Annual Report FY 2011-2012 60
Attachment A: Grant Payments Issued, August 9, 2012 Cost Overrun Grant Requests and Awards for Period July-December 2010 County Tax Proceeds Reported Requested Amount Amount Awarded Camden $1,545.00 $6,459.00 $6,459.00 Chatham $9,921.51 $25,110.62 $21,344.03 Columbus $8,941.30 $17,822.25 $8,911.13 Currituck $3,781.59 $1,276.90 $1,286.90 Graham $1,335.31 $1,193.09 $1,206.15 Lenoir $9,086.12 $34,507.42 $29,331.31 McDowell $7,104.58 $11,718.18 $7,616.82 Mitchell $2,536.83 $20,392.61 $20,392.61 Northampton $3,337.00 $6,553.00 $3,276.50 Orange $21,003.00 $12,664.00 $8,231.60 Robeson $20,814.00 $34,971.00 $17,485.50 Stanly $9,539.94 $23,198.12 $11,599.06 Warren $3,165.10 $555.97 $555.97 Total $137,696.58
Attachment B: Grant Payments Issued, November 1, 2012 Cost Overrun Grant Requests and Awards for Period January-June 2011 County Tax Proceeds Reported Requested Amount Amount Awarded Brunswick $14,814.62 $17,890.81 $16,996.27 Chatham $8,640.66 $21,752.55 $21,752.55 Mitchell $2,209.33 $17,368.69 $17,368.69 Nash $13,248.76 $1,964.62 $1,964.62 Orange $17,252.00 $17,252.00 $16,389.40 Rutherford $4,630.10 $18,277.10 $18,277.10 Stanly $8,308.34 $310.52 $310.52 Stokes $6,470.88 $7,184.12 $6,824.91 Warren $2,756.40 $729.38 $729.38 Washington $1,797.78 $6,848.22 $6,848.22 Total $107,461.66

North Carolina Solid Waste and Materials Management Annual Report FY 2011-2012 61
Attachment C: Grant Payments Issued, April 10, 2011 Cost Overrun Grant Requests and Awards for Period July-December 2011 County Tax Proceeds Reported Requested Amount Amount Awarded Bladen $0.00 $4,615.18 $4,615.18 Chatham $10,574.99 $24,150.44 $24,150.44 Columbus $9,636.86 $11,182.32 $11,182.32 Currituck $3,900.67 $3,736.73 $3,736.73 Lenoir $9,850.29 $26,045.42 $20,836.34 McDowell $7,455.81 $8,184.19 $8,184.19 Mitchell $2,580.91 $17,594.15 $17,594.15 Orange $22,240.26 $7,442.74 $7,442.74 Pasquotank $6,722.99 $2,616.71 $2,616.71 Stanly $10,052.45 $16,523.42 $13,218.74 Stokes $7,860.96 $7,060.07 $5,648.06 Warren $3,150.00 $31.74 $31.74 Washington $2,189.50 $5,966.50 $5,966.50 Total $125,223.84
Attachment D: Capital Improvement Grant Paid to Counties County Purpose Amount Lee White Goods Pad & Storage Area $138,640.00 Stokes Front End Loader $7,500.00 Total $146,140.00
North Carolina Solid Waste and Materials Management Annual Report FY 2011-2012 62
Electronics Management Program Session Law 2010-67 established the Electronics Management Program. The law established that manufacturers of electronics, as well as retailers, consumers, and the state must all share accountability for the responsible recycling and reuse of electronic equipment. Computer equipment includes desktop and laptop computers, monitors and video displays for computers, printers, scanners or combination printer-scanner fax machines, mice, keyboards and other peripherals. Household items such as cell phones, video recorders, cable or satellite boxes, and all commercial devices such as printers and data networking systems are not included in the law. The Electronics Management Fund, administered by the Division of Waste Management, consists of computer and television manufacturers’ registration and annual fees. The majority of the fund is used to subsidize local government electronics recycling programs. Manufacturers’ Responsibilities Computer equipment and television manufacturers have different kinds of obligations under Session Law 2010-67, as described below. The Session Law is designed to provide electronics recycling opportunities for the “consumer,” defined as an occupant of a dwelling who used the equipment for personal or home business use. A nonprofit organization with fewer than 10 employees is also considered a consumer. Before selling equipment in North Carolina, a manufacturer must register with the state. Equipment manufacturers must also pay a fee: Computer manufacturers pay an initial fee of $10,000 to $15,000 and then an annual fee of $2,500 -
$15,000, depending on the level of their plan. Television manufacturers pay an annual fee of $2500.
Each television manufacturer is obligated to recycle or arrange for the recycling of its market share of televisions. TV manufacturers must also annually report to the state on the tonnage of televisions they recycled or arranged to recycle. Computer equipment manufacturers must provide a plan which, at a minimum, will provide a mechanism through which consumers can recycle their brands of equipment. The related recycling and transportation must be accomplished using environmentally sound management practices. Manufacturers must provide a consumer recycling education program and a toll-free phone number. The plans must provide for free and reasonably convenient recycling. There are three levels of computer equipment plans: Level I: manufacturers must provide one or more methods to take back their equipment. This can be
through a mail-back program, a physical collection site or a one-time collection event. Manufacturers operating at this level pay a $15,000 initial registration fee and $15,000 annually.
Level II: manufacturers must take back all manufacturers’ equipment, not just its own brands. Manufacturers must provide 10 physical collection sites in North Carolina’s 10 largest cities and must host at least two collection events annually. Manufacturers operating at this level pay a $10,000 initial registration fee and $7,500 annually.
Level III: manufacturers must take back all manufacturers’ equipment. Manufacturers must provide physical collection sites in 50 North Carolina counties. Ten of the collection sites must be in the 10 largest counties. The manufacturer must host at least two collection events annually. Manufacturers operating at this level pay a $10,000 initial fee and $2,500 annually.

North Carolina Solid Waste and Materials Management Annual Report FY 2011-2012 63
Each registered computer equipment manufacturer must also submit an annual final report detailing the total weight of computer equipment collected for recycling and reuse for the previous year, also summarizing the actions it implemented from its specific approved plan. Both computer and television manufacturers’ equipment must display a label clearly identifying the manufacturer. Electronics Management Fund Fees paid into the electronics management fund are used to support approved electronics management within North Carolina counties. The television equipment funds and up to 10 percent of the computer equipment funds that may be used to administer the program. In FY 2011-12, $37,500 in fees from 27 television manufacturers’ and $547,500 in fees from 40 computer equipment manufacturers generated a total of 585,000. Income generated in future years is forecast to decline as computer equipment manufacturers initiate Level II and Level III plans, which require smaller annual fees. It is also anticipated that additional local governments will have electronics management plans which qualify for the funding from the Electronics Management Fund. Distributions to Local Governments from the Electronics Management Fund Local Governments, 75 counties and three cities which had eligible Electronics Recycling Plans received their per capita share of a total $600,000 in distributions from the Electronics Management Fund in February 2012. At publication date of this report, there were 73 counties and two cities operating electronics programs in the state (we can update these numbers once the LG report data is available). Audits of the local government electronics programs are conducted annually. Beginning in January 2013, the electronics programs must prove to the Division of Waste Management that all recycling of computer equipment and televisions is being conducted by R2 or eSteward certified facilities in order to receive future distributions. The funding is to be used only for management of electronics, and communities must adhere to their Local Government Management Plan according to N.C.G.S. 130A-309.137 The distributions are used for the collection and recycling of electronics. In October of 2012, local governments receiving funding reported to the Division of Waste Management about usage of funding. To see the amounts of the distributions to local governments visit our webpage (http://portal.ncdenr.org/web/wm/sw/electronics). Retailer’s Responsibilities Effective July 1, 2011, retailers in North Carolina may only sell televisions, desktop computers, laptop computers, printers, scanners, printer-scanner-fax combinations, mice, keyboards, and other computer peripherals which display the manufacturer label of a registered manufacturer in compliance with the new electronics management law. State Agencies and Governmental Entities Responsibilities State agencies and governmental entities in North Carolina may only buy televisions, desktop computers, laptop computers, printers, scanners, printer-scanner-fax combinations, mice, keyboards, and other computer peripherals which are produced by registered manufacturers in compliance with the electronics management law. A list of manufacturers who are in compliance, updated whenever a change occurs, can be viewed on the webpage: http://portal.ncdenr.org/web/wm/sw/electronics

North Carolina Solid Waste and Materials Management Annual Report FY 2011-2012 64
Recycling Rates within North Carolina Data on the recycling of computer equipment and televisions comes from two major sources: manufacturer reports and local government solid waste annual reports. The table below presents summary information of tonnage from the manufacturers.
Type of Collection Computer Equipment Manufacturers (tons)
Television Manufacturers (tons)
Mail-back Program 7.32 4.49 Retail Collection 996.17 784.97 Permanent drop-off through local government programs 6,423.58 8264.91 Permanent drop-off sponsored by manufacturers 3,893.11 1,913.63 Total 10,419.61 10,997.87 The following table shares data from local government recycling programs, showing a 63 percent increase in electronics tonnage collected by counties and cities from FY2009-10 to FY2011-12. All of these numbers cn be updated with Shawn’s changes and with the LG data once it is ready County and Municipal Collection Programs
FY 2009-10 (tons)
FY 2010-11 (tons)
FY 2011-12 (tons)
Televisions 993.48 3,019.39 6,423.58 Other Electronics 3,580.15 4,432.15 8,264.91 Total 4,573.63 7,451.54 14,688.49 The following table combines the data from the two tables above to calculate an overall per capita recycling rate for electronic materials. It removes redundant data from manufacturer reports that are also counted in local government reports. Included also is historic data from local government reports from previous fiscal years to help track the progress of electronics recovery (recognizing that manufacturer data was not available until this year).
Overall Recycling of Electronics FY 2009-10 FY 2010-11 FY 2011-12 Manufacturer Televisions (non-local government collections) NA 1,754.23 2,732.96 Manufacturer Computer Equipment (non-local government collections) NA 2,895.82 3,996.03 Local Government Televisions 993.48 3,019.39 8,264.91 Local Government Other Electronics 3,580.15 4,432.15 6,423.58 TOTAL (tons) 4,573.63 12,101.59 21,417.48 Total Pounds Per Capita 0.98 2.5 4.43
Compliance and Enforcement of Electronics Laws A small number of companies have not registered or paid their fees. These companies are ineligible to market their products in North Carolina. Citizens and government agencies can check the Division of Waste Management websites, Computer Equipment Manufacturer Compliance and Television Manufacturer Compliance, to determine which companies may sell in North Carolina. The definition for Computer Equipment in N.C.G.S.130A 309.131 may need to be changed to include electronic books as covered devices, as many of these types of devices are evolving into multifunctional small computers.
North Carolina Solid Waste and Materials Management Annual Report FY 2011-2012 65
The Division of Waste Management and the Division of Environmental Assistance and Outreach have been coordinating with manufacturer stakeholder groups, as well as a national consortium of states with electronics programs – Electronics Resources Coordination Clearinghouse (ERCC), to seek ways to streamline and automate reporting requirements for North Carolina. Manufacturer reporting requirements vary greatly from state to state. High quality data is needed to ensure that materials are not double counted and that the data used to calculate market share for television manufacturers is as accurate as possible. If automated means of reporting are not made available to North Carolina, through efforts of the EPA or ERCC, NCGS 130A-309.135, they may need to be revised to clarify annual reporting.
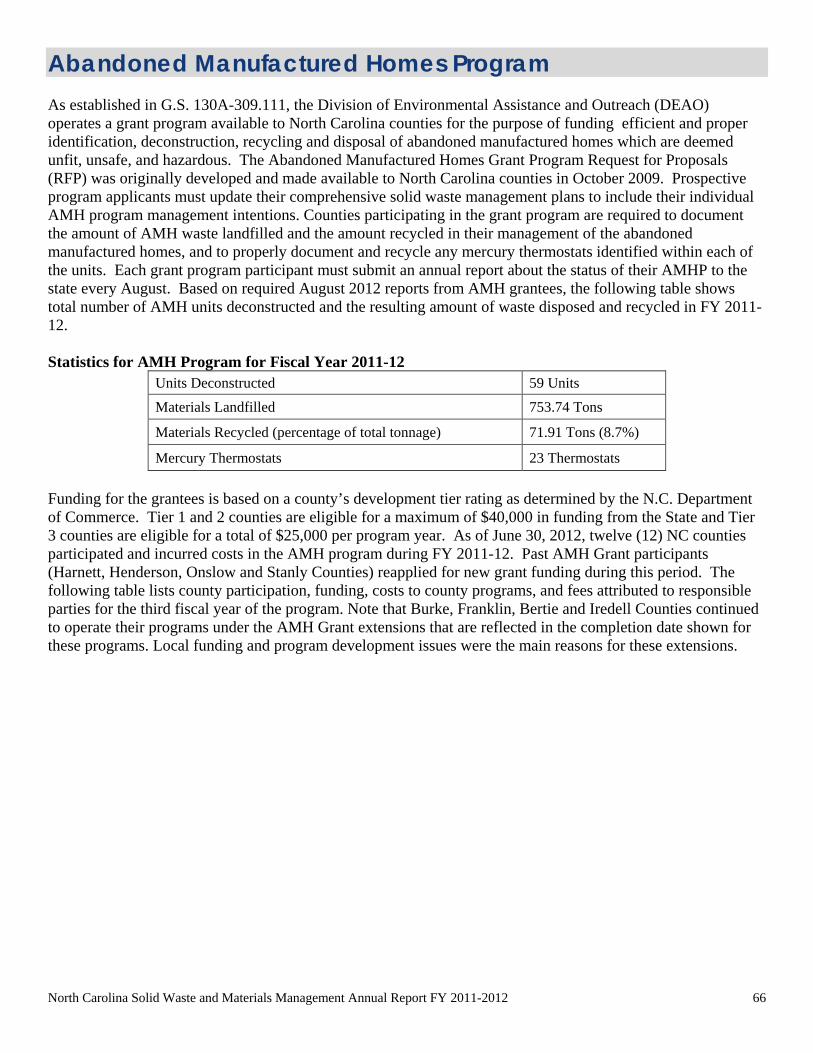
North Carolina Solid Waste and Materials Management Annual Report FY 2011-2012 66
Abandoned Manufactured Homes Program As established in G.S. 130A-309.111, the Division of Environmental Assistance and Outreach (DEAO) operates a grant program available to North Carolina counties for the purpose of funding efficient and proper identification, deconstruction, recycling and disposal of abandoned manufactured homes which are deemed unfit, unsafe, and hazardous. The Abandoned Manufactured Homes Grant Program Request for Proposals (RFP) was originally developed and made available to North Carolina counties in October 2009. Prospective program applicants must update their comprehensive solid waste management plans to include their individual AMH program management intentions. Counties participating in the grant program are required to document the amount of AMH waste landfilled and the amount recycled in their management of the abandoned manufactured homes, and to properly document and recycle any mercury thermostats identified within each of the units. Each grant program participant must submit an annual report about the status of their AMHP to the state every August. Based on required August 2012 reports from AMH grantees, the following table shows total number of AMH units deconstructed and the resulting amount of waste disposed and recycled in FY 2011-12. Statistics for AMH Program for Fiscal Year 2011-12
Units Deconstructed 59 Units Materials Landfilled 753.74 Tons Materials Recycled (percentage of total tonnage) 71.91 Tons (8.7%) Mercury Thermostats 23 Thermostats
Funding for the grantees is based on a county’s development tier rating as determined by the N.C. Department of Commerce. Tier 1 and 2 counties are eligible for a maximum of $40,000 in funding from the State and Tier 3 counties are eligible for a total of $25,000 per program year. As of June 30, 2012, twelve (12) NC counties participated and incurred costs in the AMH program during FY 2011-12. Past AMH Grant participants (Harnett, Henderson, Onslow and Stanly Counties) reapplied for new grant funding during this period. The following table lists county participation, funding, costs to county programs, and fees attributed to responsible parties for the third fiscal year of the program. Note that Burke, Franklin, Bertie and Iredell Counties continued to operate their programs under the AMH Grant extensions that are reflected in the completion date shown for these programs. Local funding and program development issues were the main reasons for these extensions.

North Carolina Solid Waste and Materials Management Annual Report FY 2011-2012 67
AMH Grant Program Participants during FY2011-12 County Contract
Start Date Contract End Date
Grant Award
County costs during
FY
Responsible Party Fees Collected
# Units Deconstructed
Stanly 11/1/2011 10/31/2012 $37,500.00 $23,964.60 $5,250.00 15 Onslow1 3/1/2012 2/28/2013 $37,500.00 $0.00 $0.00 - Harnett 2/20/2012 2/19/2013 $37,500.00 $3,896.20 $1,029.90 3 Nash 2/26/2010 10/30/2011 $40,000.00 $7,040.00 $0.00 7 Henderson 1/1/2012 12/31/2012 $37,500.00 $11,835.42 $0.00 9 Burke 2/26/2010 2/28/2013 $40,000.00 $8,162.40 $2,000.00 8 Franklin 2/26/2010 2/28/2013 $40,000.00 $11,402.32 $5,542.32 4 Warren 2/26/2010 2/28/2012 $40,000.00 $7,696.39 $1,130.00 2 Bertie2 5/3/2010 5/1/2013 $40,000.00 $2,258.94 $365.39 1 Tyrrell3 7/1/2010 6/29/2012 $40,000.00 $42.50 n/a - Robeson4 7/6/2010 7/5/2011 $40,000.00 n/a n/a - Iredell 11/29/2010 11/30/2013 $25,000.00 $7,128.00 $1,545.00 10
Table Notes: 1. Onslow County: Due to major program restructuring, no deconstruction activities occurred during the fiscal year. The county has identified 12 to 13 interested persons desiring assistance to differ cost with AMH demolition in FY 2012-13. 2. Bertie County: The unit represented in the table above was actually deconstructed at the end of FY 2010-11 but was not included in AMH program data from FY 2010-11 because the county did not expend funds until FY 2011-12. 3. Tyrrell County: Hurricane Irene cleanup hampered efforts to implement this program. There were few persons willing to engage in AMH cleanup by the time the grant cycle ended in June 2012 and the grant contract ended with the county having not managed any units or used any grant funds. 4. Robeson County: This grant closed on July 5, 2012 just after FY 2011-12 started. No program activity took place during FY 2011-12 and information on this grant was reported in the previous cycle (FY 2010-11).
Additional Information on the AMH program and support from the Solid Waste Trust Fund In addition to providing funding, DEAO has provided technical assistance to county AMH programs on practical aspects of implementing their efforts, including adoption of new contractor bidding processes and forms, conducting publicity and program promotion, establishing program guidelines and AMH identification processes, and record keeping and documentation. In March 2012, the Department upgraded its guidance related to the AMH grant application process based the previous fiscal year’s grants. Under the new guidance, AMH grantees may now apply for a state grant for a term of one year or two years. Previously, grantees had to apply for extensions for their grants with the Department, which resulted in additional administrative work for both the county and DEAO staff. It is hoped that the new process will allow for efficient program development and implementation. Counties with AMH programs report that the program has been well received by citizens. The continuing challenge that counties have faced in making AMH programs effective is getting owners and holders of AMHs to actually commit to deconstruction under grant programs. In some counties, responsible parties have misunderstood that grant funds go to the counties to differ the costs of removal and are not made available directly to individuals. In other instances, the fees charged by programs to responsible parties / property owners make it difficult for some AMH owners to come up with the funds given the weakness in the local economy. Counties continue to adapt their programs to improve efficiency, accessibility, and operations. For example, Nash County required responsible parties to pay any part of a deconstruction over $1,000 to increase participation. If the cost to manage an abandoned manufactured home is under that amount, the county absorbs any costs not supported by grants, which is a great incentive. Henderson County charges a flat fee per demolished home of $1,245 as a base for an average AMH for any deconstruction below 10,000 pounds. Any money from recycling of construction and demolition waste goes directly to the contractor. The county does

North Carolina Solid Waste and Materials Management Annual Report FY 2011-2012 68
not collect fees as income and if the state pays $1,000 from grant funds for a single-wide removal, the county pays the rest. Counties also use competitive bids, education and outreach, and local ordinances as a means of garnering participation in the programs. The raw tonnages of materials removed and recycled from AMH program in North Carolina are approximately 754 landfilled tons and 72 recycled tons. Recycled tonnage from managed homes is near nine percent of total tons, which is consistent with previous fiscal year reporting cycles. In total, DEAO expended $150,000 from the Solid Waste Trust Fund for the four AMH grant programs that reapplied for funding in FY 2011-12. The Fund entered the FY 2011-12 with a cash balance of $4,076,135 and ended the fiscal year with an unencumbered balance of $3,567,649. In addition to funding the AMH program, the Solid Waste Trust Fund is used for a range of other statutory purposes, including providing grant support to general local government recycling programs, recycling outreach and technical assistance, and development of recycling markets.
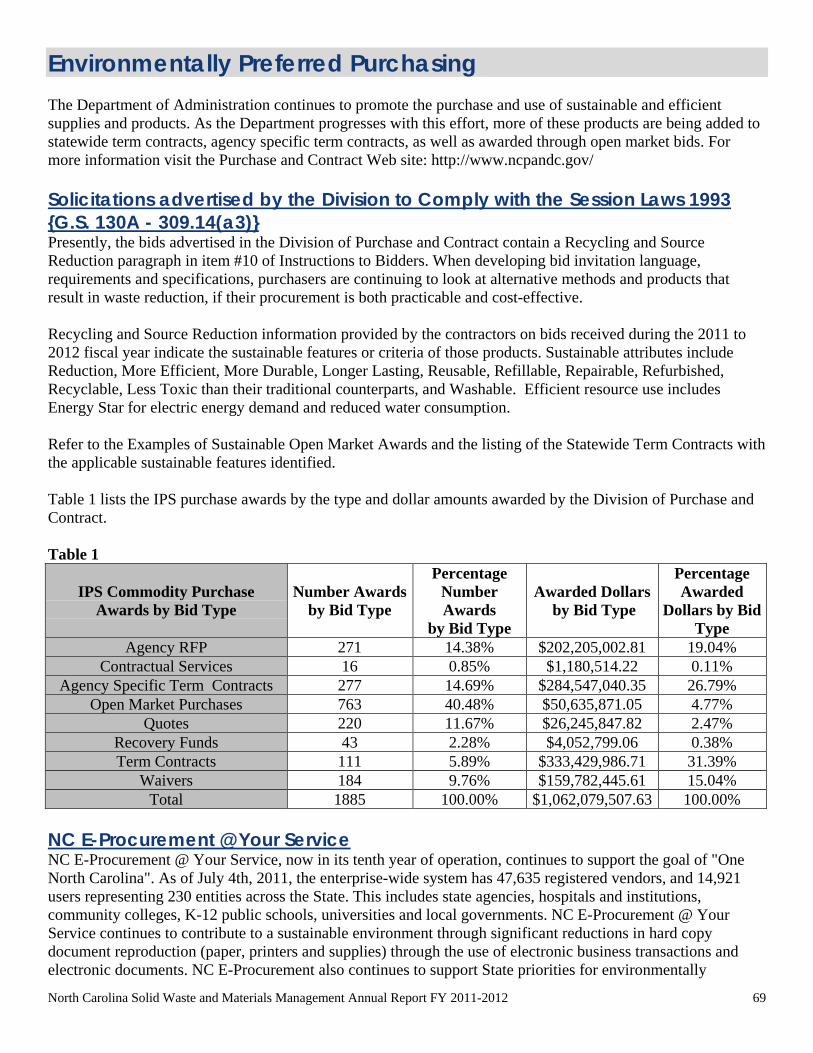
North Carolina Solid Waste and Materials Management Annual Report FY 2011-2012 69
Environmentally Preferred Purchasing The Department of Administration continues to promote the purchase and use of sustainable and efficient supplies and products. As the Department progresses with this effort, more of these products are being added to statewide term contracts, agency specific term contracts, as well as awarded through open market bids. For more information visit the Purchase and Contract Web site: http://www.ncpandc.gov/ Solicitations advertised by the Division to Comply with the Session Laws 1993 {G.S. 130A - 309.14(a3)} Presently, the bids advertised in the Division of Purchase and Contract contain a Recycling and Source Reduction paragraph in item #10 of Instructions to Bidders. When developing bid invitation language, requirements and specifications, purchasers are continuing to look at alternative methods and products that result in waste reduction, if their procurement is both practicable and cost-effective. Recycling and Source Reduction information provided by the contractors on bids received during the 2011 to 2012 fiscal year indicate the sustainable features or criteria of those products. Sustainable attributes include Reduction, More Efficient, More Durable, Longer Lasting, Reusable, Refillable, Repairable, Refurbished, Recyclable, Less Toxic than their traditional counterparts, and Washable. Efficient resource use includes Energy Star for electric energy demand and reduced water consumption. Refer to the Examples of Sustainable Open Market Awards and the listing of the Statewide Term Contracts with the applicable sustainable features identified. Table 1 lists the IPS purchase awards by the type and dollar amounts awarded by the Division of Purchase and Contract. Table 1
IPS Commodity Purchase Awards by Bid Type
Number Awards by Bid Type
Percentage Number Awards
by Bid Type
Awarded Dollars
by Bid Type
Percentage Awarded
Dollars by Bid Type
Agency RFP 271 14.38% $202,205,002.81 19.04% Contractual Services 16 0.85% $1,180,514.22 0.11%
Agency Specific Term Contracts 277 14.69% $284,547,040.35 26.79% Open Market Purchases 763 40.48% $50,635,871.05 4.77%
Quotes 220 11.67% $26,245,847.82 2.47% Recovery Funds 43 2.28% $4,052,799.06 0.38% Term Contracts 111 5.89% $333,429,986.71 31.39%
Waivers 184 9.76% $159,782,445.61 15.04% Total 1885 100.00% $1,062,079,507.63 100.00%
NC E-Procurement @ Your Service NC E-Procurement @ Your Service, now in its tenth year of operation, continues to support the goal of "One North Carolina". As of July 4th, 2011, the enterprise-wide system has 47,635 registered vendors, and 14,921 users representing 230 entities across the State. This includes state agencies, hospitals and institutions, community colleges, K-12 public schools, universities and local governments. NC E-Procurement @ Your Service continues to contribute to a sustainable environment through significant reductions in hard copy document reproduction (paper, printers and supplies) through the use of electronic business transactions and electronic documents. NC E-Procurement also continues to support State priorities for environmentally
North Carolina Solid Waste and Materials Management Annual Report FY 2011-2012 70
preferable products with over 17,708 catalog items clearly marked as "Recycled” of the total 91,082 catalog items. Purchasing Compliance Reviews North Carolina Administrative Code (01 NCAC 05B .1605) mandates that the Division of Purchase and Contract conduct compliance reviews on purchasing practices of all state agencies (institutions, hospitals, community colleges, universities, and state agencies). All compliance reviews, except universities, are conducted utilizing data from the NC E-Procurement System. Electronic data reduces the necessity of conducting most phases of the analysis on-site; thereby increasing efficiency, as well as reducing travel costs, fuel emissions, and operating expenses. IPS (Interactive Purchasing System) & Vendor Link NC The Division of Purchase and Contract continues to promote opportunities for vendors to do business with the state through electronic advertisement of goods, services and design/construction in IPS. The entities using this system consist of state agencies, institutions, universities, community colleges, K-12 public schools, and local governments. Vendor Link allows vendors to register to receive electronic notification of solicitations. Vendor Link had 26,961 registered vendors as of June 30, 2012. The system continues to grow with the addition of users increasing to 531 agencies, schools and institutions with 1,589 purchasers, who posted 6,295 solicitations using the database from July 1, 2011 to June 30, 2012. Examples of Sustainable Open Market Latent Master Mobile Fingerprint Station Mobile fingerprint station was purchased for the North Carolina Justice Academy with grant fund for training courses. Ultraviolet to infrared light spectrum imaging system provides a viewer and image capture video system. Reduced chemicals are used, mixed and stored in fingerprint detection and capture. Reduced external illumination requirements also improve energy efficiency and reduces processing time. Electric Materials Handling Equipment Electric forklift and pallet jacks were purchased for the Department of Corrections employing alternating current (AC) traction motors with electric braking technology to return braking energy back to the battery. System improves service time between recharging and reduces routine maintenance in conjunction with adjustments associated with motor brushes and friction brakes. System may contribute to greater reliability and lower service costs. LED Stage Lighting Color LED stage lighting fixtures were purchased for replacement of high wattage incandescent stage lighting fixtures for Coastal Carolina Community College. Fixtures increase stage illumination capabilities with automated color variability and addressable sequencing of the LED element array. New LED fixtures provide energy efficiency, durability, low maintenance, and intelligent control for color washing of large areas on the stage. Lower temperature lighting fixtures allow increased safety for handling and setup. Wind Turbines Two wind turbines, rated at 1500 kWh's (kilowatt hours) per year electrical generating capacity were purchased for Rockingham Community College. Turbines feature a six foot rotor and incorporate a blade tip power generating system without a central gear box or generator as in a traditional windmill configuration. Design is expected to significantly reduce mechanical resistance and wind drag. Unique design of multi-stage blades is intended to ensure that the maximum wind energy is captured without the typical noise and vibration associated

North Carolina Solid Waste and Materials Management Annual Report FY 2011-2012 71
with increased operating blade span. Turbine design allows a start-up speed as low as 0.5 mph and to start generating power at 7.5 mph of wind speed. Equipment will be used student training in electrical/electronics technology program. Light Fixtures Upgrade An LED lighting system was purchased for Cleveland Community College for the upgrade of the incandescent lighting in the college gallery and studio. The new track lighting system included forty seven track mounted dimmable 27 watt LED lamps that are more energy efficient than incandescent lighting. Energy Efficiency ARRA Grant for Piedmont Community College Energy efficient equipment, materials and labor were purchased for a project on the Person County and Caswell County campuses of Piedmont Community College. The project was partially funded by the American Recovery and Reinvestment Act (ARRA) and administered by the NC Department of Commerce, State Energy Office. The project included funding for exterior window tinting at multiple buildings, equipment upgrade for the HVAC systems, including energy efficient motors, Building occupancy sensors and external lighting timers were also included in the equipment purchased for the project. All the equipment upgrades provide energy efficiency improvements. Solar Energy Systems A proposal was awarded to design and install a grid-tied photovoltaic array on the Alamance Community College campus adjacent to the Horticulture Department’s new greenhouse. Design included all materials, equipment and installation for the photovoltaic system. The system included the photovoltaic modules, inverter, disconnects, monitoring system, metering, mounting, wiring and all other related equipment necessary for complete installation. System provided a web-based monitoring system with a battery backup. The goal of the system is to serve as sustainable and educational tool for the college. Solar photovoltaic array also serves to provide sustainable energy generation for a net–zero energy use for the greenhouse over the course of the normal year. Virtual Reality Fire Extinguisher Training System A virtual reality fire extinguisher training system was purchased for Wilkes Community College. A digital fire extinguisher projects a conical laser light to replicate extinguisher discharge. The simulated discharge is aimed to sweep an LED display depicting a simulated flame which automatically varies in response to the simulated extinguisher discharge. System can simulate class A, B and C fires at four difficulty levels while providing an effective indication of trainee performance. Using the system saves the cost purchasing and refilling numerous extinguishers. With easy set up and no clean up required afterward, through training of multiple participants is enhanced. Virtual Reality Welding Trainer Unit Educational training tool that is designed to accelerate welding training of various types of welding equipment through the utilization of virtual reality was purchased for Davidson Community College. Trainer reduces material waste (base welding material, welding consumables, electrodes, shielding gas, consumable parts) and saves energy from the welding process. There are no welding fumes or exhaust of environmentally conditioned air during the simulated welding process. This is an example of reduction in materials and energy consumed. Used Dozer (Heavy Equipment) A 2006 John Deere 750J Dozer with low ground pressure, cabin with air conditioning, hydrostatic transmission, power-angle tilt, and 156 inch blade was purchased for Wildlife Resources Commission with federal grant funding for use with boating access areas. Purchase allowed a savings of $103,461 rather than buying new at $223,459. This is an example of reuse of resources.

North Carolina Solid Waste and Materials Management Annual Report FY 2011-2012 72
Used Commercial Washing Machine A 2005 model 800 pound capacity commercial washer/extractor was purchased for the Sampson County Correctional Laundry with receipt supported funds. Purchase allowed a savings of $42,000 less than the manufacturer’s new price of $157,526.75. This is an example of reuse of resources. Statewide Term Contracts As existing term contracts are re-bid and new term contracts are developed, the Division of Purchase and Contract continues to improve the contracts by offering a wide range of sustainable or environmentally friendly products. Examples of the sustainable features of these term contracts are listed below. Air Conditioners, Room, 031A - Items available through this contract were awarded based on the lowest
energy efficiency cost, meeting specifications. The majority of the items awarded are Energy Star Compliant, containing recycled materials and packaging.
Appliances, Domestic, 045A – All refrigerators, washers, and dishwashers are Energy Star Qualified.
Automotive, Industrial Parts and Supplies, 060A - Some products have recycled materials with 10%-
20% post consumer content. Batteries, Storage, 060B - Battery casings are made from recycled material (96%). Batteries are
exchanged as a core and picked up by the vendor. In addition the contractor will pick up and properly dispose of junk batteries on quantities less than 10. Core (junk) batteries are considered to be an environmental hazard and are otherwise expensive to properly remove.
Tire, Automotive, Recapping and Repairing, 060E – Retread tires extend the life of the original product.
The purchase of retreads saves resources used in the production of new tires. The use of retread tires reduces tire disposal. Retread tires cost less than new tires.
2012 Models Passenger Cars, 070A - More cars with 4 cylinder engines are offered than V6 engines.
One four cylinder model, four door subcompact was also awarded with a bi-fuel capability consisting of compressed natural gas (CNG) and gasoline. Unfortunately, limited availability of some vehicles restricted award of all the AFVs requested for the passenger cars. According to the Steel Recycling Institute, 67.7% of a vehicle is steel or iron. Of that steel or iron, 26.6% is post consumer material. Plug-in electric vehicles including a full electric car (Nissan Leaf) and a plug-in hybrid car (Chevy Volt) were included in the Invitation For Bids.
2012 Law Enforcement Vehicles, 070B - According to the Steel Recycling Institute, 67.7% of a vehicle
is steel or iron. Of that steel or iron, 26.6% is post consumer material. For law enforcement vehicles only 25% of the users still specify a V8 engine and that decline in demand for the V8 engines contribute to fuel savings.
Conventional School and Activity Buses, 070C; Conventional Activity Buses, 070D – Vehicles typically
contain approximately 20% post consumer recycled material by weight and 80% of the vehicle by weight is recovered for reuse. Used school buses are usually sold or are used for spare parts.
2012 Model Year Trucks, Vans, Utility Vehicles, Crossovers-Conventional Fuels and AFVs, TC # 070G
– All diesel fueled trucks and vehicles are required to additionally operate using B20 bio-diesel fuel. Gasoline fueled vehicles were also bid with flex fuel as an alternative category. Awarded flex fuel vehicles comply with the intent of Senate Bill 2051. Vehicles noted as Flex Fuel or E85 can use both pure gasoline and E85 fuel. A hybrid “carry all” SUV is available from the contract. Lightweight crossovers (4 and 6 cylinder) and manual transmission compact pickups were also awarded to

North Carolina Solid Waste and Materials Management Annual Report FY 2011-2012 73
potentially achieve greater fuel efficiency. User purchases of 6 cylinder engines have increased compared to V8 engines.
Neighborhood Electric Vehicles, 070N - Neighborhood Electric Vehicles (NEV) are battery operated
vehicles that are "street legal" for use on roads with a posted speed limit of 35 MPH or less. There are 8 different NEV models available from this contract from two suppliers offering the GEM, E-Ride and Columbia brand vehicles. Two of the larger Columbia electric vehicles are configured as a drop-side truck and van for maintenance and grounds-keepers. The contract vehicles are offered with a price range of $11,552 to $25,893 and include an extended warranty. Because these vehicles do not consume hydrocarbon fuel they produce zero direct emissions. It is estimated that NEVs cost 3 to 5 cents per mile to operate. These vehicles are considered good additions to agency fleets to help meet petroleum reduction goals.
Golf Cars, 070P – Fully electric models available for all categories with two, four and six passenger
models. Models are made with components of 85-90% recycled steel, plastic and aluminum. Light Transit Vehicles, 070U – Vehicles accommodate public transportation needs. Engines meet
current EPA emissions guidelines. Remanufactured Toner Cartridges, 207A - Currently common use Hewlett Packard and Lexmark
cartridges are remanufactured to equivalency with the original OEM performance. New Brother brand drum assemblies and toner hopper assemblies were also added. Product specifications are being transitioned from mandated construction requirements to product and vendor performance requirements. This is expected to allow a wider variety of brands and models to be covered as requested by the contract users. This contract reduces the number of reusable cartridges added to the waste stream.
Ballasts, 285B - Electronic ballasts are more energy efficient, support variable illumination on demand
and reduce electromagnetic radiation. A link is provided to Federal Energy Management Program (FEMP) that illustrates a return on investment for retrofitting with more energy efficient lamps and ballasts. Electronic ballasts contain no PCB’s and can be disposed of in the trash. Reduced product shape and size (form factor) also minimizes packaging and metal enclosure requirements.
LED Lighting, 285C – Contract consists of parabolic aluminized reflector (PAR) lamps, cove lighting,
area lighting, downlights, troffers and wall packs employing LED illumination for energy savings. Packaging is 60% recycled materials. Technology utilizes LED illumination for energy savings. Electronic lamps and fixture ballasts are more energy efficient, support variable illumination on demand and reduce electromagnetic radiation.
Energy Saving Devices, 285D – Contract includes T8 size tubular fluorescent retrofit kits, LED exit
signs, LED exit sign retrofit kits, occupancy/vacancy sensors, electronic dimmable ballasts, and controls. Products utilize LED illumination and dimmable ballasts for energy savings.
Carpet, 360A - Recycled content required is either (1) minimum 5% postconsumer content except that
vinyl-backed and other similar hard backed products contain 20% by weight of postconsumer recycled content, (2) minimum 15% by weight of recovered materials (both preconsumer and postconsumer), or (3) minimum of 25% by weight of recyclable content.
Paper, Computer and Labels, 395B - Computer paper contains from 30% to 50% recycled with 30% post
consumer content.

North Carolina Solid Waste and Materials Management Annual Report FY 2011-2012 74
Propane Tankwagon, 405A – Contract vendors have reported 4,130,217 gallons were purchased last year of this clean burning fuel.
Oils, Lubricants, Greases, and Antifreeze, 405H – The following synthetic, bio-degradable, and recycled
lubricants were reported as supplied under this contract: Synthetic Motor Oil (3,241 gallons), Synthetic/Biodegradable Hydraulic Oil (4,256 Gallons), Synthetic Gear Lubricant (11,480 Pounds), Synthetic/Biodegradable Automatic Transmission Fluid (659 Gallons), and Synthetic/Biodegradable Grease (4,532 Pounds). Additional synthetic type oils and transmission fluids have been added to the contract to allow increased service life to reduce consumption and decrease maintenance cycles. The State Surplus Property disposes of waste oil and antifreeze under contract. This year 9,675 gallons were purchased of Diesel Exhaust Fluid (DEF), an aqueous urea solution used in diesel engines to lower nitrogen oxides concentration in exhaust emissions. Nitrogen oxides, like hydrocarbons, are precursors to the formation of ozone and also contribute to the formation of acid rain.
Propane Transport, 405K – Contract vendors have reported 2,118,900 gallons were purchased last year
of this clean burning fuel. B-20 Transport, 405L - B20 blended fuel contains 80% diesel fuel and 20% virgin soy or reprocessed
vegetable oil. This means that of the reported 7,832,700 gallons of B20 blended fuel purchased, 1,566,540 gallons were produced from plant mater. This results in a reduction of crude oil consumption.
Gasohol, E-10 Transport, 405M - E-10 blended fuel contains 90% unleaded gasoline and 10% ethanol.
This means that of the reported 13,690,919 gallons of E10 blended fuel purchased, 1,369,091 gallons were derived from ethanol. This results in a reduction of crude oil consumption.
Pipeline Natural Gas, 405N – Contract vendors have reported 3,704,949 dekatherms were purchased last
year of this clean burning fuel. Ultra-Low Sulfur Diesel Transport, 405P – Contract offers 15 ppm of sulfur content compared to 500
ppm sulfur content on the previous low sulfur diesel contract. Transport loads are over 6,000 gallons per delivery, and are typically used heavily by DPI and DOT. Approximately 12,643,388 gallons were purchased. This will help to provide compliance with clean air mandates.
Ultra-Low #2 Sulfur Diesel Tankwagon, 405Q - Identical to the 405P contract except in form of
delivery, this offers 15 ppm sulfur content compared to 500 ppm sulfur content on the previous contract. Tankwagon loads are less than 6,000 gallons down to a minimum of 500 gallons. Approximately 1,206,129 gallons were purchased. This will help to provide compliance with clean air mandates.
E-85 Flex Fuel, 405R - E-85 blended fuel contains 15% unleaded gasoline and 85% ethanol derived
from corn production. This alternative fuel is provided in transport quantities of 6000 gallons or more. This means that of approximately 366,675 gallons of the blended E85 fuel purchased, 55,001 gallons were derived from ethanol which reduces crude oil consumption.
E-10 Tankwagon, 405S - E-10 blended fuel contains 90% unleaded gasoline and 10% ethanol.
Tankwagon loads are less than 6,000 gallons down to a minimum of 500 gallons. This means that of approximately 750,475 gallons of the blended E10 fuel purchased, 75,047 gallons were derived from ethanol which reduces crude oil consumption.
Ultra-Low Sulfur Diesel #2 Emergency Transport, 405T – Contract offers 15 ppm of sulfur content
compared to 500 ppm sulfur. This contract is used in emergency cases when there is a pipeline

North Carolina Solid Waste and Materials Management Annual Report FY 2011-2012 75
interruption. The ultra-low sulfur content will help to provide compliance with clean air mandates. No sales were required from this contract during the fiscal year.
E-10 Emergency Transport, 405U – E-10 blended fuel offers 90% unleaded gasoline and 10% ethanol.
This contract is used in emergency cases when there is a pipeline interruption. The ethanol blend can reduce crude oil consumption. No sales were required from this contract during the fiscal year.
Bio-Diesel Fuel, B-20 Tankwagon, 405V – B20 blended fuel contains 80% diesel fuel and 20% virgin
soy or reprocessed vegetable oil. Tankwagon loads are less than 6,000 gallons down to a minimum of 500 gallons. This means that of 52,604 gallons purchased, 10,520 gallons are derived from plant mater. This results in a reduction of crude oil consumption.
E-85 Tankwagon, 405X - E-85 blended fuel contains 15% unleaded gasoline and 85% ethanol derived
from corn production. Tankwagon loads are less than 6,000 gallons down to a minimum of 500 gallons. From the approximately 43,656 gallons reported sold of the blended E85 fuel, 37,107 gallons were derived from ethanol which reduces crude oil consumption.
Aviation Fuels, 405Y - Contract includes aviation gasoline (avgas) and Jet A fuels. The aviation
gasoline provided has a lower lead content of the fuel. No sales were required from this contract during the fiscal year. Lead from engine exhaust fumes is classified an irreversibly neurotoxin and the lower lead content gasoline would be less toxic than the traditional formulation.
Furniture, Metal, Folding Chairs, Tables, Storage Units, Wood Library Furniture, 420A - Furniture,
Desks (Wood), Credenzas, Conference Tables, Etc. & Bookcases, Furniture, 425B & C - Contractors support sustainability through different practices. Mechanical parts can be recycled or replaced, thereby extending service of item. Packaging is recyclable. Products may be ground up into particleboard. Packaging may contain from 15% to 75% post consumer waste and is reusable. Wood, plastic and metal contain recycled post consumer content and are recyclable. Product offerings are using more sustainable methods because they offer a competitive price advantage over those who use all virgin materials. Soy foam in chair seats and backs are now available and is more environmentally friendly because it is made partly from soybeans, a renewable resource.
Furniture, Library, Wooden, 420D – Packaging is recycled. Wood scraps from the manufacturing
process are either mulched for recycled materials or converted into energy. Manufacturing may use a water based top coat in wood finishing process.
Furniture Contracts, 425A & 425D - Product offerings are using more sustainable methods because they
offer a competitive price advantage over those who use all virgin materials. Soy foam in chair seats and backs are now available and is more environmentally friendly because it is made partly from soybeans, a renewable resource.
Bedding Mattress Term Contract, 420E - Mattresses comprised of innersprings (similar to the type used
primarily in the residential and hospitality bedding industries) now require successful evaluation to the 16 CFR Part 1633, the Consumer Product Safety Commission’s new mattress flammability testing standard, “Standard for the Flammability (Open Flame) of Mattress Sets”. Successful evaluation of products offered continue to require the 16 CFR Part 1632, Standard for the Flammability of Mattresses and Mattress Pads (directed toward cigarette ignition of mattresses). The revised specifications promote increased safety and durability to extend product life.
Furniture, Chairs, Ergonomic, 425E – Fabric and chair cushions may contain up to 100% post consumer
recycled content. Packaging contains post consumer waste, is reusable and recyclable after use. Product

North Carolina Solid Waste and Materials Management Annual Report FY 2011-2012 76
offerings are using more sustainable methods because they offer a competitive price advantage over those who use all virgin materials. Some are now offering soy foam in chair seats and backs as well as recycled wood components. Fabric and chair cushions contain up to 100% post consumer recycled content approximately 40% total recycled content. Packaging contains up to 100% recycled materials and is recyclable.
Lateral and Vertical Filing Cabinets, 425F & 425G - Cabinets contain from 10% to 30% recycled
content. Corrugated boxes have a minimum of 50% post consumer waste and are recyclable. Industrial, Medical and Specialty Gases, 430A - Are delivered statewide in reusable cylinders and are
exchanged when replacement cylinders are needed. Disinfectants, Janitorial Cleaners, Environmental Cleaners, and Odor Counteractants, 435A –. The
additions of three common use janitorial products which are certified to the GS-37 (Green Seal), Certified Environmental Standard were awarded to products that have limited toxicity. Premoistened towelettes are available to provide an alternative for chemicals from being aerosoled or dispensed in the indoor air. Disinfectants included contain various active ingredients and end use concentrations to allow proper selection for limiting contact and exposure to amounts required to be efficacious for specific pathogens targeted. All disinfectants are EPA registered for efficacy of pathogens identified by the NC Statewide Program for Infection Control and Epidemiology within health care related facilities. Chemical dilution control equipment for designated products is supported to improve sanitation quality, deliver accurate recommended product dilution and control costs. Contractors are required to provide the product use training and MSDS sheets.
Maintenance, Repair & Operation Supplies, 445B – Items which were offered under the following
contracts are now covered under this contract: Lamps, Large & Specialty (285A), Material Handling Carts/Trucks (560A), Low-Flow Plumbing Fixtures (670A), and Safety Equipment, Eye/Face Protectors (345A). Lamps may contain up to 65% recycled content including glass and mercury delivered in packaging that may contain 73% recycled content. Some of the lamps are low mercury (TCLP compliant), non-hazardous. Low-flow plumbing fixtures are offered to reduce water consumption.
Locks, Locking Devices & Accessories, 450B – Product metal content includes 26-31% Pre-Consumer
recycled materials and 4-6% Post-Consumer recycled materials. External Defibrillators, 465B - Defibrillators can be refurbished and packaging materials can be
recycled. Incontinent Care Products, Disposable, 475C - Disposable washcloths (wipes) contain a minimum 50%
of fully biodegradable paper (cellulose fibers). Grounds Maintenance Equipment, 515B – Contract includes, walk behind products/equipment, mowers
and lawn & garden tractors, hand held equipment (hand-held type), hand held equipment, tractors, utility vehicles, golf & turf equipment, and other equipment. Equipment is manufactured with typically 20% recycled steel and plastic.
LED Vehicle Traffic Signal Modules, 550A - Traffic signals and crosswalk notification employing the
high efficiency light emitting diode (LED) technology consume 90% less energy than conventional signals, while providing greater reliability, longer life, and low-maintenance performance. Signals are certified for ENERGY STAR for reduced energy consumption.

North Carolina Solid Waste and Materials Management Annual Report FY 2011-2012 77
Musical Instruments and Accessories, 580B - New designs use recyclable plastics. Band instruments may be traded in to be reconditioned and re-sold. Donations of trade-in instruments to the Links Program for the needy promote music education. Plastic and brass parts may be recycled for future part replacement. Package cushioning contains 94% post consumer material. Cardboard and pallets are recyclable.
Traffic Signal Equipment, 550D - Lenses and signal head hardware are compatible with energy efficient
LED lamps. Traffic Cones and Drums, 550F – Contract includes caution drums and cones with up to 35% recycled
content in the plastic body and up to 100% post consumer recycled content for the rubber support base for either product.
Trailer-Mounted Solar Powered Flashing Arrow Board, 550G - Agency specific term contract provides
availability of a trailer mounted, solar charged 15 lamp LED array arrow board and related parts for the NC Department of Transportation. Amber lights on panel board are electronically actuated to form various configurations to signal, control, and direct high speed vehicle traffic. Portable solar powered unit includes energy efficient lamps and controls.
Calculators, 600A - Packaging material may be recycled.
Dictation/Transcription Equipment, 600C - New digital recorders employ internal electronic storage
media for constant reuse without cassette tapes. Voice recordings may be easily downloaded for dictation transcription, copied to disc (CD or DVD) and transmitted to distant or remote locations. Only proofed or edited recordings are archived to (CD or DVD). Archived recordings enhance offline lectures and training events. Electronic storage media has a long lifetime before replacement. Contract also offers voice to text digital transcription software that serves the traditional state users or nonprofits for the physically impaired.
Office Supplies, 615A - Contractors are required to the extent feasible and practical, to offer recycled
products, including packaging, especially those having post-consumer waste content. Wherever possible and practical, such products should be identified as such.
Napkins, Bathroom Tissue & Paper Towels, 640A – All products on the contract are certified to Green
Seal standards GS-1 or GS-9, or Ecologo CCD-084 or CCD-086. Paper products are manufactured from 100% recycled fiber, with 40% to 80% of that recycled content being from post consumer content. Products are manufactured using either elemental chlorine-free or chlorine-free systems. This is an example of the use of recycled materials.
Office Paper, 645A - Various products contain both post consumer recycled content from 100% to 30%
and chlorine free copy paper. Other recycled and virgin paper products including envelopes are supported.
Bags, Plastic, Trash, 665B - Liners contain a minimum of 10% post-consumer or 10% pre-consumer
reprocessed copolymer. All the liners awarded were thoroughly evaluated for strength and performance. Laminators & Laminating Film, 665A - Some of the film contains 5% post consumer content. Packaging
contains 25%-80% post consumer content. Ammunition, 680A - Brass shell casings can be saved and recycled and others can be reloaded.

North Carolina Solid Waste and Materials Management Annual Report FY 2011-2012 78
Vending Machines and Money Changers, 740B - Vending machines were purchased for the Department of Health and Human Services that are twice as energy efficient as machines made 5 years ago. Equipment features high-efficiency refrigeration, foam-injected insulation and LED display lighting. Refrigerated versus chilled storage space allocation is adjustable for varied product dispensing. Wireless monitoring systems boost efficiency with 24/7 communication and report diagnostics including amount of product needed to refill unit. This is an example of reduced energy consumption with the reduced cost of service/refill trips on an as needed basis. Packaging, refrigerant and metal components may contain recycled content and are recyclable.
Construction Equipment, 760H – Construction Equipment covers excavators, wheel excavators, track
loaders, compact track loaders, wheel loaders, skid steer loaders, backhoe loaders, crawler dozers, crawler loaders, wheel dozers, motor graders, utility cranes, and compactors. Appropriate attachments or equivalent products are included in the contract. Equipment manuals and parts catalogs are provided in hard copy and electronic copies. Engines meet current EPA Tier and emissions guidelines.
Forestry Equipment, 760L – Equipment includes feller bunchers, knuckleboom loaders, forestry swing
machines, and harvesters. Appropriate attachments or equivalent products are included in the contract. Equipment manuals and parts catalogs are provided in hard copy and electronic copies. Engines meet current EPA Tier requirements.
Tires and Tubes, 863A - Tires depending on manufacturer may contain from 1.55% to 2.5% of recycled
materials based on the product attributes, speed rating and performance criteria. Teaching Equipment, Electricity/Electronics Courses, 924A - Office paper, cardboard and metal
enclosures have recycled content. Documentation may be provided in soft copy instead of hard copy printed materials.
Electronic Equipment Recycling Services, 926A - Assists agencies and local governments with
contracted disposal of CRTs. Contract diverts discarded electronic products from landfill disposal. Recycling Services for Fluorescent Lamps, Ballasts & Other Mercury Containing Devices, 926B –
Contract assists agencies and local governments with contracted disposal of discarded electronic products that are diverted from landfill disposal.

North Carolina Solid Waste and Materials Management Annual Report FY 2011-2012 79
Items Aiding Waste Reduction Purchased By State Agencies Through Term Contracts and Open Market Purchases The following items purchased by State agencies meet the criteria for aiding waste reduction by being reusable, refillable, repairable, more durable, and/or less toxic than their traditional counterparts:
Reusable Refrigerant Recovery System (filters reusable refrigerant) Musical Instruments Recycled Carpet fiber Recycled Paper fiber Recycled Content Furniture (not traditional wood) Printers Solvent Degreaser (reuses solvent) Tire Recapping & Repairing Service Uniforms, Wiping Cloths More Durable Above-Ground Vaulted Fuel Storage Tanks Classroom Furniture, Electronic Lamps & Ballasts Vacuum Cleaners, Floor Polish, Grader Blades Grader Slope Attachment, Plastic Lumber, Mattresses Vertical File Cabinets, Wood Case goods Wood library furniture Energy Star – Reduced Energy Consumption Audio Visual System, Changeable Message Signs – Solar Powered Domestic Appliances Lighting Fixtures, Room Air Conditioners, Lamps Traffic Signals – LED, Warning Lights - Vehicles Safety Water Coolers Flow Plumbing Fixtures for Reduced Water Consumption – 0.5 GPM lavatory facet nozzles and 1.5 GPM showerheads support the Governor’s water conservation initiative during severe water restrictions throughout the state.
Used - Automobiles and trucks Refillable Ammunition - Cartridge Refills Batteries - Vehicle & Storage Drums – Steel, Fire Extinguishers Cylinders for Welding, Medical & Specialty Gases Fuel Tanks, Self-Contained Breathing Apparatus Repairable Defibrillators, Musical Instruments Tire Recapping & Repairing Service Refurbished/Rebuilt Medical Diagnostic Equipment & Instrumentation Remanufactured Toner Cartridges, Scientific Equipment, Sewing Machines Less Toxic Alternative Fuel Vehicles, Dry Cell Batteries, Electronic Lamps & Ballasts, Fertilizers/Farm Chemicals, Inks for printing (using non-petroleum based inks) Instructional Art Materials, Markerboard Markers, Mattresses, Scientific Products (eliminating Freon), Refrigeration and A/C Equipment Longer Lasting Floor Maintenance Machine Batteries, Library Furniture, Aluminum Nuts and Bolts – non-rusting alloys, Fluorescent electronic ballasts permit longer lamp life Recyclable Commodity Packaging, Commodity Metal enclosures & parts, Plastics, Steel & Reinforced Concrete Pipe, Chain Link Fencing, Electrical Wire, Treated Lumber, Motor Oil – refined, HVAC & Refrigeration Equipment - Refrigerants Washable - HVAC Filters, Wiping Cloths
North Carolina Solid Waste and Materials Management Annual Report FY 2011-2012 80
NCDOT - Reduce/Reuse/Recycle Report
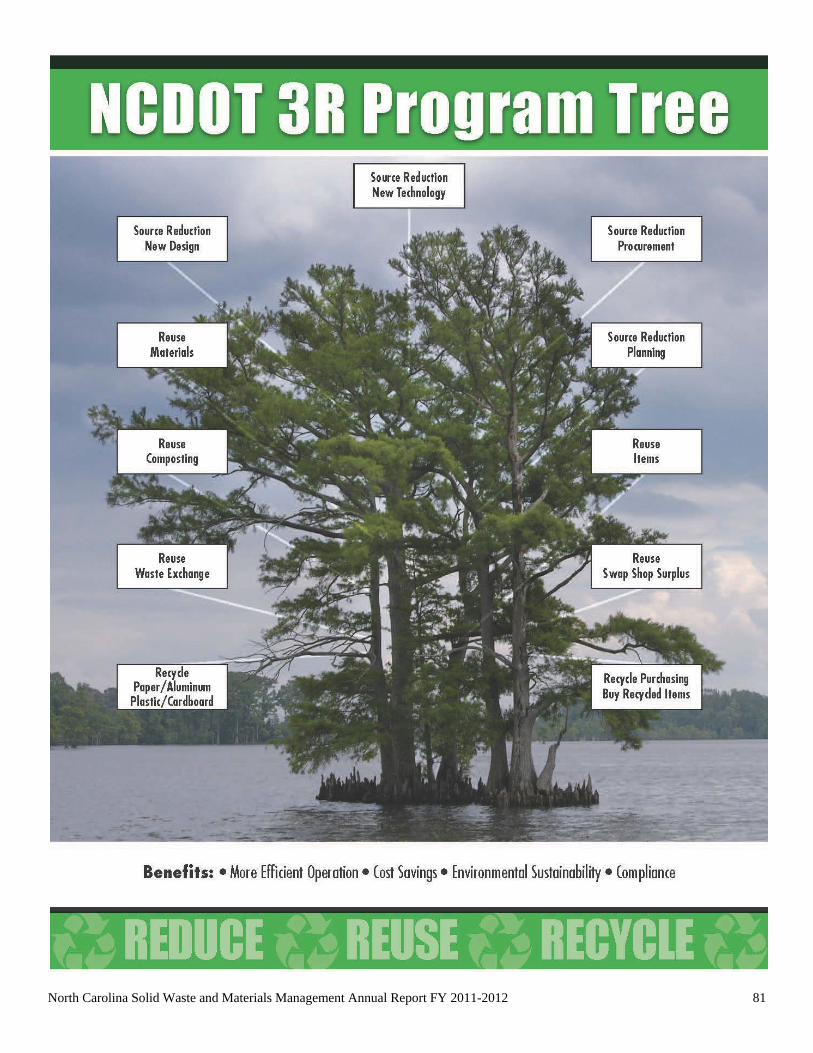
North Carolina Solid Waste and Materials Management Annual Report FY 2011-2012 81

North Carolina Solid Waste and Materials Management Annual Report FY 2011-2012 82

North Carolina Solid Waste and Materials Management Annual Report FY 2011-2012 83

North Carolina Solid Waste and Materials Management Annual Report FY 2011-2012 84

North Carolina Solid Waste and Materials Management Annual Report FY 2011-2012 85
North Carolina Solid Waste and Materials Management Annual Report FY 2011-2012 86
Recycling and Solid Waste Management Report for Highway Construction and Maintenance Projects
State Fiscal Year 2011 – 2012 This report is a summary of the recycling and solid waste management efforts on highway construction and maintenance projects within the North Carolina Department of Transportation for state fiscal year 2012 (July 1, 2011 - June 30, 2012) as required by G.S. 136-28.8(g). This statute mandates that the Department prepare an annual report on the amounts and types of recycled materials specified or used in construction and maintenance operations during the previous state fiscal year. The types of recycled materials incorporated into the projects noted would routinely contribute to the consumer and industrial waste streams, compounding the problem of declining space in landfills. Efforts to utilize recycled and solid waste materials are in response to the requirements of G.S 136-28.8(b) which mandates the Department to use recycled materials in highway projects. All applications of recycled materials are to be consistent with economic feasibility, applicable engineering, and environmental quality standards. Highway Construction and Maintenance Projects Specifications now require that many of the products used in highway construction projects, such as guardrail offset blocks and flexible delineator posts, be manufactured from some quantity of recycled materials. Glass beads used for retroreflective pavement markings are manufactured from 100% recycled glass. Reclaimed asphalt pavement (RAP) may constitute up to 50% of the total material used in most recycled mixtures, and RAP mixtures are used on a majority of projects. Fly ash is sometimes used as a concrete component for up to 20% by weight of the required cement content. Some of the notable recycled or solid waste materials utilized this fiscal year are:
• 1.23 Million tons of Reclaimed Asphalt Pavement (RAP) were used as an asphalt mix additive. • 63,959 tons of Reclaimed Asphalt Shingles (RAS) were used as an asphalt mix additive. • 31,360 tons of coal combustion fly ash were used in concrete mixes. • Approximately 6,000 tons of recycled glass beads were used in pavement markings. • Maintenance personnel across the state continue to reuse products including aggregate base course,
concrete pipe, guardrail, signs and posts, and steel beams. See Attachment 1 for quantities of recycled and solid waste materials used during the 2011 – 2012 state fiscal year. See Attachment 2 for total quantities and rolling averages since 1989.

North Carolina Solid Waste and Materials Management Annual Report FY 2011-2012 87

North Carolina Solid Waste and Materials Management Annual Report FY 2011-2012 88

North Carolina Solid Waste and Materials Management Annual Report FY 2011-2012 89
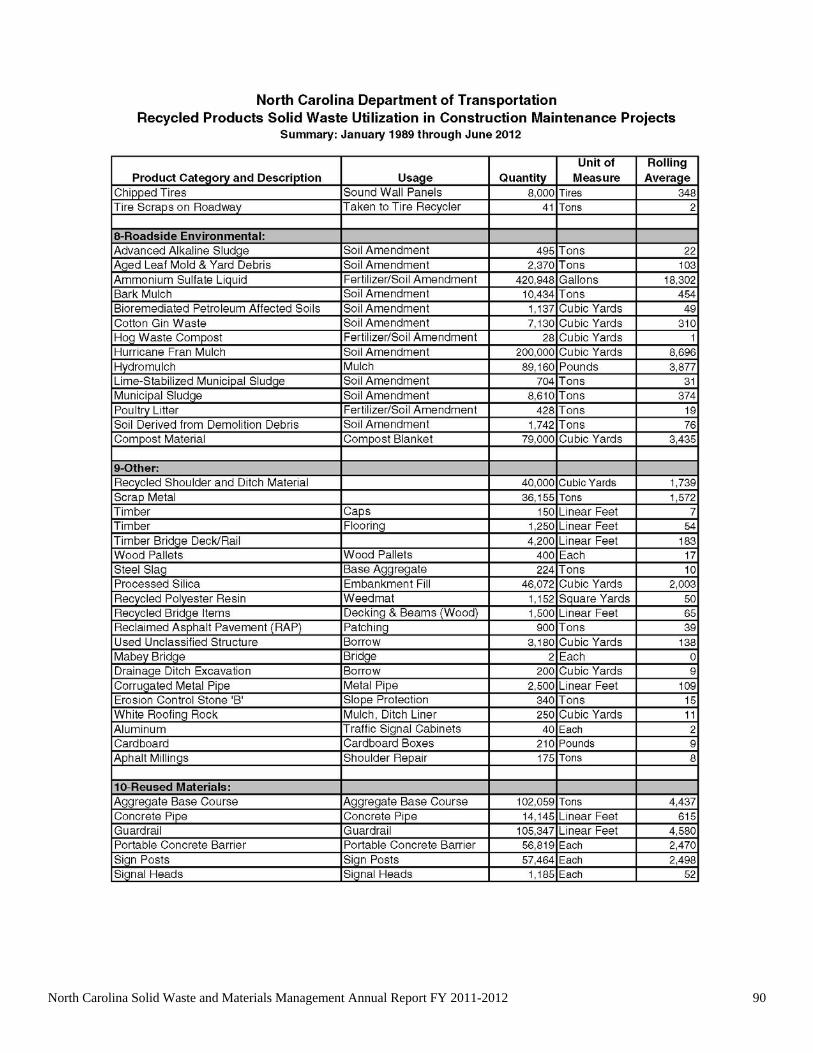
North Carolina Solid Waste and Materials Management Annual Report FY 2011-2012 90
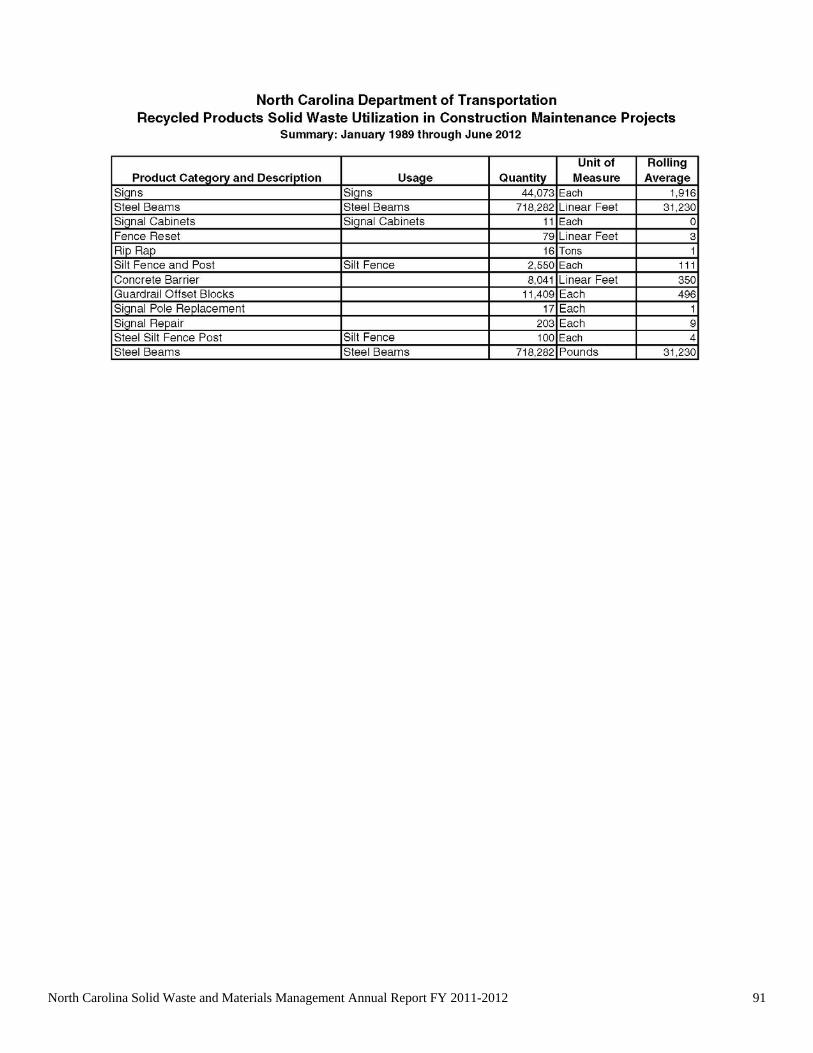
North Carolina Solid Waste and Materials Management Annual Report FY 2011-2012 91
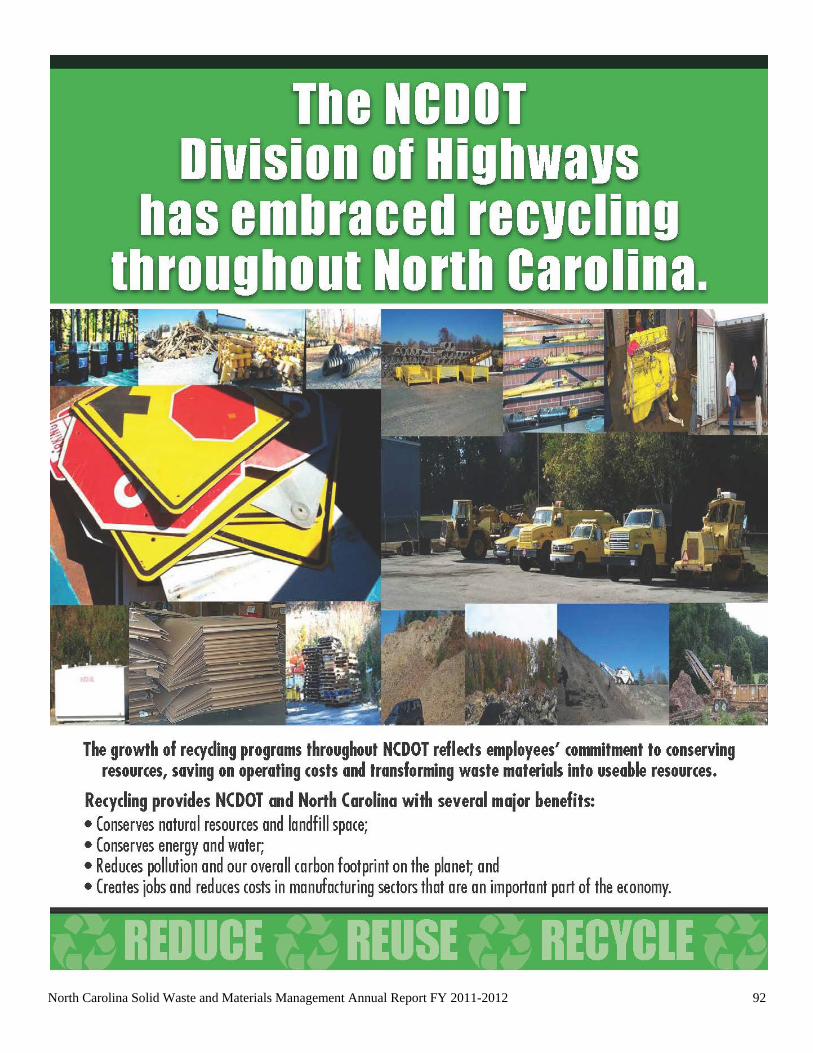
North Carolina Solid Waste and Materials Management Annual Report FY 2011-2012 92
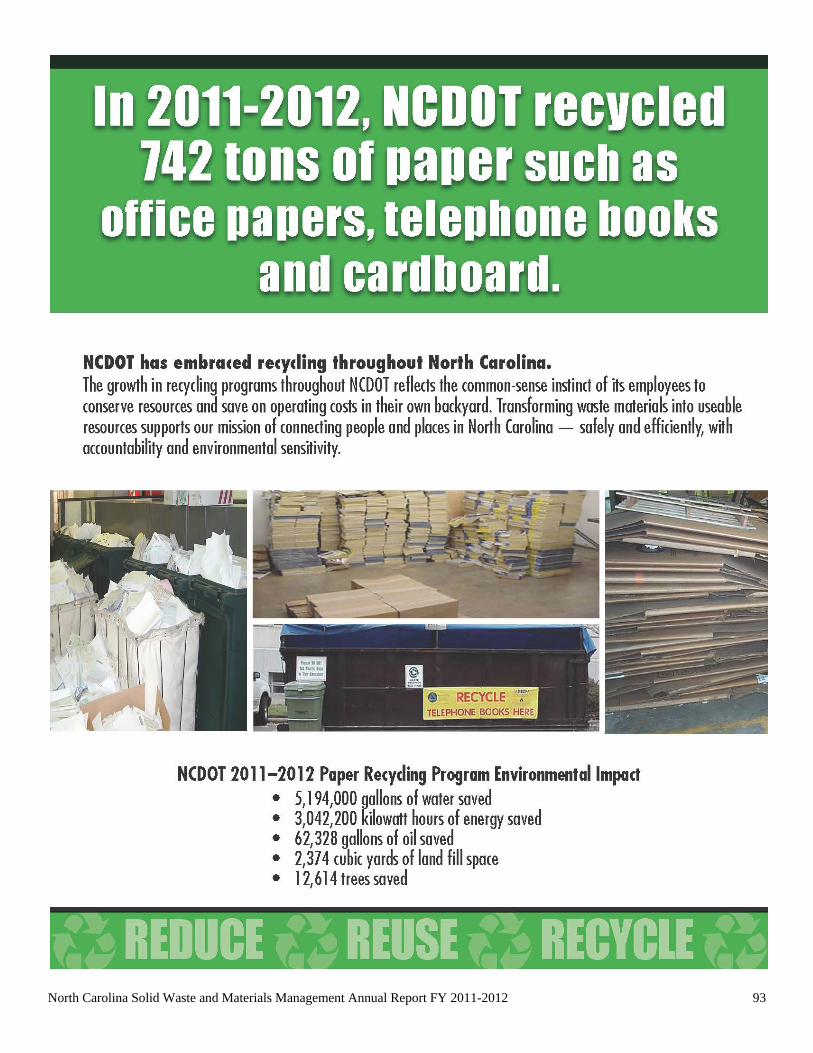
North Carolina Solid Waste and Materials Management Annual Report FY 2011-2012 93
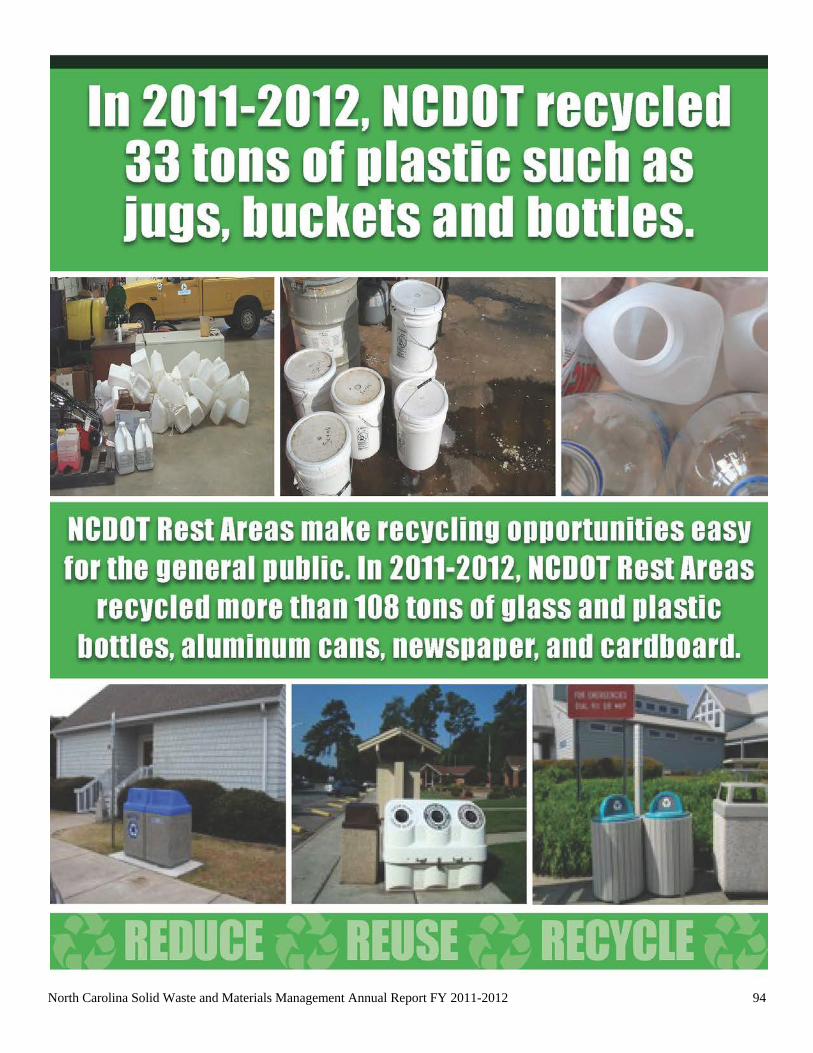
North Carolina Solid Waste and Materials Management Annual Report FY 2011-2012 94

North Carolina Solid Waste and Materials Management Annual Report FY 2011-2012 95

North Carolina Solid Waste and Materials Management Annual Report FY 2011-2012 96
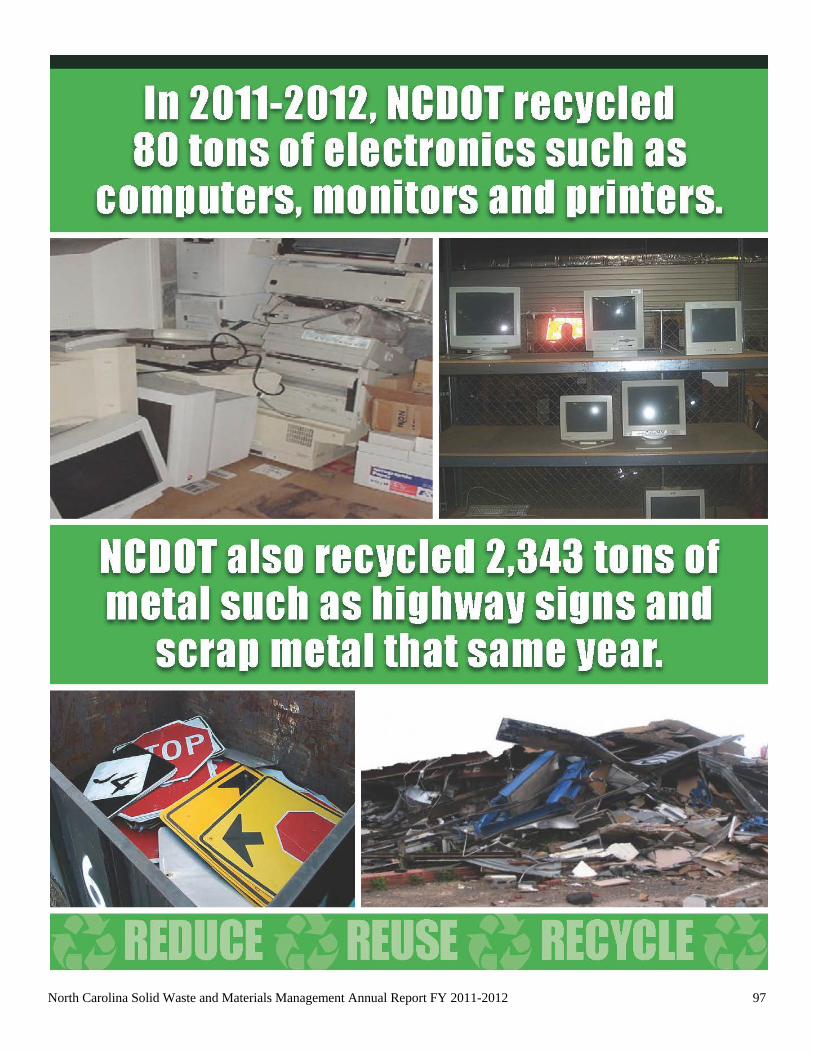
North Carolina Solid Waste and Materials Management Annual Report FY 2011-2012 97
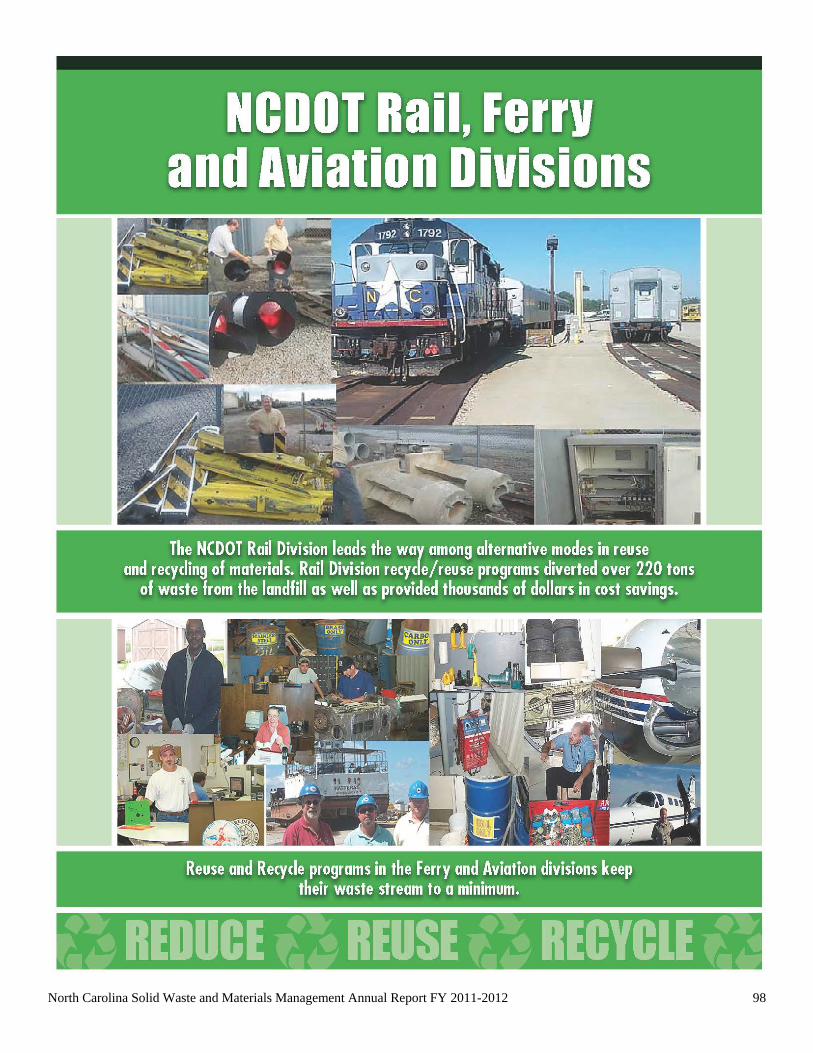
North Carolina Solid Waste and Materials Management Annual Report FY 2011-2012 98

North Carolina Solid Waste and Materials Management Annual Report FY 2011-2012 99