north carolina public school kitchen capacity study
TRANSCRIPT

REPORT
North Carolina Public School Kitchen Capacity Study: Healthy Foods, Farms, and Kids
July 2015
Andrew George, PhDMaureen Berner, PhDRebecca Dunning, PhD
Findings at a GlanceIn 2014, researchers at the UNC School of Government and the Center for Environmental Farming Systems based at North Carolina State University conducted the first-ever statewide survey of public school kitchens in North Carolina. This survey was designed to shed light on the ability of school kitchens to serve farm-fresh foods and to identify possible leverage points for increasing the amount and variety of these foods served in school cafeterias. Specifically, school cafeteria managers and school nutrition directors were asked about the possibility of preparing leafy greens (i.e., locally grown collards, mustard greens, turnip greens, kale, etc.), sweet potatoes (baked whole or chopped and roasted), and apples (fresh slices or peeled, sliced, and baked). An analysis of responses from 724 North Carolina schools found the following:
• The vast majority of cafeteria managers and school nutrition directors reported a willingness to prepare fresh leafy greens, sweet potatoes, and apples for student meals.
• Of cafeteria managers and school nutrition directors who stated that they were unwilling to prepare fresh items, the primary reason given was lack of time and labor capacity.
• Labor capacity, measured in number of hours of full- and part-time staff adjusted for school size, was associated with greater willingness to use fresh leafy greens, sweet potatoes, and apples.
• Schools with a combination oven/steamer (combi-oven) and walk-in refrigeration were more willing to prepare and serve leafy greens.

© 2015School of GovernmentThe University of North Carolina at Chapel Hill
This report is copyrighted and subject to “fair use” as permitted by federal copyright law. No portion of this publication may be reproduced or transmitted in any form or by any means—including but not limited to copying, distributing, selling, or using commercially—without the express written permission of the publisher. Commercial distribution by third parties is prohibited. Prohibited distribution includes, but is not limited to, posting, e-mailing, faxing, archiving in a public database, installing on intranets or servers, and redistributing via a computer network or in printed form. Unauthorized use or reproduction may result in legal action against the unauthorized user.
The School of Government at the University of North Carolina at Chapel Hill works to improve the lives of North Carolinians by engaging in practical scholarship that helps public officials and citizens understand and improve state and local government. Established in 1931 as the Institute of Government, the School provides educational, advisory, and research services for state and local governments. The School of Government is also home to a nationally ranked graduate program in public administration and specialized centers focused on information technology and environmental finance.
As the largest university-based local government training, advisory, and research organization in the United States, the School of Government offers up to 200 courses, webinars, and specialized conferences for more than 12,000 public officials each year. In addition, faculty members annually publish approximately 50 books, manuals, reports, articles, bulletins, and other print and online content related to state and local government. Each day that the General Assembly is in session, the School produces the Daily Bulletin Online, which reports on the day’s activities for members of the legislature and others who need to follow the course of legislation.
The Master of Public Administration Program is offered in two formats. The full-time, two-year residential program serves up to 60 students annually. In 2013 the School launched MPA@UNC, an online format designed for working professionals and others seeking flexibility while advancing their careers in public service. The School’s MPA program consistently ranks among the best public administration graduate programs in the country, particularly in city management. With courses ranging from public policy analysis to ethics and management, the program educates leaders for local, state, and federal governments and nonprofit organizations.
Operating support for the School of Government’s programs and activities comes from many sources, including state appropriations, local government membership dues, private contributions, publication sales, course fees, and service contracts. Visit www.sog.unc.edu or call 919.966.5381 for more information on the School’s courses, publications, programs, and services.
Michael R. Smith, Dean
Thomas H. Thornburg, Senior aSSociate Dean
Frayda S. Bluestein, aSSociate Dean for facult y Development
Johnny Burleson, aSSociate Dean for Development
Todd A. Nicolet, aSSociate Dean for operationS
Bradley G. Volk, aSSociate Dean for aDminiStration
FACULTY
Whitney AfonsoTrey AllenGregory S. AllisonDavid N. AmmonsAnn M. AndersonMaureen BernerMark F. BottsMichael CrowellLeisha DeHart-DavisShea Riggsbee DenningSara DePasqualeJames C. DrennanRichard D. Duck erJoseph S. FerrellAlyson A. GrineNorma HoustonCheryl Daniels HowellJeffrey A. HughesWillow S. JacobsonRobert P. JoyceDiane M. JuffrasDona G. LewandowskiAdam Lovelady
James M. MarkhamChristopher B. McLaughlinKara A. MillonziJill D. MooreJonathan Q. MorganRicardo S. MorseC. Tyler MulliganKimberly L. NelsonDavid W. OwensLaToya B. PowellWilliam C. RivenbarkDale J. RoenigkJohn RubinJessica SmithMeredith Smith Carl W. Stenberg III John B. Stephens Charles SzypszakShannon H. TuftsVaughn Mamlin UpshawAimee N. WallJeffrey B. WeltyRichard B. Whisnant
Support for this research was provided by the Blue Cross and Blue Shield of North Carolina Foundation with a grant to the Center for Environmental Farming Systems that included work on statewide assessments.
The Center for Environmental Farming Systems (CEFS), established in 1994 by North Carolina State University and North Carolina A&T State University in conjunction with the North Carolina Department of Agriculture and Consumer Services, develops and promotes food and farming systems that protect the environment, strengthen local communities, and provide economic opportunities in North Carolina and beyond. CEFS and its community-based food systems and supply chain work involve multi-stakeholder collaborations, from farmers and processors to state agencies and non-governmental
organizations. CEFS’s associated researchers and staff of community food system practitioners manage integrated research programs in sustainable and organic agriculture; co-lead (with Cooperative Extension) the NC FoodCorps program, which brings graduating college students into N.C. schools to develop gardens and other agriculture programs; operate academic programs, including a residential summer internship program for undergraduates; and offer a variety of hands-on workshops for more than three thousand individuals each year.

© 2015 UNC Chapel Hill School of Government. Do not duplicate.
EXECUTIVE SUMMARY
North Carolina Public School Kitchen Capacity Study: Healthy Foods, Farms, and KidsAndrew George, PhD Maureen Berner, PhDRebecca Dunning, PhD
July 2015
In 2014, with the assistance of the North Carolina Department of Public Instruction (DPI), researchers at the School of Government at the University of North Carolina at Chapel Hill and the Center for Environ-mental Farming Systems based at North Carolina State University conducted the first statewide survey of public school kitchens in North Carolina. The survey was designed to shed light on the ability of school kitchens to prepare and serve farm-fresh foods and to identify possible leverage points for increasing the amount and variety of these foods served in school cafeterias. The survey collected data on the types of equipment available for storing and preparing food in individual school kitchens and on their levels of staff-ing and staff education. Respondents were asked about their kitchen’s equipment inventory and their ability to receive, prepare, and serve three fresh items: apples, sweet potatoes, and leafy greens. These products represent three of the top four farm-to-school products purchased by North Carolina schools. DPI distrib-uted the survey to school cafeteria managers and school nutrition directors in early 2014. A total of 2,400 surveys were distributed, with 724 valid responses received (a 30 percent response rate); 63 of the state’s 115 public school districts were represented.
The vast majority of those surveyed said they would use the specified fresh produce: leafy greens (87 per-cent), sweet potatoes (94 percent), and apples (97 percent). Researchers compared participants’ willingness to use these fresh foods to the presence of different types of equipment, labor capacity (measured by staff hours), staff education level, and size of school. Two types of equipment were significantly related to prepar-ing and serving leafy greens: a walk-in refrigerator and a combination oven/steamer (combi-oven). Larger schools (those with higher average daily attendance) were more likely to have both of these pieces of equip-ment, but school size alone did not predict the inclusion of leafy green vegetables on school menus. Labor capacity, measured as the number of available hours of full- and part-time staff adjusted by school size, was a significant predictor of fresh food use: schools with greater labor capacity were more willing to prepare and serve leafy greens, sweet potatoes, and apples. Level of education and years of experience for kitchen management and staff were not related to the use of any of the survey foods.
Qualitative data, in the form of free text responses as to why respondents would not prepare and serve each of the three target produce items, indicated that the primary reason was lack of labor and the time necessary to prepare fresh foods (which accounted for 41 percent of the reasons given). Other issues included restrictions on the use of unprocessed or non-approved items (13 percent), student taste preferences (11 percent), and absence of the foods from the menu plan (9 percent).
Summary of Findings • The vast majority of school cafeteria managers and school nutrition directors reported a willingness
to prepare fresh leafy greens, sweet potatoes, and apples for student meals. • Of cafeteria managers and school nutrition directors who stated that they are unable to prepare fresh
items, the primary reason given was lack of time and labor capacity. • Labor capacity, measured in number of hours of full- and part-time staff adjusted for school size, was
associated with greater use of fresh leafy greens, sweet potatoes, and apples. • Schools with combi-ovens and walk-in refrigeration were more likely to serve fresh leafy greens.


Contents
Introduction 1
School Nutrition: Past and Present 2
History of the School Nutrition Program 2National School Lunch Program and Other Federal Initiatives 2Kitchen Type 3Equipment Needs 4
Fryers 4Combi-ovens 4Refrigeration 5
Farm to School 5N.C. Farm to School 6Childhood Obesity 6
Methodology 8
Kitchen Capacity Survey 8Interviews and Observations 9
Quantitative Analysis 10
Average Daily Attendance 10Kitchen Type 10Equipment 11
Cooking Equipment 11Storage 13
Staffing 14
Qualitative Analysis 15
Conclusions and Items for Consideration 17
References 18
Appendix: School Kitchen Capacity Survey 20


© 2015 UNC Chapel Hill School of Government. Do not duplicate.
1
Introduction
As the North Carolina Department of Public Instruction (DPI) and the U.S. Department of Agriculture (USDA) call for serving more fresh and local food items in public schools (per the Healthy, Hunger-Free Kids Act of 2010), nutritionists and policy makers are asking whether school kitchens have the equipment and other aspects of capacity to meet these requirements. The results of a 2012 evaluation of a statewide pilot summer foods program suggested that local school kitchen capacity could be limiting the program’s ability to reach its goals (Berner and George 2013). At that time, there was no comprehensive data on the capacity of public school kitchens, but there was increasing interest in using locally sourced produce in school meals. As a result of discussions generated by the 2012 evaluation, researchers at the School of Government at the University of North Carolina at Chapel Hill and the Center for Environmental Farming Systems based at North Carolina State University approached DPI with an offer to design a survey to help identify existing foodservice capacity in N.C. public schools as well as factors limiting the use of fresh, locally sourced produce in school kitchens. DPI, determining that the information would be helpful for a range of planning purposes, agreed. The results of this assessment—the first statewide study of its kind for public school kitchens in North Carolina—are presented in this report along with accompanying items for consideration by policy makers and other stakeholders.
Andrew George is an adjunct lecturer for the UNC School of Government and the UNC Curricu-lum for the Environment and Ecology. He has worked with the School of Government on several initia-tives, including evaluations of the Clean Water Management Trust Fund of North Carolina, the North Carolina Department of Public Instruction, and the North Carolina Department of Health and Human Services. For more than fifteen years he has also worked with local, national, and international NGOs on environmental health, conservation, and climate issues.
Maureen M. Berner is a professor of public administration and government at the UNC School of Government. Her areas of interest include public administration, program evaluation, research methods and survey methodology, applied statistics, budget preparation and enactment, and citizen participation. She teaches evaluation and analysis courses in the School’s Master of Public Administration program and provides similar training and advising to state and local government officials throughout North Carolina. She also works with nonprofits, food banks, local governments, and state agencies on improv-ing food assistance programs.
Direct any questions about the report to Dr. Berner at [email protected] Dunning is a research assistant professor at the Center for Environmental Farming Sys-
tems (CEFS) at North Carolina State University specializing in the social and economic aspects of food systems and food supply chains. She leads CEFS’s Building Local Food Value Chains strategic working group, which seeks to strengthen the economic viability of small and mid-scale food producers through research activities and engagement with business entities across the food value chain. She also manages the North Carolina Growing Together project (NCGT, ncgrowingtogether.org), a five-year (2013–2017) USDA-funded initiative to link small and mid-scale producers of produce, meat, dairy, and seafood with grocery and food service supply chains.

© 2015 UNC Chapel Hill School of Government. Do not duplicate.
2
School Nutrition: Past and Present
This section discusses key programs and issues that influence the use of fresh and locally sourced produce in public schools: the history and current status of school nutrition and how the National School Lunch Program became a catalyst for change; the type and availability of foodservice equipment in public schools; the emergence of farm-to-school programs; and heightened concern related to the increased prevalence of childhood obesity. The history of the school nutrition pro-gram in the United States provides the context for the report’s subsequent focus on the connec-tion between school kitchen equipment and the use of fresh foods and how this connection may influence the ability of schools to procure, prepare, and serve fresh foods.
History of the School Nutrition ProgramThe first school meals were served in the United States during the 1890s through the private char-itable organization Children Aid Societies (Martin and Oakley 2008). The poor health of World War I draftees convinced public officials of the need to improve access to healthy foods, and in the late 1910s the U.S. Congress instituted “school feeding programs” (Smedley 1930). During the Great Depression, schools became a central part of the country’s feeding program.
Early school kitchens received little to no government financing to purchase equipment (Sub-lette 1976). School feeding programs began to receive federal government assistance in the early 1930s through the Works Progress Administration, the National Youth Administration, and donated foods programs (Gunderson 1971). State and local governments then began to up the pace of school construction such that by 1935 there were more than 64,500 school cafeterias in the country (Bryan 1938). In the 1930s and 1940s, “a stove, double boiler, large kettle with top, a large baking pan, and tea kettle” constituted the basic equipment in most school kitchens (Sublette 1976). During these years, schools commonly prepared cold sandwiches both to avoid spoilage and because their kitchens could not accommodate a larger menu (Gunderson 1971). Compounding problems related to refrigeration, storage, and distribution was the fact that in the 1940s few rural schools had electricity (Webb 2012).
National School Lunch Program and Other Federal InitiativesDuring World War II, more than 30 percent of all draftees were rejected on the basis of poor health (Perrott 1946). That and the comparatively poor medical conditions of many new soldiers spurred the government into action, with Congress passing the National School Lunch Act in 1946 (Gunderson 1971). Since its inception and original focus on lunches, the National School Lunch Program (NSLP) has grown to include a breakfast program, an after-school snack program, a summer feeding program, a fresh fruit and vegetable program, a special milk program, and a

© 2015 UNC Chapel Hill School of Government. Do not duplicate.
child and adult care food program (Webb 2012). Today, more than one hundred thousand U.S. schools operate under the NSLP, which is administered through the USDA’s Food and Nutrition Service guidelines (USDA 2012a). Recent data show that schools spent more than $11.1 billion (USDA 2012b) to serve over 5.2 billion lunches in fiscal year 2011 (USDA 2012a).
A central component of the National School Lunch Act of 1946 was funding for the purchase of foodservice equipment (Gunderson 1971). Given that approximately 43 percent of public schools in existence today were built during the 1950s and 1960s (Rydeen 2008), it is not surprising that their facilities and equipment are now outdated and in need of replacement (Webb 2012). Also, although equipment needs vary, depending on the type and quantity of foods required to be served (Nettles, Carr, and Conklin 1996), 70 percent of public schools use conventional kitchen equipment, such as convection ovens, fryers, tilting skillets, and broilers. As discussed below, however, fryers are being replaced with new, healthier cooking options.
In the early 2000s, a number of initiatives were instituted to increase the healthfulness of foods served in schools. The Child Nutrition and WIC [Women, Infants, and Children] Reauthoriza-tion Act of 2004 addressed food inspections and local wellness policy and food safety standards while the Healthy, Hunger-Free Kids Act of 2010 (HHFKA) improved nutrition standards for foods served, including, in 2012, a new meal pattern requiring additional servings of fruits and vegetables, more whole grains, and lower fat milk. An additional component of the HHKFA autho-rized the USDA to set up a competitive matching grant system to provide $5 million annually in mandatory funding for new farm-to-school activities as another means of increasing the quantity and variety of healthy foods in schools.1
Kitchen TypeThe USDA requires all schools to have in place food safety plans based on process Hazard Anal-ysis Critical Control Point (HACCP) principles, and schools failing to meet this mandate may lose federal funds. In North Carolina, the four types of school foodservice operations authorized under the HACCP are commercial kitchens, home-style kitchens, transported/catered meals, and central warehouse kitchen systems. Commercial or on-site kitchens, the most common school kitchen type in North Carolina, must prepare and serve menu items on-site and meet the require-ments of the North Carolina Environmental Health Department and the FDA’s 2013 Food Code and 2011 Food Code Supplement.
Among the few studies about the NSLP, Brown (2008) showed that 45.3 percent of U.S. pub-lic schools use on-site food production kitchens and that 40.5 percent are supplied by a central kitchen system. The remaining kitchens (19.2 percent) are home-style kitchens or receive trans-ported/catered meals prepared off-site by a third party.
1. The Healthy, Hunger-Free Kids Act of 2010, Pub. L. No. 111-296, 124 Stat. 3183 through 3266 (2010); increase in use of fresh, canned, dried, or frozen fruits and vegetables at 3227; farm-to-school activities at 3236–38.
North Carolina Public School Kitchen Capacity Study: Healthy Foods, Farms, and Kids 3

© 2015 UNC Chapel Hill School of Government. Do not duplicate.
Equipment NeedsPublic school nutrition administrators face difficult budgeting and purchasing challenges when selecting foodservice equipment (Birchfield 1988), especially given complications arising from short equipment lifespans (Ninemeier 2000). Convection ovens, for example—one of the most common items in school kitchens—have the shortest lifespan (7–10 years) of any major foodservice item (Webb 2012). According to one study, school kitchen equipment should last between fifteen and forty years (Morton 2010), which means that the equipment in many school kitchens is in need of replacement. While preventive maintenance can extend equipment life (Birchfield 1988; Almanza 2009), fabrication materials, equipment quality, usage, and volume also affect operational lifespan (Webb 2012).
Another concern is that while kitchens need frequent updates, school cafeteria managers and school nutrition directors often are unaware of new foodservice equipment options (Morton 2010). Selecting appropriate and cost-effective equipment is especially important given the high cost of equipping a modern school kitchen: a study by the Kids’ Safe & Healthful Foods Proj-ect (2012) evaluated kitchens in three states and estimated their median cost of purchasing new equipment to meet the updated meal guidelines required by the 2010 HHFKA at $52,500. The high cost of food and kitchen equipment, along with meeting new NSLP meal pattern require-ments, have been recognized as the most significant issues facing school nutrition administrators (School Nutrition Association 2011).
FryersThe new requirements for more fruits, vegetables, and whole grains suggest that schools are likely to need new equipment for the preparation of healthier foods. With these new guidelines, schools have begun to reduce the numbers of fryers, kettles, and mixers. In 2006, the North Carolina State Board of Education issued its Nutrition Standards for Elementary Schools policy (TCS-S-002), which limits the methods of food preparation, specifically excluding frying for all foods served to students in elementary schools. The policy states: “Food preparation methods for all foods will be limited to baking, roasting, broiling, boiling, and steaming.” This de facto ban on frying has inspired many school systems, like Durham County Schools, to remove fryers from middle and high schools as well.
A number of other states also have begun removing fryers from school kitchens and are seeking alternative equipment to better meet the new meal guidelines (Webb 2012). Other types of food-service equipment could be substituted to prepare healthier foods without compromising their quality. These include combination-oven/steamers (combi-ovens) and tabletop steamers. Texas eliminated fryers during the 2009–2010 school year and replaced them with more convection ovens (Boss 2007), while Mississippi removed all fryers from school kitchens and, with the help of a private donor, replaced them with combi-ovens (Duswalt 2013).
Combi-ovensAmong the newly available technologies that are smaller, more mobile, and address current healthy food initiatives is the combi-oven, which can steam as well as bake foods (Almanza 2009). First introduced into the United States in the 1980s, combi-ovens prepare food more quickly without shrinking or reducing its quality. North Carolina’s Eat Smart, Move More initiative, as well as First Lady Michelle Obama’s Let’s Move campaign, have highlighted the merits of the combi-oven (Duswalt 2013). Moreover, today’s Energy Star programmable units run on both gas and electricity and thus provide major energy savings (White 2010).
4 North Carolina Public School Kitchen Capacity Study: Healthy Foods, Farms, and Kids

© 2015 UNC Chapel Hill School of Government. Do not duplicate.
RefrigerationSufficient refrigeration equipment, such as walk-in refrigerators and freezers, also is important for meeting new nutrition and meal pattern standards, yet little is known about the level of refrig-eration available in school kitchens (Webb 2012). According to a study by the National Food Service Management Institute, 89 percent of school nutrition directors strongly agree that more refrigerated storage is needed in order to support serving larger amounts of fresh fruits and veg-etables (Nettles, Carr, and Conklin 1996: 3). Other studies have shown that walk-in refrigeration and freezers improve overall kitchen efficiency (Educational Facilities Laboratories 1968), whereas schools without adequate refrigeration lead school nutrition directors to follow the compensatory practice of maintaining lower inventory (Webb 2012).
In addition to combi-ovens and walk-in refrigeration, other technical advances in foodservice equipment include scanning technology, card readers, communication systems, remote refrig-eration monitoring systems, digital security cameras, and tracking of food trucks (Matsumoto 2001). In tandem with new requirements to offer healthier foods, an aging inventory of food-service equipment, and the availability of new technologies such as the combi-oven, new pro-gramming and funding have arisen to support the distribution of fresh produce from local farms to schools. The following section explains the emergence of farm-to-school programs designed to link schools to farm-fresh foods through a network of farmers, school nutrition directors, and school cafeteria managers.
Farm to SchoolDuring the same period that schools have faced demands that they prepare healthier food options, new laws regulating the procurement of locally sourced fresh produce have provided additional opportunities, as well as challenges, for school nutrition directors. In the late 1990s and early 2000s, several states began “farm-to-school” initiatives to connect local farmers to local schools, with the goal of increasing children’s access to local, fresh produce. These programs can also be an important weapon in the fight against childhood obesity.
Provisions contained in the 2002 Farm Security and Rural Investment Act (Farm Bill) encour-aged greater use of local produce in schools.2 In the early 2000s, the Fresh Fruit and Vegetable Pilot Program (FFVP) established the Farm to School initiative. Then, in 2004, Congress passed the Child Nutrition and WIC Reauthorization Act, which requires the USDA to provide support to “farm-to-cafeteria activities . . . that may include the acquisition of food and appropriate equip-ment and the provision of training and education.”3 In 2008, the National School Lunch Act was amended to allow schools to include geographic proximity as a preference, and the FFVP was expanded throughout the country, with $50 million budgeted for the procurement of fresh fruits and vegetables by schools and public institutions. Finally, the Healthy, Hunger-Free Kids Act of 2010 (discussed above) authorized the USDA to establish and run a new national Farm to School program and increase the use of farm-fresh foods in public schools. By 2012, the Farm to School Network estimated that 2,305 school districts and 9,807 schools were participating in farm-to-school programs (USDA 2014).
2. Pub. L. No. 107–171, 116 Stat. 134 through 540 (2002).3. Pub. L. No. 108-265, 118 Stat. 729 through 790 (2004); quote at 759.
North Carolina Public School Kitchen Capacity Study: Healthy Foods, Farms, and Kids 5

© 2015 UNC Chapel Hill School of Government. Do not duplicate.
N.C. Farm to SchoolThe original North Carolina Farm to School program was formed in 1997 by the North Caro-lina Department of Agriculture & Consumer Services (NCDA&CS) and the U.S. Department of Defense (DOD) Produce Merchandising Office. Through legislation passed by the North Carolina General Assembly, fifty schools were given $1,000 grants to purchase produce from local farmers. After the DOD left the program in 2008, the NCDA&CS’s Food Distribution and Marketing divi-sions began managing the program. In 2012, House Bill 1099 (Support Procurement & Farm to School/Funds), which would provide funding for greater participation in the N.C. Farm to School program, was introduced at the General Assembly but did not advance beyond its assigned com-mittee. Also in 2012, the N.C. Farm to School program received federal grants for Stokes County ($44,284) and Beaufort County ($98,526).
During the 2012–2013 academic year, 1,776 N.C. schools served more than one million stu-dents and ordered almost 1.8 million pounds of fresh local produce. In 2014, the USDA Farm to School Census reported that 75 percent of N.C. school nutrition directors were engaged in farm-to-school activities, spending $34 million to purchase local produce. The most commonly purchased items were berries, apples, sweet potatoes, and leafy greens, which are examined later in this report (USDA 2014).
North Carolina’s Farm to School program is supported through a network of eighty-five local farmers spread across nineteen counties. In order to participate in the program, the farmer must be Good Agricultural Practices certified, possess at least $2 million in liability insurance, follow strict packaging specifications to ensure traceability, participate in the Goodness Grows in North Carolina Campaign, and be a member of the N.C. Farm to School Cooperative, which charges a $100 one‐time joining fee and other fees to fund educational materials.
The USDA’s most recent Farm to School Census found that 88 of North Carolina’s 115 local education agencies4 participated in farm-to-school activities (USDA 2015), and in 2013 the state was reported to be second only to California in the amount of school food spending directed to local sources (Robertson 2013). Despite this success, continued growth in (1) the number of schools accessing local produce and (2) the amount and variety of produce is limited by several factors. According to the census, among the most common challenges for participants in the pro-gram is the lack of walk-in refrigeration space at schools and an inadequate amount of staff time to prepare fresh produce (USDA 2014). Additional problems include the time and administrative burden required to enroll and participate in the program, which is difficult for schools dealing with new meal pattern requirements and tighter budgets (Webb 2012).
Childhood ObesityThe Farm to School program is also promoted as key to addressing the epidemic of childhood obe-sity (National Academy of Sciences 2009). While North Carolina’s Farm to School program has some of the nation’s highest participation rates, the state ranked fifth in the country in childhood obesity in 2007 (Trust for America’s Health 2007; see also Eat Smart, Move More NC 2013–2020); as of 2011, 31 percent of North Carolina’s children aged ten–seventeen were overweight or obese (Action for Children North Carolina/NCIOM 2012). In 2006, nearly 85 percent of high school students in North Carolina ate less than the minimum recommended daily servings of fruits and vegetables, while one in three children ate fast food two or more times per week (Trust for America’s Health 2007). These children are six times more likely to have an impaired quality of
4. North Carolina’s public school districts are known as local education agencies or LEAs.
6 North Carolina Public School Kitchen Capacity Study: Healthy Foods, Farms, and Kids

© 2015 UNC Chapel Hill School of Government. Do not duplicate.
life (Schwimmer, Burwinkle, and Varni 2003), including increased risk of high cholesterol, liver abnormalities, diabetes, and becoming an obese adult. This is evidence that although N.C.’s Farm to School program has the second highest participation rate in the country, without the right equipment, adequate labor hours, and training, N.C. schools will not be able to increase the use of fresh produce, meet meal pattern requirements, and address the childhood obesity rate.
North Carolina has several obesity-related initiatives in addition to the Farm to School pro-gram, including snack and soda taxes, nutritional standards that exceed existing USDA require-ments, and the collection of health information, such as body mass index. Despite these initiatives and the success of the Farm to School program, it is unclear whether N.C. schools have adequate working foodservice equipment to deliver on the healthy food goals established in the HHFKA. The following section discusses the methodology used to assess the equipment in N.C. public school kitchens and explains the process used to evaluate the capacity of these schools to deliver healthier, locally produced fruits and vegetables.
North Carolina Public School Kitchen Capacity Study: Healthy Foods, Farms, and Kids 7

© 2015 UNC Chapel Hill School of Government. Do not duplicate.
8
Methodology
To what extent are North Carolina public school kitchens equipped to prepare and serve fresh produce in their cafeterias? To answer this question, a research project was conducted with the goal of quantifying the type of equipment (including cooking and refrigerated storage) currently in place in North Carolina public schools and exploring the degree to which staffing or other chal-lenges are impacting the ability of schools to take full advantage of the Farm to School program as a means of serving healthier meals. This analysis is based on a mixed-methods research design with concurrent qualitative and quantitative research strategies (Cresswell 2003; Yin 2014). Cross-cutting data from interviews, participant observations, document analysis, and a kitchen capacity survey were used to develop a better understanding of the current state of public school kitchens in North Carolina.5
Kitchen Capacity SurveyThe survey was first drafted in consultation with numerous stakeholders who helped with its design, testing, and implementation.6 After instrument development, the draft survey was piloted to school nutrition directors, kitchen design experts, cafeteria managers, FoodCorps fellows, and members of the Farm to School division of the NCDA&CS. It was also fielded to the more than three hundred and fifty attendees of the 2013 Annual Conference for School Nutrition Adminis-trators conducted by the state Department of Public Instruction (DPI).
The final survey (see the Appendix to this report) was designed to collect individual school kitchen data on (1) types of preparation, cooking, and storage equipment and (2) levels of allocated labor hours, staff education, and training. Participants were also asked about the ability of their kitchens to receive, prepare, and serve three fresh items: apples, sweet potatoes, and leafy greens, including fall and winter crops of nutritionally dense kale and collards. These products represent three of the four most common farm products provided to public schools in North Carolina, likely due to their growing seasons overlapping academic calendars. (The remaining product—strawberries—was excluded from the survey because berries require less equipment and labor to prepare and thus were considered less useful for this analysis.)
5. On September 26, 2013, the UNC-Chapel Hill Office of Human Research Ethics confirmed that it had reviewed this study (#13-2968) and determined it to be exempt from further review according to 45 CFR 46.101(b).
6. These included staff from N.C. State’s Center for Environmental Farming Systems, NCDA&CS, and the UNC Department of Public Health; nutrition specialist consultants from the Department of Public Instruction’s Child Nutrition Services Section; school nutrition directors; kitchen expert Diane Schweitzer; FoodCorps fellows; and cafeteria managers.

© 2015 UNC Chapel Hill School of Government. Do not duplicate.
The final survey was approved by DPI in late 2013, and an announcement with survey link was included in the January and February 2014 issues of DPI’s “School Nutrition Weekly Update,” which is sent out to every school nutrition director in the state. (School nutrition directors or cafeteria managers could respond, but only one response per school kitchen was accepted.) With help from the UNC-Chapel Hill Odum Institute, this survey was administered electronically from February 4 to February 25, 2014, using Qualtrics Research Suite software. After the survey period closed, incomplete responses were removed, the dataset was imported into SPSS software for statistical analysis, and qualitative answers were coded.7
Interviews and ObservationsInterviews were conducted throughout the process, from initial design to discussing results with stakeholders. Interview subjects included DPI staff in Raleigh, school nutrition directors, cafeteria managers, members of the NCDA&CS, kitchen design experts, and staff of the Center for Health Promotion & Disease Prevention at UNC-Chapel Hill. Exploratory semi-structured interviews were used during instrument development and stakeholder identification. Following the survey, interviews of school nutrition directors and cafeteria managers were used to confirm and explain results. Observations were also conducted at the Spring Valley Elementary School in Durham, which allowed researchers to explore survey results, tour kitchens, and prepare and serve locally sourced Farm to School sweet potatoes.
7. For questions about the survey, contact Maureen Berner at [email protected].
North Carolina Public School Kitchen Capacity Study: Healthy Foods, Farms, and Kids 9

© 2015 UNC Chapel Hill School of Government. Do not duplicate.
10
Quantitative Analysis
The results in this section are based on statistical analysis of the survey responses. At the close of the survey, 724 valid responses had been collected from individual schools, representing a 30 per-cent response rate.8 Among these 724 responses, 57 schools reported using centralized kitchens or catering services, leaving 667 valid surveys. Respondents are public schools from 63 of North Carolina’s 115 local education agencies (55 percent) and are geographically distributed across the state (Figure 1).
Overall, the response to questions about school nutrition directors’ willingness and ability to use the three local foods was overwhelmingly positive. The vast majority of those surveyed said they would use the specified fresh produce: leafy greens (87 percent), sweet potatoes (94 percent), and apples (97 percent). Further analysis of the results also revealed several predictors of use, especially the use of fresh leafy greens, and these results can be used to make specific recom-mendations to enhance the use of local farm-fresh produce in school kitchens, as detailed below.
Average Daily AttendanceResponding schools had an average daily attendance (ADA) of 590 students, while 19 schools had more than 1,500 students attending daily.9 Schools with higher ADA were significantly more likely to use unprocessed (fresh) sweet potatoes (Wilcoxon signed-rank test, Z = 2.481, p = 0.013), but there was no significant relationship between ADA and the use of apples or leafy greens. Larger schools were more likely to have combi-ovens (Z = 2.101, p = 0.0356), walk-in refrigerators (Z = 4.685, p = 0.000), and reach-in refrigerators (Z = 2.070, p = 0.0385).
Kitchen TypeThe USDA requires all schools to base their school food safety plans on Hazard Analysis Critical Control Point (HACCP) principles. Under these guidelines, schools may operate one of four types of school foodservice kitchens: (1) commercial kitchens (on-site); (2) home-style kitchens; (3) transported/catered meals; and (4) central warehouse operations (central kitchen systems). Of the 724 total respondents, 92 percent reported operating on-site commercial kitchens (667 schools).
8. Of the 2,400 public schools in North Carolina, 724 valid responses were received. After charter schools, juvenile detention centers, and schools using central kitchens were removed, the survey sample contained 667 public school kitchens. This sample size exceeds the minimum size (526) adequate for the 99 percent confidence level with a four-point margin of error (confidence interval).
9. ADA allows for comparison of school size and was used to approximate the number of students in the schools who could be served. It does not represent the number of meals served each day.

© 2015 UNC Chapel Hill School of Government. Do not duplicate.
YANCY
WATAUGA
ASHEALLEGHANY
SURRY STOKES
WILKES YADKIN FORSYTH
DAVIE
IREDELL
ALEXANDERCALDWELL
AVERY
MADISON
HAYWOODBUNCOMBE
MCDOWELL
BURKE
SWAIN
GRAHAM
CHEROKEE
CLAY
MACON
JACKSON
TRANSYLVANIA
HENDERSONRUTHERFORD
POLK CLEVELAND
MECKLENBURG
GASTON
LINCOLN
CATAWBA
UNION
CABARRUS
ROWAN
DAVIDSON
ROCKINGHAM
GUILFORD
RANDOLPH
STANLY
ANSON
SCOTLAND
RICHMOND
MOORE
CHATHAM
ALAMANCE
CASWELL PERSON
ORANGE
DURHAM
WAKE
LEEHARNETT
ROBESON
COLUMBUS
BLADEN
CUMBERLAND
GRANVILLEVANCE
WARREN
FRANKLIN
JOHNSTON
SAMPSON
BRUNSWICK
NEWHANOVER
WASHINGTON
EDGECOMBE
HOKE
PENDER
DUPLIN
WAYNE
WILSON
NASH
HALIFAX
NORTHAMPTON
HERTFORD
BERTIE
MARTIN
PITTGREENE
LENOIR
JONES
ONSLOW
CARTERET
PAMLICO
CRAVEN
BEAUFORTHYDE
TYRRELL
MONTGOMERY
DARE
CURRITUCK
CAMDENPASQUOTANK
PERQUIMANS
GATES
CHOWAN
MITCHELL
Figure 1. Area Map of Survey Respondents from Local Education Agencies (LEAs) (circles comprise multiple sites)
Although only 7 respondents indicated they use centralized kitchens, qualitative responses to the survey and follow-up interviews showed an additional 35 schools also used centralized kitchens. These 42 schools, plus an additional 15 schools using catering services, represent 8 percent of all respondents (57 schools).
Many schools using centralized kitchens, however, had equipment type totals comparable to those of on-site kitchens. While it is unclear whether they use their own kitchen equipment in addition to centralized kitchen services, 52 of the 57 schools discussed above also indicated a willingness to receive more unprocessed, farm-fresh foods.
EquipmentTo best appraise individual school kitchen equipment inventories, the survey included a list of 38 major equipment items identified by experts in the field, agency personnel, and stakeholders (see Table 1). About half of the schools had at least half of the equipment on the list, though only 4 percent of school kitchens had more than 65 percent of the equipment items included in the survey. Schools with higher equipment totals were more likely, at statistically significant levels, to use local, unprocessed (fresh) sweet potatoes (t = 2.4, p = < .05) and apples (t = 2.7, p = .05). Leafy greens also were used more commonly by schools with higher equipment totals but not at statisti-cally significant levels (t = 1.7, p = .1).
Cooking EquipmentThe most common types of cooking equipment identified by respondents with on-site commercial kitchens were convection ovens (94 percent), steamers (84 percent), and tilting braisers (69 per-cent). Fewer respondents identified combi-ovens (31 percent), range tops (24 percent), stoves (20 percent), and fryers (16 percent). Convection ovens together with steamers were being used by 81 percent of the respondents (537 schools). These results are summarized in Figure 2.
North Carolina Public School Kitchen Capacity Study: Healthy Foods, Farms, and Kids 11

© 2015 UNC Chapel Hill School of Government. Do not duplicate.
Table 1. Inclusion and Ranking of 38 Major Equipment Items among the 667 Responding Schools with On-Site Kitchens
Equipment item
Number of schools with each item (out of 667)
Percentage of the 667 schools with each item
Item ranking
Can opener (manual or electric) 658 99% 1Ice machine 644 97% 2Serving line (hot well/cold well) 637 96% 3Walk-in freezer 635 95% 4Milk cooler 634 95% 5Convection oven 624 94% 6Walk-in refrigeration 620 93% 7Slicer 615 92% 8Sink (3-compartment) 605 91% 9Hot food holding boxes 570 85% 10Steamer 559 84% 11Vegetable prep sink (2-compartment) 525 79% 12Reach-in refrigeration 510 76% 13Tilting braiser 457 69% 14Dishwasher (single tank/flight type) 434 65% 15Mixer 429 64% 16Reach-in cooler 350 52% 17Food processer 337 51% 18Tilting kettle 299 45% 19Ice bin 292 44% 20Steam table 262 39% 21Foil/plastic dispenser 244 37% 22Combi-oven 210 31% 23High-density shelving 207 31% 24Range top 158 24% 25Stoves 132 20% 26Fryer 105 16% 27Polymer shelving 102 15% 28Middle shelving 96 14% 29Salad bar 85 13% 30Cold merchandiser 84 13% 31Commercial microwave oven 75 11% 32Generator 31 5% 33Wrapping machine 20 3% 34Broiler 11 2% 35Juicer 9 1% 36Blast chiller 8 1% 37Grill 3 0% 38
12 North Carolina Public School Kitchen Capacity Study: Healthy Foods, Farms, and Kids

© 2015 UNC Chapel Hill School of Government. Do not duplicate.
Only one type of cooking equipment was significantly related to willingness to use one of the local products: schools with combi-ovens were significantly more willing to use leafy greens compared to schools without combi-ovens (Χ2 = 13.782, p < 0.0001). As noted above, schools with larger ADA were more likely to have combi-ovens, but school size alone did not predict the use of leafy greens.
StorageStoring farm-fresh produce requires several different types of refrigeration, which are among the most important elements of foodservice (Constable and Somerville 2003). Walk-in refrigerators and freezers are essential for helping school nutrition directors “make informed decisions to suc-cessfully manage school nutrition programs and to keep food safe” (Webb 2012: 3). The most common major storage equipment—walk-in freezers and refrigerators—were present in more than 90 percent of the schools.10 Schools with a walk-in refrigerator were significantly more likely to use fresh leafy greens than schools without (Χ2 = 5.281, p = 0.022). As noted in the case of combi-ovens, above, larger schools (measured by ADA) were more likely to have walk-in refrigera-tors, but school size alone did not predict use of fresh leafy greens. Therefore, the presence of a combi-oven and walk-in refrigerator, regardless of school size, appears to predict greater inclusion of leafy greens.
10. Ice machine, 97 percent; walk-in freezer, 95 percent; walk-in refrigerator, 93 percent; reach-in refrigerator, 76 percent; ice bin, 44 percent; high-density shelving, 31 percent; polymer shelving, 15 percent; middle shelving, 14 percent.
Figure 2. Percentage of Schools with Common Types of Kitchen Equipment, 2014 N.C. School Kitchen Survey
Convection oven
Walk-in refrigerator
Steamer
Tilting braiser
Food processor
Tilting kettle
Combi-oven
Fryer
Commercial microwave
North Carolina Public School Kitchen Capacity Study: Healthy Foods, Farms, and Kids 13

© 2015 UNC Chapel Hill School of Government. Do not duplicate.
StaffingMost kitchens are led by a cafeteria manager, who oversees an average of 3.7 full-time staff and 2.2 part-time workers. Each part-time worker was in the kitchen an average of 12.2 hours per week. Almost 99 percent of cafeteria managers had at least a high school diploma, while 33 percent also had experience in a technical or specialized school (11 percent), a two-year college (17 percent), or a four-year college or above (5 percent). Cafeteria managers had, on average, more than twelve years of experience in the profession and also had, on average, more than twelve years of experi-ence ordering food, four years of developing menus, and thirteen years of preparing foods from minimally processed or unprocessed (scratch) ingredients.
Among the kitchen production staff working in public school kitchens in North Carolina, 93 percent had a high school diploma and 91 percent had at least four years of experience in the field. Only 2 percent of respondents had volunteer kitchen support staff helping in the kitchen an average of ten hours per week. These volunteers, from FoodCorps or Farm to School, help deliver and promote more farm-fresh foods to schools.
As discussed below in the qualitative analysis, the primary reason that survey respondents gave for not preparing and serving fresh leafy greens, sweet potatoes, and apples is the lack of staff time. To test the hypothesis that a shortage of labor is the primary explanation for not using fresh products, a variable, labor capacity, which adjusted the availability of total labor hours to the size of the school, was created: total hours of labor divided by average daily attendance. A statistically significant relationship was found between labor capacity and the likelihood that schools served fresh leafy greens (Z = 3.560, p = .000) and sweet potatoes (Z = 2.514, p = .012). There was no significant relationship with the use of apples, perhaps because fresh apples are typically served whole and uncooked.
14 North Carolina Public School Kitchen Capacity Study: Healthy Foods, Farms, and Kids

© 2015 UNC Chapel Hill School of Government. Do not duplicate.
15
Qualitative Analysis
For each of the local produce items—leafy greens, sweet potatoes, and apples—respondents were asked whether they would use such products and if not, why not. The latter reasons were entered as free text responses and coded by the authors. The findings for this qualitative analysis are reported for those respondents representing schools that used their own kitchens (as opposed to those sourcing from centralized kitchens or third parties). Of these respondents, 13 percent said they would not use leafy greens, 6 percent said they would not use fresh sweet potatoes, and 3 percent said the same for fresh apples.
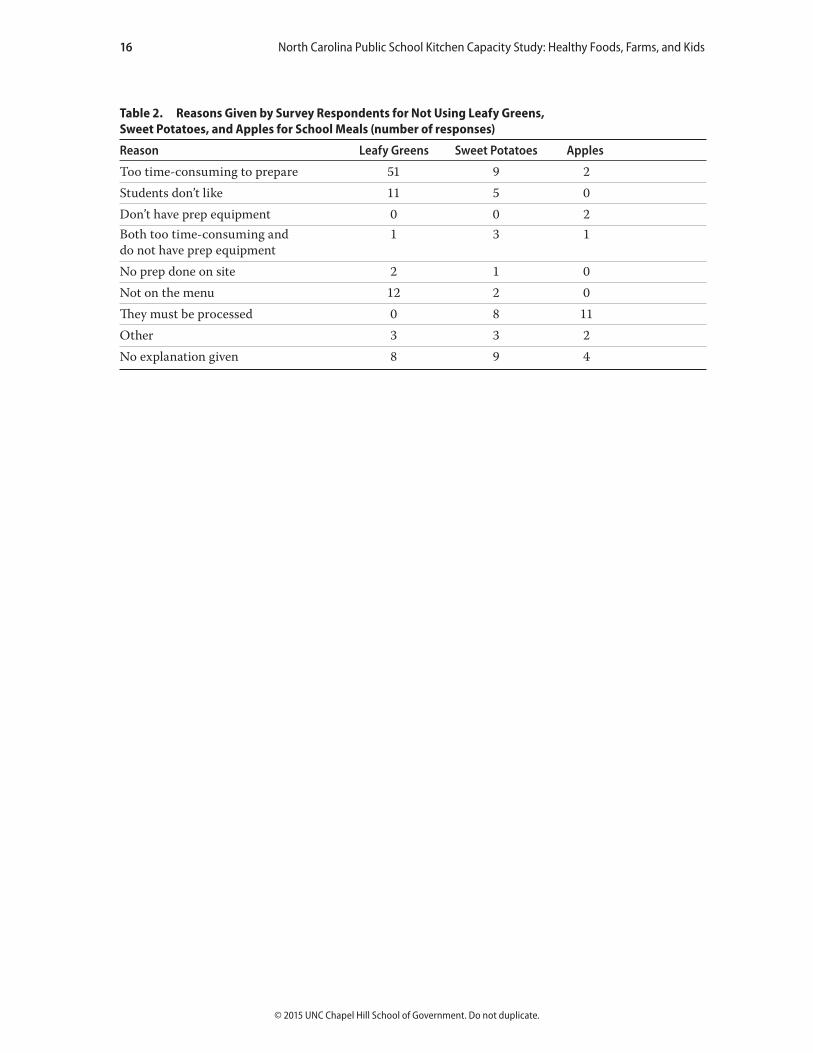
Respondents who would not use the products stated a variety of reasons for not being willing to do so, as shown in Table 2. The most common reason given for not using fresh products was that they are too time-consuming to prepare: this chal-lenge accounts for 41 percent of the reasons given for not being willing to prepare the local items (62 out of a total of 150 reasons offered by respondents). Based on these results, the lack of labor capacity is the chief reason given for why school kitch-ens are not using more fresh products, a finding that accords with the quantitative analysis findings discussed above. As one kitchen manager noted about fresh leafy greens: “It is simply too labor-intensive to prepare. It is not a difficult task, but we cannot spare the labor hours for such an item.”
Another 13 percent of the reasons given for an unwillingness to use the products reflected an understanding that respondents were not allowed to use unprocessed items or items that had not been approved. As one respondent noted, “The food that comes through this facility must come from an authorized vendor.” This response suggests that the respondent might not be aware that farm fresh foods are available from the Farm to School program.
In addition, 9 percent of the reasons given for an unwillingness to use the products mentioned that the fresh apples, greens, and/or sweet potatoes were not included in the respondents’ cafeteria menu plans. This coupled with the response quoted in the paragraph above suggest that there may be no-cost ways of increasing usage of fresh produce within schools through an information campaign to all schools to explain the approved uses of such items and through a concerted effort to place fresh produce on cafeteria menus. Taste testing of new items could also address the 11 percent of reasons respondents gave that indicated the local foods were not served because students did not like them.
© 2015 UNC Chapel Hill School of Government. Do not duplicate.
Table 2. Reasons Given by Survey Respondents for Not Using Leafy Greens, Sweet Potatoes, and Apples for School Meals (number of responses)
Reason Leafy Greens Sweet Potatoes Apples
Too time-consuming to prepare 51 9 2Students don’t like 11 5 0Don’t have prep equipment 0 0 2Both too time-consuming and 1 3 1 do not have prep equipmentNo prep done on site 2 1 0Not on the menu 12 2 0They must be processed 0 8 11Other 3 3 2No explanation given 8 9 4
16 North Carolina Public School Kitchen Capacity Study: Healthy Foods, Farms, and Kids

© 2015 UNC Chapel Hill School of Government. Do not duplicate.
17
Conclusions and Items for Consideration
For almost a century, the U.S. federal government has recognized a public purpose in improv-ing access to healthy foods. What began as a campaign to ensure that draftees would be fit for military service expanded to combat poverty-related malnutrition and focus on in-school feeding of our nation’s youth. Federal initiatives, such as the National School Lunch Program, have long contributed both meals and the equipment required to prepare them. More recent initiatives at both the federal and state level have focused on improving the nutrition of school food offerings. In particular, farm-to-school programs have connected farmers to schools in their regions and helped increase children’s access to fresh, local produce. As noted above, North Carolina began its own Farm to School program in 1997.
The overwhelming majority of school staff said they would use products like leafy greens, sweet potatoes, and apples in their kitchens (and some already do). Still, several barriers prevent broader access to fresh produce in public schools. First, some schools do not have the type of equipment shown to be associated with greater use of leafy greens and sweet potatoes. Specifi-cally, combi-ovens—which are strongly associated with the use of fresh greens—are present in only 31 percent of the schools surveyed. Second, preparation of fresh produce can be more time-consuming than some less healthy alternatives, and existing staff hours are not always sufficient. Finally, a small percentage of staff seems unaware that Farm to School produce is available to them and appropriate for their cafeteria menus.
Public officials may wish to consider the following if they are interested in expanding the use of fresh produce in the public school meal program:
• Understand the human capital capacity of current school kitchens, including (1) availability of personnel and (2) availability and potential alternatives for off-site pre-processing of fresh produce.
• Consider combi-ovens when repairing or replacing aging equipment, especially traditional ovens and steamers.
• Broaden awareness of Farm to School and similar programs among cafeteria managers and other kitchen staff and encourage them to include fresh produce on their cafeteria menus.
• Address the financial costs associated with the above items.

© 2015 UNC Chapel Hill School of Government. Do not duplicate.
18
References
Action for Children North Carolina and North Carolina Institute of Medicine (NCIOM). 2012. North Carolina Child Health Report Card 2012. www.riversdeveloper.com/wp-content/uploads/2012/11/2012_CHRC-112612-copy1.pdf (accessed May 28, 2015).
Almanza, B. 2009. Equipment Purchasing and Facility Design for School Nutrition Programs. Oxford: National Food Service Management Institute, University of Mississippi, www.nfsmi.org/documentlibraryfiles/PDF/20090312115009.pdf.
Berner, M., and A. George. 2013. “Evaluation of the 2012 North Carolina Super Summer Meals Pilot.” Chapel Hill: UNC School of Government, www.sogpubs.unc.edu/electronicversions/pdfs/evalsummermealsrpt2013.pdf.
Birchfield, J. C. 1988. Design and Layout of Foodservice Facilities. New York: Van Nostrand Reinhold.
Boss, D. 2007. “Klein Forest High School: Klein, Texas.” Foodservice Equipment & Supplies 60, no. 7: 43.
Brown, D. M. 2008. “Prevalence of Food Production Systems in School Foodservice.” Journal of the American Dietetic Association 105: 1261–65.
Bryan, M. deG. 1938. The School Cafeteria. New York: Appleton-Century-Crofts, Inc.Constable, G., and B. Somerville. 2003. A Century of Innovation: Twenty Engineering Achieve-
ments That Changed Our Lives. Washington, D.C.: Joseph Henry/National Academies Press.Creswell, J. W. 2003. Research Design: Qualitative, Quantitative, and Mixed Method Approaches,
2nd ed. Thousand Oaks, Calif.: Sage.Duswalt, M. 2013. “Change Is Happening in Mississippi.” Let’s Move blog, www.letsmove.gov/
blog/2013/02/27/change-happening-mississippi (accessed Sept. 19, 2014).Eat Smart, Move More NC. 2013–2020. North Carolina’s Plan to Address Obesity,
www.eatsmartmovemorenc.com/ESMMPlan/ESMMPlan.html.Educational Facilities Laboratories. 1968. Campus in the City, 1968: A Report from Educational
Facilities Laboratories, Including Financial Data for the Fiscal Year 1967. New York: Educa-tional Facilities Laboratories.
Gunderson, G. W. 1971. The National School Lunch Program: Background and Development. Washington, D.C.: U.S. Government Printing Office.
Kids’ Safe & Healthful Foods Project, School Nutrition Foundation. 2012. Serving Safe and Healthy Meals at Schools Takes Equipment and Training, http://dev.schoolnutrition.org/uploadedFiles/School_Nutrition/110_SNFoundation/SNFResearch/KSHF_SNF_Survey_05-19-2011_FINAL.pdf?n=5985.
Martin, M. J., and C. B. Oakley, eds. 2008. Managing Child Nutrition Programs: Leadership for Excellence, 2nd ed. Sudbury, Mass.: Jones & Bartlett.

© 2015 UNC Chapel Hill School of Government. Do not duplicate.
Matsumoto, J. 2001. “Buying into Efficiency.” Restaurants & Institutions 111, no. 9: 103–08.Morton, J. 2010. “Beefing Up Your School Kitchen.” Buildings 104, no. 12: 35–38.National Academy of Sciences, Institute of Medicine. 2009. School Meals: Building Blocks for
Healthy Children. Report Brief, www.iom.edu/~/media/Files/Report%20Files/2009/School-Meals/School%20Meals%202009%20%20Report%20Brief.pdf.
Nettles, M. F., D. H. Carr, and M. T. Conklin. 1996. “Equipping School Kitchens to Prepare Healthful Meals.” Insight No. 6. Oxford: National Food Service Management Institute, Univer-sity of Mississippi.
Ninemeier, J. D. 2000. Management of Food and Beverage Operations, 3rd ed. Lansing, Mich.: Educational Institute of the American Hotel and Lodging Association.
Perrott, G. St. J. 1946. “Selective Service Rejection Statistics and Some of Their Implications.” American Journal of Public Health 36, no. 4: 336–42.
Robertson, G. D. 2013. “N.C. Schools Better Than Most Going with Local Food,” PilotOnline.com, Oct. 23, www.hamptonroads.com/2013/10/nc-schools-better-most-going-local-food (accessed June 1, 2015).
Rydeen, J. E. 2008. “School Renewals.” American School & University 80, no. 11: 44.School Nutrition Association. 2011. School Nutrition Operations Report 2011. National Harbor,
Md.: School Nutrition Association.Schwimmer, J. B., T. M. Burwinkle, and J. W. Varni. 2003. “Health-Related Quality of Life of
Severely Obese Children and Adolescents.” JAMA 289, no. 14: 1813–19.Smedley, E. 1930. The School Lunch: Its Organization and Management in Philadelphia. Media,
Pa.: E. Smedley.Sublette, L. 1976. I Remember School Lunch. Martin, Tenn.: S & S Book Co.Trust for America’s Health. 2007. F as in Fat: How Obesity Policies Are Failing in America. Issue
Report. Washington, D.C.: Trust for America’s Health, www.healthyamericans.org/reports/obesity2007/Obesity2007Report.pdf (accessed Feb. 19, 2008).
U.S. Department of Agriculture, Food and Nutrition Service. 2012a. National School Lunch Pro-gram fact sheet, www.fns.usda.gov/cnd/lunch/AboutLunch/NSLPFactSheet.pdf.
U.S. Department of Agriculture, Food and Nutrition Service. 2012b. National School Lunch Pro-gram, participation and lunches served, www.fns.usda.gov/pd/slsummar.htm.
U.S. Department of Agriculture, Food and Nutrition Service. 2014. The Farm to School Census, www.fns.usda.gov/farmtoschool/census# (accessed Sept. 19, 2014).
U.S. Department of Agriculture, Food and Nutrition Service. 2015. The Farm to School Census, www.fns.usda.gov/farmtoschool/census#/state/nc (accessed May 28, 2015).
Webb, V. S. 2012. “Analysis of Refrigeration Equipment in School Nutrition Programs in the USDA/FNS Southwest Region.” Ph.D. diss., Department of Hospitality Management and Dietetics, College of Human Ecology, Kansas State University.
White, L. 2010. “K-12 School Foodservice Revised.” Foodservice Equipment & Supplies 63 no. 1: 28.Yin, R. K. 2014. Case Study Research: Design and Methods, 5th ed. Los Angeles: Sage.
North Carolina Public School Kitchen Capacity Study: Healthy Foods, Farms, and Kids 19

© 2015 UNC Chapel Hill School of Government. Do not duplicate.
20
Appendix: School Kitchen Capacity Survey
Part one: A Profile of Your School Thank you for helping us with the survey. In an effort to understand the capacity of school kitchens in North Carolina, we are sending this survey to Child Nutrition Directors and cafeteria managers responsible for individual kitchens. Child Nutrition Directors are encouraged to fill out the survey unless they need to pass the link to cafeteria managers more familiar with an individual kitchen. If you are the person who can best describe the capacity or inventory of an individual school kitchen, please complete this survey. We need your help learning about kitchen infrastructure, equipment, staffing, and training. The survey should take approximately 10 minutes. The results will be delivered as a report to DPI and will also be made available to you. Your participation is voluntary and you are not required to participate. Thank you so much for helping with this important study and for all you do for North Carolina children. Your name
Your title
School name
Your Local Education Agency (LEA)
Is your school enrolled in the National School Lunch Program?
Yes
No
Average Daily Attendance for the school?
Kitchen type
In-School (On-site)
Centralized Kitchen
No-Facility (e.g. Catered)
Other
Is your school kitchen open during the summer?
Yes
No
Hours your kitchen is open for food preparation and service?
Part Two: Infrastructure Please check the equipment currently in your school’s kitchen.
Blast Chiller Grill Serving Line (Hot-Well/Cold Well)
Broiler High Density Shelving Sink (3-Compartment)
Can Opener (Manual or Electric)
Hot Food Holding Boxes Slicer
Cold Merchandiser Ice Bin Steamer
Combi Oven Ice Machine Steam-table
Commercial Microwave Oven
Juicer Stoves
Convection Oven Middle Shelving Tilting Braiser
Milk Cooler Mixer Tilting Kettle
Dishwasher (Single Tank/Flight Type)
Polymer Shelving Vegetable Prep Sink (2-Compartment)
Foil/Plastic Dispenser Range Top Walk-In Freezer
Food Processer (Robot Coupe)
Reach-In Refrigeration Walk-In Refrigeration
Fryer Reach-in-Cooler Wrapping Machine
Generator Salad Bar Other major equipment not included on this list?
Part 3: Staff
How many full-time employees work in your school's kitchen?
How many part-time employees work in your school's kitchen?

© 2015 UNC Chapel Hill School of Government. Do not duplicate.
Part Two: Infrastructure Please check the equipment currently in your school’s kitchen.
Blast Chiller Grill Serving Line (Hot-Well/Cold Well)
Broiler High Density Shelving Sink (3-Compartment)
Can Opener (Manual or Electric)
Hot Food Holding Boxes Slicer
Cold Merchandiser Ice Bin Steamer
Combi Oven Ice Machine Steam-table
Commercial Microwave Oven
Juicer Stoves
Convection Oven Middle Shelving Tilting Braiser
Milk Cooler Mixer Tilting Kettle
Dishwasher (Single Tank/Flight Type)
Polymer Shelving Vegetable Prep Sink (2-Compartment)
Foil/Plastic Dispenser Range Top Walk-In Freezer
Food Processer (Robot Coupe)
Reach-In Refrigeration Walk-In Refrigeration
Fryer Reach-in-Cooler Wrapping Machine
Generator Salad Bar Other major equipment not included on this list?
Part 3: Staff
How many full-time employees work in your school's kitchen?
How many part-time employees work in your school's kitchen?
What is the average number of hours a part-time person works per week?
How many other kitchen support members work in your school's kitchen (NOT employed by the school, such as FoodCorps or other Farm to School specialists)?
What is the average number of kitchen support member hours per day?
PART 4: Skills What is the cafeteria manager's level of education?
Below High School
High School graduate
Technical or Specialized School
2-year College
4-year College or above
What is the average level of education for kitchen production staff?
Below High-School
High School graduate
Technical or Specialized School
2-year College
4-Year College or above
How many years of experience does the cafeteria manager have working in school kitchens?
0
1-3
4-6
7-9
10-12
More than 12
How many years of experience do other kitchen staff members have, on average, working in school kitchens?
0
1-3
4-6
7-9
Part Two: Infrastructure Please check the equipment currently in your school’s kitchen.
Blast Chiller Grill Serving Line (Hot-Well/Cold Well)
Broiler High Density Shelving Sink (3-Compartment)
Can Opener (Manual or Electric)
Hot Food Holding Boxes Slicer
Cold Merchandiser Ice Bin Steamer
Combi Oven Ice Machine Steam-table
Commercial Microwave Oven
Juicer Stoves
Convection Oven Middle Shelving Tilting Braiser
Milk Cooler Mixer Tilting Kettle
Dishwasher (Single Tank/Flight Type)
Polymer Shelving Vegetable Prep Sink (2-Compartment)
Foil/Plastic Dispenser Range Top Walk-In Freezer
Food Processer (Robot Coupe)
Reach-In Refrigeration Walk-In Refrigeration
Fryer Reach-in-Cooler Wrapping Machine
Generator Salad Bar Other major equipment not included on this list?
Part 3: Staff
How many full-time employees work in your school's kitchen?
How many part-time employees work in your school's kitchen?
North Carolina Public School Kitchen Capacity Study: Healthy Foods, Farms, and Kids 21

© 2015 UNC Chapel Hill School of Government. Do not duplicate.
What is the average number of hours a part-time person works per week?
How many other kitchen support members work in your school's kitchen (NOT employed by the school, such as FoodCorps or other Farm to School specialists)?
What is the average number of kitchen support member hours per day?
PART 4: Skills What is the cafeteria manager's level of education?
Below High School
High School graduate
Technical or Specialized School
2-year College
4-year College or above
What is the average level of education for kitchen production staff?
Below High-School
High School graduate
Technical or Specialized School
2-year College
4-Year College or above
How many years of experience does the cafeteria manager have working in school kitchens?
0
1-3
4-6
7-9
10-12
More than 12
How many years of experience do other kitchen staff members have, on average, working in school kitchens?
0
1-3
4-6
7-9
10-12
More than 12
How many years of experience does the cafeteria manager have with ordering food?
How many other employees have experience ordering food?
How many years of experience does the cafeteria manager have with developing menus?
How many other employees have experience developing menus?
How many years of experience does the cafeteria manager have preparing foods from minimally processed or unprocessed (scratch) ingredients?
How many other employees can prepare foods from minimally processed or unprocessed ingredients?
PART 5: Capacity If your kitchen received an order of leafy greens (e.g. Collards, Kale, etc.), would you use them?
Yes
No Please briefly describe how you would store, process, cook, and serve a large order of leafy greens?
Please explain why you would not use leafy greens?
If your kitchen received an order of unprocessed, fresh sweet-potatoes, would you use them?
Yes
No Please briefly describe how you would store, process, cook, and serve a large order of unprocessed, fresh sweet-potatoes?
22 North Carolina Public School Kitchen Capacity Study: Healthy Foods, Farms, and Kids

© 2015 UNC Chapel Hill School of Government. Do not duplicate.
10-12
More than 12
How many years of experience does the cafeteria manager have with ordering food?
How many other employees have experience ordering food?
How many years of experience does the cafeteria manager have with developing menus?
How many other employees have experience developing menus?
How many years of experience does the cafeteria manager have preparing foods from minimally processed or unprocessed (scratch) ingredients?
How many other employees can prepare foods from minimally processed or unprocessed ingredients?
PART 5: Capacity If your kitchen received an order of leafy greens (e.g. Collards, Kale, etc.), would you use them?
Yes
No Please briefly describe how you would store, process, cook, and serve a large order of leafy greens?
Please explain why you would not use leafy greens?
If your kitchen received an order of unprocessed, fresh sweet-potatoes, would you use them?
Yes
No Please briefly describe how you would store, process, cook, and serve a large order of unprocessed, fresh sweet-potatoes?
Please explain why you would not use unprocessed, fresh sweet-potatoes?
If your kitchen received an order of unprocessed, fresh apples, would you use them?
Yes
No Please briefly describe how you would store, process, cook, and serve a large order of unprocessed, fresh apples?
Please explain why you would not use unprocessed, fresh apples?
North Carolina Public School Kitchen Capacity Study: Healthy Foods, Farms, and Kids 23
