north carolina high school
TRANSCRIPT
NORTH CAROLINA HIGH SCHOOL RESOURCE ALLOCATION STUDY
FINAL REPORT February 2008
FINAL REPORT OF THE
HIGH SCHOOL RESOURCE ALLOCATION STUDY
February 2008
Gary T. Henry University of North Carolina at Chapel Hill
Charles L. Thompson East Carolina University
With
Kathleen Brown University of North Carolina at Chapel Hill
Elizabeth Cunningham Independent Consultant
Kirsten Kainz University of North Carolina at Chapel Hill
Bianca Montrosse University of North
Carolina at Chapel Hill
Adrienne Sgammato University of North Carolina at Chapel Hill
Yi Pan University of North
Carolina at Chapel Hill Financial support for the High School Resource Allocation Study was provided by the North Carolina Department of Public Instruction. The authors assume all responsibility for interpretations and any errors. Additional copies of the report can be requested by contacting Dr. Gary T. Henry, Department of Public Policy, CB#3435, University of North Carolina – Chapel Hill.
ACKNOWLEDGEMENTS
We extend our thanks to all of the principals and teachers in the high schools that agreed to participate in this study. Without the time and information that they so generously provided, we could not have developed the insights which we believe this report offers. We also wish to thank our graduate assistant colleagues at UNC Chapel Hill who conducted a great deal of the field work for this study. Renee Carmon, Aaron Cooley, Adrienne Smith, Cary Gillenwater, Alvera LeSane, Cicily McCrimmon, Chris Scott, and Trip Stallings conducted and wrote up interviews of principals and teachers at participating schools. Dana Rickman, Kevin Fortner, Ignacio Navarro, and Kelley Dean from Georgia State University made major contributions in assembling, managing and compiling the data for this study.
In addition, we thank JB Buxton, Alexis Schauss, and Philip Price of the NC Department of Public Instruction, Ann MacArthur of Governor Easley’s Education Office, Kerry Crutchfield, Winston Salem-Forsyth County Schools, and Ross Rubenstein of Syracuse University for their support throughout this project.
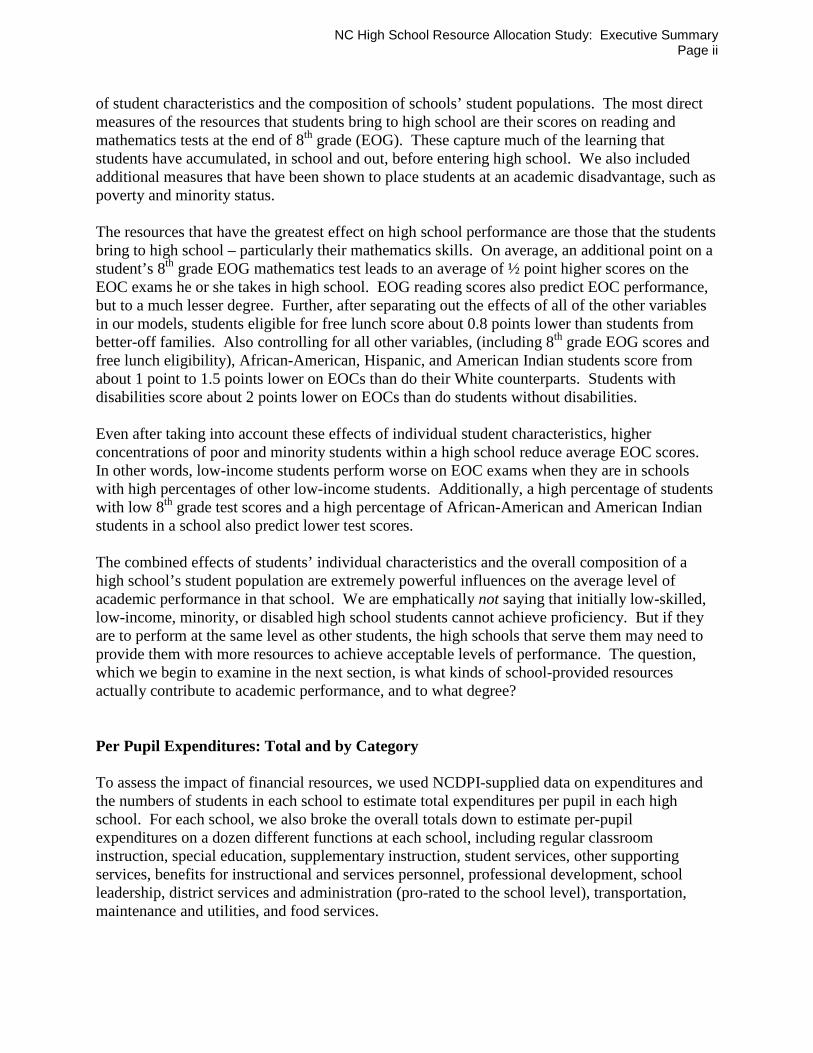
Table of Contents
Executive Summary Background........................................................................................................................................ i Student Resources: Individual Student Characteristics and School Composition...................................... i Per Pupil Expenditures: Total and by Category..................................................................................... ii Teacher Quality.................................................................................................................................. iv Leadership......................................................................................................................................... v Implications....................................................................................................................................... vi Conclusion......................................................................................................................................... viii Chapter 1: Introduction..................................................................................................................... 1 Chronically Low Performing High Schools.................................................................... 1 Chapter 2: A High School’s Most Important Resource: The Skills that Students Bring with Them…….. 6 Chapter 3: High School Expenditure Patterns..................................................................................... 15 Chapter 4: Teacher Quality............................................................................................................... 23 Conclusion.......................................................................................................... 27 Chapter 5: Key Leadership and Organizational Practices..................................................................... 29 Methods............................................................................................................... 37 Findings............................................................................................................... 37 The Elements of Will...................................................................................................... 40 Organizational Commitment.................................................................................. 40 Authoritative Accountability.................................................................................. 42 Resilience............................................................................................................. 43 The Elements of Capacity................................................................................................ 44 Teacher Quality.................................................................................................... 44 Disciplined and Caring Environment for Learning................................................... 46 Curricular, Instructional, and Assessment Practices................................................. 47 Conclusion........................................................................................................... 48 Chapter 6: Conclusions.................................................................................................................... 51 Tables & Figures: Table 1.1: NC High Schools on Judge Manning's List in 2004-05 and 2005-06....................................... 3 Table 2.1: Demographic Composition of NC High School Student End-of-Course Testing Population
in 2004-05 and 2005-06................................................................................................. 7 Table 2.2: NC High School Performance Composite and Percent with Proficient EOC Scores for 2004-05 and 2005-06............................................................................................... 10 Table 2.3: Effects of Student Background Variables on NC High School Student Achievement............... 12 Table 2.4: Effects of Student Background and School Composition Variables on NC High School Student Achievement.................................................................................................... 13 Table 3.1: Expenditure Categories....................................................................................................... 15 Table 3.2: NC High School Expenditure Distribution in 2004-05 and 2005-06........................................ 18 Table 3.3: Effects of Student Background, School Composition, and Expenditure Variables on NC High School Student Achievement................................................................................. 21 Table 4.1: NC High Schools Teacher Quality in 2004-05 and 2005-06................................................... 24 Table 4.2: Effects of Student Background, School Composition, Expenditure, and Teacher Quality Variables and Differences across EOC Tests on NC High School Student Achievement...... 26 Table 5.1: Demographic Composition of NC High School Student End-of-Course Testing Population in 2004-05 and 2005-06................................................................................................. 31 Table 5.2: Total and Selected NC High School Expenditures Per Pupil in 2004-05 and 2005-06............... 33 Table 5.3: Teacher Quality in Selected NC High Schools in 2004-05 and 2005-06................................... 35 Figure 5.1: How Elements of Will and Capacity Shape Learning Outcomes in BTO & Improved Schools... 39

FINAL REPORT OF THE HIGH SCHOOL RESOURCE ALLOCATION STUDY
Executive Summary
Background In September of 2006, Governor Mike Easley commissioned this study to examine two specific questions:
1. Can low-performing North Carolina high schools substantially improve their students’ academic performance by using current levels of funding more efficiently?
2. Are high schools all across the state getting the most out of the resources that are available to them?
To address these questions, the research team assembled and analyzed data on the performance of high school students on End-of-Course (EOC) exams and visited high schools across the state. We examined the impact of four types of resources that the schools utilize in their efforts to produce student learning:
1. Total per pupil expenditures; 2. Per pupil expenditures for regular instruction, supplemental instruction, special
instruction, student services, and eight other specific functions; 3. Teacher quality; and 4. Principal leadership.
High school students themselves also bring important resources to the learning process, including the knowledge and skills acquired in and out of school earlier in their lives. So we also incorporated measures of these student resources into our analyses. The data we used to estimate the effects of expenditures, teacher quality, and students’ resources were provided by the North Carolina Department of Public Instruction (NCDPI). To estimate the influence of these types of resources on performance, we used a statistical technique that allowed us to separate out the unique effects of each of them. No data existed that would permit us to estimate the influence of principal leadership. So we conducted interviews with principals and teachers at strategically selected high schools in North Carolina. These interviews were designed to determine whether the leadership provided by principals in chronically low- performing high schools was different from the leadership provided by principals in high schools which had similar student populations but which had performed substantially better. Student Resources: Individual Student Characteristics and School Composition In order to separate out the effects of student resources from other influences on student achievement and to get a clearer view of the effects of school resources, we estimated the effects
NC High School Resource Allocation Study: Executive Summary Page ii
of student characteristics and the composition of schools’ student populations. The most direct measures of the resources that students bring to high school are their scores on reading and mathematics tests at the end of 8th grade (EOG). These capture much of the learning that students have accumulated, in school and out, before entering high school. We also included additional measures that have been shown to place students at an academic disadvantage, such as poverty and minority status. The resources that have the greatest effect on high school performance are those that the students bring to high school – particularly their mathematics skills. On average, an additional point on a student’s 8th grade EOG mathematics test leads to an average of ½ point higher scores on the EOC exams he or she takes in high school. EOG reading scores also predict EOC performance, but to a much lesser degree. Further, after separating out the effects of all of the other variables in our models, students eligible for free lunch score about 0.8 points lower than students from better-off families. Also controlling for all other variables, (including 8th grade EOG scores and free lunch eligibility), African-American, Hispanic, and American Indian students score from about 1 point to 1.5 points lower on EOCs than do their White counterparts. Students with disabilities score about 2 points lower on EOCs than do students without disabilities. Even after taking into account these effects of individual student characteristics, higher concentrations of poor and minority students within a high school reduce average EOC scores. In other words, low-income students perform worse on EOC exams when they are in schools with high percentages of other low-income students. Additionally, a high percentage of students with low 8th grade test scores and a high percentage of African-American and American Indian students in a school also predict lower test scores. The combined effects of students’ individual characteristics and the overall composition of a high school’s student population are extremely powerful influences on the average level of academic performance in that school. We are emphatically not saying that initially low-skilled, low-income, minority, or disabled high school students cannot achieve proficiency. But if they are to perform at the same level as other students, the high schools that serve them may need to provide them with more resources to achieve acceptable levels of performance. The question, which we begin to examine in the next section, is what kinds of school-provided resources actually contribute to academic performance, and to what degree? Per Pupil Expenditures: Total and by Category To assess the impact of financial resources, we used NCDPI-supplied data on expenditures and the numbers of students in each school to estimate total expenditures per pupil in each high school. For each school, we also broke the overall totals down to estimate per-pupil expenditures on a dozen different functions at each school, including regular classroom instruction, special education, supplementary instruction, student services, other supporting services, benefits for instructional and services personnel, professional development, school leadership, district services and administration (pro-rated to the school level), transportation, maintenance and utilities, and food services.
NC High School Resource Allocation Study: Executive Summary Page iii
In 2005-06, on average the 337 regular high schools in North Carolina spent $7,067 per pupil, an increase of slightly over $200 per pupil from the previous year. The quarter of these high schools that serve the largest percentage of low-income students spent $7,930, or approximately $1,500 more than the average for the quarter of the high schools serving the lowest percentage of low-income students. Moreover, in the schools serving the highest concentrations of low-income students, the 2005-06 expenditures increased by approximately $450 per pupil over the 2004-05 levels. After separating out the effects of individual student characteristics, the composition of the student population, and the quality of teachers in each school, the effect of total per pupil expenditures on student performance is very small. In other words, even if all schools had students and teachers who were very similar, differences in total per pupil expenditures would not make much difference in student outcomes. For example, a $500 increase in total per pupil expenditures in a school would probably lead to only 6/100ths of a point increase in average EOC scores in the school. By contrast, the amount that high schools spend on regular classroom instruction does have a sizable impact on student learning outcomes. All other things being equal, an increase of $500 per pupil spent on regular classroom instruction in a school is associated with an increase of nearly half a point (0.5) on students’ average scores on End of Course examinations in the school. Importantly, the differences in spending on regular classroom instruction between high schools serving high-poverty populations and those with the fewest low-income students are only about $300 per pupil, much less than the $1,500 per pupil difference in total expenditures per pupil. Expenditures for regular instruction include teachers’ salaries, supplementary pay, benefits, and bonuses; salaries for teachers’ assistants, tutors, and substitutes; instructional supplies and textbooks; library or media services; and a few other miscellaneous costs. More detailed analysis indicates that higher teacher compensation has the largest effect on student performance, but expenditures for supplies and media services do have a positive effect. The higher teacher salary expenditures may allow the schools to hire and retain teachers that have important intangible (unmeasured) strengths, or the additional salary may motivate those who receive it to perform at higher levels than similarly qualified teachers who do not receive the extra pay. The analysis also indicates that materials and supplies do make a difference when measures of quality such as experience and education are taken into account. This does not mean that increases in spending on regular classroom instruction would definitely improve students’ scores. Nor does it mean that increasing spending on regular instruction is the only way or the most efficient way to improve student outcomes. Nor does it tell us whether the increase in spending on regular instruction would have to be achieved by increasing total expenditures or by reallocating resources from other categories. But it does provide evidence that an increase in spending on regular instruction in chronically low-performing high schools would probably improve EOC scores in these schools. We also have a rough estimate of how much improvement could be expected. After separating out the effects of other variables, every additional $500 per pupil spent on regular instruction is associated with an increase of ½ point improvement in EOC scores. To get a sense of how meaningful the potential EOC score
NC High School Resource Allocation Study: Executive Summary Page iv
improvement is, consider that the difference between average EOC scores in the state’s highest-performing and lowest-performing high schools is about 5 points. By spending $1,000 per pupil more on regular instruction in the low-performing schools, the schools would probably reduce that gap by about 1 point, or one fifth of the difference between the average for high-performing versus low-performing NC high schools. Higher expenditures on certain other functions – special education, district services or administrative functions, and transportation – are also associated with higher student outcomes. But the improvement in student outcomes associated with spending more on these functions is smaller, and available data do not allow us to adequately explain precisely which district services or administrative functions would increase student performance or how transportation expenditures could improve outcomes. Perhaps surprisingly, higher levels of expenditures on supplementary instruction (outside the normal school day and week) and student services (guidance, psychological, health, speech, and related services) are actually associated with lower student test scores.It seems illogical to conclude that supplementary instruction and student services somehow cause lower test scores. Instead, it seems likely that schools with especially hard-to-educate student populations have decided to spend more on supplementary instruction and student services. The payoff in student test performance associated with these expenditures is not evident, but it is possible that these expenditures may contribute to a safe and orderly environment and that they may increase graduation rates, something we are beginning to investigate. Teacher Quality To gauge the effects of the school-provided resources that are closest to the learning process, we examined the effects of teacher quality on EOC scores. To measure the quality of teachers in NC high schools, we used NCDPI-supplied data on 11 different measures of teachers’ academic ability, preparation, credentials, and experience that prior research has shown to be related to students’ academic performance. To estimate the impact of teacher quality, we used the average figures for all teachers in a given school. For some variables the “average” was actually a percentage – for example, the percentage of teachers in their first year of teaching. It is extremely important to understand that our findings on the impact of teacher quality variables concern the effects of the overall composition of the faculty, not the effects of individual teachers’ characteristics. Controlling for individual student characteristics, the overall composition of the student population, and financial expenditures, certain teacher characteristics exert an adverse effect on student learning outcomes. For example, higher percentages of teachers who entered the field through the lateral entry program and teachers with temporary, provisional, or emergency licenses are associated with lower EOC scores. By contrast, higher percentages of teachers who graduated from the most highly competitive colleges (an indirect measure of teachers’ general academic ability) are associated with higher student performance. Our analysis also produced some significant surprises. For example, once the analysis separates out the negative effects of higher percentages of teachers with temporary, provisional, or lateral

NC High School Resource Allocation Study: Executive Summary Page v
entry licenses – all of whom are likely to be inexperienced – higher percentages of teachers with fewer than 3 years of experience are actually an asset rather than a liability. That is, higher percentages of teachers in their first three years of teaching are correlated with higher EOC scores. This may suggest that traditional teacher preparation programs are doing a better job of preparing new high school teachers than is commonly recognized. On the other hand, higher percentages of teachers with more than 15 years of experience were associated with lower EOC scores. This does not mean that teachers with more than 15 years of experience are likely to be less effective in their classrooms, but that high concentrations of highly experienced teachers may lower average EOC scores. Findings from our school interviews suggest one possible explanation: highly experienced teachers tend to resist accountability-based pressures for improved EOC scores, while less experienced teachers tend to regard accountability pressures as a fact of life and respond to them more positively. Leadership To isolate the effects of school leadership from the effects of student characteristics and school composition, we selected three sets of schools with similar student populations: (a) five schools that were outperforming expectations with challenging student populations (“Beating the Odds” schools), (b) eight schools on Judge Manning’s list of chronically low-performing schools (designated as Low-Performing or Priority schools by the NCDPI), and (c) two schools on Manning’s original list that subsequently improved sufficiently to shed the low-performing label (“Improved schools”). Because the student populations of the three sets of schools were roughly similar, much of the performance difference across the three sets is probably attributable to differences in their leadership and associated organizational conditions. We chose a fourth set of schools strictly on the basis of the superior performance of their students on the eight End-of-Course tests, without considering the characteristics of their student population. This fourth group included three of the highest-performing high schools in the state. Our interviews revealed that the Beating the Odds (BTO) and Improved high schools shared a distinctive profile of leadership and associated organizational conditions that contrasted sharply not only with the Low-Performing and Priority schools (LP-Priority) but also with two of the High-Performing (HP) schools. The BTO-Improved profile combined well-defined elements of both the will and the capacity to succeed with challenging student populations. The will-related elements included organizational commitment, authoritative accountability leading to internalized and collective responsibility, and resilience. Capacity entailed provision of adequate opportunities and incentives for all students to learn, assured by carefully chosen teachers using certain curricular, instructional, and assessment practices within an orderly and disciplined environment. By cultivating the elements of will and capacity outlined above, all five Beating the Odds schools were able to produce High Growth in 2004-2005. Four of the five produced High Growth again in 2005-2006, and the other produced Expected Growth. In both years, all five earned designations as Schools of Progress. But despite extraordinary leadership, will, and capacity, in neither year could any of them produce a Performance Composite that would entitle it to designation as a School of Distinction or Excellence.
NC High School Resource Allocation Study: Executive Summary Page vi
In contrast, with somewhat less challenging demographics, one high school with a similar profile of leadership, will, and capacity was able to earn Honor School of Excellence status in 2004-2005 and School of Distinction status in 2005-2006. In 2004-2005, after several years of improvement, in this school the gap between African-American and White students on the Algebra I EOC exam was down to about 7 percentage points. One cannot say that reducing the concentration of students with low levels of prior performance would have enabled the BTO schools to match this school’s performance. But the contrast does suggest that concentrating high percentages of students with low entering skills, students from low-income families, and students from traditionally disadvantaged ethnic groups in certain high schools makes it difficult to break through an invisible ceiling on performance. Finally, we note that in 2004-2005, the LP-Priority schools in our sample – schools that are often derided as “failing schools” – all produced either High Growth (3 schools) or Expected Growth (5 schools). They all met or exceeded the NCDPI’s expectations for the average amount of learning their students should achieve in an academic year. In 2005-2006, apparently as a result of changes in the ABCs system, three LP-Priority schools fell to Growth Not Achieved, but three made Expected Growth and two made High Growth. Thus, over the two years examined, the LP-Priority schools met or exceeded the state’s expectations for student learning 4/5ths of the time. Performance Composites below 60% are certainly not consistent with the obligation to ensure that all of the state’s children get an equal opportunity to receive a sound basic education. But neither are these high schools alone failing meet the state’s constitutional obligation. The problems in our education system begin earlier. Implications Our findings suggest that the state and local school districts have the best chance for improving academic performance in North Carolina’s high schools by undertaking the following actions, either individually or in some combination:
• reducing concentrations of students with low entering skills and from low-income families,
• increasing spending on regular instruction, • improving teacher quality, and/or • improving principal leadership.
Student Characteristics and School Composition. Public school districts and schools cannot choose their students. Districts do, however, assign students to schools. Some small, rural districts may have little flexibility in student assignment, but many districts could significantly reduce concentrations of low-skilled and low-income students. Financial Expenditures. Our analysis indicates that North Carolina has already begun to target extra funds to high schools that serve higher concentrations of students living in poverty but that these funds may not be spent in the most effective ways. Increasing expenditures for regular instruction -- especially increasing compensation in order to recruit and retain more effective teachers --appears likely to produce performance improvements. An increase of expenditures for regular instruction of $1,000 per student could improve average EOC scores in a high school by

NC High School Resource Allocation Study: Executive Summary Page vii
about 1 point – one fifth of the difference between average scores in the state’s lowest and highest-performing high schools. Approaches to increasing expenditures for regular instruction in low-performing high schools include increasing the extra funds provided to high schools with large concentrations of disadvantaged students, targeting a larger share of existing funds to such schools, and directing or encouraging these schools to reallocate funds from other expenditure categories. On average, Low Performing and Priority high schools are spending about $105 per student on supplementary instruction and $456 per student on student services. Our analysis indicates that these expenditures are not currently contributing to higher levels of academic performance. Student services may be contributing to other important goals, such as improving students’ physical and psychological well-being or increasing graduation rates. But schools might either reallocate some supplementary instruction and student services funds to regular or special instruction, or redesign the way they are providing supplementary instruction and student services in order to improve their efficiency. It might also be possible to reallocate some funds from or to improve the effectiveness of other functions where higher spending levels are not currently associated with higher academic outcomes. Currently available data do not enable us to distinguish between unavoidable fixed costs and potentially re-allocable spending in many of these areas. Teacher Quality. Our analyses indicate that higher percentages of teachers with temporary, provisional, and lateral entry licenses are associated with lower average EOC scores in a school. Yet simply forbidding schools from hiring anyone with such a license would probably leave large numbers of classrooms un-staffed, or staffed by a parade of substitutes with still lower qualifications. A program of differential pay for higher quality teachers to teach in schools with high percentages of disadvantaged students might reduce the need for teachers with temporary, provisional, and lateral entry licenses. This might be funded via some combination of the approaches mentioned above. A careful analysis of the effects of the incentive programs that some districts have already put into place would be required to determine how such programs should be designed and how large the incentives would need to be. One way to increase expenditures by $1,000 per student for regular classroom instruction in Low-Performing and Priority schools and to improve teacher quality would be to pay teachers with specific qualifications associated with higher student gains substantially more to teach in such schools. Principal Leadership. Our interviews in high schools that enable challenging student populations to outperform expectations and high schools that have improved the performance of such populations confirm the conventional wisdom that principals’ leadership can make a meaningful difference in student learning. It also adds to conventional wisdom by describing how principals make a difference – what specific behaviors they use to foster organizational conditions leading to better performance. Effective principals increase teachers’ commitment to the school and its mission, hold teachers individually and collectively responsible for student outcomes, recruit and retain high quality teachers, assign strong teachers to teach EOC-tested courses to lower-skilled students, foster a disciplined and caring environment for learning, and put in place an extensive set of curricular, instructional, and assessment practices designed to improve student performance. Because these

NC High School Resource Allocation Study: Executive Summary Page viii
findings derive solely from interviews in a relatively small number of high schools, they cannot be regarded as conclusive, but they seem promising. Several programs of professional development and assistance for high school principals have already been put into place by the State Board of Education and NCDPI, the New Schools Project, the Principals’ Executive Program in cooperation with UNC-Chapel Hill’s Kenan-Flagler School of Business, the Public School Forum, and others. We have no information on the degree to which these programs individually or as a set may be focusing principals’ attention on the behaviors and organizational conditions that we found in more effective high schools. Important as principal leadership appears to be, our findings strongly suggest that improved principal leadership alone is not likely to enable schools with challenging student populations to achieve high standards of performance. But strengthening principal leadership may prove to be an important component of the state’s overall efforts to improve low-performing high schools. Conclusion In summary, our analysis indicates that both the resources that students bring to high schools and the resources that high schools provide to students shape student learning outcomes. The indicators of students’ resources that exert the most powerful effects are the mathematics skills they bring to high school, followed by disability status, ethnicity, family income level, and reading skills. After separating out the effects of these individual student resources, we found that four sets of school resources or factors make a substantial difference in student learning outcomes: (1) expenditures on regular classroom instruction and to a lesser extent, instruction for special education students, transportation, and district services and administration, (2) the overall quality of teachers in a school as measured by licensure type, general academic ability, and mix of experience levels, (3) principal leadership and associated organizational conditions, and (4) the concentrations of lower skilled students within a high school. Our findings strongly suggest that more resources and more effective use of existing resources will be needed to offset the effects of lower levels of student resources and to improve performance in chronically low-performing high schools. We have suggested some ways that reallocation of existing resources, the addition of new resources, and changes in leadership practices could improve performance in currently underperforming high schools. In a set of related studies, including the evaluation of the Disadvantaged Student Supplemental Fund, we are pursuing further analyses of resources and student learning at the middle and elementary school levels, and the use of teaching resources in specific high school classrooms. These should enable us to suggest more specific points of leverage that policy makers can use to improve academic performance across the state.
CHAPTER 1: INTRODUCTION In September 2006, Governor Mike Easley commissioned this study to examine the use of funds in North Carolina high schools. Just prior to this announcement, with the support and encouragement of the Governor and the State Board of Education, the General Assembly had appropriated an additional $100 M for public education from state funds, including nearly $25 M directed at improving outcomes for academically disadvantaged students. One purpose for this study of high school expenditure patterns was to hold school districts accountable for the state funding that they received. At that time, much attention already had been focused specifically on high schools. Between 1999 and 2003, as part of his ruling in Leandro v. State of North Carolina, Superior Court Judge Howard Manning, Jr. issued a series of opinions in which he concluded that:
• Every student must be taught by a highly qualified teacher. • Every school must be led by a highly competent administrator. • Every school must have the resources necessary to provide each student with an equal
opportunity to receive a sound, basic education.
On July 30, 2004, in response to an appeal of Judge Manning’s rulings by the State, the NC Supreme Court ruled that every child in North Carolina has a constitutional right to have an equal opportunity to receive a sound, basic education. Subsequently, in 2005 as part of his further rulings on the case, Judge Manning identified 44 low-performing high schools across the state and threatened them with closure if their academic performance did not improve. Other forces from outside the state, such as the Bill and Melinda Gates Foundation’s support for high school reform, were also focusing on the performance of high school students. It was within this context that Governor Easley and the State Board of Education commissioned the High School Resource Allocation study to address three questions:
1. How much do expenditures in high schools vary across the state? 2. To what extent do expenditures affect high school performance? 3. How are the resources that are obtained through the expenditure of the funding–
including employing higher quality teachers, exercising leadership, or putting organizational processes into place– affecting student performance?
This study was designed by a team of researchers organized through the University of North Carolina at Chapel Hill and carried out by faculty at UNC-Chapel Hill and East Carolina University as well as several graduate students. The study methods included sophisticated statistical analysis of financial, assessment, and other data as well as on-site interviews at high schools throughout the state.
Chronically Low-Performing High Schools
As indicated earlier, in a March 2006 letter to the Superintendent of Public Instruction and State Board of Education, Judge Howard Manning singled out for special attention 44 high schools with performance composites remaining at or below 60% for five years. The list was based
NC High School Resource Allocation Study Page 2
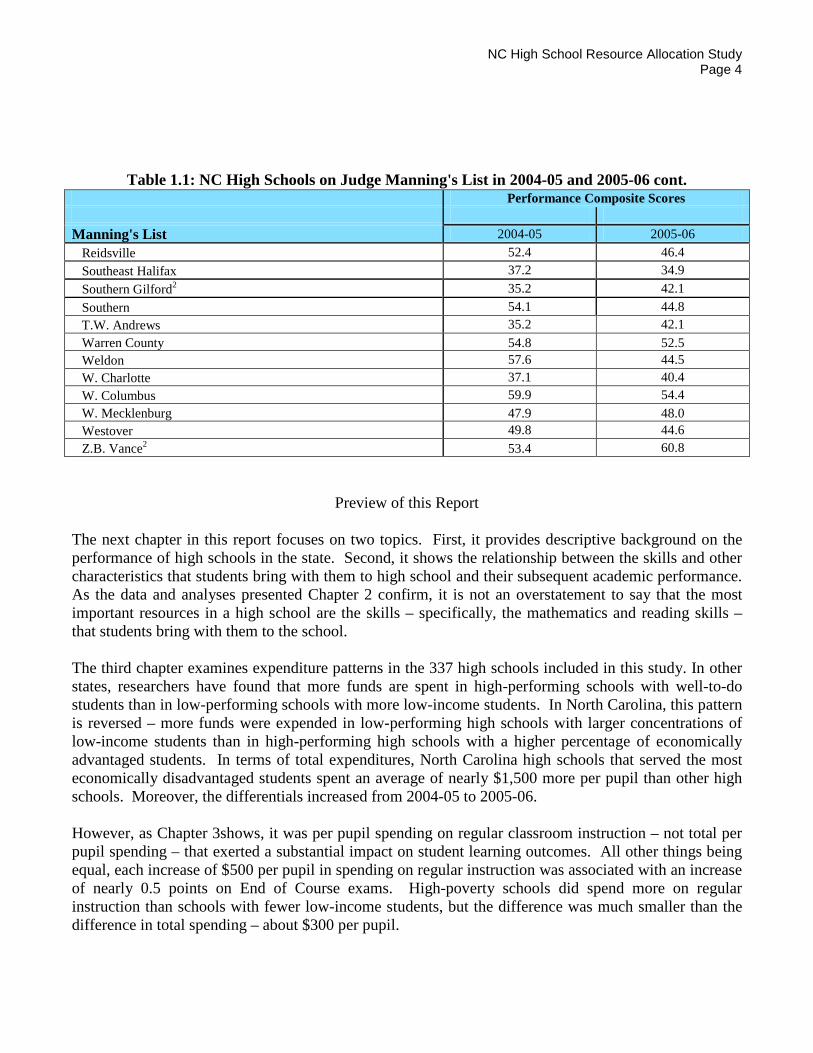
on the performance composite – a single indicator that sums up the results of all End of Course assessments – from the 2000-01 through 2004-05 school years. By the end of the 2005-06 school year, various combinations of pressure, state and local assistance, hard work, and reorganization enabled seven of them to pull their performance composites up enough to be removed from Judge Manning’s list of chronically underperforming high schools. Table 1.1 on the following page displays both Manning’s original list of 44 high schools and the reduced list of 37 that remained after 2005-06.

NC High School Resource Allocation Study Page 3
Table 1.1: NC High Schools on Judge Manning's List in 2004-05 and 2005-06
Performance Composite Scores
2004-05 2005-06 All NC High Schools
All NC High Schools 68.5 68.5 Average Manning’s Lists Performance Composites Manning's Original List (n=44) 50.2 48.7 Manning's Updated List (n=37) 49.0 46.1 Manning's List
Anson 53.7 46.5 Ben L. Smith 45.5 47.5 Bertie 53.2 42.7 Bessemer City 58.9 58.3 Carver 45.6 39.5 Dudley 50.9 51.7 E.E. Smith 51.2 52.9 E.E. Waddell 48.4 49.3 E. Mecklenburg 59.2 63.6 Eastern Guilford 57.5 62.3 Garinger 42.7 45.5 GC Middle College 55.8 78.01 Goldsboro 53.5 52.8 Harding University 58.8 55.4 Hertford 48.3 41.3 High Point Central 52.4 61.1 Hillside 47.3 43.5 Hoke County 53.2 43.6 H.M. Cummings 50.7 51.6 Independence 56.7 63.3 James Kenan 56.8 48.6 Lexington Senior 54.6 53.1 Middle College HS at Bennett 20.6 18.7 Middle College High NC A&T 24.6 17.6 Northampton High West 46.4 46.5 Northeastern 57.7 60.9 Northwest 39.1 35.2 Olympic 54.4 55.6 Overhills 54.7 56.8 Parkland 59.9 52.9 Phillip ‘O Berry 49.1 51.0 Plymouth 50.6 49.0
NC High School Resource Allocation Study Page 4
Table 1.1: NC High Schools on Judge Manning's List in 2004-05 and 2005-06 cont.
Performance Composite Scores Manning's List 2004-05 2005-06 Reidsville 52.4 46.4 Southeast Halifax 37.2 34.9 Southern Gilford2 35.2 42.1 Southern 54.1 44.8 T.W. Andrews 35.2 42.1 Warren County 54.8 52.5 Weldon 57.6 44.5 W. Charlotte 37.1 40.4 W. Columbus 59.9 54.4 W. Mecklenburg 47.9 48.0 Westover 49.8 44.6 Z.B. Vance2 53.4 60.8
Preview of this Report The next chapter in this report focuses on two topics. First, it provides descriptive background on the performance of high schools in the state. Second, it shows the relationship between the skills and other characteristics that students bring with them to high school and their subsequent academic performance. As the data and analyses presented Chapter 2 confirm, it is not an overstatement to say that the most important resources in a high school are the skills – specifically, the mathematics and reading skills –that students bring with them to the school. The third chapter examines expenditure patterns in the 337 high schools included in this study. In other states, researchers have found that more funds are spent in high-performing schools with well-to-do students than in low-performing schools with more low-income students. In North Carolina, this pattern is reversed – more funds were expended in low-performing high schools with larger concentrations of low-income students than in high-performing high schools with a higher percentage of economically advantaged students. In terms of total expenditures, North Carolina high schools that served the most economically disadvantaged students spent an average of nearly $1,500 more per pupil than other high schools. Moreover, the differentials increased from 2004-05 to 2005-06. However, as Chapter 3shows, it was per pupil spending on regular classroom instruction – not total per pupil spending – that exerted a substantial impact on student learning outcomes. All other things being equal, each increase of $500 per pupil in spending on regular instruction was associated with an increase of nearly 0.5 points on End of Course exams. High-poverty schools did spend more on regular instruction than schools with fewer low-income students, but the difference was much smaller than the difference in total spending – about $300 per pupil.
NC High School Resource Allocation Study Page 5
The fourth chapter delves into the effects of school-to-school differences on several measures of teacher quality. As Chapter 4 shows, employing teachers with provisional or lateral entry licenses adversely affected student performance. Approximately 20%of the teachers in schools with a high concentration of poverty had these types of licenses. Perhaps surprisingly, when the effects of other variables are separated out, higher percentages of teachers with 15 or fewer years of experience were associated with better student performance. Employing higher percentages of teachers who graduated from the most highly competitive colleges was associated with higher student performance. But unfortunately, schools with high concentrations of poverty and lower performance composites have been unable to hire as many of these teachers as other high schools. For example, 10.7% of the teachers in high-poverty high schools had degrees from the most highly competitive colleges compared to 17.9% of the teachers in low-poverty high schools. The fifth chapter includes the results of extensive on-site interviews of principals and teachers designed to yield an understanding of the impact of school-to-school differences in leadership upon student performance. These interviews provided data we used to examine differences in how leaders managed teachers and other resources to influence student performance. A comparison of schools where challenging student populations performed relatively well with chronically low-performing schools showed strikingly different patterns of leadership and associated organizational conditions. In summary, we find that: (1) additional financial resources do matter, especially when they are directed toward regular instruction, (2) the composition of the faculty in high schools affects achievement and schools with high percentages of educationally disadvantaged students are less likely to have access to higher quality teachers, and (3) principals who mobilize their resources to institute certain achievement-focused organizational behaviors seem to improve student learning. This type of leadership may be essential to raise achievement in schools where students enter with low levels of mathematics and reading skills. Considering our findings overall, we note that no single factor, reform model, or practice turned out to be “the” solution for improving high school performance. Our findings suggest that a combination of increased financial resources and more effective use of existing resources will be needed to offset the effects of the low levels of skill and knowledge that many students bring with them to high school and to improve performance in chronically low-performing high schools.

NC High School Resource Allocation Study Page 6
CHAPTER 2 A HIGH SCHOOL’S MOST IMPORTANT RESOURCE: THE SKILLS THAT STUDENTS BRING WITH THEM
Before examining how financial resources affect learning outcomes in low-performing and other North Carolina high schools, it is important to first consider the differing educational challenges posed by school-to-school differences in their student populations. In this analysis, it is essential to keep two facts in mind. First, we are emphatically not saying or implying that educationally disadvantaged students somehow cannot achieve at sufficiently high levels to thrive in the workplace or be good citizens and family members. In fact, we take it for granted that they can do so. On the other hand, the reality of the current situation cannot be ignored. Through no fault of their own, students with academic disadvantages, often those from low-income families or from traditionally disenfranchised ethnic groups do not bring the same learning resources to school as do more advantaged students Common sense tells us that students’ academic achievement is shaped by the resources that they bring to the school, as well as the resources that the school brings to the students. Public schools are morally and constitutionally obligated to educate all of the students who walk through the door. However, the students who walk through the doors of some schools present bigger challenges than those who walk through the doors of other schools. The remainder of this chapter addresses the following questions:
1. How great are the student background differences across North Carolina’s high schools? 2. How much do these student background differences affect learning outcomes?
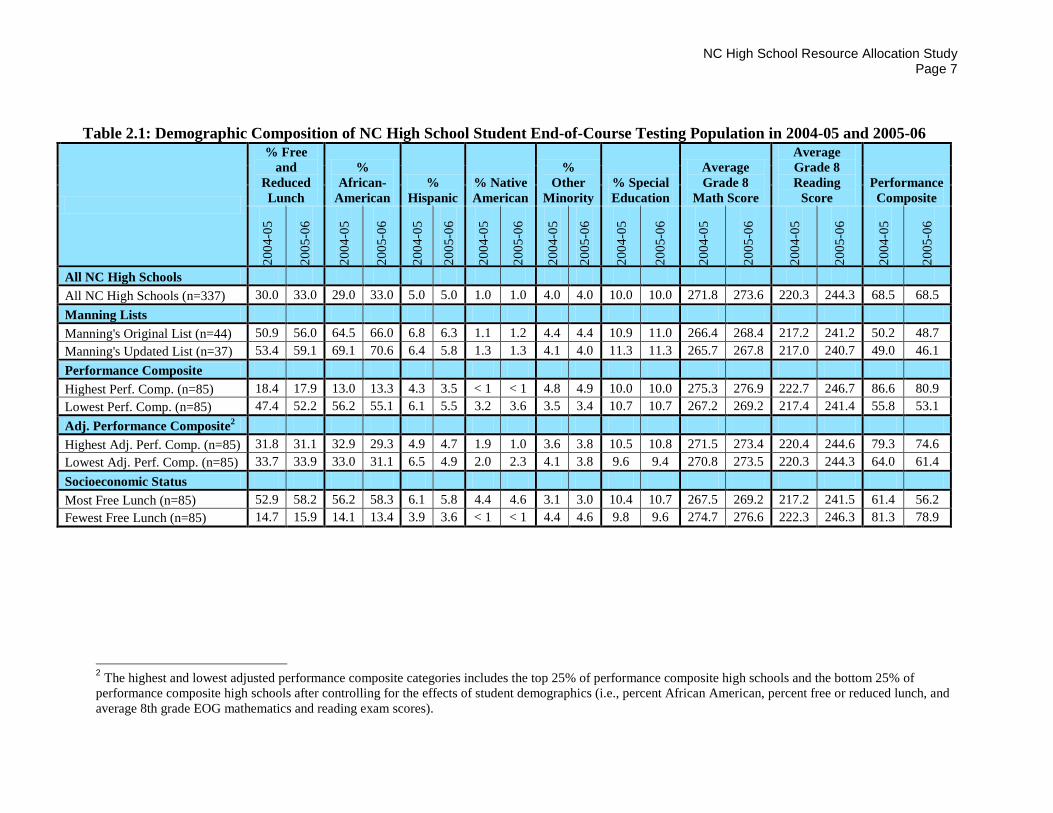
Table 2.1 compares the high schools on Judge Manning’s two lists with other NC high schools in terms of the percentage of students participating in the federal free or reduced-price lunch program; the percentage who are African-American, Hispanic, Native American/American Indian, or Other Minority; the percentage identified for special education services; and students’ average 8th grade EOG scores in reading and mathematics. Manning’s lists of chronically low-performing high schools are compared with: (a) the mean percentages for all North Carolina high schools; (b) the mean percentages for NC high schools with the highest and lowest performance composite scores; (c) the mean percentages for the quarter of NC high schools with the highest and lowest adjusted performance composite scores; and (d) the mean percentages for NC high schools with the greatest and smallest concentrations of free or reduced-price lunch students.
NC High School Resource Allocation Study Page 7
Table 2.1: Demographic Composition of NC High School Student End-of-Course Testing Population in 2004-05 and 2005-06
% Free and
Reduced Lunch
% African-
American %
Hispanic % Native American
% Other
Minority % Special Education
Average Grade 8
Math Score
Average Grade 8 Reading
Score Performance Composite
2004
-05
2005
-06
2004
-05
2005
-06
2004
-05
2005
-06
2004
-05
2005
-06
2004
-05
2005
-06
2004
-05
2005
-06
2004
-05
2005
-06
2004
-05
2005
-06
2004
-05
2005
-06
All NC High Schools
All NC High Schools (n=337) 30.0 33.0 29.0 33.0 5.0 5.0 1.0 1.0 4.0 4.0 10.0 10.0 271.8 273.6 220.3 244.3 68.5 68.5 Manning Lists Manning's Original List (n=44) 50.9 56.0 64.5 66.0 6.8 6.3 1.1 1.2 4.4 4.4 10.9 11.0 266.4 268.4 217.2 241.2 50.2 48.7 Manning's Updated List (n=37) 53.4 59.1 69.1 70.6 6.4 5.8 1.3 1.3 4.1 4.0 11.3 11.3 265.7 267.8 217.0 240.7 49.0 46.1 Performance Composite Highest Perf. Comp. (n=85) 18.4 17.9 13.0 13.3 4.3 3.5 < 1 < 1 4.8 4.9 10.0 10.0 275.3 276.9 222.7 246.7 86.6 80.9 Lowest Perf. Comp. (n=85) 47.4 52.2 56.2 55.1 6.1 5.5 3.2 3.6 3.5 3.4 10.7 10.7 267.2 269.2 217.4 241.4 55.8 53.1 Adj. Performance Composite2 Highest Adj. Perf. Comp. (n=85) 31.8 31.1 32.9 29.3 4.9 4.7 1.9 1.0 3.6 3.8 10.5 10.8 271.5 273.4 220.4 244.6 79.3 74.6 Lowest Adj. Perf. Comp. (n=85) 33.7 33.9 33.0 31.1 6.5 4.9 2.0 2.3 4.1 3.8 9.6 9.4 270.8 273.5 220.3 244.3 64.0 61.4 Socioeconomic Status Most Free Lunch (n=85) 52.9 58.2 56.2 58.3 6.1 5.8 4.4 4.6 3.1 3.0 10.4 10.7 267.5 269.2 217.2 241.5 61.4 56.2 Fewest Free Lunch (n=85) 14.7 15.9 14.1 13.4 3.9 3.6 < 1 < 1 4.4 4.6 9.8 9.6 274.7 276.6 222.3 246.3 81.3 78.9
2 The highest and lowest adjusted performance composite categories includes the top 25% of performance composite high schools and the bottom 25% of performance composite high schools after controlling for the effects of student demographics (i.e., percent African American, percent free or reduced lunch, and average 8th grade EOG mathematics and reading exam scores).

NC High School Resource Allocation Study Page 8
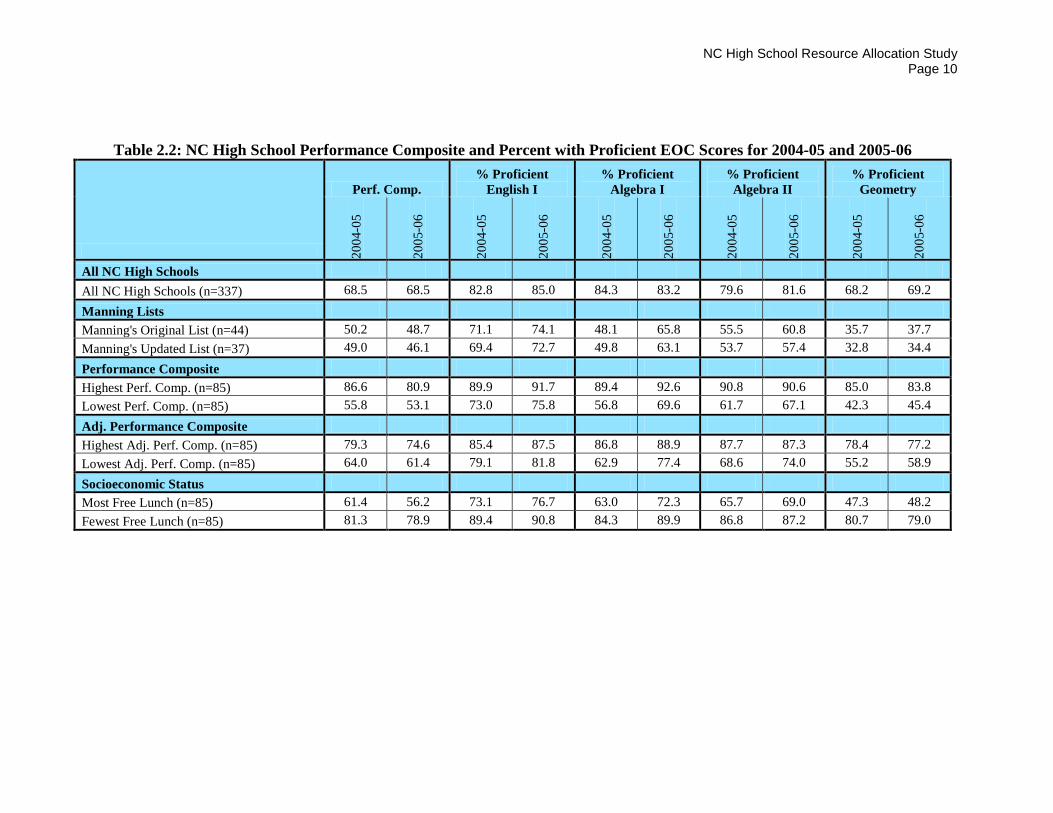
On some student background variables, the differences across high schools were striking. For example, in 2004-05 about 51% of the students in high schools on Judge Manning’s original list participated in the federal free and reduced-price lunch program, compared with an average of only 30% for NC high schools as a whole and only about 18% in the highest-performing NC high schools. The differences in the percentage of students who are African-American are noteworthy as well. In 2004-05, about 65% of the students in Judge Manning’s original list of schools were African-American, compared with 29% in all NC high schools and only 13% in the highest-performing NC high schools. The differences are more modest in the percentage of students who were Hispanic, Native American/American Indian, and Other Minority, as well as the percentage of students identified for special education. Even more significant is the fact that students came into the high schools on Manning’s original list with substantially lower mathematics and reading skills than students entering other NC high schools. On average, their 8th grade EOG mathematics scores were about five points lower than the average for all NC high schools, and almost nine points lower than the average for students in the highest-performing NC high schools. Differences in 8th grade mathematics and reading scores were significant between high schools with high concentrations of poverty and those with low levels of poverty. The 8th grade mathematics and reading score differences were even larger between schools with the highest EOC passing rates and those with the lowest passing rates. Two other comparisons also bear mention. First, the schools on Manning’s original 2004-05 list had free lunch (FRL) rates that were approximately the same as the NC high schools with the highest poverty rates as measured by eligibility for free or reduced price lunch. But the schools on Manning’s list had a higher percentage of African-American students. Second, the seven high schools that improved sufficiently between 2004-05 and 2005-06 to get off of Manning’s list had noticeably lower percentages of free or reduced-price lunch students and African-American students than the 37 high schools that remained on the list. They also had students with higher 8th grade EOG scores than did the schools that remained on the list. Thus, when these seven schools are removed from the chronically underperforming list, the average FRL and African-American percentages across the remaining 37 schools rises and the average 8th grade EOG scores decline, accentuating the differences noted earlier. In addition, Table 2.1 provides a first view of how the demographics look when we remove the effects of student background characteristics from performance. The adjusted performance composite calculations reflect statistical adjustments for the test scores of incoming students, the levels of poverty, and racial differences between schools. After making these adjustments, few significant demographic differences between the highest and lowest performing high schools are observed. This is not to say that all high schools are performing equally, because there are differences, but it does indicate that the performance of high schools are highly variable – that is, even high schools with large numbers of students entering with high scores does not necessarily mean that the school will produce large gains for these students during high school. In Table 2.2, the results for each EOC exam are presented. While the patterns for individual tests are related to performance composite patterns, there are a few noteworthy differences. High school students were the most proficient at English I and Algebra I. Performance dropped off in

NC High School Resource Allocation Study Page 9
the more advanced science and mathematics courses. Physics was the exception, most likely because it is taken by the smallest number of students, a highly selective group. Passing rates for Biology, Chemistry, and Geometry were particularly low for high-poverty schools and schools that were on Manning’s list. In addition, the new EOC exams added in 2005-06, Civics & Economics and U.S. History, had low pass rates, especially in high-poverty schools and schools that were on Manning’s list.
NC High School Resource Allocation Study Page 10
Table 2.2: NC High School Performance Composite and Percent with Proficient EOC Scores for 2004-05 and 2005-06
Perf. Comp. % Proficient
English I % Proficient
Algebra I % Proficient
Algebra II % Proficient
Geometry
2004
-05
2005
-06
2004
-05
2005
-06
2004
-05
2005
-06
2004
-05
2005
-06
2004
-05
2005
-06
All NC High Schools
All NC High Schools (n=337) 68.5 68.5 82.8 85.0 84.3 83.2 79.6 81.6 68.2 69.2 Manning Lists Manning's Original List (n=44) 50.2 48.7 71.1 74.1 48.1 65.8 55.5 60.8 35.7 37.7 Manning's Updated List (n=37) 49.0 46.1 69.4 72.7 49.8 63.1 53.7 57.4 32.8 34.4 Performance Composite Highest Perf. Comp. (n=85) 86.6 80.9 89.9 91.7 89.4 92.6 90.8 90.6 85.0 83.8 Lowest Perf. Comp. (n=85) 55.8 53.1 73.0 75.8 56.8 69.6 61.7 67.1 42.3 45.4 Adj. Performance Composite Highest Adj. Perf. Comp. (n=85) 79.3 74.6 85.4 87.5 86.8 88.9 87.7 87.3 78.4 77.2 Lowest Adj. Perf. Comp. (n=85) 64.0 61.4 79.1 81.8 62.9 77.4 68.6 74.0 55.2 58.9 Socioeconomic Status Most Free Lunch (n=85) 61.4 56.2 73.1 76.7 63.0 72.3 65.7 69.0 47.3 48.2 Fewest Free Lunch (n=85) 81.3 78.9 89.4 90.8 84.3 89.9 86.8 87.2 80.7 79.0

NC High School Resource Allocation Study Page 11
Table 2.2 (cont.): NC High School Performance Composite and Percent with Proficient EOC Scores for 2004-05 and 2005-06
% Proficient Biology
% Proficient Chemistry
% Proficient Phy. Science
% Proficient Physics
% Proficient Civics & Econ.3
% Proficient U.S.
History4
2004
-05
2005
-06
2004
-05
2005
-06
2004
-05
2005
-06
2004
-05
2005
-06
2005
-06
2005
-06
All NC High Schools
All NC High Schools (n=337) 64.7 65.9 76.7 77.9 69.4 71.9 86.2 85.3 62.8 59.2
Manning Lists Manning's Original List (n=44) 40.6 44.7 47.9 50.3 42.5 50.6 68.7 64.2 44.2 39.3 Manning's Updated List (n=37) 38.3 41.1 45.4 47.1 43.0 49.3 65.4 55.3 40.3 34.3
Performance Composite Highest Perf. Comp. (n=85) 79.4 79.8 87.3 88.2 82.5 82.0 92.2 90.3 76.1 73.1 Lowest Perf. Comp. (n=85) 46.1 47.6 55.1 58.2 51.1 57.0 72.7 67.6 45.4 39.9
Adj. Performance Composite Highest Adj. Perf. Comp. (n=85) 71.4 73.1 85.7 85.9 76.3 74.8 89.8 90.6 69.3 66.7 Lowest Adj. Perf. Comp. (n=85) 55.3 58.9 63.7 69.1 58.4 63.1 78.2 80.4 57.4 52.8
Socioeconomic Status Most Free Lunch (n=85) 48.9 48.6 59.8 60.4 58.6 62.5 73.6 69.7 45.9 41.5 Fewest Free Lunch (n=85) 75.8 77.0 84.6 84.8 78.4 79.4 90.6 89.0 74.2 71.7
3 The North Carolina End-of-Course Civics and Economics Test was implemented statewide for the first time in the fall of 2005. 4 The North Carolina End-of-Course U.S. History Test was implemented statewide for the first time in the fall of 2005.
NC High School Resource Allocation Study Page 12
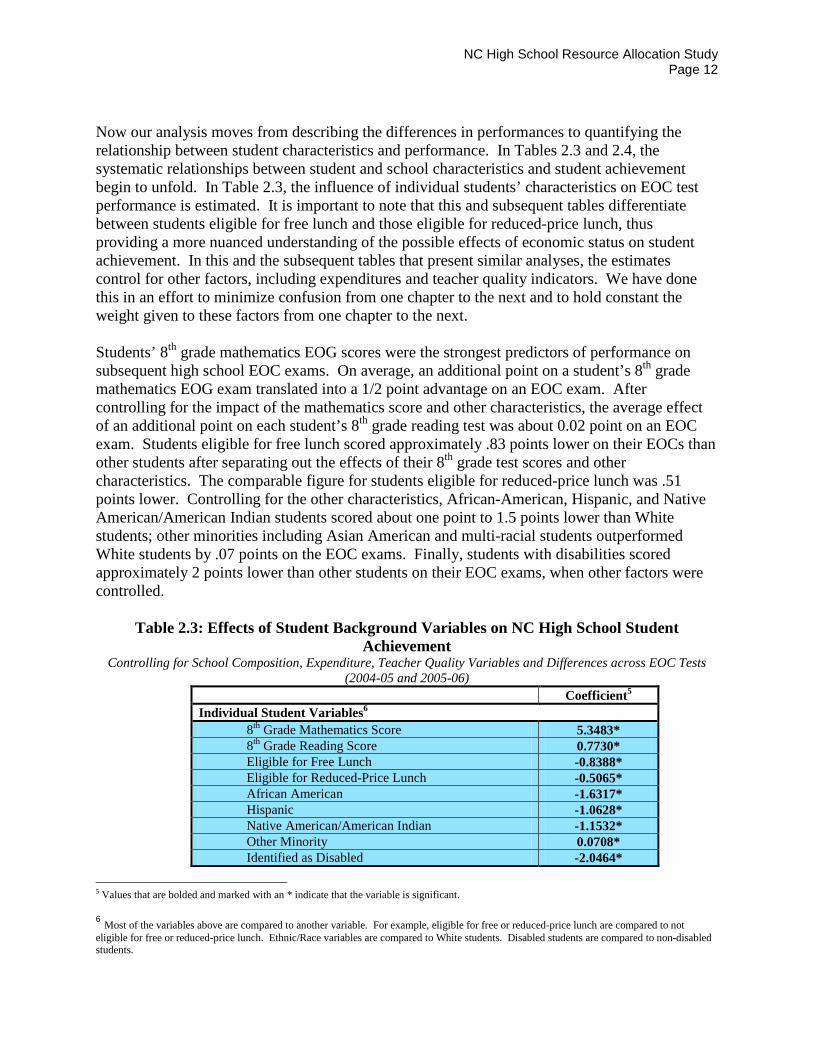
Now our analysis moves from describing the differences in performances to quantifying the relationship between student characteristics and performance. In Tables 2.3 and 2.4, the systematic relationships between student and school characteristics and student achievement begin to unfold. In Table 2.3, the influence of individual students’ characteristics on EOC test performance is estimated. It is important to note that this and subsequent tables differentiate between students eligible for free lunch and those eligible for reduced-price lunch, thus providing a more nuanced understanding of the possible effects of economic status on student achievement. In this and the subsequent tables that present similar analyses, the estimates control for other factors, including expenditures and teacher quality indicators. We have done this in an effort to minimize confusion from one chapter to the next and to hold constant the weight given to these factors from one chapter to the next. Students’ 8th grade mathematics EOG scores were the strongest predictors of performance on subsequent high school EOC exams. On average, an additional point on a student’s 8th grade mathematics EOG exam translated into a 1/2 point advantage on an EOC exam. After controlling for the impact of the mathematics score and other characteristics, the average effect of an additional point on each student’s 8th grade reading test was about 0.02 point on an EOC exam. Students eligible for free lunch scored approximately .83 points lower on their EOCs than other students after separating out the effects of their 8th grade test scores and other characteristics. The comparable figure for students eligible for reduced-price lunch was .51 points lower. Controlling for the other characteristics, African-American, Hispanic, and Native American/American Indian students scored about one point to 1.5 points lower than White students; other minorities including Asian American and multi-racial students outperformed White students by .07 points on the EOC exams. Finally, students with disabilities scored approximately 2 points lower than other students on their EOC exams, when other factors were controlled.
Table 2.3: Effects of Student Background Variables on NC High School Student Achievement
Controlling for School Composition, Expenditure, Teacher Quality Variables and Differences across EOC Tests (2004-05 and 2005-06)
Coefficient5 Individual Student Variables6
8th Grade Mathematics Score 5.3483* 8th Grade Reading Score 0.7730* Eligible for Free Lunch -0.8388* Eligible for Reduced-Price Lunch -0.5065* African American -1.6317* Hispanic -1.0628* Native American/American Indian -1.1532* Other Minority 0.0708* Identified as Disabled -2.0464*
5 Values that are bolded and marked with an * indicate that the variable is significant. 6 Most of the variables above are compared to another variable. For example, eligible for free or reduced-price lunch are compared to not eligible for free or reduced-price lunch. Ethnic/Race variables are compared to White students. Disabled students are compared to non-disabled students.
NC High School Resource Allocation Study Page 13
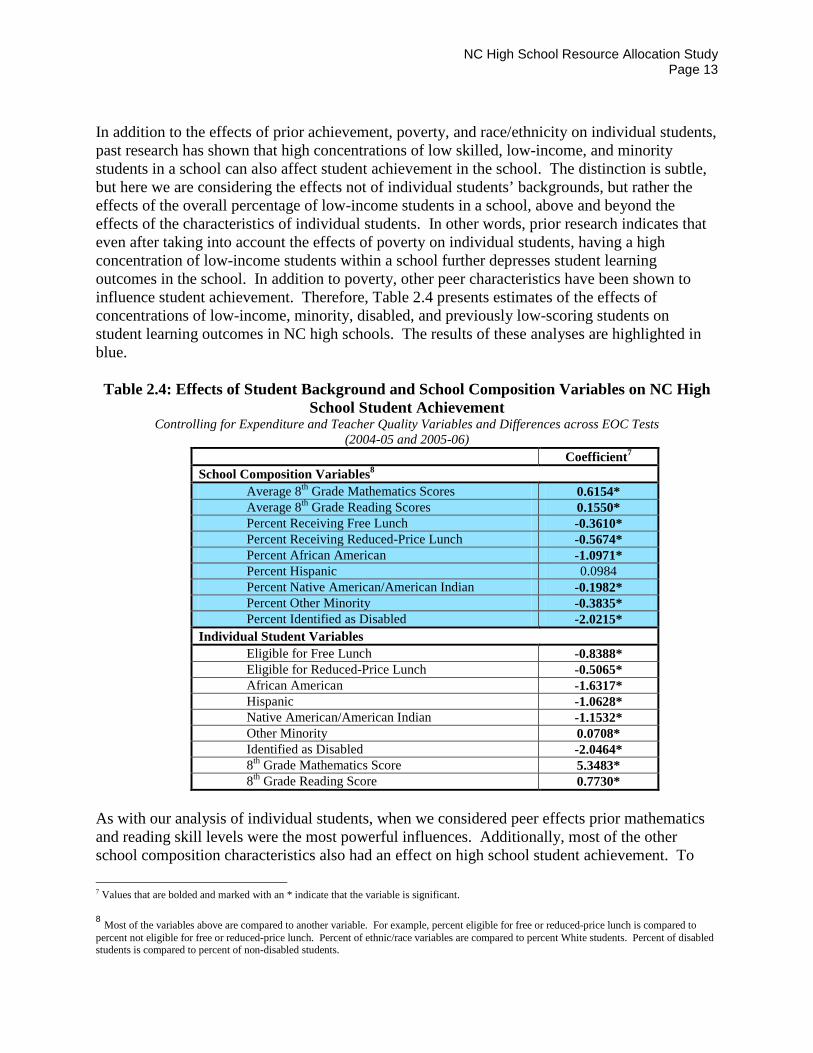
In addition to the effects of prior achievement, poverty, and race/ethnicity on individual students, past research has shown that high concentrations of low skilled, low-income, and minority students in a school can also affect student achievement in the school. The distinction is subtle, but here we are considering the effects not of individual students’ backgrounds, but rather the effects of the overall percentage of low-income students in a school, above and beyond the effects of the characteristics of individual students. In other words, prior research indicates that even after taking into account the effects of poverty on individual students, having a high concentration of low-income students within a school further depresses student learning outcomes in the school. In addition to poverty, other peer characteristics have been shown to influence student achievement. Therefore, Table 2.4 presents estimates of the effects of concentrations of low-income, minority, disabled, and previously low-scoring students on student learning outcomes in NC high schools. The results of these analyses are highlighted in blue. Table 2.4: Effects of Student Background and School Composition Variables on NC High
School Student Achievement Controlling for Expenditure and Teacher Quality Variables and Differences across EOC Tests
(2004-05 and 2005-06) Coefficient7 School Composition Variables8
Average 8th Grade Mathematics Scores 0.6154* Average 8th Grade Reading Scores 0.1550* Percent Receiving Free Lunch -0.3610* Percent Receiving Reduced-Price Lunch -0.5674* Percent African American -1.0971* Percent Hispanic 0.0984 Percent Native American/American Indian -0.1982* Percent Other Minority -0.3835* Percent Identified as Disabled -2.0215*
Individual Student Variables Eligible for Free Lunch -0.8388* Eligible for Reduced-Price Lunch -0.5065* African American -1.6317* Hispanic -1.0628* Native American/American Indian -1.1532* Other Minority 0.0708* Identified as Disabled -2.0464* 8th Grade Mathematics Score 5.3483* 8th Grade Reading Score 0.7730*
As with our analysis of individual students, when we considered peer effects prior mathematics and reading skill levels were the most powerful influences. Additionally, most of the other school composition characteristics also had an effect on high school student achievement. To 7 Values that are bolded and marked with an * indicate that the variable is significant. 8 Most of the variables above are compared to another variable. For example, percent eligible for free or reduced-price lunch is compared to percent not eligible for free or reduced-price lunch. Percent of ethnic/race variables are compared to percent White students. Percent of disabled students is compared to percent of non-disabled students.
NC High School Resource Allocation Study Page 14
illustrate, let us translate the coefficients in the table above into numbers that may be a little easier to grasp: for every five additional points on the average 8th grade mathematics score of students entering a given high school, students in that school are predicted to score 0.83 point higher on subsequent EOC exams. Higher concentrations of poor and African-American or Native American/American Indian students in a school reduce the EOC exam scores of students in that school but by a lesser amount. Taken as a whole, the preceding discussion underlines three points. The first seems obvious but can easily be underemphasized: it is substantially more challenging to bring a student who enters high school with low mathematics and reading skills up to a proficient level on End of Course tests than it is to educate a better prepared student to proficiency. Second, it is even harder to educate initially low-skilled students to proficiency in a school with a high concentration of such students. Third, the task is still more difficult in schools that also have high concentrations of low-income and minority students. While this is recognized in various ways by the state’s education leaders, it may be important to restate the issue in this way: it requires more effort to overcome skill deficits of an individual student in schools with a high percentage of these students than in schools with a low percentage of these students. The effects of being a poorly skilled student entering a high school with large percentages of other poorly-performing students, in a high-poverty school, and a minority in a school with a high concentration of minorities are additive in these analyses. For example, consider a low-income African American student with a score five points below the average 8th grade mathematics score in a high school with 5% more poor students than average, 5% more African American students and an average mathematics score five points below average. That student scores over 6 points lower on an EOC exam than a student with an average score on the 8th grade mathematics EOG, who is not poor, who is White, and who attends a school at the state averages for percent free lunch eligible, African American percentages, and 8th grade mathematics scores. As we have seen in this chapter, the effects of prior achievement, poverty, ethnicity, and handicapping conditions are powerful. If schools with high percentages of initially low-skilled, low-income, minority, and handicapped students are to produce performance composites comparable to those for the average NC high school, these schools must bring greater effort and more learning resources to their students in order to compensate for the lower levels of skills that their students bring to the school. There are at least two ways to conceive and measure the resources that schools bring to students. One is to think financially, in terms of the dollars that schools spend on their students. A second is to think in terms of what some have identified as the most important “resource” that schools bring to their students – high quality teachers. In the chapter that follows, we estimate the effects of financial expenditures on learning outcomes. In the third chapter, we estimate the effects of teacher quality on learning outcomes. In each case, we use statistical controls to set aside the effects of student demographics. We do so because schools deserve neither credit nor blame for the students they get. They must educate all of the students who walk in their doors to the best of their ability.
NC High School Resource Allocation Study Page 15
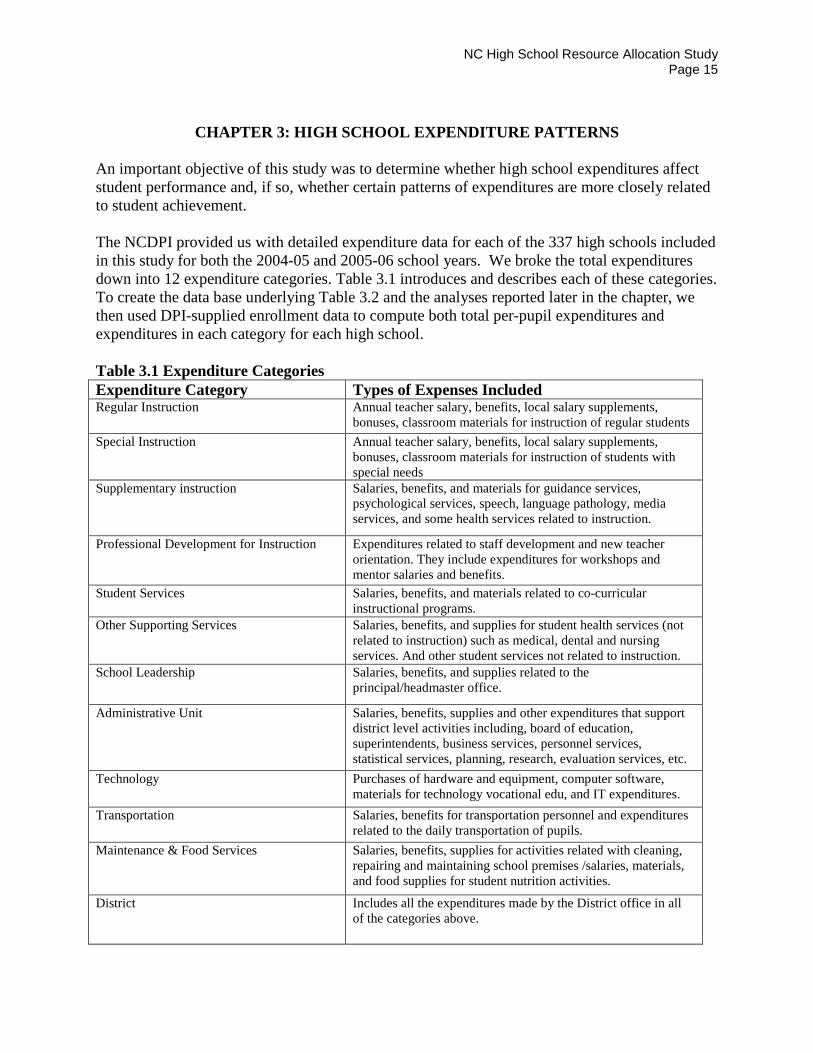
CHAPTER 3: HIGH SCHOOL EXPENDITURE PATTERNS An important objective of this study was to determine whether high school expenditures affect student performance and, if so, whether certain patterns of expenditures are more closely related to student achievement. The NCDPI provided us with detailed expenditure data for each of the 337 high schools included in this study for both the 2004-05 and 2005-06 school years. We broke the total expenditures down into 12 expenditure categories. Table 3.1 introduces and describes each of these categories. To create the data base underlying Table 3.2 and the analyses reported later in the chapter, we then used DPI-supplied enrollment data to compute both total per-pupil expenditures and expenditures in each category for each high school. Table 3.1 Expenditure Categories Expenditure Category Types of Expenses Included Regular Instruction Annual teacher salary, benefits, local salary supplements,
bonuses, classroom materials for instruction of regular students Special Instruction Annual teacher salary, benefits, local salary supplements,
bonuses, classroom materials for instruction of students with special needs
Supplementary instruction Salaries, benefits, and materials for guidance services, psychological services, speech, language pathology, media services, and some health services related to instruction.
Professional Development for Instruction Expenditures related to staff development and new teacher orientation. They include expenditures for workshops and mentor salaries and benefits.
Student Services Salaries, benefits, and materials related to co-curricular instructional programs.
Other Supporting Services Salaries, benefits, and supplies for student health services (not related to instruction) such as medical, dental and nursing services. And other student services not related to instruction.
School Leadership Salaries, benefits, and supplies related to the principal/headmaster office.
Administrative Unit Salaries, benefits, supplies and other expenditures that support district level activities including, board of education, superintendents, business services, personnel services, statistical services, planning, research, evaluation services, etc.
Technology Purchases of hardware and equipment, computer software, materials for technology vocational edu, and IT expenditures.
Transportation Salaries, benefits for transportation personnel and expenditures related to the daily transportation of pupils.
Maintenance & Food Services Salaries, benefits, supplies for activities related with cleaning, repairing and maintaining school premises /salaries, materials, and food supplies for student nutrition activities.
District Includes all the expenditures made by the District office in all of the categories above.
NC High School Resource Allocation Study Page 16
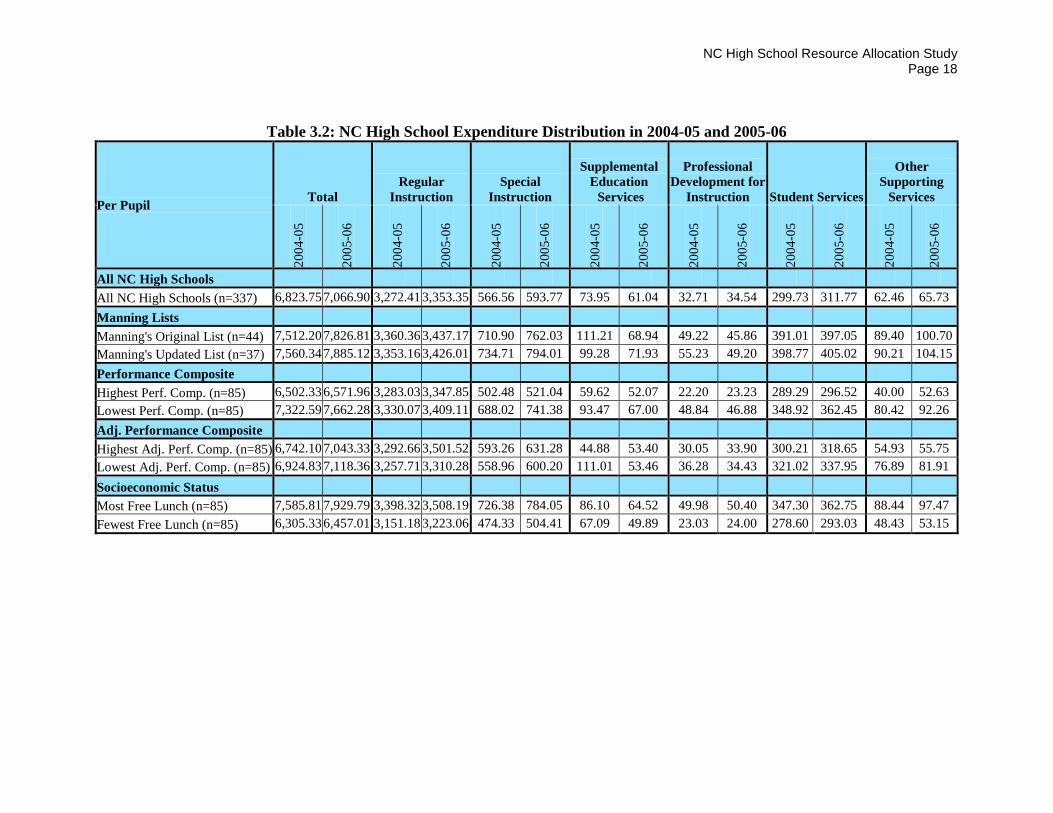
Table 3.2 below offers a comparison of expenditures in the chronically underperforming high schools with expenditures in other high schools across the state. In 2004-05, the 44 high schools on Manning’s original list spent an average of $7,512 per student – nearly $700 more than the average for all NC high schools and almost $1,200 more than the average per pupil expenditure for the quarter of all NC high schools with the fewest students eligible for free or reduced-price lunch. Across all 337 high schools, from 2004-05 to 2005-06 expenditures increased by more than $200 per pupil. During that same period, average per pupil expenditures increased more in the schools on Manning’s original list ($315 per pupil) and even more in the quarter of the high schools with the highest percentages of students eligible for free or reduced-price lunch ($344 per pupil). In a nutshell, low-performing schools and schools with a lot of low-income students are spending more than higher performing schools and schools with economically better-off students. Moreover, the differentials increased from 2004-05 to 2005-06. This pattern of total per pupil expenditures stands in contrast to reports about expenditure patterns in other states, where more is spent in high-performing schools with higher-income students. If an important goal of school finance policy is to provide more resources to schools with more challenging students, then North Carolina education policy makers are succeeding to some degree. Whether the extra funding helps the most challenged schools produce better outcomes and whether the help is adequate to enable them to meet the Leandro test – providing a sound, basic education for every student – are questions addressed later in this chapter. The spending advantage of more challenged schools is reproduced, although on a smaller scale, when we examine per pupil expenditures for regular instruction, which constitutes just under half of the total per pupil expenditures (47% in both 2004-05 and 2005-06). In 2004-05, high schools with the greatest concentrations of poverty (the largest percentage of students enrolled in the federal free and reduced-price lunch program) spent $3,398 per pupil on regular classroom instruction, while high schools with the lowest rates of poverty spent $3,151 – an advantage of $247 per pupil. High schools with the highest concentrations of poverty added $110 per pupil for regular instruction in 2005-06, while schools with the lowest rates of poverty added only $72. The greater increase for high-poverty schools resulted in a differential of $285 per pupil for regular instruction over the schools with the lowest percentages of students living in poverty. Thus, the State is not only spending more on high-poverty high schools than on other schools, but it is also increasing the advantage in favor of high-poverty schools. Looking at the average increase for all high schools across the state, from 2004-05 to 2005-06 regular instruction expenditures per pupil rose by 2.5% to $3,353 per pupil. This increase accounts for about 1/3 of the increase in total expenditures per pupil. The “District” category in Table 3.1 may require a note of explanation. As districts make expenditures, most of the expenditures directly allocated to the schools and coded accordingly. However, some expenditures are made at the district level, including salaries, benefits, facilities, and equipment for administrators who handle a variety of functions. These range from overall

NC High School Resource Allocation Study Page 17
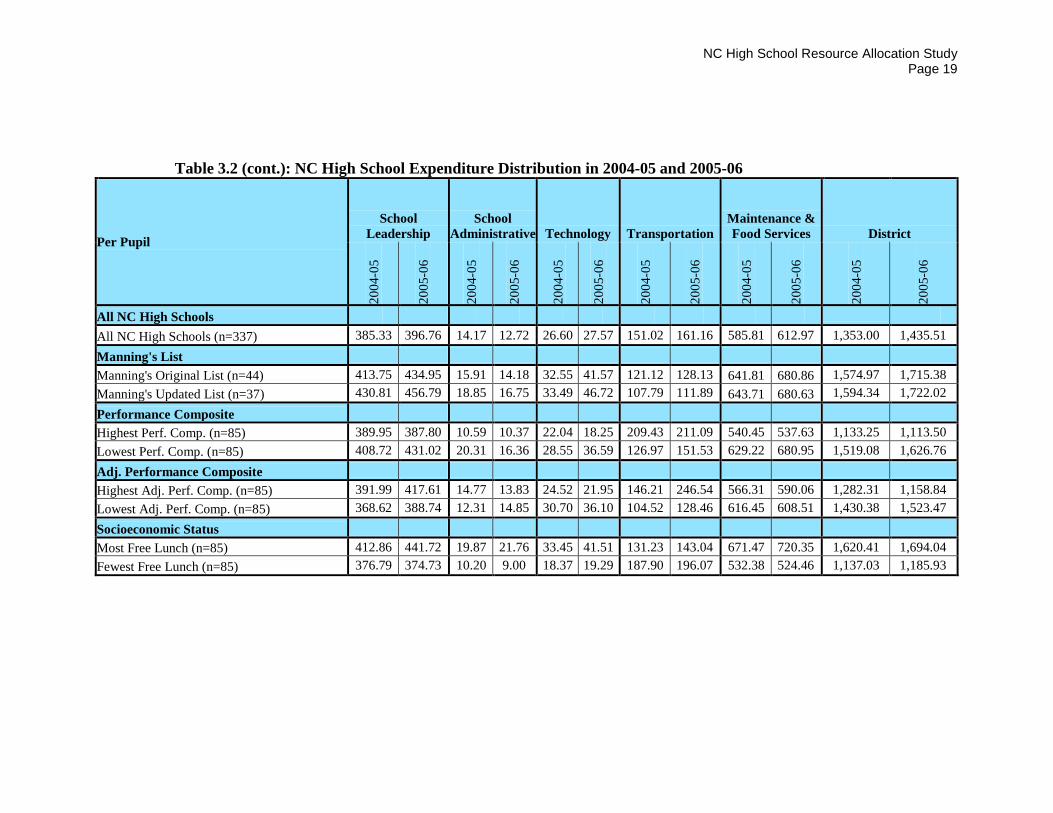
executive leadership to the coordination of curriculum, instruction, assessment, professional development, transportation, payroll, food service, and so on. To accurately compute the actual total expenditures per pupil, we allocated these district level expenditures across schools based on the school’s proportion of the total number of students in the district. District expenditures averaged approximately $1,436 per pupil in 2005-06, or about 20% of the expenditures for high school students. District expenditures allocated to the high schools represented another 1/3 of the increase in total expenditures per pupil from 2004-05 to 2005-06. It is revealing to examine differentials between schools with the highest adjusted performance composite scores and those with the lowest adjusted composites. As detailed in the previous chapter, these differences have adjusted the schools’ performance for differences in their student populations. The schools with the highest adjusted performance composites do spend more for regular instruction, special instruction, school leadership, and transportation. We will examine these apparent differences more systematically later in this chapter. Other expenditure categories do not show particularly revealing differences between schools with high versus low adjusted performance composites.
NC High School Resource Allocation Study Page 18
Table 3.2: NC High School Expenditure Distribution in 2004-05 and 2005-06
Per Pupil Total Regular
Instruction Special
Instruction
Supplemental Education Services
Professional Development for
Instruction Student Services
Other Supporting
Services
2004
-05
2005
-06
2004
-05
2005
-06
2004
-05
2005
-06
2004
-05
2005
-06
2004
-05
2005
-06
2004
-05
2005
-06
2004
-05
2005
-06
All NC High Schools
All NC High Schools (n=337) 6,823.75 7,066.90 3,272.41 3,353.35 566.56 593.77 73.95 61.04 32.71 34.54 299.73 311.77 62.46 65.73 Manning Lists Manning's Original List (n=44) 7,512.20 7,826.81 3,360.36 3,437.17 710.90 762.03 111.21 68.94 49.22 45.86 391.01 397.05 89.40 100.70 Manning's Updated List (n=37) 7,560.34 7,885.12 3,353.16 3,426.01 734.71 794.01 99.28 71.93 55.23 49.20 398.77 405.02 90.21 104.15 Performance Composite Highest Perf. Comp. (n=85) 6,502.33 6,571.96 3,283.03 3,347.85 502.48 521.04 59.62 52.07 22.20 23.23 289.29 296.52 40.00 52.63 Lowest Perf. Comp. (n=85) 7,322.59 7,662.28 3,330.07 3,409.11 688.02 741.38 93.47 67.00 48.84 46.88 348.92 362.45 80.42 92.26 Adj. Performance Composite Highest Adj. Perf. Comp. (n=85) 6,742.10 7,043.33 3,292.66 3,501.52 593.26 631.28 44.88 53.40 30.05 33.90 300.21 318.65 54.93 55.75 Lowest Adj. Perf. Comp. (n=85) 6,924.83 7,118.36 3,257.71 3,310.28 558.96 600.20 111.01 53.46 36.28 34.43 321.02 337.95 76.89 81.91 Socioeconomic Status Most Free Lunch (n=85) 7,585.81 7,929.79 3,398.32 3,508.19 726.38 784.05 86.10 64.52 49.98 50.40 347.30 362.75 88.44 97.47 Fewest Free Lunch (n=85) 6,305.33 6,457.01 3,151.18 3,223.06 474.33 504.41 67.09 49.89 23.03 24.00 278.60 293.03 48.43 53.15
NC High School Resource Allocation Study Page 19
Table 3.2 (cont.): NC High School Expenditure Distribution in 2004-05 and 2005-06
Per Pupil
School Leadership
School Administrative Technology Transportation
Maintenance & Food Services District
2004
-05
2005
-06
2004
-05
2005
-06
2004
-05
2005
-06
2004
-05
2005
-06
2004
-05
2005
-06
2004
-05
2005
-06
All NC High Schools
All NC High Schools (n=337) 385.33 396.76 14.17 12.72 26.60 27.57 151.02 161.16 585.81 612.97 1,353.00 1,435.51 Manning's List Manning's Original List (n=44) 413.75 434.95 15.91 14.18 32.55 41.57 121.12 128.13 641.81 680.86 1,574.97 1,715.38 Manning's Updated List (n=37) 430.81 456.79 18.85 16.75 33.49 46.72 107.79 111.89 643.71 680.63 1,594.34 1,722.02 Performance Composite Highest Perf. Comp. (n=85) 389.95 387.80 10.59 10.37 22.04 18.25 209.43 211.09 540.45 537.63 1,133.25 1,113.50 Lowest Perf. Comp. (n=85) 408.72 431.02 20.31 16.36 28.55 36.59 126.97 151.53 629.22 680.95 1,519.08 1,626.76 Adj. Performance Composite Highest Adj. Perf. Comp. (n=85) 391.99 417.61 14.77 13.83 24.52 21.95 146.21 246.54 566.31 590.06 1,282.31 1,158.84 Lowest Adj. Perf. Comp. (n=85) 368.62 388.74 12.31 14.85 30.70 36.10 104.52 128.46 616.45 608.51 1,430.38 1,523.47 Socioeconomic Status Most Free Lunch (n=85) 412.86 441.72 19.87 21.76 33.45 41.51 131.23 143.04 671.47 720.35 1,620.41 1,694.04 Fewest Free Lunch (n=85) 376.79 374.73 10.20 9.00 18.37 19.29 187.90 196.07 532.38 524.46 1,137.03 1,185.93
NC High School Resource Allocation Study Page 20
Returning to the analytic approach that we used in the second chapter to show the effects of students’ prior skills and other characteristics as well as school composition, we find that expenditures for regular instruction do impact student achievement. After separating out the effects associated with individual student variables, school composition, and other variables, every additional $500 per pupil spent on regular instruction is associated with an increase of nearly ½ point in EOC scores (see Table 3.3). This does not mean that increases in spending on regular classroom instruction would definitely improve students’ scores. Nor does it mean that increasing spending on regular instruction is the only way or the most efficient way to improve student outcomes. Nor does it tell us whether the increase in spending on regular instruction would have to be achieved by increasing total expenditures or by reallocating resources from other categories. But it does provide evidence that an increase in spending on regular instruction in chronically low-performing high schools would be likely to improve EOC scores in the schools. We also have a rough estimate of how much improvement could be expected. To get a sense of how meaningful the potential EOC score improvement is, consider that the difference between average EOC scores in the state’s highest-performing and lowest-performing high schools is about 5 points. By spending $1,000 per pupil more on regular instruction, the lowest-performing schools could probably reduce that gap by about 1 point, or one fifth of the difference between the averages for high-performing versus low-performing NC high schools. When we substitute total per pupil expenditures for regular instruction expenditures per pupil, we find that more spending is related to higher EOC scores, but the relationship is much weaker. To be more precise, every additional $500 in spending on total per pupil expenditures is related to 6/100ths of one point increase in EOC scores. Thus, it seems wise for districts to concentrate additional funds on regular instruction in order to increase high school achievement.

NC High School Resource Allocation Study Page 21
Table 3.3: Effects of Student Background, School Composition, and Expenditure Variables on NC High School Student Achievement
Controlling for Teacher Quality Variables and Differences across EOC Tests (2004-05 and 2005-06)
Coefficient9 School Expenditure Variables
Expenditures Per Pupil: Regular Instruction 0.4381* Individual Student Variables
Eligible for Free Lunch -0.8388* Eligible for Reduced-Price Lunch -0.5065* African American -1.6317* Hispanic -1.0628* Native American/American Indian -1.1532* Other Minority 0.0708* Identified as Disabled -2.0464* 8th Grade Mathematics Score 5.3483* 8th Grade Reading Score 0.7730*
School Composition Variables Average 8th Grade Mathematics Scores 0.6154* Average 8th Grade Reading Scores 0.1550* Percent Receiving Free Lunch -0.3610* Percent Receiving Reduced-Price Lunch -0.5674* Percent African American -1.0971* Percent Hispanic 0.0984 Percent Native American/American Indian -0.1982* Percent Other Minority -0.3835* Percent Identified as Disabled -2.0215*
In addition to expenditures for regular instruction, we investigated the extent to which other types of expenditures relate systematically to student achievement in the state’s high schools. To examine these relationships, we added several categories of expenditures to the model along with regular instruction expenditures. The results are revealing. On a per pupil basis, district expenditures, transportation expenditures, and special instruction, which includes gifted and special education, are positively and significantly related to higher EOC scores, all other things being equal. However, their effects are considerably smaller than the effects of expenditures for regular instruction. In contrast, per pupil expenditures for student services and supplementary instruction are negatively and significantly related to EOC scores. Spending on supplementary instruction declined in 2005-06, perhaps acknowledging the lack of positive effects of spending on these programs. Expenditures per pupil for school leadership did not have a significant effect on student EOC scores. It is important to keep in mind that these relationships are systematic but not necessarily causal. That is, more funding for supplementary instruction or student services will not necessarily reduce student achievement. In the case of student services it is possible that the finding actually 9 Values that are bolded and marked with an * indicate that the variable is significant.

NC High School Resource Allocation Study Page 22
indicates that schools with problems in maintaining a safe and orderly environment spend more money on student services, even after accounting for the effects associated with student composition. Perhaps the negative relationship is a result of higher spending in this area intended to deal with disruptive students. However, it could be that improving orderliness and discipline in the school rather than spending more on student services would be more cost effective. Higher spending on supplemental education programs could be a similar situation, in that schools with performance problems may have increased spending on supplementary program such as after school tutoring, Saturday make-up classes, or summer school remediation. If so, it appears that on average these programs are ineffective at improving performance and that any additional funds available may be better spent in other expenditure categories, such as regular instruction. We attempted a more sophisticated analysis in an effort to develop a better understanding of the effects of expenditures in the categories of student services and supplemental education services, but the results were inconclusive. The positive effects of transportation expenditures on student achievement were somewhat surprising. Several explanations were offered by school personnel during school visits, but they cannot be confirmed or dismissed based on our quantitative analyses. Some interviewees said that funding for transportation allowed students to stay late for tutoring and to attend supplementary instruction in the summer or on weekends. It may be that in many districts the potential effects of expending more resources on supplementary instruction were undermined by a lack of transportation. Alternatively, the positive effects of transportation spending may result from the use of busing in some districts to reduce the concentrations of high-poverty and low-performing students in their schools or to provide greater parental choice of schools. In conclusion, our analysis of school expenditure data indicates that financial resources do matter, and how those resources are expended matter. Resources make a contribution above and beyond any improvements in common measures of teacher quality that extra expenditures may facilitate. Expenditures for regular instruction seem to have the largest effect on student performance. Per pupil spending in special instruction, transportation, and the district expenditures were also related to higher levels of student performance. Of course, since the majority of spending in two of these categories is for teachers’ compensation (salary and benefits), most of the additional financial resources are going to teachers, perhaps in the form of local supplements, and perhaps rewarding good teachers that have unmeasured or “intangible” qualities that make them good teachers. In the next chapter, we explore teacher quality in more depth, including access to higher quality teachers and the characteristics of teachers that most affect student achievement in North Carolina high schools.
NC High School Resource Allocation Study Page 23
CHAPTER 4: TEACHER QUALITY In the previous chapter, we focused on the effects of financial expenditures, independent of the effects of other variables, including the measured quality of teachers in a school and of student demographics. In this chapter we bring teacher quality and its effects into the foreground and push financial expenditures and student demographics into the background. Of course, what really matters is not precisely the quality of teachers in a school, but the quality of teaching. Yet prior research has shown that it is both difficult to define and expensive to measure the actual quality of teaching in classrooms. To measure the actual quality of teaching would involve sending a large cadre of highly trained observers into a sizable sample of classrooms. Most researchers have settled for more readily available measures of teacher quality, such as the nature and extent of a teacher’s formal preparation, degrees earned, years of experience, level of certification, and the like. Although findings have varied across the many prior studies involving these characteristics, some studies have found each of them related to student learning. Following this approach, we have assembled and used data on eleven different indicators of teacher quality. These variables fall into three categories: teachers’ education, licensure or certification status, and years of experience. Table 4.1 below displays figures on selected variables from each of these categories. The teacher education category includes the percentage of teachers in a school who have earned at least a master’s degree and the percentage who earned their bachelor’s degree from an undergraduate institution rated as “most competitive” or “highly competitive” on the Barron College Quality Scale. The licensure category includes the percentage of teachers with a provisional, emergency, or temporary license; the percentage with a lateral entry license; and the percentage who have earned certification by the National Board for Professional Teaching Standards. The experience category shows the percentage of teachers in their first year of teaching and the percentage with more than three years of experience. We also present information on teacher turnover rates and average class sizes in the 337 high schools included in this study. To estimate the impact of teacher quality, we used the average figures for all teachers in a given school. For some variables the “average” was actually a percentage – for example, the percentage of teachers in their first year of teaching. It is extremely important to understand that our findings on the impact of teacher quality variables concern the effects of the overall composition of the faculty, not the effects of individual teachers’ characteristics. Table 4.1 displays the teacher quality characteristics of teachers in Judge Manning’s original 44 chronically underperforming high schools and the 37 of those schools that remained on the underperforming list in 2005-06. For comparison purposes, the table also includes the same information for all NC high schools, for the NC high schools with the highest and lowest performance composites, for NC high schools with the highest and lowest adjusted performance composites, and for the NC high schools with the highest and lowest percentages of students participating in the federal free or reduced-priced lunch program.
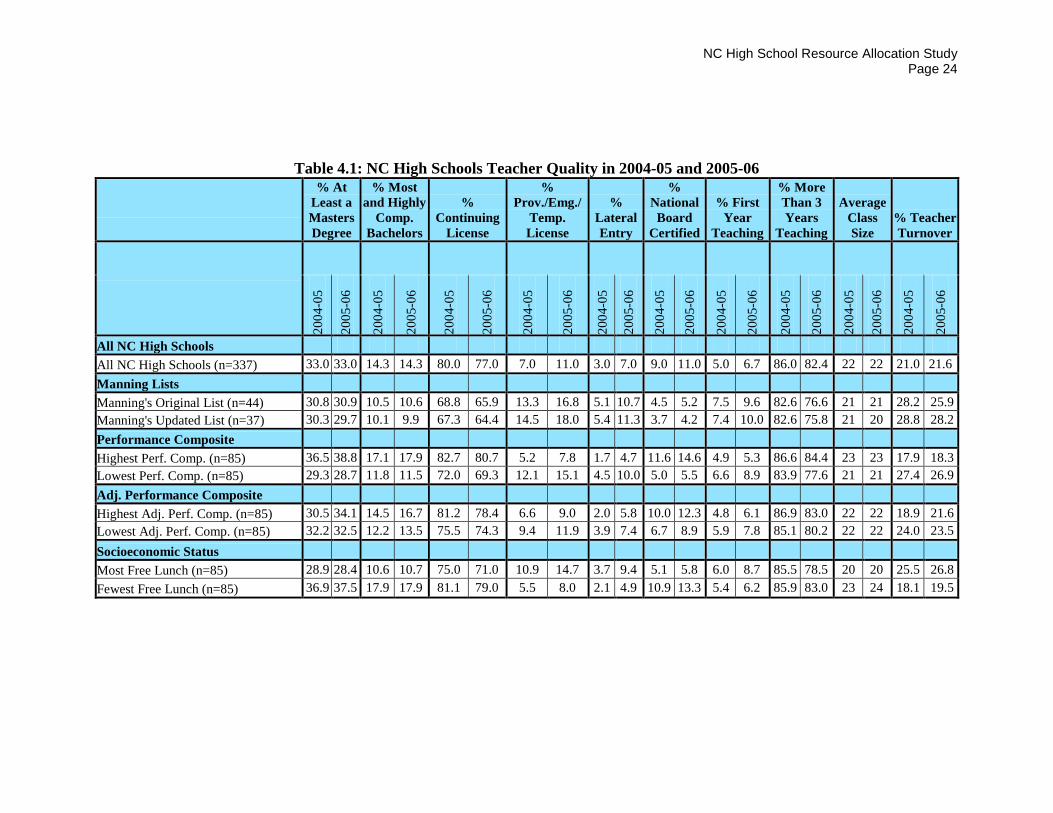
NC High School Resource Allocation Study Page 24
Table 4.1: NC High Schools Teacher Quality in 2004-05 and 2005-06
% At Least a Masters Degree
% Most and Highly
Comp. Bachelors
% Continuing
License
% Prov./Emg./
Temp. License
% Lateral Entry
% National Board
Certified
% First Year
Teaching
% More Than 3 Years
Teaching
Average Class Size
% Teacher Turnover
2004
-05
2005
-06
2004
-05
2005
-06
2004
-05
2005
-06
2004
-05
2005
-06
2004
-05
2005
-06
2004
-05
2005
-06
2004
-05
2005
-06
2004
-05
2005
-06
2004
-05
2005
-06
2004
-05
2005
-06
All NC High Schools
All NC High Schools (n=337) 33.0 33.0 14.3 14.3 80.0 77.0 7.0 11.0 3.0 7.0 9.0 11.0 5.0 6.7 86.0 82.4 22 22 21.0 21.6 Manning Lists Manning's Original List (n=44) 30.8 30.9 10.5 10.6 68.8 65.9 13.3 16.8 5.1 10.7 4.5 5.2 7.5 9.6 82.6 76.6 21 21 28.2 25.9 Manning's Updated List (n=37) 30.3 29.7 10.1 9.9 67.3 64.4 14.5 18.0 5.4 11.3 3.7 4.2 7.4 10.0 82.6 75.8 21 20 28.8 28.2 Performance Composite Highest Perf. Comp. (n=85) 36.5 38.8 17.1 17.9 82.7 80.7 5.2 7.8 1.7 4.7 11.6 14.6 4.9 5.3 86.6 84.4 23 23 17.9 18.3 Lowest Perf. Comp. (n=85) 29.3 28.7 11.8 11.5 72.0 69.3 12.1 15.1 4.5 10.0 5.0 5.5 6.6 8.9 83.9 77.6 21 21 27.4 26.9 Adj. Performance Composite Highest Adj. Perf. Comp. (n=85) 30.5 34.1 14.5 16.7 81.2 78.4 6.6 9.0 2.0 5.8 10.0 12.3 4.8 6.1 86.9 83.0 22 22 18.9 21.6 Lowest Adj. Perf. Comp. (n=85) 32.2 32.5 12.2 13.5 75.5 74.3 9.4 11.9 3.9 7.4 6.7 8.9 5.9 7.8 85.1 80.2 22 22 24.0 23.5 Socioeconomic Status Most Free Lunch (n=85) 28.9 28.4 10.6 10.7 75.0 71.0 10.9 14.7 3.7 9.4 5.1 5.8 6.0 8.7 85.5 78.5 20 20 25.5 26.8 Fewest Free Lunch (n=85) 36.9 37.5 17.9 17.9 81.1 79.0 5.5 8.0 2.1 4.9 10.9 13.3 5.4 6.2 85.9 83.0 23 24 18.1 19.5
NC High School Resource Allocation Study Page 25
As seen above, in both 2004-05 and 2005-06, compared with the average NC high school, the chronically underperforming high schools had slightly fewer teachers with a Master’s degree and teachers with a bachelor’s degree from the most highly competitive institutions. These differences were still wider when Manning’s chronically low-performing high schools were compared to the highest performing quarter of all NC high schools. The gaps were also large in the percentage of teachers with a continuing license. Further, low-performing and high-poverty high schools had substantially more teachers with provisional, emergency, or temporary licenses and teachers who were entering teaching via the “lateral entry” route from other professions. These schools had smaller percentages of National Board Certified Teachers as well. Additionally, the chronically low-performing schools had more teachers in their first year of teaching and fewer teachers with more than three years of teaching experience. Finally, the chronically low-performing high schools lost over a quarter of their teachers in each of the two years examined. When looking at Table 4.1, it is clear that higher quality teachers and higher performance go hand-in-hand and that lower teacher quality and low performance also go together. Prior research indicates that teachers with better credentials tend to migrate to schools with fewer minorities and higher performing students. Some research also indicates that schools with more low-skilled students tend to substitute reduced class size for higher quality teachers, in part because these schools have difficulty recruiting teachers with better credentials and lose more teachers each year. Below, we turn to a more detailed quantitative analysis of the teacher quality effects suggested by the patterns in Table 4.1. We investigated the extent to which teacher quality variables accounted for these achievement differences. To address this question, we included the following set of teacher quality variables in our quantitative analyses, displayed in Table 4.2: the percentage of lateral entry teachers in each school, the percentage of temporarily licensed teachers in each school, the percentage of provisionally licensed teachers in each school, the percentage of teachers with advanced degrees, the percentage of teachers with BAs from the most highly competitive institutions, the percentage of teachers with National Board Certification, and the percentage of teachers with several different levels of experience.
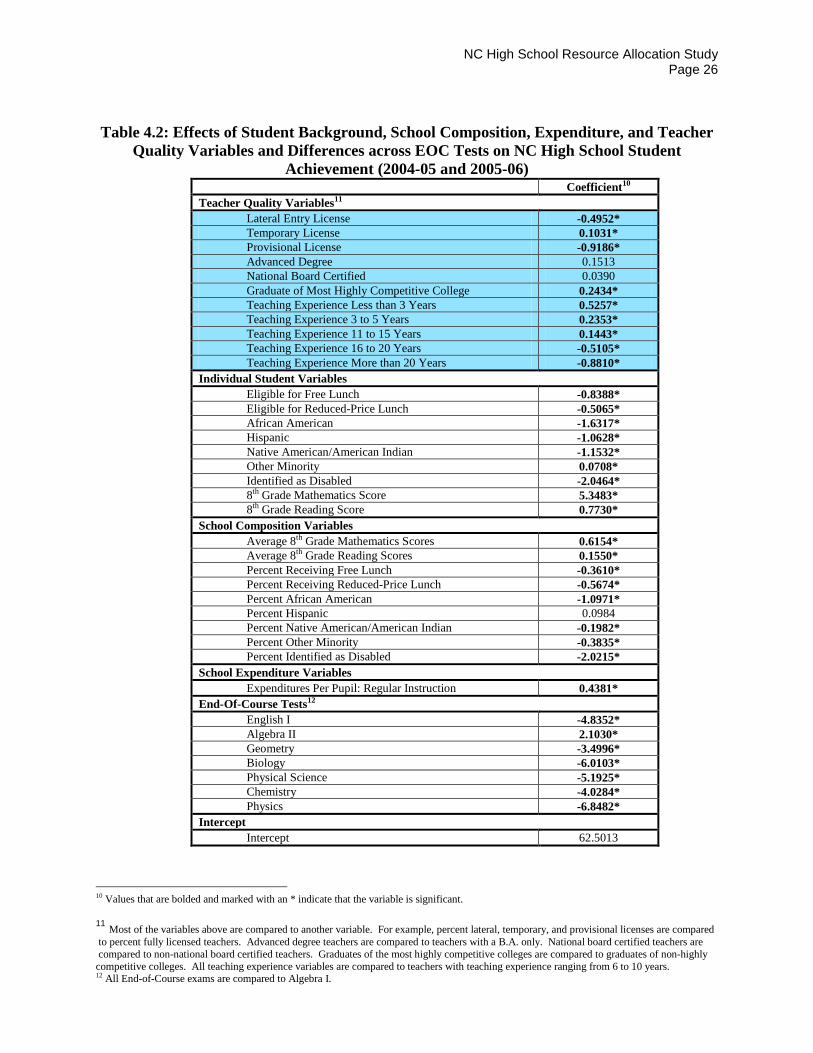
NC High School Resource Allocation Study Page 26
Table 4.2: Effects of Student Background, School Composition, Expenditure, and Teacher Quality Variables and Differences across EOC Tests on NC High School Student
Achievement (2004-05 and 2005-06)
10 Values that are bolded and marked with an * indicate that the variable is significant. 11 Most of the variables above are compared to another variable. For example, percent lateral, temporary, and provisional licenses are compared to percent fully licensed teachers. Advanced degree teachers are compared to teachers with a B.A. only. National board certified teachers are compared to non-national board certified teachers. Graduates of the most highly competitive colleges are compared to graduates of non-highly competitive colleges. All teaching experience variables are compared to teachers with teaching experience ranging from 6 to 10 years. 12 All End-of-Course exams are compared to Algebra I.
Coefficient10 Teacher Quality Variables11
Lateral Entry License -0.4952* Temporary License 0.1031* Provisional License -0.9186* Advanced Degree 0.1513 National Board Certified 0.0390 Graduate of Most Highly Competitive College 0.2434* Teaching Experience Less than 3 Years 0.5257* Teaching Experience 3 to 5 Years 0.2353* Teaching Experience 11 to 15 Years 0.1443* Teaching Experience 16 to 20 Years -0.5105* Teaching Experience More than 20 Years -0.8810*
Individual Student Variables Eligible for Free Lunch -0.8388* Eligible for Reduced-Price Lunch -0.5065* African American -1.6317* Hispanic -1.0628* Native American/American Indian -1.1532* Other Minority 0.0708* Identified as Disabled -2.0464* 8th Grade Mathematics Score 5.3483* 8th Grade Reading Score 0.7730*
School Composition Variables Average 8th Grade Mathematics Scores 0.6154* Average 8th Grade Reading Scores 0.1550* Percent Receiving Free Lunch -0.3610* Percent Receiving Reduced-Price Lunch -0.5674* Percent African American -1.0971* Percent Hispanic 0.0984 Percent Native American/American Indian -0.1982* Percent Other Minority -0.3835* Percent Identified as Disabled -2.0215*
School Expenditure Variables Expenditures Per Pupil: Regular Instruction 0.4381*
End-Of-Course Tests12 English I -4.8352* Algebra II 2.1030* Geometry -3.4996* Biology -6.0103* Physical Science -5.1925* Chemistry -4.0284* Physics -6.8482*
Intercept Intercept 62.5013
NC High School Resource Allocation Study Page 27
The analysis indicates that scores on the EOC exams were lower in schools with higher proportions of lateral entry teachers, provisionally licensed teachers, and teachers with more than 16 years of experience, holding all other factors in the models constant. A single percentage point increase in lateral entry teachers was associated with a two point drop in EOC scores. Perhaps surprisingly, a percentage point increase in teachers with over 20 years of experience was associated with a 3 point drop in EOC scores, holding all other factors in the model constant. At least two possible factors may explain this unexpected finding. Our field interviews indicated that teachers with many years of experience before the ABCs accountability system was instituted tended to respond less favorably to accountability pressures than did teachers newer to the profession. When there are sizable numbers of highly experienced teachers in a school, they may be more prone to resist accountability-based improvement efforts. Another possibility is that more experienced teachers have not kept up with developments in science and mathematics and methods of instruction in these subjects, which are the primary subjects tested in the EOC exams. In any event, we should stress that these findings are based on the overall percentage of highly experienced teachers in a school, not on data linking individual highly experienced teachers to performance by individual students. These results should not be interpreted to suggest that more experienced teachers are less effective in their classrooms. Additional reports forthcoming in 2008 will assess the experience-outcomes relationship in much greater depth. Schools with more teachers who graduated from the most highly competitive colleges and those with higher percentages of teachers with less than sixteen years of experience had higher EOC exam scores, all other things being equal. It is difficult to separate out the effect of the individual who had to perform well to gain admission to the most highly competitive colleges from the effect of the college education that they received, but a percentage point increase in teachers from the most highly competitive colleges was associated with 2/3 of a point increase in EOC scores. Teacher turnover was too closely related to other characteristics of the schools to separate its relationship to student achievement from the effects of other factors.
Conclusion
The composition of the faculty at North Carolina high schools differs substantially from school to school. On average, higher quality teachers work in higher performing schools with lower levels of poverty. This situation is similar to that in many other states, according to other research on teacher labor markets. The findings in this chapter also show that the composition of the school faculty makes a difference – higher average quality relates to higher average performance. Perhaps, most surprisingly, the faculties with more teachers who have taught for 16 or more years are less effective. This may reflect negative responses to accountability, outdated knowledge of subject matter or subject matter-specific instructional techniques, or other variables that we have not yet identified. It does not mean that individual teachers with more experience are less effective. We have only addressed the effects of the overall composition of the faculty at North Carolina’s high schools, not the effects of individuals with those characteristics. We are planning to report on the effects of individual teachers with specific characteristics in subsequent studies.

NC High School Resource Allocation Study Page 28
In general, average class sizes did not vary a great deal across NC high schools. Class sizes averaged about 22 students per class in the EOC classes, were slightly lower in high-poverty schools (20), and were slightly higher in schools with the fewest low-income students (24). Variation within such a small range of average class sizes did not exert an appreciable effect on EOC scores.

NC High School Resource Allocation Study Page 29
CHAPTER 5: KEY LEADERSHIP AND ORGANIZATIONAL PRACTICES In the previous chapters, we have shown that the resources that matter most, in terms of high school performance, are the skills that the students bring with them to high school. In addition, the expenditures for regular instruction, special instruction, transportation, and district level expenditures have positive and direct relationships with student achievement. The composition of the faculty in high schools matters significantly as well. Yet even taken together, these factors do not explain all of the variation in EOC performance across North Carolina’s high schools. Both education policy makers and the courts frequently point to school leadership as a major factor shaping school performance, and improving leadership has become the focus of many high school reform efforts. In this chapter, we present the findings about leadership and associated organizational behaviors that we gathered from our visits to 18 strategically selected North Carolina high schools. As we noted in the first chapter, one source of motivation for this study was accountability. The State’s investment in public education has substantially increased in recent years. The Governor and State Board of Education commissioned this study to assess whether current expenditures in the state’s high schools relate to improved results. In addition, the study was to determine how resources are being used in the state’s high schools and whether the chronically low-performing schools were experiencing limitations in funding or other barriers in using funds to increase student success. Therefore, an objective of this part of the study was to identify differences in principals’ leadership and associated organizational variables that may explain the variation in student achievement across the state. It is impossible to determine which practices or resource use patterns are effective by visiting only persistently low-performing schools. To examine these factors in the state’s high schools, we contrasted four groups of schools:
1. Chronically Low Performing or Priority schools (LP-Priority) 2. High schools with challenging student populations that “beat the odds” and performed
better than their demographics would predict (BTO) 3. High schools that improved their performance composite sufficiently to get off the low-
performing list in 2005-06 (Improved) 4. A small group of the state’s highest performing high schools (HP).
The chronically low-performing high schools were the 37 schools that appeared and remained on the list set forth by Judge Manning. While we interviewed principals and observed practices in as many of these schools as we could gain permission to visit during the 2006-07 academic year, we conducted more extensive interviews in eight of the persistently Low Performing or Priority Schools (LP-Priority schools), five schools that were “Beating the Odds”, two Improved schools and three High Performing schools. We selected the schools based on the following reasoning: LP-Priority, BTO, and Improved schools all served similarly difficult-to-educate student populations. So the differences in performance across these groups probably result from other variables, perhaps including expenditures and teacher quality but also including leadership, and organizational variables. By
NC High School Resource Allocation Study Page 30
interviewing the principals and teachers in these schools, we sought to identify (1) what the principals were doing differently in these groups of schools, (2) what impact they were having on the schools as organizations, and (3) how the organizational differences affected student performance. The fourth and final set of schools that we visited included three of the highest performing schools in the state, without regard to their student demographics. We reasoned that even though these schools would be very different from the others demographically, the contrasts between leadership and organizational behaviors in these schools and the other schools we studied might be sharp and informative. However, as we shall point out, it may well be the student demographics and support of parents that make for high performance in at least two of these schools, not their leadership and associated organizational practices. For a more detailed presentation of the findings in this section, please refer to the companion report, Leadership, Organizational Characteristics, and Performance in NC High Schools.
Demographics, Financial Expenditures, Teacher Quality in the Selected Schools To assess the potential impact of demographics, school expenditures and teacher quality on student performance in these four groups of schools, we analyzed the factors found to explain differences in student achievement in the previous chapters. Table 5.1 below presents the composition of the student populations of the 18 schools included in this portion of our study, featuring for each school a measure of school poverty (the percentage of students receiving free or reduced-price lunch), the percentages of three ethnic groups, students’ prior achievement (mean scores on 8th grade EOG Mathematics and Reading tests), and the school’s Performance Composite. The data presented in Table 5.1 make it clear that the average NC high school and the HP schools had lower percentages of ethnic minorities and served students who had higher levels of prior achievement and lower levels of poverty than the LP-Priority and BTO-Improved schools. For example, the mean 8th grade mathematics score was 7 points higher in the average high school in NC than in the LP-Priority schools and 12 points higher in the HP schools than in the LP-Priority schools. Our goal in selecting the BTO and Improved schools was to find schools that were demographically similar to the LP-Priority schools but were either performing better than the demographics would predict (BTO) or had recently improved their performance (Improved). Except for small differences, the BTO and Improved schools were indeed similar to the LP-Priority schools. As shown in Table 5.1, the BTO-Improved schools had slightly less poverty and lower percentages of African-American students but higher percentages of Hispanic and Native American/American Indian students than the LP-Priority Schools. However, their prior achievement levels– including both mean 8th grade mathematics and reading EOG scores –were very similar to those in the LP-Priority schools. Recall that we established in chapter two that prior achievement levels were the most powerful predictors of EOC scores. Thus it is significant that even though the prior achievement was nearly equal and the other demographics were similar, the performance composites (EOC passing rates) for the two sets of schools are 17 points apart– 47.4 for the LP-Priority and 64.4 for the BTO-Improved high schools in 2005-06.
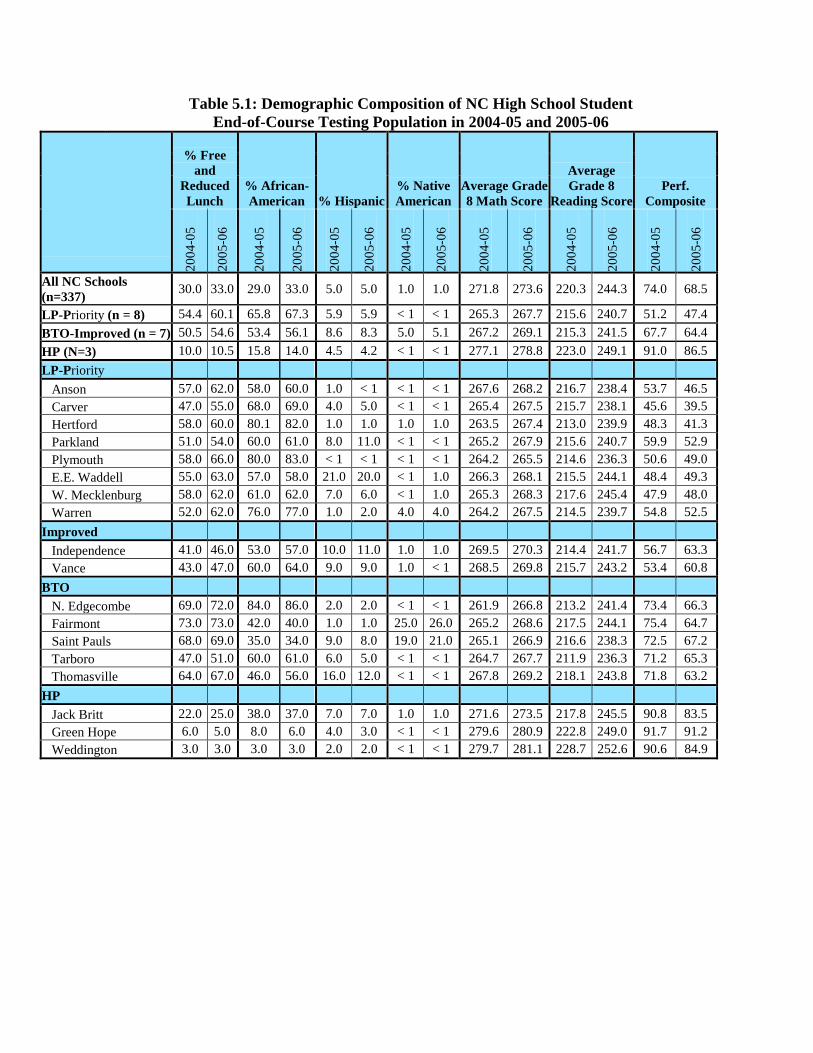
Table 5.1: Demographic Composition of NC High School Student End-of-Course Testing Population in 2004-05 and 2005-06
% Free and
Reduced Lunch
% African-American % Hispanic
% Native American
Average Grade 8 Math Score
Average Grade 8
Reading Score Perf.
Composite 20
04-0
5
2005
-06
2004
-05
2005
-06
2004
-05
2005
-06
2004
-05
2005
-06
2004
-05
2005
-06
2004
-05
2005
-06
2004
-05
2005
-06
All NC Schools (n=337) 30.0 33.0 29.0 33.0 5.0 5.0 1.0 1.0 271.8 273.6 220.3 244.3 74.0 68.5
LP-Priority (n = 8) 54.4 60.1 65.8 67.3 5.9 5.9 < 1 < 1 265.3 267.7 215.6 240.7 51.2 47.4 BTO-Improved (n = 7) 50.5 54.6 53.4 56.1 8.6 8.3 5.0 5.1 267.2 269.1 215.3 241.5 67.7 64.4 HP (N=3) 10.0 10.5 15.8 14.0 4.5 4.2 < 1 < 1 277.1 278.8 223.0 249.1 91.0 86.5 LP-Priority Anson 57.0 62.0 58.0 60.0 1.0 < 1 < 1 < 1 267.6 268.2 216.7 238.4 53.7 46.5 Carver 47.0 55.0 68.0 69.0 4.0 5.0 < 1 < 1 265.4 267.5 215.7 238.1 45.6 39.5 Hertford 58.0 60.0 80.1 82.0 1.0 1.0 1.0 1.0 263.5 267.4 213.0 239.9 48.3 41.3 Parkland 51.0 54.0 60.0 61.0 8.0 11.0 < 1 < 1 265.2 267.9 215.6 240.7 59.9 52.9 Plymouth 58.0 66.0 80.0 83.0 < 1 < 1 < 1 < 1 264.2 265.5 214.6 236.3 50.6 49.0 E.E. Waddell 55.0 63.0 57.0 58.0 21.0 20.0 < 1 1.0 266.3 268.1 215.5 244.1 48.4 49.3 W. Mecklenburg 58.0 62.0 61.0 62.0 7.0 6.0 < 1 1.0 265.3 268.3 217.6 245.4 47.9 48.0 Warren 52.0 62.0 76.0 77.0 1.0 2.0 4.0 4.0 264.2 267.5 214.5 239.7 54.8 52.5 Improved Independence 41.0 46.0 53.0 57.0 10.0 11.0 1.0 1.0 269.5 270.3 214.4 241.7 56.7 63.3 Vance 43.0 47.0 60.0 64.0 9.0 9.0 1.0 < 1 268.5 269.8 215.7 243.2 53.4 60.8 BTO N. Edgecombe 69.0 72.0 84.0 86.0 2.0 2.0 < 1 < 1 261.9 266.8 213.2 241.4 73.4 66.3 Fairmont 73.0 73.0 42.0 40.0 1.0 1.0 25.0 26.0 265.2 268.6 217.5 244.1 75.4 64.7 Saint Pauls 68.0 69.0 35.0 34.0 9.0 8.0 19.0 21.0 265.1 266.9 216.6 238.3 72.5 67.2 Tarboro 47.0 51.0 60.0 61.0 6.0 5.0 < 1 < 1 264.7 267.7 211.9 236.3 71.2 65.3 Thomasville 64.0 67.0 46.0 56.0 16.0 12.0 < 1 < 1 267.8 269.2 218.1 243.8 71.8 63.2 HP Jack Britt 22.0 25.0 38.0 37.0 7.0 7.0 1.0 1.0 271.6 273.5 217.8 245.5 90.8 83.5 Green Hope 6.0 5.0 8.0 6.0 4.0 3.0 < 1 < 1 279.6 280.9 222.8 249.0 91.7 91.2 Weddington 3.0 3.0 3.0 3.0 2.0 2.0 < 1 < 1 279.7 281.1 228.7 252.6 90.6 84.9

NC High School Resource Allocation Study
Page 32
As we see in Table 5.2, in 2005-06 both LP-Priority and BTO-Improved schools spent more for regular instruction per pupil than the average NC high school ($3,353) and more than the average of our three High-Performing schools ($2886). The gaps were greater for total expenditures per pupil, with the LP-Priority schools spending more than the BTO-Improved schools overall, primarily because of additional expenditures for special instruction. In 2004-05, the eight LP-Priority schools spent about $128 more per pupil for regular instruction than the BTO-Improved schools. But the relationship was reversed in 2005-06, when the BTO-Improved schools spent about $134 more per pupil for regular instruction. Given the mixed results across the two years, it would be difficult to attribute much of the performance advantage in BTO schools to expenditure differences, but some of the year-to-year performance gains in Improved schools may have resulted from the increase in expenditures for regular instruction.
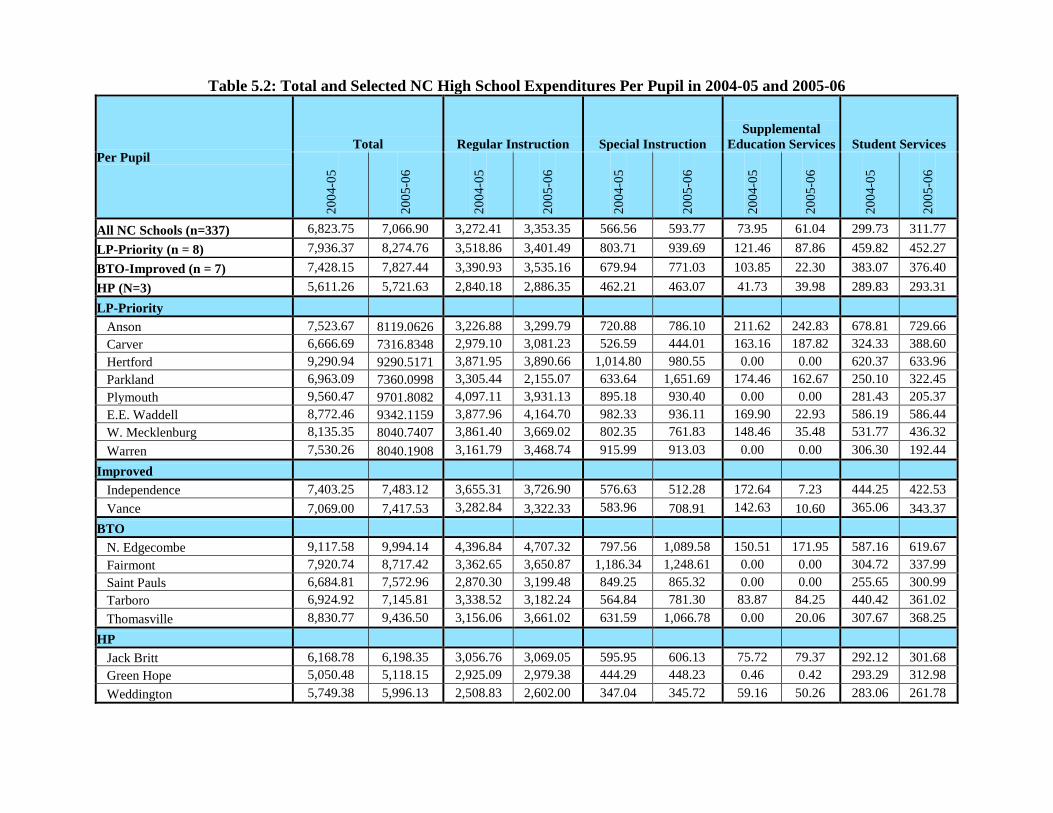
Table 5.2: Total and Selected NC High School Expenditures Per Pupil in 2004-05 and 2005-06
Per Pupil Total Regular Instruction Special Instruction
Supplemental Education Services Student Services
200
4-05
200
5-06
200
4-05
200
5-06
200
4-05
200
5-06
200
4-05
200
5-06
200
4-05
200
5-06
All NC Schools (n=337) 6,823.75 7,066.90 3,272.41 3,353.35 566.56 593.77 73.95 61.04 299.73 311.77 LP-Priority (n = 8) 7,936.37 8,274.76 3,518.86 3,401.49 803.71 939.69 121.46 87.86 459.82 452.27 BTO-Improved (n = 7) 7,428.15 7,827.44 3,390.93 3,535.16 679.94 771.03 103.85 22.30 383.07 376.40 HP (N=3) 5,611.26 5,721.63 2,840.18 2,886.35 462.21 463.07 41.73 39.98 289.83 293.31 LP-Priority Anson 7,523.67 8119.0626 3,226.88 3,299.79 720.88 786.10 211.62 242.83 678.81 729.66 Carver 6,666.69 7316.8348 2,979.10 3,081.23 526.59 444.01 163.16 187.82 324.33 388.60 Hertford 9,290.94 9290.5171 3,871.95 3,890.66 1,014.80 980.55 0.00 0.00 620.37 633.96 Parkland 6,963.09 7360.0998 3,305.44 2,155.07 633.64 1,651.69 174.46 162.67 250.10 322.45 Plymouth 9,560.47 9701.8082 4,097.11 3,931.13 895.18 930.40 0.00 0.00 281.43 205.37 E.E. Waddell 8,772.46 9342.1159 3,877.96 4,164.70 982.33 936.11 169.90 22.93 586.19 586.44 W. Mecklenburg 8,135.35 8040.7407 3,861.40 3,669.02 802.35 761.83 148.46 35.48 531.77 436.32 Warren 7,530.26 8040.1908 3,161.79 3,468.74 915.99 913.03 0.00 0.00 306.30 192.44 Improved Independence 7,403.25 7,483.12 3,655.31 3,726.90 576.63 512.28 172.64 7.23 444.25 422.53 Vance 7,069.00 7,417.53 3,282.84 3,322.33 583.96 708.91 142.63 10.60 365.06 343.37 BTO N. Edgecombe 9,117.58 9,994.14 4,396.84 4,707.32 797.56 1,089.58 150.51 171.95 587.16 619.67 Fairmont 7,920.74 8,717.42 3,362.65 3,650.87 1,186.34 1,248.61 0.00 0.00 304.72 337.99 Saint Pauls 6,684.81 7,572.96 2,870.30 3,199.48 849.25 865.32 0.00 0.00 255.65 300.99 Tarboro 6,924.92 7,145.81 3,338.52 3,182.24 564.84 781.30 83.87 84.25 440.42 361.02 Thomasville 8,830.77 9,436.50 3,156.06 3,661.02 631.59 1,066.78 0.00 20.06 307.67 368.25 HP Jack Britt 6,168.78 6,198.35 3,056.76 3,069.05 595.95 606.13 75.72 79.37 292.12 301.68 Green Hope 5,050.48 5,118.15 2,925.09 2,979.38 444.29 448.23 0.46 0.42 293.29 312.98 Weddington 5,749.38 5,996.13 2,508.83 2,602.00 347.04 345.72 59.16 50.26 283.06 261.78
NC High School Resource Allocation Study Page 34
Turning to teacher quality, as we see in Table 5.3, both the LP-Priority and BTO-Improved schools had fewer teachers who graduated from the most highly competitive colleges, more teachers with lateral entry, emergency or provisional licenses, and fewer National Board Certified teachers than the HP schools or the average NC high school. Teacher turnover was higher in the LP-Priority and BTO-Improved schools as well. Compared with the state average, HP schools had a much lower percentage of teachers with more than 15 years of experience as well as a higher percentage of teachers in the most effective range of 3-15 years. Taken as a whole the trends in teacher quality seem to indicate improvement in the LP-Priority and BTO-Improved schools from 2004-05 to 2005-06, although in some cases they lagged behind the rest of the state. Comparing LP-Priority with BTO-Improved schools, it is not clear whether either set of schools enjoyed a net advantage on teacher quality variables that actually affected student learning. They seem to be insignificantly different when we look at the averages. As we shall see, both principals and teachers in BTO-Improved schools attributed their performance in part to high quality teachers and reported little difficulty in either recruiting or retaining good teachers. In contrast, principals and teachers in LP-Priority schools reported persistent problems in finding high quality teachers to fill vacancies and in retaining them from year to year. From the principals’ perspectives, BTO-Improved schools did have a teacher quality advantage. Moreover, for reasons explained below, BTO-Improved schools did seem to be getting more out of the teachers they had.
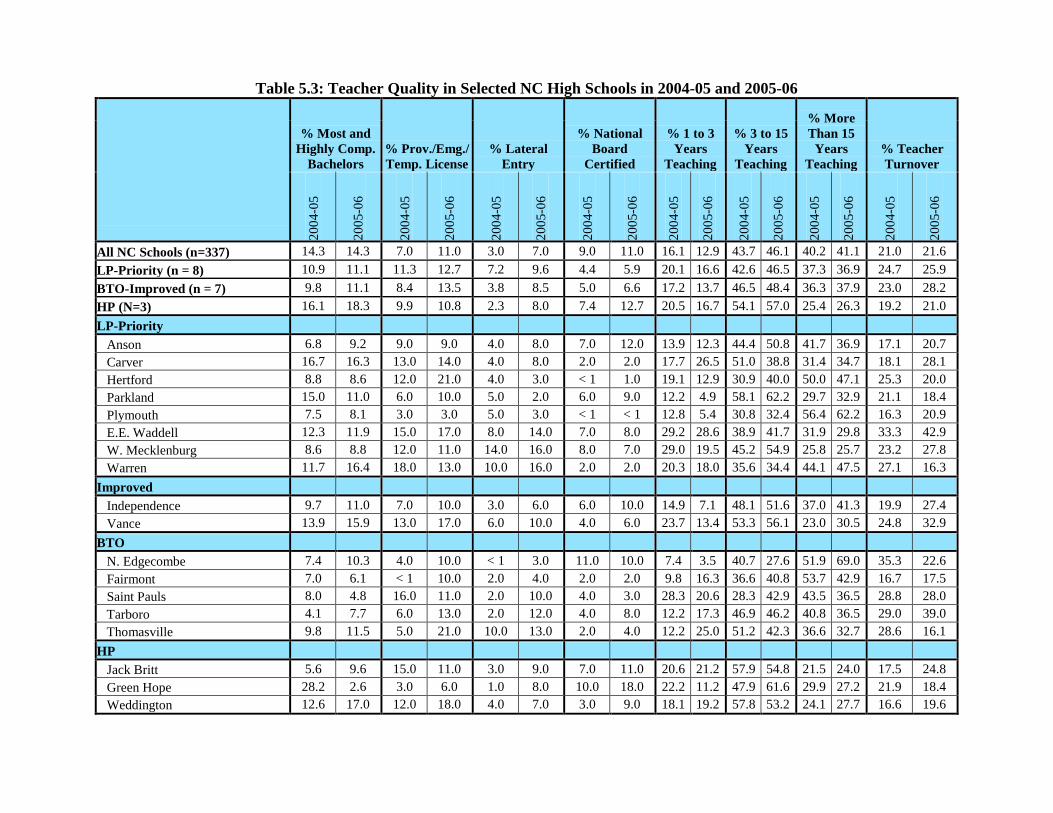
Table 5.3: Teacher Quality in Selected NC High Schools in 2004-05 and 2005-06
% Most and Highly Comp.
Bachelors % Prov./Emg./ Temp. License
% Lateral Entry
% National Board
Certified
% 1 to 3 Years
Teaching
% 3 to 15 Years
Teaching
% More Than 15
Years Teaching
% Teacher Turnover
2004
-05
2005
-06
2004
-05
2005
-06
2004
-05
2005
-06
2004
-05
2005
-06
2004
-05
2005
-06
2004
-05
2005
-06
2004
-05
2005
-06
2004
-05
2005
-06
All NC Schools (n=337) 14.3 14.3 7.0 11.0 3.0 7.0 9.0 11.0 16.1 12.9 43.7 46.1 40.2 41.1 21.0 21.6 LP-Priority (n = 8) 10.9 11.1 11.3 12.7 7.2 9.6 4.4 5.9 20.1 16.6 42.6 46.5 37.3 36.9 24.7 25.9 BTO-Improved (n = 7) 9.8 11.1 8.4 13.5 3.8 8.5 5.0 6.6 17.2 13.7 46.5 48.4 36.3 37.9 23.0 28.2 HP (N=3) 16.1 18.3 9.9 10.8 2.3 8.0 7.4 12.7 20.5 16.7 54.1 57.0 25.4 26.3 19.2 21.0 LP-Priority Anson 6.8 9.2 9.0 9.0 4.0 8.0 7.0 12.0 13.9 12.3 44.4 50.8 41.7 36.9 17.1 20.7 Carver 16.7 16.3 13.0 14.0 4.0 8.0 2.0 2.0 17.7 26.5 51.0 38.8 31.4 34.7 18.1 28.1 Hertford 8.8 8.6 12.0 21.0 4.0 3.0 < 1 1.0 19.1 12.9 30.9 40.0 50.0 47.1 25.3 20.0 Parkland 15.0 11.0 6.0 10.0 5.0 2.0 6.0 9.0 12.2 4.9 58.1 62.2 29.7 32.9 21.1 18.4 Plymouth 7.5 8.1 3.0 3.0 5.0 3.0 < 1 < 1 12.8 5.4 30.8 32.4 56.4 62.2 16.3 20.9 E.E. Waddell 12.3 11.9 15.0 17.0 8.0 14.0 7.0 8.0 29.2 28.6 38.9 41.7 31.9 29.8 33.3 42.9 W. Mecklenburg 8.6 8.8 12.0 11.0 14.0 16.0 8.0 7.0 29.0 19.5 45.2 54.9 25.8 25.7 23.2 27.8 Warren 11.7 16.4 18.0 13.0 10.0 16.0 2.0 2.0 20.3 18.0 35.6 34.4 44.1 47.5 27.1 16.3 Improved Independence 9.7 11.0 7.0 10.0 3.0 6.0 6.0 10.0 14.9 7.1 48.1 51.6 37.0 41.3 19.9 27.4 Vance 13.9 15.9 13.0 17.0 6.0 10.0 4.0 6.0 23.7 13.4 53.3 56.1 23.0 30.5 24.8 32.9 BTO N. Edgecombe 7.4 10.3 4.0 10.0 < 1 3.0 11.0 10.0 7.4 3.5 40.7 27.6 51.9 69.0 35.3 22.6 Fairmont 7.0 6.1 < 1 10.0 2.0 4.0 2.0 2.0 9.8 16.3 36.6 40.8 53.7 42.9 16.7 17.5 Saint Pauls 8.0 4.8 16.0 11.0 2.0 10.0 4.0 3.0 28.3 20.6 28.3 42.9 43.5 36.5 28.8 28.0 Tarboro 4.1 7.7 6.0 13.0 2.0 12.0 4.0 8.0 12.2 17.3 46.9 46.2 40.8 36.5 29.0 39.0 Thomasville 9.8 11.5 5.0 21.0 10.0 13.0 2.0 4.0 12.2 25.0 51.2 42.3 36.6 32.7 28.6 16.1 HP Jack Britt 5.6 9.6 15.0 11.0 3.0 9.0 7.0 11.0 20.6 21.2 57.9 54.8 21.5 24.0 17.5 24.8 Green Hope 28.2 2.6 3.0 6.0 1.0 8.0 10.0 18.0 22.2 11.2 47.9 61.6 29.9 27.2 21.9 18.4 Weddington 12.6 17.0 12.0 18.0 4.0 7.0 3.0 9.0 18.1 19.2 57.8 53.2 24.1 27.7 16.6 19.6

NC High School Resource Allocation Study Page 36
A final revealing comparison among the BTO, Improved, and LP-Priority Schools concerns their ABCs designations, especially the growth component of those designations. In 2004-05, all of the LP-Priority schools in our sample produced Expected Growth (five schools) or High Growth (three schools).In 2005-06, apparently as a result of changes in the ABCs system, three LP-Priority schools fell to Growth Not Achieved, but three made Expected Growth and two made High Growth. Thus, over the two years, the LP-Priority schools met or exceeded the State’s expectations for student learning 80% of the time. From this point of view, it is ironic that they have been found wanting and designated “Low-Performing” or “Priority” schools. In terms of the amount of learning produced in an academic year, the difference between the LP-Priority and the BTO-Improved schools was important but small. During the same two years, the five BTO schools achieved High Growth nine times and Expected Growth once. LP-Priority schools generally met or exceeded expectations with their challenging student populations; BTO schools did still better with similar students. All of the BTO schools achieved the status of School of Progress in both years. However, none achieved a higher status, which reflects the difficulty of making headway against the low levels of skills, high rates of poverty, and other disadvantages that their students brought to high school. Within the limitations of available resources and the challenges of the student populations that they served, the BTO schools often produced learning at the High Growth level but were not able to achieve a performance composite higher than about 75. One High-Performing school demonstrates that with demographics similar to some of the schools on Manning’s list – but somewhat less challenging than the BTO-Improved and LP-Priority schools – it is possible to do far better. In 2005-06, 45% of Jack Britt’s students came from minority ethnic groups (African-American, Hispanic, and Native American/American Indian) – a percentage that is higher than the state average of 39% for the same groups, but substantially lower than the average of 74% for the same groups in LP-Priority schools. Britt’s free and reduced-price lunch percentage was only 22%, lower than the statewide average of 30%. With much less poverty and fewer ethnic minority students, performance for this school was much higher than in the BTO-Improved schools. With a set of leadership practices and organizational characteristics like those of the BTO schools, Britt was able to achieve an Honor School of Excellence designation in 2004-05, to meet High Growth, and to attain a School of Distinction designation in 2005-06. There may be a ceiling on performance for schools with exceptionally challenging student populations, and high schools with high concentrations of poverty and minority students may find it very difficult to break through the ceiling given the current resources available to them.
NC High School Resource Allocation Study Page 37
Methods To obtain the data for this chapter, we interviewed the principals and seven to 10 teachers in each of the 18 schools that we visited. The questions for the interviews were drawn from the best available literature concerning the effects of principal leadership and organizational practices on student performance. The visits occurred between April and the end of June 2007. The information from the interviews was written up by the research team and the findings were drawn from a comparison of the write-ups and from detailed discussions of the similarities and differences that were found in the schools.
Findings The BTO-Improved high schools in our sample shared a distinctive, common profile that contrasted sharply not only with the profile of the Low-Performing schools but also with that of two of the High-Performing schools. As indicated above, one of the three High-Performing schools – Jack Britt – had a more challenging student population than the other two HP schools, and its leadership and organizational characteristics profile resembled that of the BTO-Improved schools. Therefore, we incorporated the findings from Britt into our discussion of the BTO-Improved profile. We hoped that the contrast between the BTO-Improved schools and the LP-Priority schools would reveal leadership and organizational characteristics that could help to explain the higher levels of student performance in the BTO-Improved schools. Therefore, in the sections that follow, we describe the characteristics of the BTO-Improved schools that we believe explain their better than expected performance and then contrast these schools with the LP-Priority and HP schools. The BTO-Improved profile combined well-defined elements of both the will and the capacity to succeed with challenging student populations. In nearly all of the BTO-Improved schools, it was the principal who seemed to drive the development of both will and capacity. The will-related elements included organizational commitment, authoritative accountability leading to internalized and collective responsibility, and resilience. Capacity entailed provision of adequate opportunities and incentives for all students to learn, assured by high quality teachers using certain curricular, instructional, and assessment practices within an orderly and disciplined environment. Before discussing each of these elements in more detail, we emphasize that the profile of BTO-Improved schools does not constitute a checklist of independent items. Rather, this profile is an integrated whole with dynamic relationships among the elements. For example, the bonds of trust and attachment that linked teachers with principals in BTO-Improved schools made it possible for principals to assert strong accountability pressures on teachers both individually and collectively without alienating them, depressing morale, or increasing undesirable turnover. In turn, the combination of organizational commitment and internalized responsibility seemed to make for resilience in the face of adversity. Further, the will to produce high student outcomes drove the implementation of key curricular, instructional, and assessment practices.
NC High School Resource Allocation Study Page 38
Incentives to improve student performance for both teachers and students were found to be extremely important. Because incentives in BTO-Improved schools were focused primarily on student learning outcomes, curricula, instructional, and assessment practices were carried out not in a pro forma, compliance-oriented manner, but were employed mindfully and deliberately as tools in order to get results. The elements of will drove the way elements of capacity were built and employed. In turn, elements of capacity strengthened the will to perform at high levels. For example, the professional learning communities that improved teacher quality and teaching also strengthened accountability. Teachers held each other, as well as themselves, accountable for teaching the Standard Course of Study and for producing high outcomes. Thus, “professional accountability” reinforces the administrative accountability asserted by the principal. It was the joint action of the elements of will and capacity – not the elements in isolation – that seemed to help account for BTO-Improved schools’ success. Figure 5.1captures this schematically.
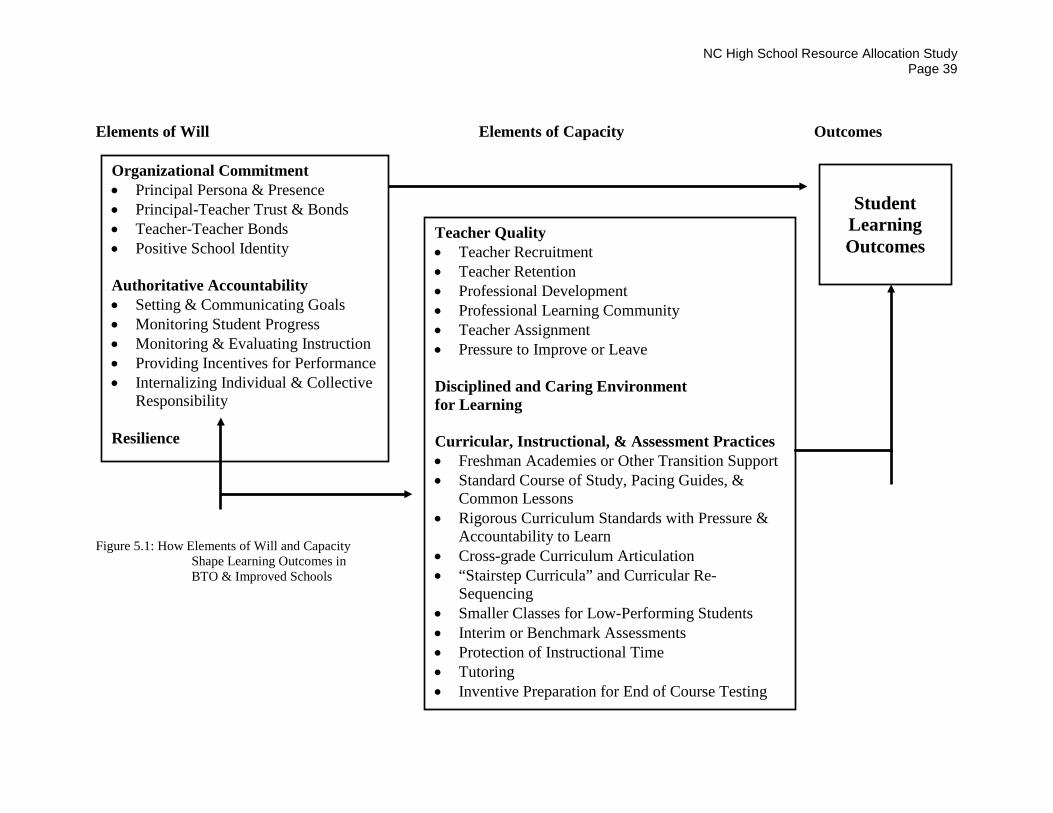
NC High School Resource Allocation Study Page 39
Elements of Will Elements of Capacity Outcomes Figure 5.1: How Elements of Will and Capacity Shape Learning Outcomes in BTO & Improved Schools
Organizational Commitment • Principal Persona & Presence • Principal-Teacher Trust & Bonds • Teacher-Teacher Bonds • Positive School Identity Authoritative Accountability • Setting & Communicating Goals • Monitoring Student Progress • Monitoring & Evaluating Instruction • Providing Incentives for Performance • Internalizing Individual & Collective
Responsibility Resilience
Teacher Quality • Teacher Recruitment • Teacher Retention • Professional Development • Professional Learning Community • Teacher Assignment • Pressure to Improve or Leave Disciplined and Caring Environment for Learning Curricular, Instructional, & Assessment Practices • Freshman Academies or Other Transition Support • Standard Course of Study, Pacing Guides, &
Common Lessons • Rigorous Curriculum Standards with Pressure &
Accountability to Learn • Cross-grade Curriculum Articulation • “Stairstep Curricula” and Curricular Re-
Sequencing • Smaller Classes for Low-Performing Students • Interim or Benchmark Assessments • Protection of Instructional Time • Tutoring • Inventive Preparation for End of Course Testing
Student
Learning Outcomes
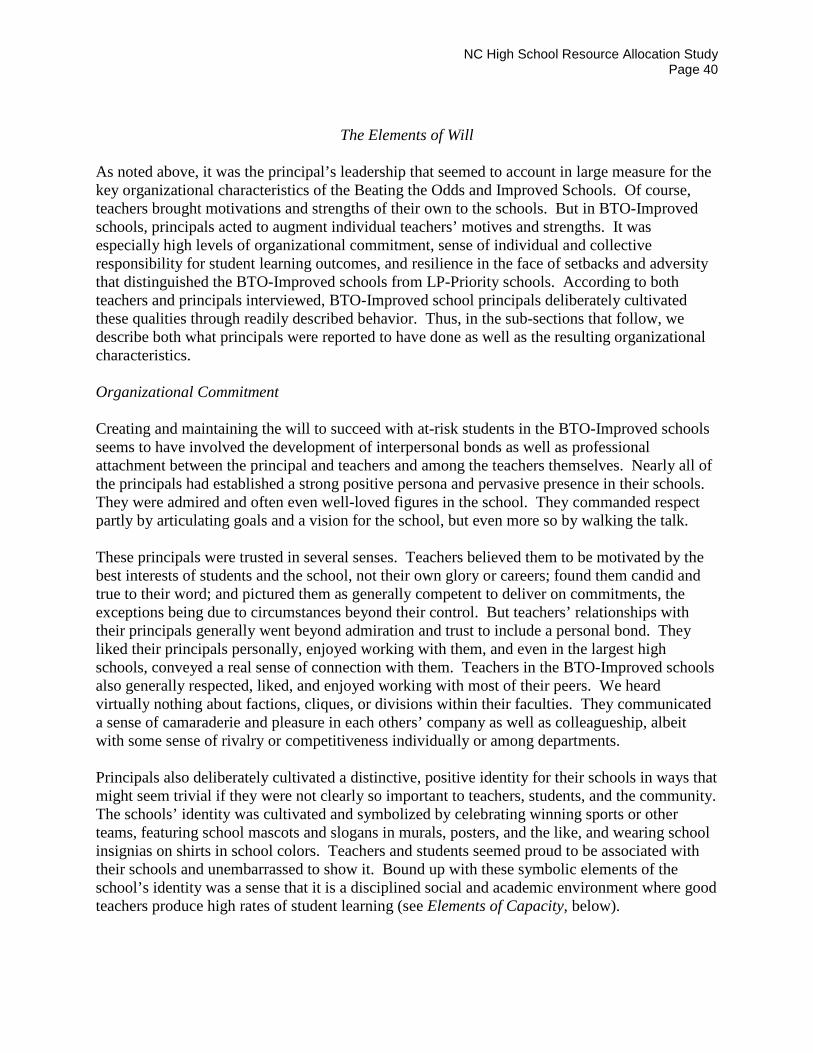
NC High School Resource Allocation Study Page 40
The Elements of Will
As noted above, it was the principal’s leadership that seemed to account in large measure for the key organizational characteristics of the Beating the Odds and Improved Schools. Of course, teachers brought motivations and strengths of their own to the schools. But in BTO-Improved schools, principals acted to augment individual teachers’ motives and strengths. It was especially high levels of organizational commitment, sense of individual and collective responsibility for student learning outcomes, and resilience in the face of setbacks and adversity that distinguished the BTO-Improved schools from LP-Priority schools. According to both teachers and principals interviewed, BTO-Improved school principals deliberately cultivated these qualities through readily described behavior. Thus, in the sub-sections that follow, we describe both what principals were reported to have done as well as the resulting organizational characteristics. Organizational Commitment Creating and maintaining the will to succeed with at-risk students in the BTO-Improved schools seems to have involved the development of interpersonal bonds as well as professional attachment between the principal and teachers and among the teachers themselves. Nearly all of the principals had established a strong positive persona and pervasive presence in their schools. They were admired and often even well-loved figures in the school. They commanded respect partly by articulating goals and a vision for the school, but even more so by walking the talk. These principals were trusted in several senses. Teachers believed them to be motivated by the best interests of students and the school, not their own glory or careers; found them candid and true to their word; and pictured them as generally competent to deliver on commitments, the exceptions being due to circumstances beyond their control. But teachers’ relationships with their principals generally went beyond admiration and trust to include a personal bond. They liked their principals personally, enjoyed working with them, and even in the largest high schools, conveyed a real sense of connection with them. Teachers in the BTO-Improved schools also generally respected, liked, and enjoyed working with most of their peers. We heard virtually nothing about factions, cliques, or divisions within their faculties. They communicated a sense of camaraderie and pleasure in each others’ company as well as colleagueship, albeit with some sense of rivalry or competitiveness individually or among departments. Principals also deliberately cultivated a distinctive, positive identity for their schools in ways that might seem trivial if they were not clearly so important to teachers, students, and the community. The schools’ identity was cultivated and symbolized by celebrating winning sports or other teams, featuring school mascots and slogans in murals, posters, and the like, and wearing school insignias on shirts in school colors. Teachers and students seemed proud to be associated with their schools and unembarrassed to show it. Bound up with these symbolic elements of the school’s identity was a sense that it is a disciplined social and academic environment where good teachers produce high rates of student learning (see Elements of Capacity, below).

NC High School Resource Allocation Study Page 41
Comparisons with High-Performing and LP-Priority Schools. Thus, BTO-Improved schools were characterized by high levels of faculty and administrative commitment. This included strong identification with the school and its goals as well as interpersonal and professional bonds between teachers and the principal and among teachers, themselves. At the High-Performing schools in our sample, teachers also took pride in the school as an organization, and most said that they trusted their principals. In the HP schools, the faculties were better characterized as sets of competent individuals rather than as unified teams. We also got the sense that the schools’ positive self image derived substantially from the skills and motivation that students brought to the school and from strongly supportive parents. Teachers and administrators seemed talented and hard-working, but to a substantial degree, success walked through the front door in these schools. The positive identity came easily to them, whereas at BTO-Improved schools, a positive organizational identity was deliberately constructed and hard-won. In this as well as many other senses, the leadership and organizational practices in the HP schools hardly seemed relevant to the BTO-Improved schools or the LP-Priority schools, which did not have the same student or teacher resources to draw upon. By contrast, teachers and administrators in our Low-Performing and Priority schools were plagued by negative publicity and a bad image in the community. In one LP-Priority school, many teachers we interviewed told us that as a consequence of Leandro-related publicity, they had decided to leave the school the following year. Across the LP-Priority schools, teachers seemed discouraged by the criticisms and by the challenges they faced, including the poor reading and mathematics skills that students brought with them, poor support from parents, and parents’ failure to discipline students and to impart a sense of the importance of education. Some pointed to these challenges as the reasons for the schools’ relatively poor performance. They also often felt that the schools did not get credit for the things they had accomplished, such as producing Expected or even High Growth, with such challenging students. In several LP-Priority schools, new or recently re-energized leaders had begun to instill a sense of hope, commitment, and unity among teachers. But most LP-Priority schools were struggling against a history of low teacher-principal and teacher-teacher trust and against demoralization stemming from their negative images in the community and negative self-images. Like principals at BTO-Improved schools, some LP-Priority school principals recognized the need to be visible to students and reported spending the majority of their days out and around the school, especially to keep students in line. But teachers’ trust in and regard for their principals was sometimes low and often spotty, reflecting strained relationships with certain departments and especially with experienced teachers. In some cases, rapid turnover among both principals and teachers had broken the bonds of support and trust. And some prior principals had tried to assert accountability (see Authoritative Accountability, below) without building the relationships required to maintain morale and commitment in the face of strong accountability pressures. In fact, some had berated their staffs for low performance in what teachers considered to be an abusive manner. In these schools teachers felt attacked and beaten down and had formed into defensive, bickering cliques rather than unified, committed teams.
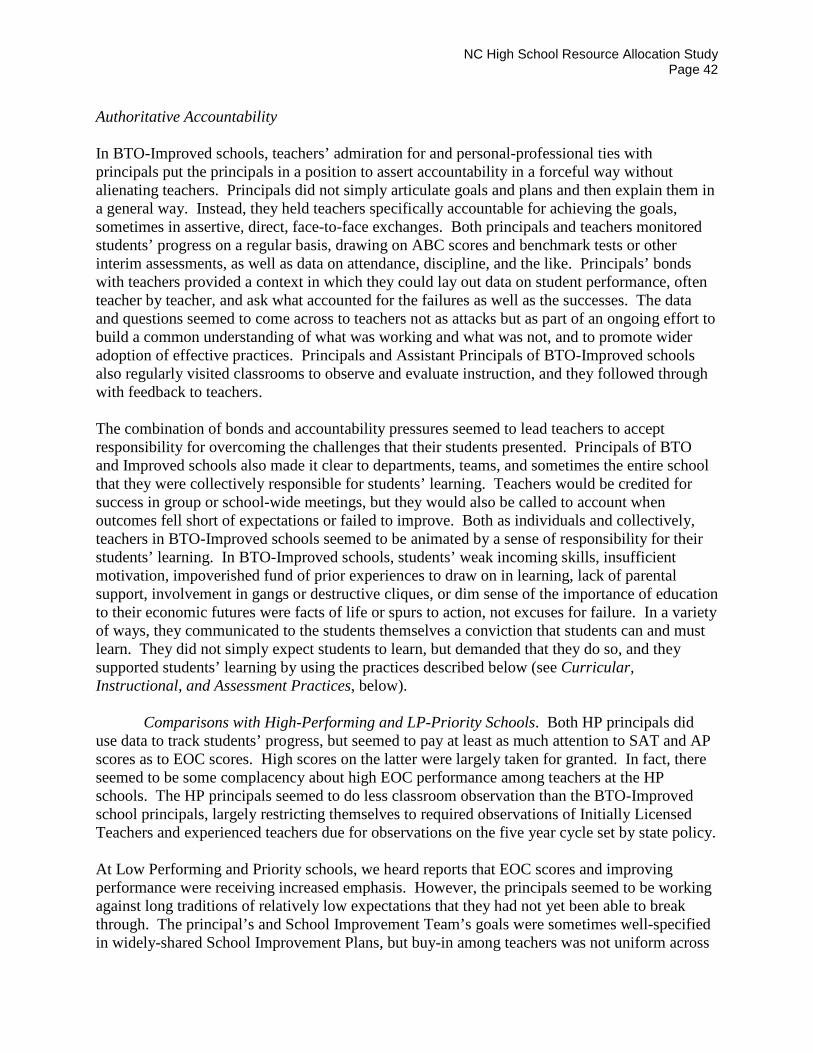
NC High School Resource Allocation Study Page 42
Authoritative Accountability In BTO-Improved schools, teachers’ admiration for and personal-professional ties with principals put the principals in a position to assert accountability in a forceful way without alienating teachers. Principals did not simply articulate goals and plans and then explain them in a general way. Instead, they held teachers specifically accountable for achieving the goals, sometimes in assertive, direct, face-to-face exchanges. Both principals and teachers monitored students’ progress on a regular basis, drawing on ABC scores and benchmark tests or other interim assessments, as well as data on attendance, discipline, and the like. Principals’ bonds with teachers provided a context in which they could lay out data on student performance, often teacher by teacher, and ask what accounted for the failures as well as the successes. The data and questions seemed to come across to teachers not as attacks but as part of an ongoing effort to build a common understanding of what was working and what was not, and to promote wider adoption of effective practices. Principals and Assistant Principals of BTO-Improved schools also regularly visited classrooms to observe and evaluate instruction, and they followed through with feedback to teachers. The combination of bonds and accountability pressures seemed to lead teachers to accept responsibility for overcoming the challenges that their students presented. Principals of BTO and Improved schools also made it clear to departments, teams, and sometimes the entire school that they were collectively responsible for students’ learning. Teachers would be credited for success in group or school-wide meetings, but they would also be called to account when outcomes fell short of expectations or failed to improve. Both as individuals and collectively, teachers in BTO-Improved schools seemed to be animated by a sense of responsibility for their students’ learning. In BTO-Improved schools, students’ weak incoming skills, insufficient motivation, impoverished fund of prior experiences to draw on in learning, lack of parental support, involvement in gangs or destructive cliques, or dim sense of the importance of education to their economic futures were facts of life or spurs to action, not excuses for failure. In a variety of ways, they communicated to the students themselves a conviction that students can and must learn. They did not simply expect students to learn, but demanded that they do so, and they supported students’ learning by using the practices described below (see Curricular, Instructional, and Assessment Practices, below).
Comparisons with High-Performing and LP-Priority Schools. Both HP principals did use data to track students’ progress, but seemed to pay at least as much attention to SAT and AP scores as to EOC scores. High scores on the latter were largely taken for granted. In fact, there seemed to be some complacency about high EOC performance among teachers at the HP schools. The HP principals seemed to do less classroom observation than the BTO-Improved school principals, largely restricting themselves to required observations of Initially Licensed Teachers and experienced teachers due for observations on the five year cycle set by state policy. At Low Performing and Priority schools, we heard reports that EOC scores and improving performance were receiving increased emphasis. However, the principals seemed to be working against long traditions of relatively low expectations that they had not yet been able to break through. The principal’s and School Improvement Team’s goals were sometimes well-specified in widely-shared School Improvement Plans, but buy-in among teachers was not uniform across
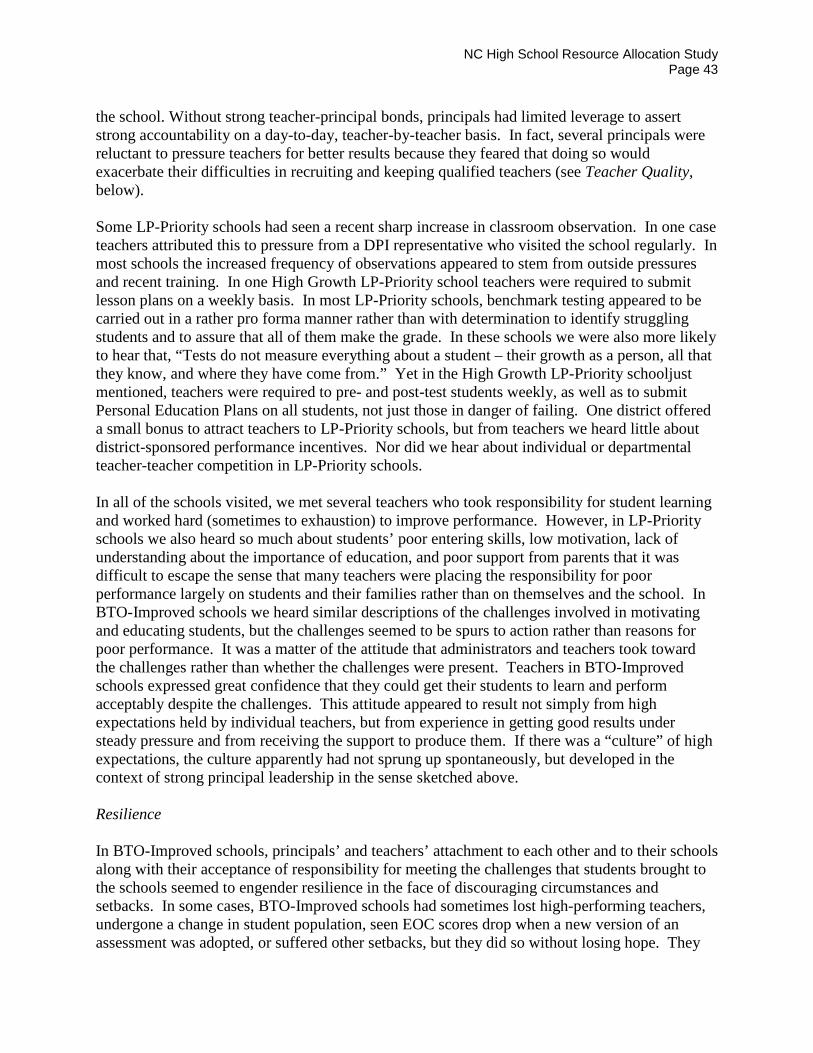
NC High School Resource Allocation Study Page 43
the school. Without strong teacher-principal bonds, principals had limited leverage to assert strong accountability on a day-to-day, teacher-by-teacher basis. In fact, several principals were reluctant to pressure teachers for better results because they feared that doing so would exacerbate their difficulties in recruiting and keeping qualified teachers (see Teacher Quality, below). Some LP-Priority schools had seen a recent sharp increase in classroom observation. In one case teachers attributed this to pressure from a DPI representative who visited the school regularly. In most schools the increased frequency of observations appeared to stem from outside pressures and recent training. In one High Growth LP-Priority school teachers were required to submit lesson plans on a weekly basis. In most LP-Priority schools, benchmark testing appeared to be carried out in a rather pro forma manner rather than with determination to identify struggling students and to assure that all of them make the grade. In these schools we were also more likely to hear that, “Tests do not measure everything about a student – their growth as a person, all that they know, and where they have come from.” Yet in the High Growth LP-Priority schooljust mentioned, teachers were required to pre- and post-test students weekly, as well as to submit Personal Education Plans on all students, not just those in danger of failing. One district offered a small bonus to attract teachers to LP-Priority schools, but from teachers we heard little about district-sponsored performance incentives. Nor did we hear about individual or departmental teacher-teacher competition in LP-Priority schools. In all of the schools visited, we met several teachers who took responsibility for student learning and worked hard (sometimes to exhaustion) to improve performance. However, in LP-Priority schools we also heard so much about students’ poor entering skills, low motivation, lack of understanding about the importance of education, and poor support from parents that it was difficult to escape the sense that many teachers were placing the responsibility for poor performance largely on students and their families rather than on themselves and the school. In BTO-Improved schools we heard similar descriptions of the challenges involved in motivating and educating students, but the challenges seemed to be spurs to action rather than reasons for poor performance. It was a matter of the attitude that administrators and teachers took toward the challenges rather than whether the challenges were present. Teachers in BTO-Improved schools expressed great confidence that they could get their students to learn and perform acceptably despite the challenges. This attitude appeared to result not simply from high expectations held by individual teachers, but from experience in getting good results under steady pressure and from receiving the support to produce them. If there was a “culture” of high expectations, the culture apparently had not sprung up spontaneously, but developed in the context of strong principal leadership in the sense sketched above. Resilience In BTO-Improved schools, principals’ and teachers’ attachment to each other and to their schools along with their acceptance of responsibility for meeting the challenges that students brought to the schools seemed to engender resilience in the face of discouraging circumstances and setbacks. In some cases, BTO-Improved schools had sometimes lost high-performing teachers, undergone a change in student population, seen EOC scores drop when a new version of an assessment was adopted, or suffered other setbacks, but they did so without losing hope. They

NC High School Resource Allocation Study Page 44
acknowledged and bemoaned the loss, but soon pulled up their socks and got back to work. In contrast, LP-Priority schools seemed demoralized by community and press criticism and by a long history of losses and perceived failures. They were sometimes very hard hit by the loss of good teachers. One LP-Priority principal pointed to a 49 percentage point decline in a science EOC score precipitated by the loss of a long-time teacher in the school. LP-Priority principals and teachers were also especially sensitive to the effects of changes in EOC examinations and cut scores, a sensitivity that was not unknown but not so discouraging in BTO-Improved schools. High-Performing schools seemed seldom if ever tested by such losses and setbacks.
The Elements of Capacity Teacher Quality Principals of BTO-Improved schools were active, selective, and persuasive recruiters. They did not simply accept the teachers they were sent, but sought out good candidates on the web, at job fairs, and – it seemed – everywhere they went. In some cases, bonuses helped them recruit, but principals said and teachers confirmed that it was the image of the school as a work environment and the quality of their prospective colleagues that clinched the deal. Once the principal had primed the recruiting pump, the school’s reputation and teachers’ word-of-mouth networks seemed to attract many good candidates. This allowed principals to be more and more selective in hiring teachers and in keeping them. These principals were reluctant to give up on teachers who were performing below par and worked actively to help them improve. However, if teachers continued to be ineffective, the principals put them on an action plan and suggested that they might be happier in another school. Turnover rates in these schools were generally low, but the principals held that some teacher turnover was actually desirable. The same factors that attracted teachers to the BTO-Improved schools – an engaged, supportive principal, a good working environment, and good colleagues – seemed to keep them there. In addition to recruiting and keeping good teachers, BTO-Improved principals also worked to strengthen the teachers they had. Most teachers said that the professional development (PD) experiences that the school or district made available on a routine basis varied greatly in quality. These principals brought certain PD activities right into the school, and teachers often confirmed the value of these, sometimes enthusiastically. Some principals were more selective, restricting the range to a few activities keyed to their improvement priorities. As indicated above, BTO-Improved school principals and their assistant principals appeared to observe instruction on a regular basis, many using brief “pop-ins” or “walkthroughs” in nearly all classrooms in addition to the required evaluations of new teachers and experienced teachers in the fifth year of a cycle. When administrators followed up with specific feedback, observations sometimes served as instruments of instructional improvement, not solely as instruments of accountability. But teachers were much more enthusiastic about advice from other teachers than about advice or critiques from administrators. Principals of BTO-Improved schools may not have used the term “professional learning community” (PLC) but they promoted the development of these
NC High School Resource Allocation Study Page 45
communities – often quite aggressively. A few simply arranged common planning times for teachers of a given course, but several went well beyond this to charge EOC teams or departments with collective responsibility for student outcomes. They made it plain that if one teacher fell down on the job, all would be held responsible. Some named a lead teacher to organize team or department meetings, submit reports on the meetings, observe in others’ classrooms, and take other steps to pinpoint problems and help their colleagues address them. Some also met with the teams on a periodic basis to review data on students’ progress. The professional learning community did not simply spring up in these schools, but was virtually mandated. Teachers reported that no one could simply disappear behind the classroom door. If teaching was not always public – and administrator or peer observation often made it so – then test score results certainly were. Within PLCs, norms of good practice arose and were enforced. In this sense, collegial accountability reinforced the administrative accountability discussed above. By helping teachers deal with knotty problems of classroom practice, PLCs helped to build instructional skills as well as to enhance motivation.
Comparisons with High-Performing and LP-Priority Schools. Like BTO-Improved schools, our two High-Performing schools reported little difficulty in recruiting and retaining good teachers. Principals said their schools’ reputations and word-of-mouth advertising by teachers did most of the work for them. Highly motivated and well-behaved students as well as supportive parents, many of whom volunteered in the schools, appeared to help attract and retain teachers at these schools. At one, all teachers taught both upper (AP, Honors) and lower level (“regular”) classes. At the other HP school, the principal made all assignments unilaterally, and teachers who failed to produce high scores in AP and Honors classes were reassigned to teach “regular” classes. Though this had clearly angered some teachers, their anger had no discernible effect on the principal, and few had left the school for this reason. There was no common pattern of professional development or professional learning communities across the two schools. One emphasized professional development for AP classes and SATs, participation in the SACS accreditation team as a learning experience, district-led content area PD sessions, and visits to three other high-performing schools that were bettering their own performance in some area. The same school had no formal faculty meetings at all, and teachers expressed concern about the lack of “teamwork” in the school. The other HP school had a history of strong professional learning communities dating to its inception, but teachers made little mention of formal professional development. Principals at LP-Priority schools generally reported great difficulty in recruiting and retaining teachers. As indicated earlier, we met articulate, energetic teachers in all schools. But in rural LP-Priority schools, principals said that low local supplements and communities without adequate housing and with few cultural amenities made it extremely difficult to recruit and keep teachers who were not attached to the area because they grew up there or had a spouse from or employed in the area. In urban areas, some principals and teachers said that their schools had traditionally gotten the “leftovers” from schools with better reputations. Principals emphasized that publicity about their school’s appearance on Judge Manning’s list of perennially low-performing schools made teacher recruitment much more difficult. One district offered $1,000 bonuses to teach at challenging schools, but principals said the bonuses had attracted few teachers. Teachers were seldom involved in the recruitment and selection of new teachers. Teachers themselves said that low faculty morale, enmity between cliques, and a lack of support
NC High School Resource Allocation Study Page 46
from their principals and colleagues drove many teachers away after a year or two. The sense of distrust and outright hostility was palpable in some LP-Priority schools. Partly as a result of the negative publicity and pressures on these schools over the past several years, trust had been eroded to a nub. Not surprisingly, then, collegial professional learning communities had been rare. Yet most LP-Priority school principals had recently attended workshops on the benefits of PLCs and how to establish them. Most seemed enthusiastic about the possibilities, and most had initiated efforts to build PLCs. LP-Priority school teachers generally told us that professional development provided at the school was “drive-by,” unfocused, shallow, and sometimes contradictory (that is, the advice offered in one workshop contradicted the advice offered in another). In one school where PD had been more programmatically organized, after-school PD sessions were sparsely attended even when they were supported by a Comprehensive School Reform (CSR) grant and nominally required. . On the whole, we heard little about CSR or Gates Foundation grants, and when we did hear about the latter, implementation was still too new to have exerted any discernible effect. In one LP-Priority school, the district had introduced instructional coaches in content areas, and their instructional monitoring, observations, feedback, and help in using assessment data were seen as very valuable. Teachers generally reported that they had no opportunity to influence what courses they would teach, and in some schools they learned of their assignments only a day or so before school began. In one LP-Priority school where improvements seemed to be stirring, the new principal noted that she now assigns the teachers who are getting the best results to teach EOC courses. Finally, as indicated earlier, principals of LP-Priority schools were often outspoken about the dilemma that their recruiting and retention problems posed when it came to dealing with low-performing or recalcitrant teachers. One said that he had recently begun to confront teachers more aggressively, but worried that the new pressures might drive them out of the school, leaving him with no alternative but to hire long-term substitutes as replacements. Disciplined and Caring Environment for Learning The principals and teachers in BTO-Improved schools took a proactive approach to establishing norms of order and discipline in the school. The culture of many high schools is the product of a tacit bargain or balance between the preferences of adults and students, but in these schools it was clearly the adults who set boundaries on behavior and controlled the culture of the school. Yet the environments did not feel hostile or punitive. The teachers claimed to know and professed to like their students, and our observations bore this out.
Comparisons with High-Performing and LP-Priority Schools. The environments at HP schools seemed just as well-disciplined as those at BTO-Improved schools, but we got the strong sense that this owed much to parents’ firm hand at home and presence at school. Teachers’ and administrators’ relationships with students – and with their parents – also seemed equally positive as those in BTO-Improved schools. It is worth noting that both of the schools with HP profiles were in affluent suburban-exurban areas.

NC High School Resource Allocation Study Page 47
In no school did our interviewers get a sense that students were often disorderly, violent, or even rude. We did see some evidence of misbehavior, but nothing that would surprise anyone who ever went to an American high school. Yet teachers in some LP-Priority schools expressed concern about discipline in their schools. In one, they argued that their principal was far too ready to give second, third, or fourth chances to students who should have been suspended or even expelled. Curricular, Instructional, and Assessment Practices The BTO-Improved schools implemented curricular, instructional, and assessment practices designed to assure all students appropriate and adequate opportunities to learn, including the following: 1. Freshman Academy &/or other practices to manage the transition from middle to high
school, personalize the environment and reduce dropouts, and address incoming skill deficits 2. Discussion and use of the NC Standard Course of Study, pacing guides, and in some cases,
common lesson formats and lesson plans 3. Cross-grade curriculum articulation, sometimes reaching down to the middle school 4. “Stairstep” curricula to key curriculum coverage to pace student learning (i.e., sequences
such as Pre-Algebra, Algebra 1, Tech Mathematics, Algebra 2, and Geometry, designed to break content into manageable steps for struggling students)
5. Substantially smaller classes for students who have fallen behind in their courses 6. Required tutoring 7. Inventive End of Course assessment preparation processes involving all teachers 8. Use of interim (benchmark) assessments to guide instruction and intervention with individual
students 9. “Bell-to-bell” teaching with few or no interruptions. There was some variation from school to school in which of these practices were implemented, but all of the BTO/ Improved schools reported implementing a substantial number of them. Further, from the details of their interviews it seemed clear that their commitment to the schools’ central goal – high student outcomes for all students – led teachers to carry out the practices with determination to assure learning, not simply to implement them in a pro forma manner.
Comparisons with High-Performing and LP-Priority Schools. One of our HP schools had secured a grant to provide extensive support to help 9th graders make the transition into the school, including a thorough orientation session, training in the use of planners and time management, and a program that involved volunteer upperclassmen as well as teachers in after-school tutoring. The other HP school held special information sessions for the parents of rising freshmen and extensive orientation sessions for the students themselves; freshmen were also housed in a separate 9th grade annex a mile away from the main building. Even their buses were separate from those for upperclassmen. Adherence to the Standard Course of Study and to pacing guides was assumed at both HP schools, but no extraordinary steps to assure this were in evidence. Both clearly offered a rigorous curriculum, especially for the many students in Honors and AP courses. At one, the
NC High School Resource Allocation Study Page 48
relatively few lower performing students were assigned to “stairstep” courses like those described at BTO-Improved schools. There was no mention of smaller classes for low-skilled students at either HP school. Nor did interim (benchmark) assessments, if used, receive prominent mention as reasons for the schools’ success. Instructional time was vigilantly protected at both. At one there were absolutely no faculty meetings because the principal saw these as taking valuable time away from teachers’ attention to instruction. For the same reason, this school also had no loudspeaker announcements during the school day, student assemblies, or early dismissal for athletic or other extracurricular events. The principals and teachers at the two HP schools made little or no mention of any special preparation for EOC assessments but did talk about special sessions to prepare students for SATs. At LP-Priority schools, Freshman Academies and other programs to help 9th graders with the transition to high school were generally just getting under way or still in the planning stages. Two did have intensive literacy programs in place already. One of these was referred to as a Freshman Academy even though it was limited to particularly low-skilled students and was not a comprehensive unit with all of the characteristics described for academies in some of the BTO-Improved schools. Teachers often spoke of following the Standard Course of Study and pacing guides closely, but these seemed to be new practices in most LP-Priority schools. Principals and some teachers at these schools reported that the Standard Course of Study and pacing guides were still not fully understood or regularly followed by many teachers. What we have called “stairstep” courses either were not used at all, had been tried on a sporadic basis and abandoned when implementation problems presented themselves, or had been initiated only recently. Similarly, at most LP-Priority schools, benchmark assessments were reported to have been implemented in a pro forma manner, without full understanding of how the resulting data could be used to guide instruction and intervention with lagging students. At most, there seemed to be no determined effort to protect instructional time, and both student and teacher absenteeism – which cut into time for instruction by qualified teachers – was reported to occur at high rates in some LP-Priority schools. Teachers reported that they offered supplemental instruction in the form of tutoring before and after school, but complained that it was very difficult to get many students to attend. Difficulties in arranging or paying for transportation presented obstacles to tutoring in rural areas. Finally, in these schools we heard no mention of especially inventive or vigorous programs to prepare students for End of Course assessments.
Conclusion In summary, in BTO-Improved high schools, principals had worked actively to cultivate organizational commitment, to hold both individuals and groups of teachers responsible for learning outcomes, and to strengthen the schools’ ability to withstand inevitable reverses and disappointments. Enlisting active cooperation from teachers, principals also recruited, retained, and strengthened their faculties through supervision, selective professional development, and professional learning communities. Driven by a common commitment to the organization and its goals, and by a combination of administrative and professional accountability, teachers and
NC High School Resource Allocation Study Page 49
principals created a disciplined environment for learning and implemented a distinctive set of curricular, instructional, and assessment practices. They did so with an evident determination to assure high levels of learning by all of their students. In LP-Priority high schools, principals have generally not been as effective in building the same levels of organizational commitment, individual and collective responsibility, and resilience. Morale and reputational problems have made it difficult to recruit, train, and retain faculties of similar quality. As learning environments, the LP-Priority schools seem to lack the powerful combination of discipline and caring observed in BTO-Improved Schools. Finally, the LP-Priority schools have not implemented nearly so fully or forcefully the effective curricular, instructional, and assessment practices observed in BTO-Improved schools.
NC High School Resource Allocation Study Page 50
CHAPTER 6: CONCLUSIONS
Two primary purposes of this study were to assess the extent to which high schools were expending their funds in ways that enhance student outcomes and to identify effective strategies for using and mobilizing resources. The results from this study indicate that lower performing schools and schools with higher concentrations of students living in poverty are receiving more funds. North Carolina may be unique or at least unusual in this regard, since prior studies have shown that schools with high concentrations of poverty and high concentrations of minority students are receiving less funding. This study also shows that more spending for regular instruction is associated with higher student test scores. Our estimates indicate that the addition of $500 per pupil for regular instruction would return a ½ point upturn in average EOC scores. This implies that the increase required to substantially reduce the high school test gap between schools would involve nearly doubling expenditures for regular instruction. However, the results also suggest that expenditures that enhance teacher quality in high-poverty, low-performing high schools could produce benefits more efficiently. Other expenditures also are associated with higher levels of achievement, which indicates that targeting regular classroom teachers for additional funding may not be sufficient. Higher levels of expenditures for special instruction, transportation, and district services and administration all had a positive relationship with student achievement. Two types of expenditures were associated with lower levels of student achievement: supplemental education programs and student services, including counseling and psychological services. These are particularly worrisome. The finding concerning supplemental education programs is worrisome because of the mandates in the federal No Child Left Behind Act that require students to be offered supplemental instruction services if their school does not achieve its required Adequate Yearly Progress for three years. These programs, if they are similar to currently funded program and especially if they are funded at the expense of regular instruction, may be counter-productive. The finding concerning student services expenditures deserves further examination beyond the scope of this study. It may be that the models for providing student services that are currently being used are not effective. Also, it could be that these services as currently offered can reduce drop-outs or reduce school violence but do not improve achievement scores. Further study is warranted. This study also finds that higher concentrations of students with low prior achievement and students living in poverty within a school depress student achievement in that school. One district in the state has developed plans to reduce the concentration of students living in poverty in its high schools. While this is not a solution that could be implemented in smaller, sparsely populated, rural districts, it may be considered for more wide-spread use in districts that could reduce the concentration of poverty in some of their schools. While the findings concerning higher levels of expenditures provide assurance that the funding allocated to high schools has been spent productively, the findings about teachers, principals, and organizational characteristics indicate that strategically targeted funding increases may reduce
NC High School Resource Allocation Study Page 51
the high school performance gap. Policy options for consideration based on the findings in this report are:
1. Offering differential pay for higher quality teachers to teach in high-poverty high schools with large concentrations of incoming students with low levels of proficiency in 8th grade mathematics and reading;
2. Increasing incentives, including teachers’ salaries in a targeted manner, to attract and retain more high quality and effective teachers into the state;
3. Ensuring that high school students with special needs, approximately half of whom are diagnosed with specific learning disorders, receive services that enable them to achieve at higher levels;
4. Making district investments in schools to (a) provide support for using data to improve instruction including benchmark assessments in all EOC classes, (b) encourage professional learning communities to accept responsibility for student learning and focus on remedies for documented gaps in achievement, and (c) target professional development for specific deficiencies in student learning within the school that are documented through benchmark assessments and other test scores;
5. Supporting principals in high-poverty high schools with large concentrations of incoming students with low levels of proficiency in 8th grade mathematics and reading. This would include coaching on how to instill responsibility for student performance among teachers and students, how to establish effective accountability systems, and how to institute, as a part of the school’s professional learning community, curricular and instructional practices such as: o Freshman Academy and/or other practices to manage the transition from middle to
high school, personalize the environment and reduce drop-outs, and address incoming skill deficits;
o Use of the NC Standard Course of Study, pacing guides, and where needed, common lesson formats and lesson plans;
o Cross-grade curriculum articulation, including 8th grade to high school; o “Stairstep” curricula to key curriculum coverage to pace student learning (i.e.,
sequences such as Pre-Algebra, Algebra 1, Tech Mathematics, Algebra 2, and Geometry, designed to break content into manageable steps for struggling students);
o Require tutoring for students who have fallen behind, and provide transportation if tutoring occurs before or after school;
o Inventive End of Course assessment preparation processes that covers content not test preparation alone;
o Use of interim (benchmark) assessments to guide instruction and intervention with individual students; and
o “Bell-to-bell” teaching with few or no interruptions. Clearly there is not a silver bullet that was identified in this study. Instead, we found several types of factors that have a relationship with student achievement in our high schools. It is comforting to know that expenditures are going to schools with substantial needs. However, without targeting these resources, the ability to recruit and retain higher quality teachers and mobilize existing resources within the schools, the rate of return on the investments in education are unlikely to meaningfully reduce the high school performance gap.