north american cement and clinker imports - an indepth...
TRANSCRIPT
North American cement and clinker imports
-
An in-depth analysis
Ad LigthartLas Vegas 29 November2017
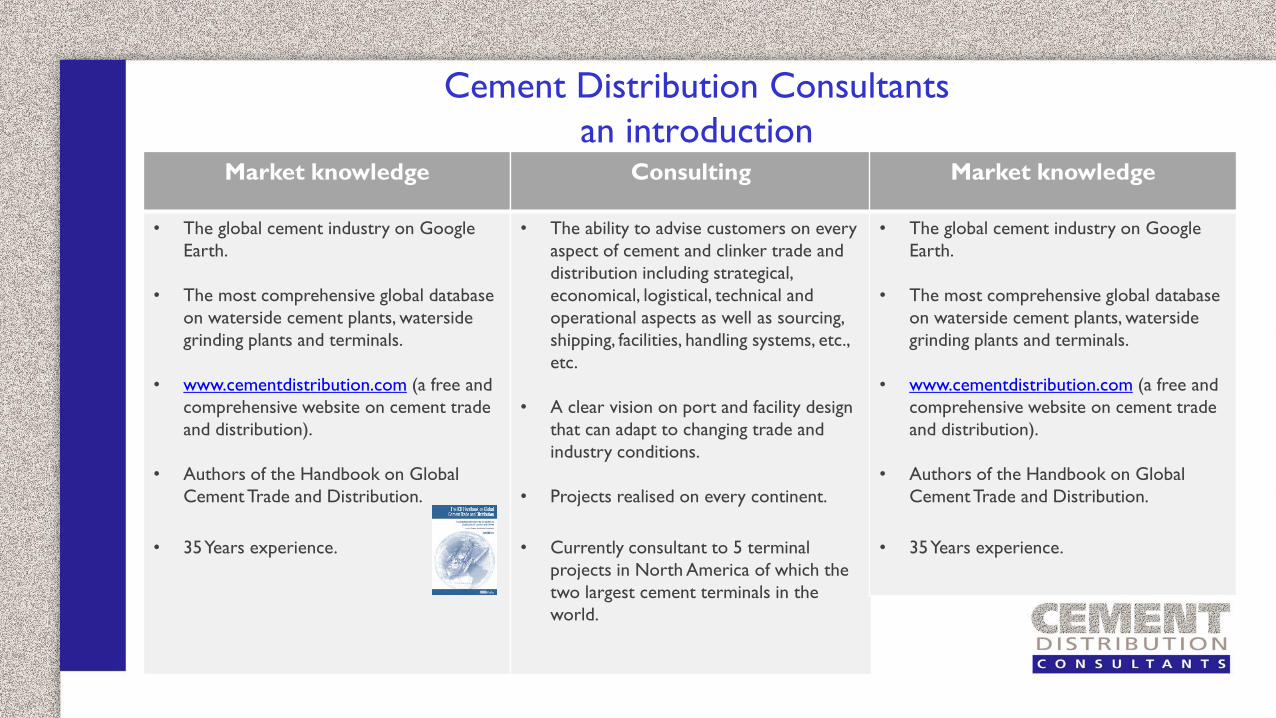
Cement Distribution Consultants
an introductionMarket knowledge
• The global cement industry on Google
Earth.
• The most comprehensive global database
on waterside cement plants, waterside
grinding plants and terminals.
• www.cementdistribution.com (a free and
comprehensive website on cement trade
and distribution).
• Authors of the Handbook on Global
Cement Trade and Distribution.
• 35 Years experience.
Consulting
• The ability to advise customers on every
aspect of cement and clinker trade and
distribution including strategical,
economical, logistical, technical and
operational aspects as well as sourcing,
shipping, facilities, handling systems, etc.,
etc.
• A clear vision on port and facility design
that can adapt to changing trade and
industry conditions.
• Projects realised on every continent.
• Currently consultant to 5 terminal
projects in North America of which the
two largest cement terminals in the
world.
Market knowledge
• The global cement industry on Google
Earth.
• The most comprehensive global database
on waterside cement plants, waterside
grinding plants and terminals.
• www.cementdistribution.com (a free and
comprehensive website on cement trade
and distribution).
• Authors of the Handbook on Global
Cement Trade and Distribution.
• 35 Years experience.

Introduction
Why is there so much new terminal
construction in North America
whilst imports are still far below the
Pre-crisis peak and many existing
terminals are still mothballed or
underused?
INTRODUCTION
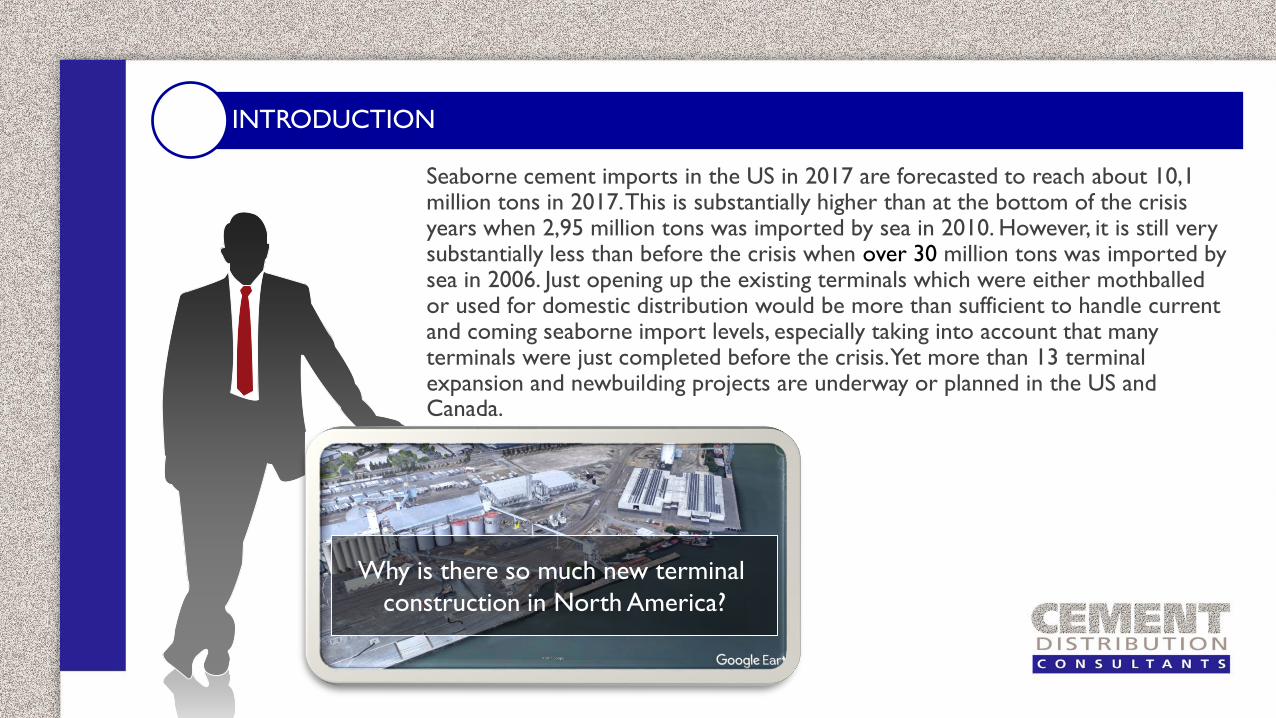
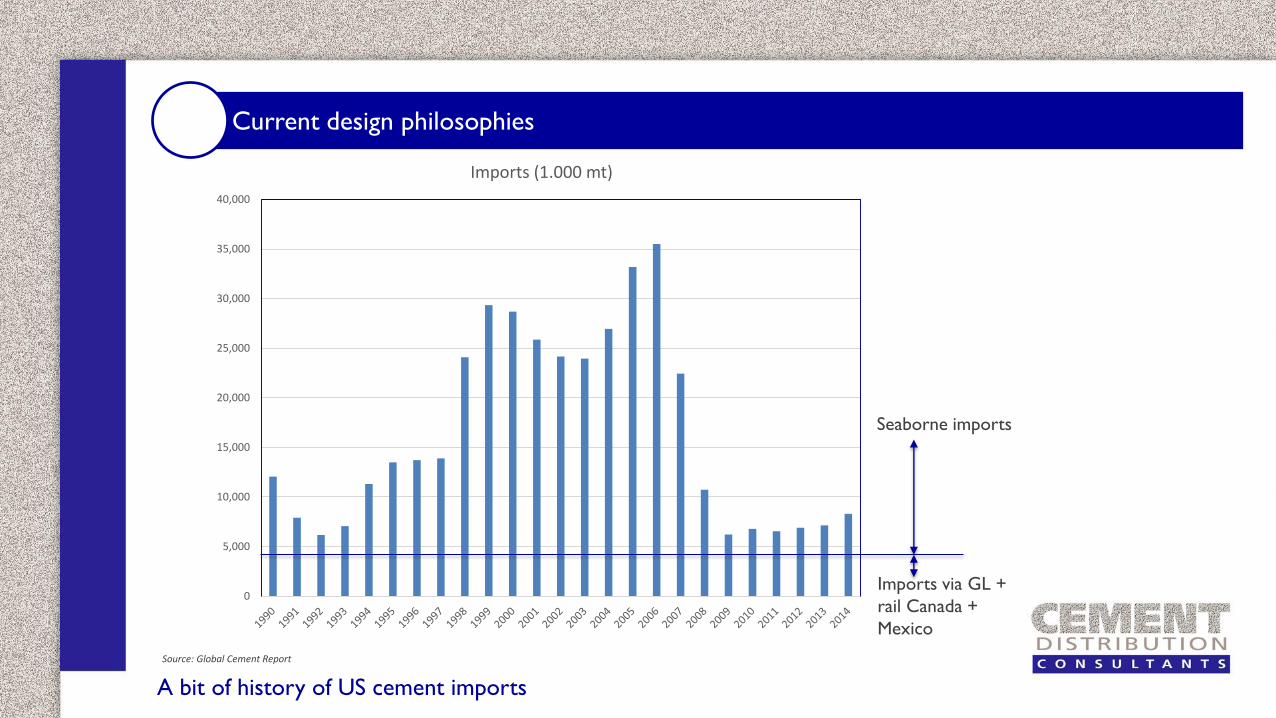
Seaborne cement imports in the US in 2017 are forecasted to reach about 10,1million tons in 2017. This is substantially higher than at the bottom of the crisis years when 2,95 million tons was imported by sea in 2010. However, it is still very substantially less than before the crisis when over 30 million tons was imported by sea in 2006. Just opening up the existing terminals which were either mothballed or used for domestic distribution would be more than sufficient to handle current and coming seaborne import levels, especially taking into account that many terminals were just completed before the crisis. Yet more than 13 terminal expansion and newbuilding projects are underway or planned in the US and Canada.
Why is there so much new terminal
construction in North America?
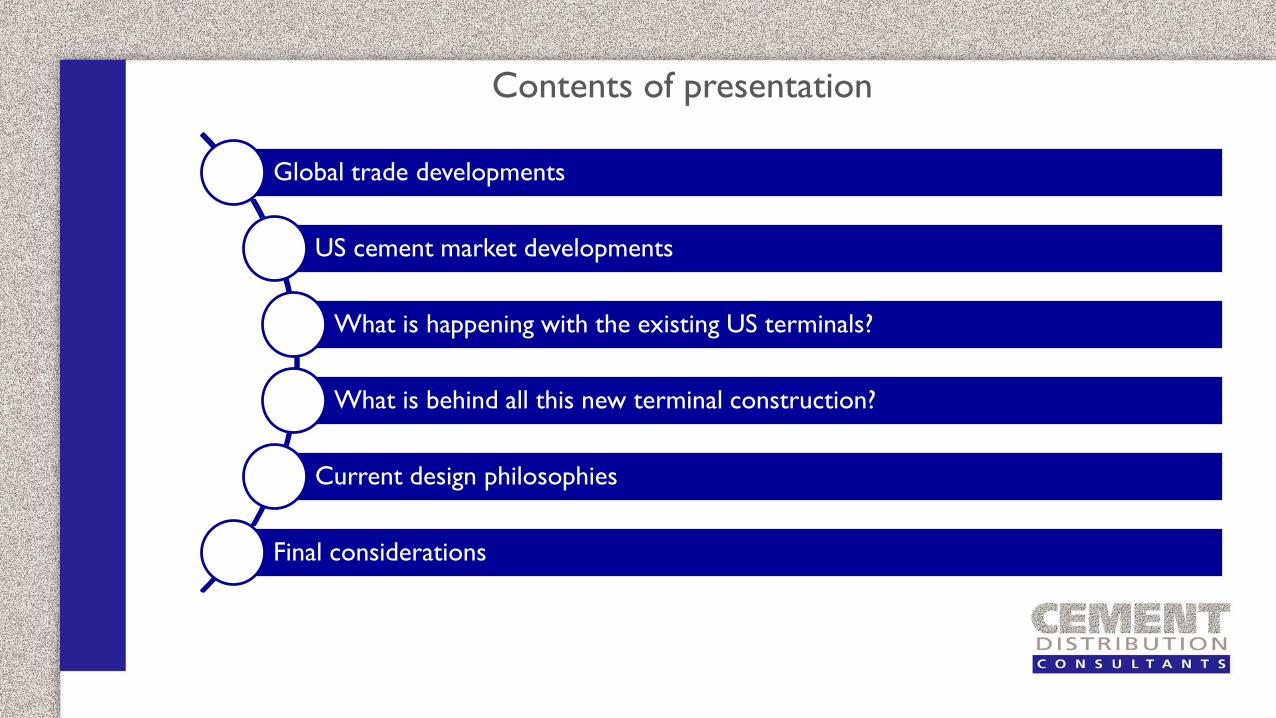
Contents of presentation
Global trade developments
US cement market developments
What is happening with the existing US terminals?
What is behind all this new terminal construction?
Current design philosophies
Final considerations
Global trade developments
Global trade developments
• A glut of exportable clinker and cement volumes has developed with a downward pressure on F.O.B prices. This glut will stay for quite some time.
• Long-term very substantial overcapacity in China
• Iran, Saudi Arabia, Indonesia (re) enter the market
• Turkey, Vietnam, Pakistan keep adding capacity larger than their consumption growth
• Structural cement surpluses in South Europe, UAE, Thailand, etc.
• Shipping prices are slowly but steadily rising but remain very low compared to pre-crisis levels
• Trade in cementitious materials is growing and becomes more global
Developments in cement and clinker trade
Global trade developments
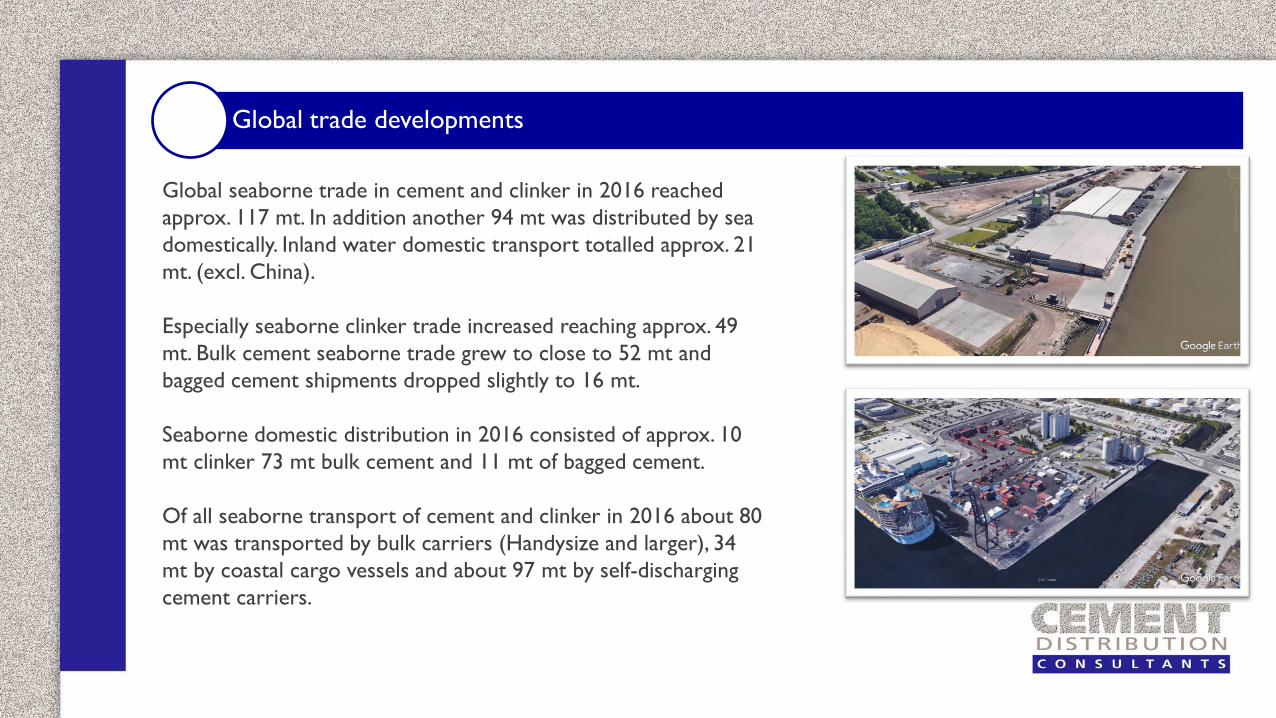
Global seaborne trade in cement and clinker in 2016 reached
approx. 117 mt. In addition another 94 mt was distributed by sea
domestically. Inland water domestic transport totalled approx. 21
mt. (excl. China).
Especially seaborne clinker trade increased reaching approx. 49
mt. Bulk cement seaborne trade grew to close to 52 mt and
bagged cement shipments dropped slightly to 16 mt.
Seaborne domestic distribution in 2016 consisted of approx. 10
mt clinker 73 mt bulk cement and 11 mt of bagged cement.
Of all seaborne transport of cement and clinker in 2016 about 80
mt was transported by bulk carriers (Handysize and larger), 34
mt by coastal cargo vessels and about 97 mt by self-discharging
cement carriers.

Global trade developments
Developments in cement and clinker trade
Key growth markets are cement imports into the US and clinker imports into Africa but regional trade around Europe and within Asia are increasing too.
The long-term export availability of low priced cement and (especially) clinker, in combination with low shipping prices makes it uneconomical to build integrated cement plants in coastal areas wherever in the world. It is more economical to import. New coastal cement production facilities will be grinding plants (with blending capability).
The very large difference between the CIF costs of imported cement (or clinker) and domestic cement prices makes importing highly attractive.
US cement market developments
Nevada-791,525
Colorado-697,222
Wyoming1,309,103
Washington-776,882
New Mexico101,446
NJ-1,401,117
RI-107,163
Maine192.042
Louisiana-1,938,108
Georgia-1,802,358
Missouri6,775,299
Iowa16,852
Wisconsin-1,954,333
Arkansas-262,719
Minnesota-1,622,045
Kansas834,173
Nebraska-439,626
Oklahoma167,963
South Dakota232,117
North Dakota-764,045
665.664 t clinker654.155 t cement
Canada
61.339 Canada
238.066Canada
344.920Taiwan
Hawaii-335,995
121.487Mexico
162.470Mexico
594.615Canada
402.353Canada
619.181Canada
204.914Canada
905.977Canada
Alaska-142,058
384.318South Korea
China
110.250South Korea
1.823.109South Korea
ChinaGreeceTaiwanTurkeySpain
Portugal
Puerto Rico-44,306
177.866Spain
Portugal
490.549Spain, SwedenTukey, Egypt
315.339South Korea
Greece, Turkey
46.300 clinker Turkey106.261 clinker France
196.970 Greece, BulgariaTurkey, Italy
1.091.293Greece, Turkey
Norway, Denmark648.909 clinkerTurkey, Greece
Montana628,029
Texas-3,358,785
California325,064
Exports to Caribbean
Exports to Caribbean
Exports to Caribbean
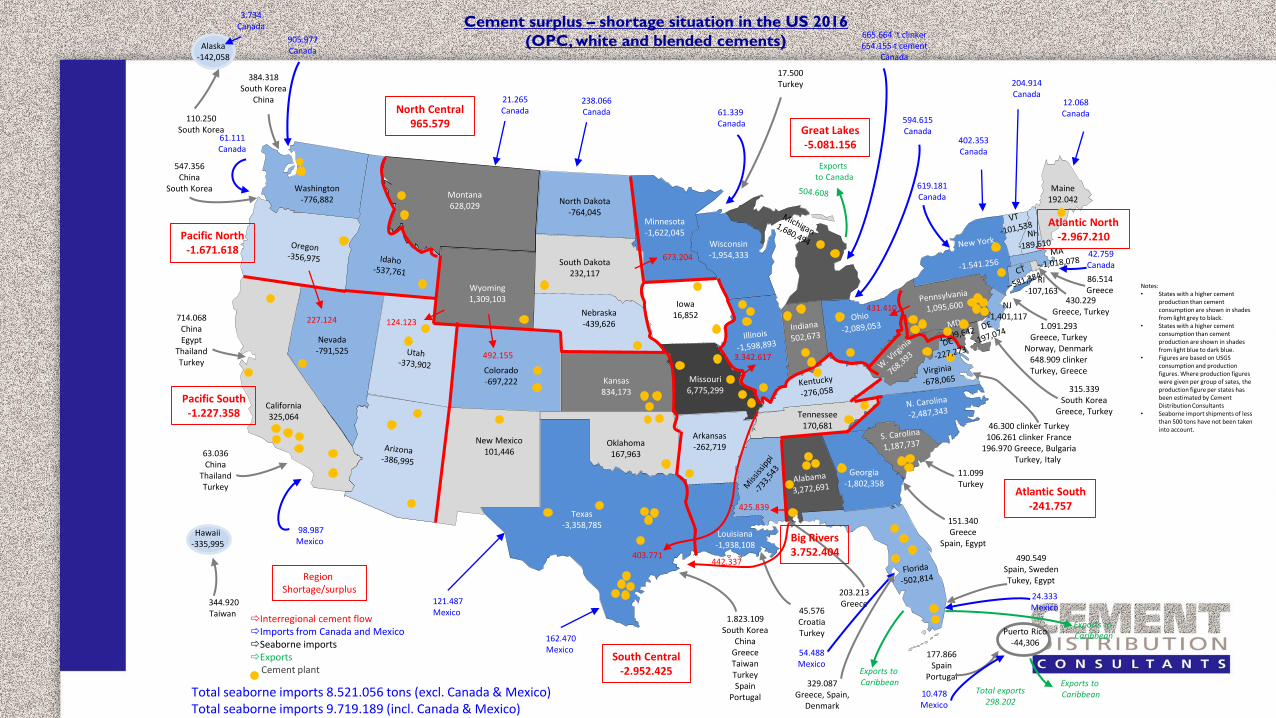
Cement surplus – shortage situation in the US 2016
(OPC, white and blended cements)
Tennessee170,681
Total seaborne imports 8.521.056 tons (excl. Canada & Mexico)Total seaborne imports 9.719.189 (incl. Canada & Mexico)
North Central965.579
Great Lakes-5.081.156
Exports to Canada
Pacific North-1.671.618
Pacific South-1.227.358
714.068ChinaEgypt
ThailandTurkey
Atlantic North-2.967.210
Atlantic South-241.757
South Central-2.952.425
45.576CroatiaTurkey
Region Shortage/surplus
Interregional cement flowImports from Canada and MexicoSeaborne importsExports
Cement plant
Total exports298.202
Big Rivers3.752.404
12.068Canada
21.265Canada
3.734Canada
61.111Canada
547.356China
South Korea
227.124 124.123
431.410
425.839
403.771
3.342.617
673.204
63.036China
ThailandTurkey
98.987Mexico
492.155
17.500Turkey
42.759Canada
11.099Turkey
24.333Mexico
151.340Greece
Spain, Egypt
10.478Mexico
203.213Greece
54.488Mexico
329.087Greece, Spain,
Denmark
430.229Greece, Turkey
86.514Greece
442.337
Notes: • States with a higher cement
production than cement consumption are shown in shades from light grey to black.
• States with a higher cement consumption than cement production are shown in shades from light blue to dark blue.
• Figures are based on USGS consumption and production figures. Where production figures were given per group of sates, the production figure per states has been estimated by Cement Distribution Consultants
• Seaborne import shipments of less than 500 tons have not been taken into account.
US cement market developments
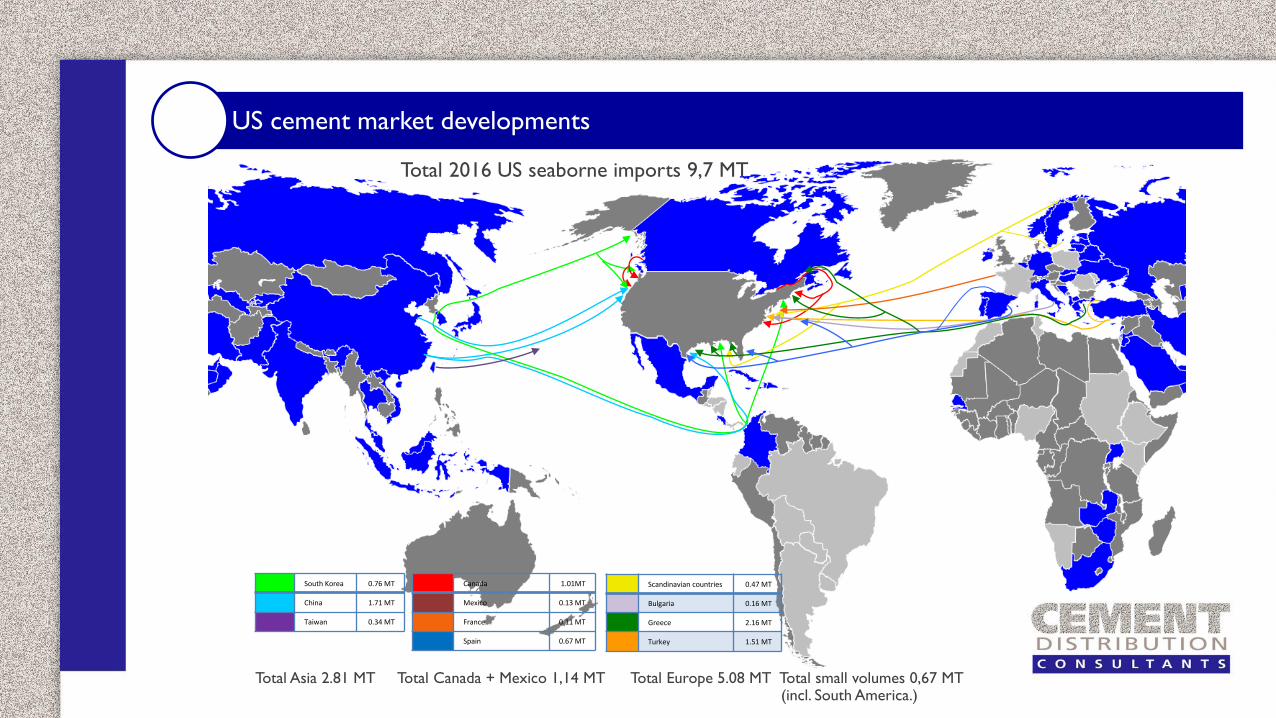
Total 2016 US seaborne imports 9,7 MT
South Korea 0.76 MT
China 1.71 MT
Taiwan 0.34 MT
Canada 1.01MT
Mexico 0.13 MT
France 0.11 MT
Spain 0.67 MT
Scandinavian countries 0.47 MT
Bulgaria 0.16 MT
Greece 2.16 MT
Turkey 1.51 MT
Total Asia 2.81 MT Total Canada + Mexico 1,14 MT Total Europe 5.08 MT Total small volumes 0,67 MT (incl. South America.)

US cement market developments
US seaborne cement imports which rapidly increased in 2014, 2015 and 2016 slowed down in 2017 with estimated cement imports staying about level with 2016 with a total of about 9,8 million tons to a total of about 10,5 million tons. The slowdown in growth is a bit against expectations. The regions that have slowed down most are the North West and Gulf area. The South West and North East are still growing more strongly.
Generally though expectations for the coming years are quite good with hopes that the figure of over 30 million tons of seaborne imports will be reached again in 5-7 years and might be even surpassed after that. The level of new terminal expansions and new buildings is a good indication of this.

What is happening with the existing US terminals?
“4 Key questions”
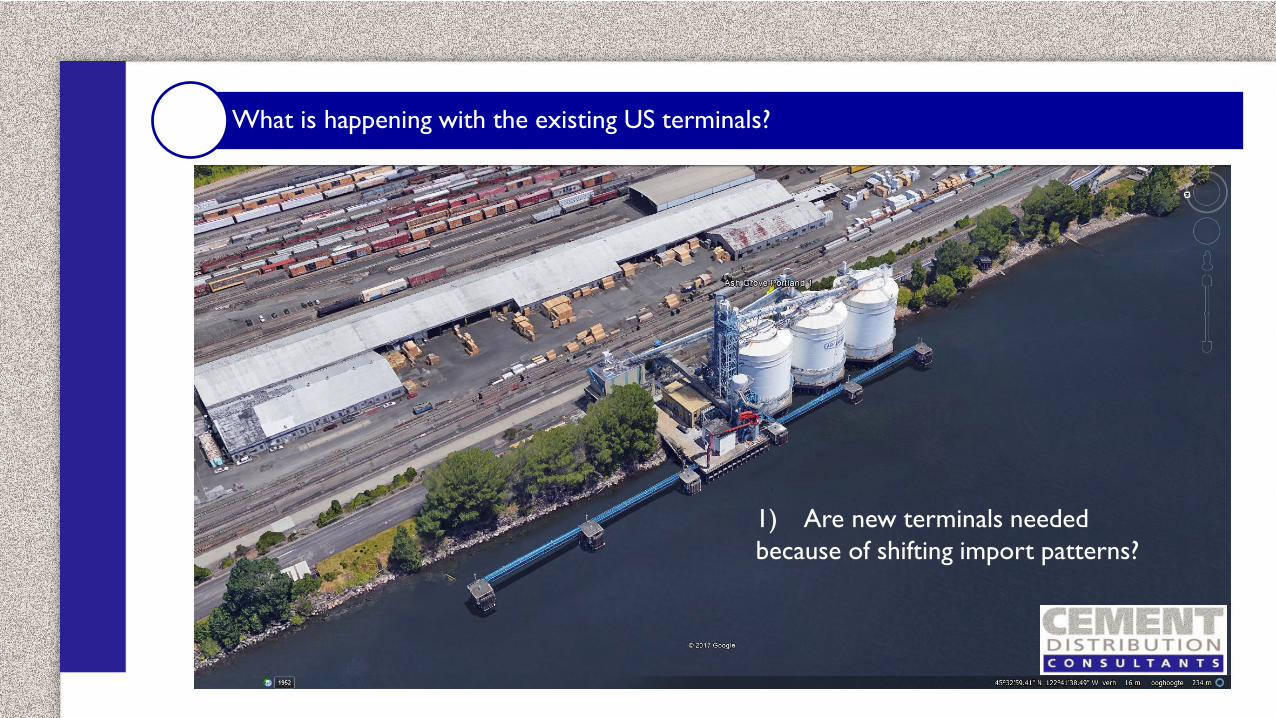
What is happening with the existing US terminals?
1) Are new terminals needed
because of shifting import patterns?
Nevada
Colorado
Wyoming
Washington
New Mexico
NJ
RI
Maine
Louisiana
Georgia
Tennessee
Missouri
Iowa
Wisconsin
Arkansas
Minnesota
Kansas
Nebraska
Oklahoma
South Dakota
North Dakota
Hawaii
Alaska
Puerto Rico
Montana
Texas
California
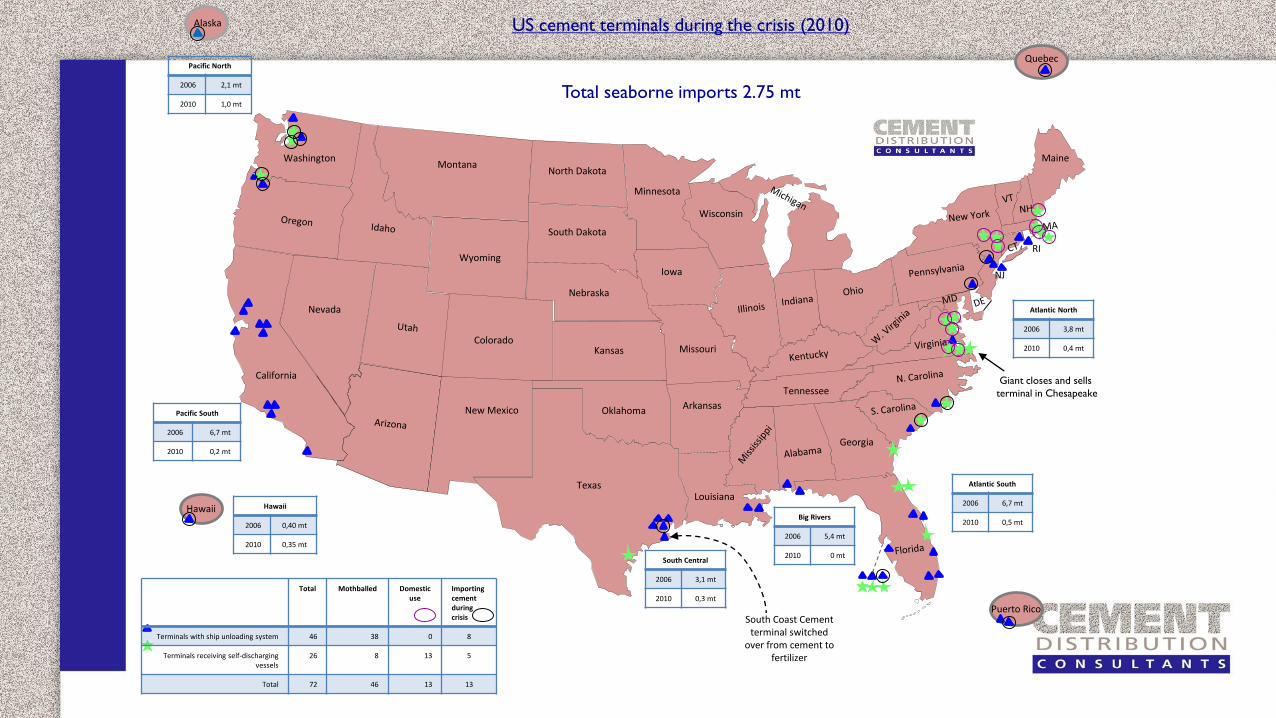
US cement terminals during the crisis (2010)
Total seaborne imports 2.75 mt
Quebec
Hawaii
2006 0,40 mt
2010 0,35 mt
South Central
2006 3,1 mt
2010 0,3 mt
Big Rivers
2006 5,4 mt
2010 0 mt
Atlantic South
2006 6,7 mt
2010 0,5 mt
Atlantic North
2006 3,8 mt
2010 0,4 mt
Pacific South
2006 6,7 mt
2010 0,2 mt
Pacific North
2006 2,1 mt
2010 1,0 mt
Total Mothballed Domestic use
Importing cement during crisis
Terminals with ship unloading system 46 38 0 8
Terminals receiving self-discharging vessels
26 8 13 5
Total 72 46 13 13
South Coast Cement terminal switched
over from cement to fertilizer
Giant closes and sells
terminal in Chesapeake
Nevada
Colorado
Wyoming
Washington
New Mexico
NJ
RI
Maine
Louisiana
Georgia
Tennessee
Missouri
Iowa
Wisconsin
Arkansas
Minnesota
Kansas
Nebraska
Oklahoma
South Dakota
North Dakota
Hawaii
Alaska
Puerto Rico
Montana
Texas
California
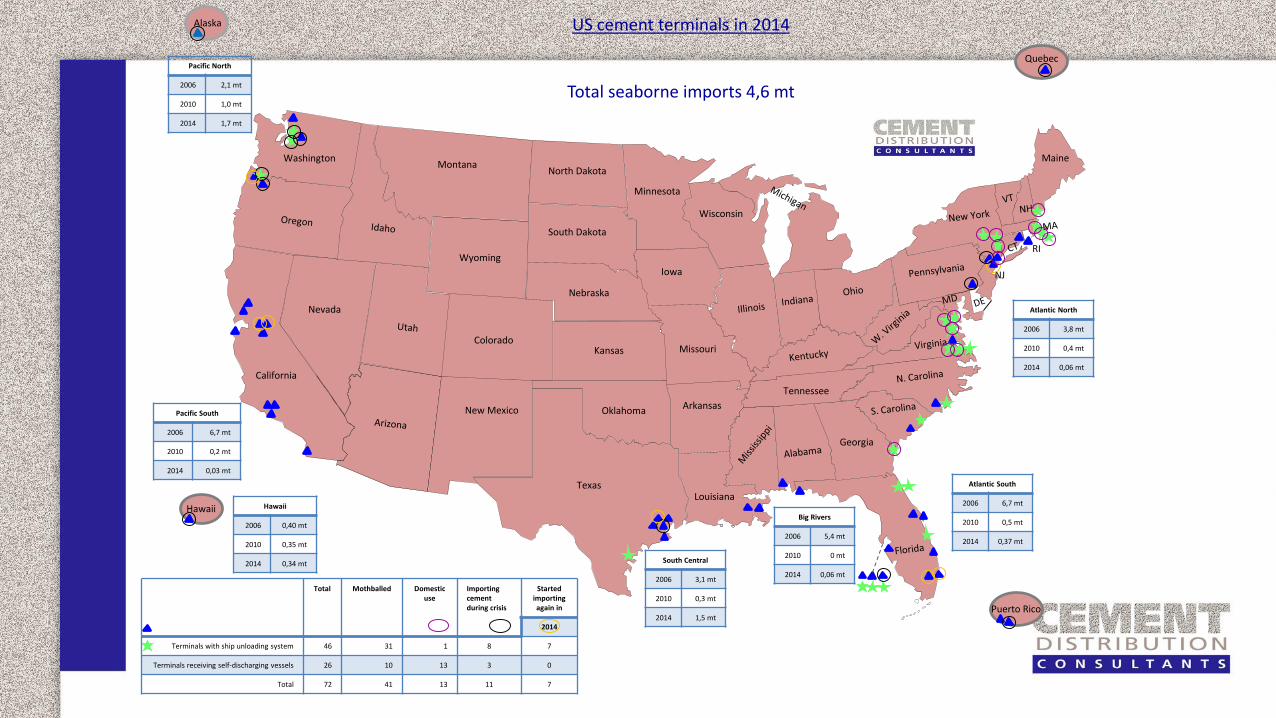
US cement terminals in 2014
Total seaborne imports 4,6 mt
Quebec
Hawaii
2006 0,40 mt
2010 0,35 mt
2014 0,34 mt South Central
2006 3,1 mt
2010 0,3 mt
2014 1,5 mt
Big Rivers
2006 5,4 mt
2010 0 mt
2014 0,06 mt
Atlantic South
2006 6,7 mt
2010 0,5 mt
2014 0,37 mt
Atlantic North
2006 3,8 mt
2010 0,4 mt
2014 0,06 mt
Pacific South
2006 6,7 mt
2010 0,2 mt
2014 0,03 mt
Pacific North
2006 2,1 mt
2010 1,0 mt
2014 1,7 mt
Total Mothballed Domestic use
Importing cement during crisis
Started importingagain in
2014
Terminals with ship unloading system 46 31 1 8 7
Terminals receiving self-discharging vessels 26 10 13 3 0
Total 72 41 13 11 7

Nevada
Colorado
Wyoming
Washington
New Mexico
NJ
RI
Maine
Louisiana
Georgia
Tennessee
Missouri
Iowa
Wisconsin
Arkansas
Minnesota
Kansas
Nebraska
Oklahoma
South Dakota
North Dakota
Hawaii
Alaska
Puerto Rico
Montana
Texas
California
US cement terminals in 2015
Total seaborne imports 7,48 mt
Quebec
Hawaii
2006 0,40 mt
2010 0,35 mt
2014 0,34 mt
2015 0,43 mt South Central
2006 3,1 mt
2010 0,3 mt
2014 1,5 mt
2015 2,2 mt
Big Rivers
2006 5,4 mt
2010 0 mt
2014 0,06 mt
2015 0,13 mt
Atlantic South
2006 6,7 mt
2010 0,5 mt
2014 0,37 mt
2015 0,92 mt
Atlantic North
2006 3,8 mt
2010 0,4 mt
2014 0,06 mt
2015 1,4 mt
Pacific South
2006 6,7 mt
2010 0,2 mt
2014 0,03 mt
2015 0,43 mt
Pacific North
2006 2,1 mt
2010 1,0 mt
2014 1,7 mt
2015 1,97 mt
Total Mothballed Domestic use
Importing cement during crisis
Started importing again in
2014 2015
Terminals with ship unloading system 45 20 1 8 7 9
Terminals receiving self-discharging vessels 25 8 13 3 0 1
Total 70 28 14 11 7 10
Cemex closes terminal
and acquires Holcim
terminalArgos adds ship
unloader to Houston
terminal
NYEMCO opens
again and receives
domestic cement
Nevada
Colorado
Wyoming
Washington
New Mexico
NJ
RI
Maine
Louisiana
Georgia
Tennessee
Missouri
Iowa
Wisconsin
Arkansas
Minnesota
Kansas
Nebraska
Oklahoma
South Dakota
North Dakota
Hawaii
Alaska
Puerto Rico
Montana
Texas
California
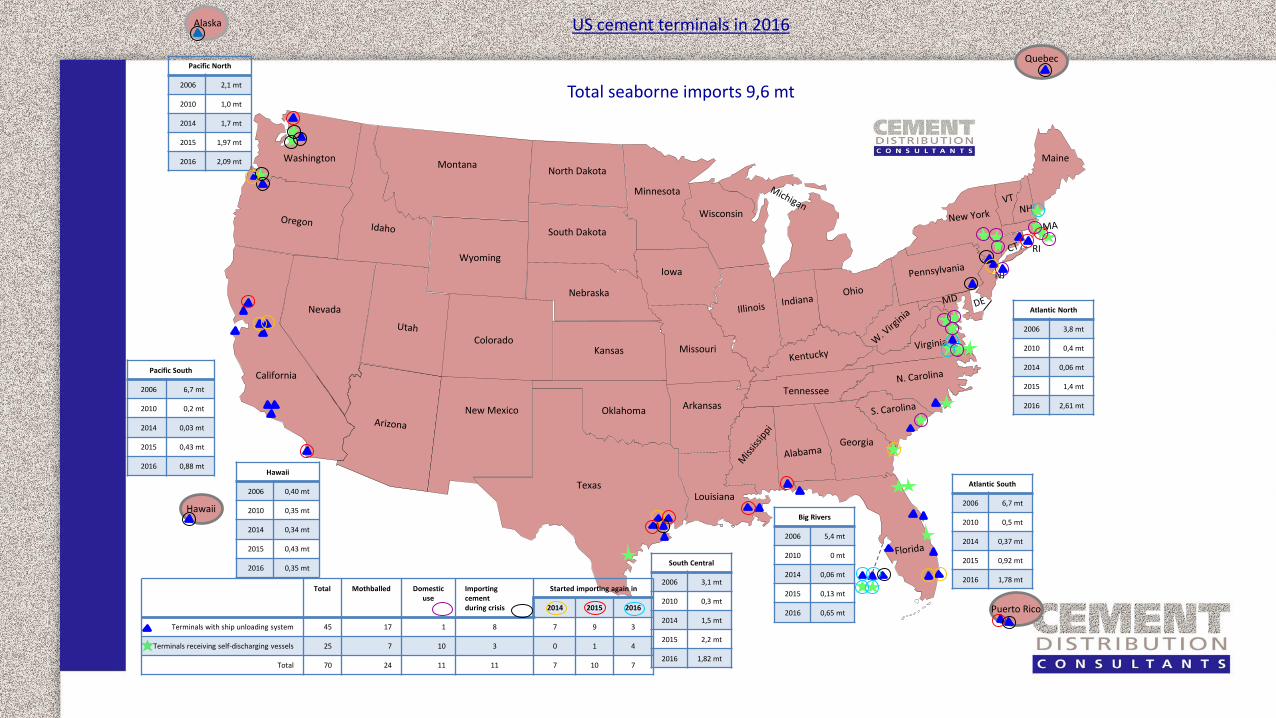
US cement terminals in 2016
Total seaborne imports 9,6 mt
Quebec
Hawaii
2006 0,40 mt
2010 0,35 mt
2014 0,34 mt
2015 0,43 mt
2016 0,35 mtSouth Central
2006 3,1 mt
2010 0,3 mt
2014 1,5 mt
2015 2,2 mt
2016 1,82 mt
Big Rivers
2006 5,4 mt
2010 0 mt
2014 0,06 mt
2015 0,13 mt
2016 0,65 mt
Atlantic South
2006 6,7 mt
2010 0,5 mt
2014 0,37 mt
2015 0,92 mt
2016 1,78 mt
Atlantic North
2006 3,8 mt
2010 0,4 mt
2014 0,06 mt
2015 1,4 mt
2016 2,61 mt
Pacific South
2006 6,7 mt
2010 0,2 mt
2014 0,03 mt
2015 0,43 mt
2016 0,88 mt
Pacific North
2006 2,1 mt
2010 1,0 mt
2014 1,7 mt
2015 1,97 mt
2016 2,09 mt
Total Mothballed Domestic use
Importing cement during crisis
Started importing again in
2014 2015 2016
Terminals with ship unloading system 45 17 1 8 7 9 3
Terminals receiving self-discharging vessels 25 7 10 3 0 1 4
Total 70 24 11 11 7 10 7
Nevada
Colorado
Wyoming
Washington
New Mexico
NJ
RI
Maine
Louisiana
Georgia
Tennessee
Missouri
Iowa
Wisconsin
Arkansas
Minnesota
Kansas
Nebraska
Oklahoma
South Dakota
North Dakota
Hawaii
Alaska
Puerto Rico
Montana
Texas
California
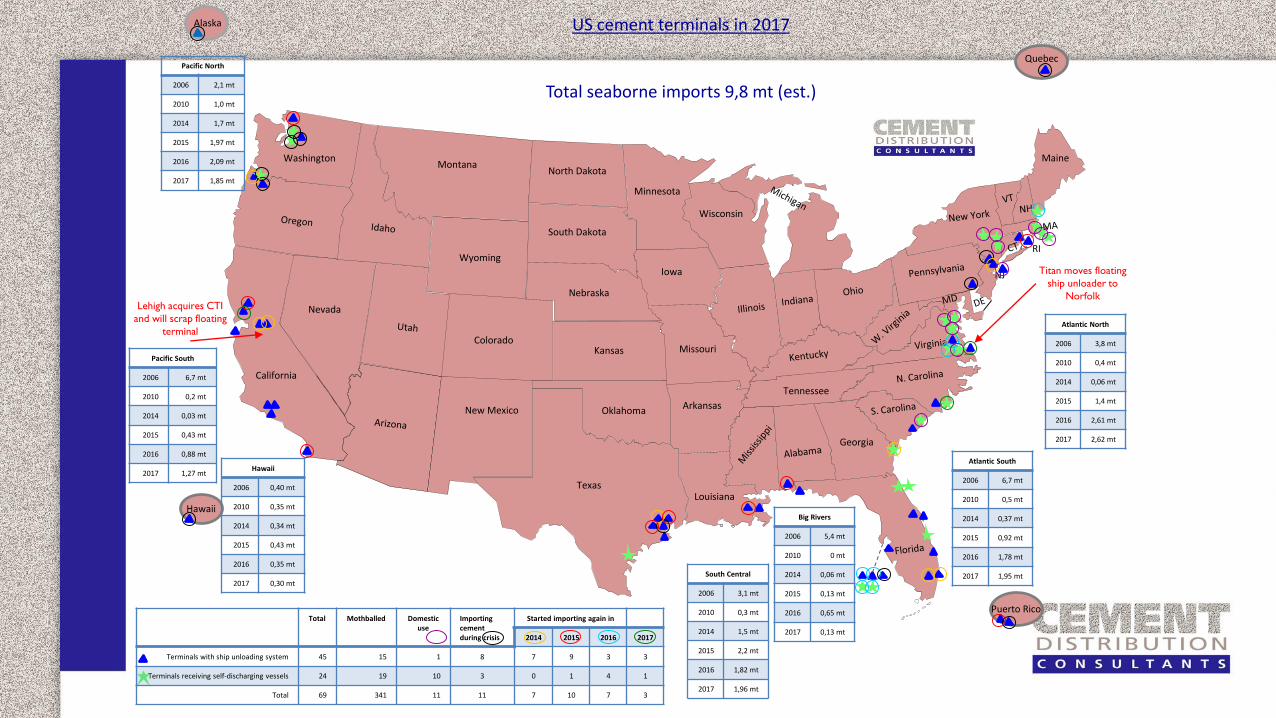
US cement terminals in 2017
Total seaborne imports 9,8 mt (est.)
Quebec
Hawaii
2006 0,40 mt
2010 0,35 mt
2014 0,34 mt
2015 0,43 mt
2016 0,35 mt
2017 0,30 mtSouth Central
2006 3,1 mt
2010 0,3 mt
2014 1,5 mt
2015 2,2 mt
2016 1,82 mt
2017 1,96 mt
Big Rivers
2006 5,4 mt
2010 0 mt
2014 0,06 mt
2015 0,13 mt
2016 0,65 mt
2017 0,13 mt
Atlantic South
2006 6,7 mt
2010 0,5 mt
2014 0,37 mt
2015 0,92 mt
2016 1,78 mt
2017 1,95 mt
Atlantic North
2006 3,8 mt
2010 0,4 mt
2014 0,06 mt
2015 1,4 mt
2016 2,61 mt
2017 2,62 mt
Pacific South
2006 6,7 mt
2010 0,2 mt
2014 0,03 mt
2015 0,43 mt
2016 0,88 mt
2017 1,27 mt
Pacific North
2006 2,1 mt
2010 1,0 mt
2014 1,7 mt
2015 1,97 mt
2016 2,09 mt
2017 1,85 mt
Total Mothballed Domestic use
Importing cement during crisis
Started importing again in
2014 2015 2016 2017
Terminals with ship unloading system 45 15 1 8 7 9 3 3
Terminals receiving self-discharging vessels 24 19 10 3 0 1 4 1
Total 69 341 11 11 7 10 7 3
Titan moves floating
ship unloader to
NorfolkLehigh acquires CTI
and will scrap floating
terminal

What is happening with the existing US terminals?
1) Are new terminals needed because of
shifting import patterns?
No, although import patterns are shifting
somewhat, the existing terminals are still
sufficient to handle the volumes.

What is happening with the existing US terminals?
2) Are new terminals needed because of an unbalanced
ownership situation?
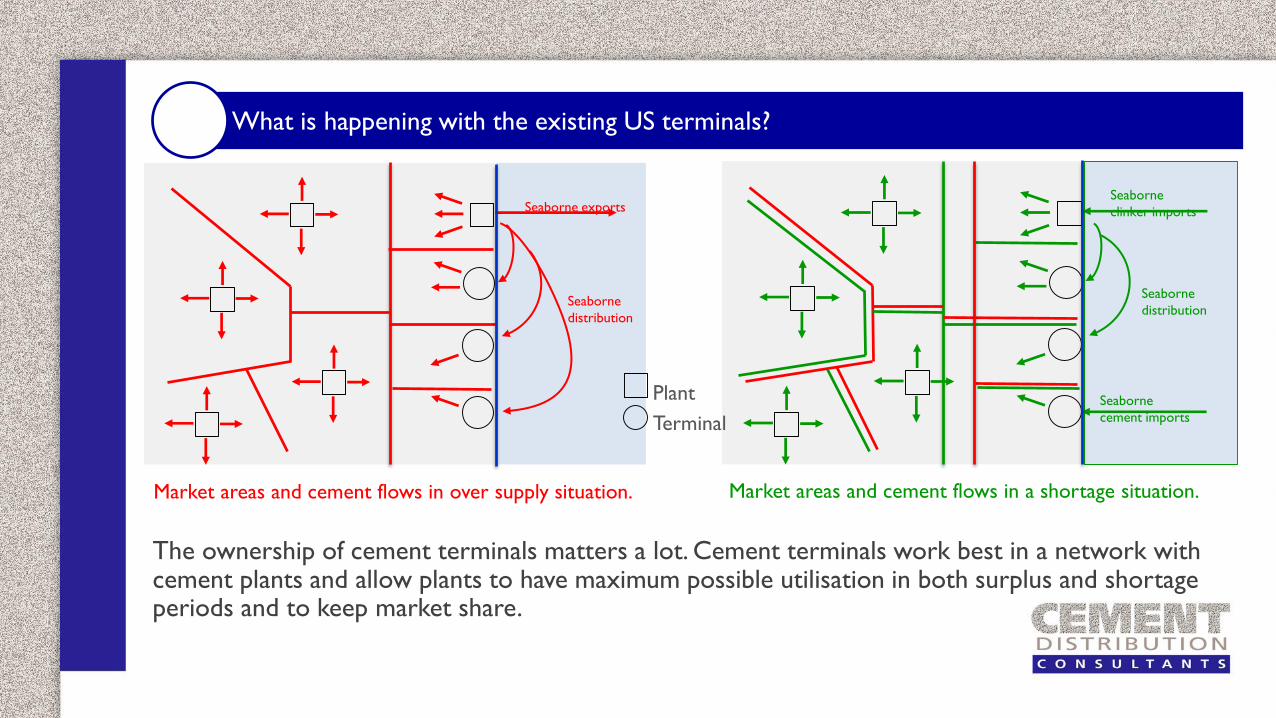
What is happening with the existing US terminals?
Seaborne exports
Seaborne
distribution
Seaborne
clinker imports
Seaborne
cement imports
Seaborne
distribution
Plant
Terminal
Market areas and cement flows in over supply situation. Market areas and cement flows in a shortage situation.
The ownership of cement terminals matters a lot. Cement terminals work best in a network with cement plants and allow plants to have maximum possible utilisation in both surplus and shortage periods and to keep market share.
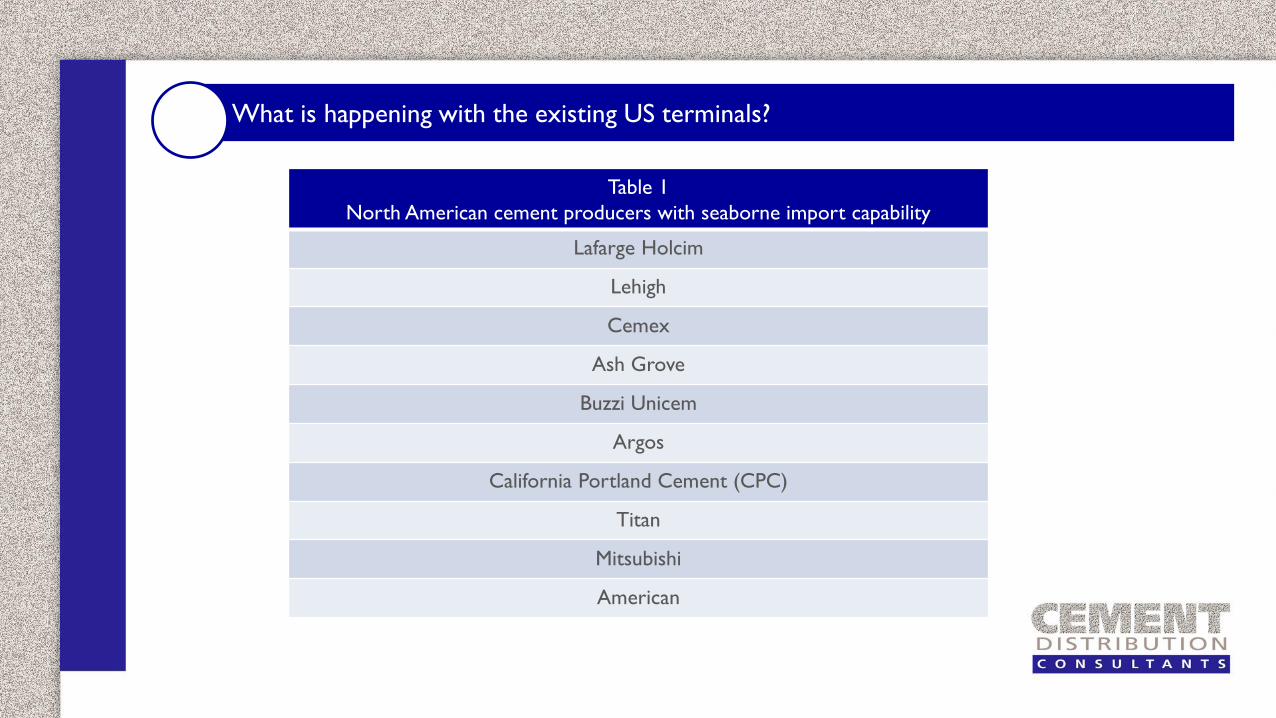
What is happening with the existing US terminals?
Table 1
North American cement producers with seaborne import capability
Lafarge Holcim
Lehigh
Cemex
Ash Grove
Buzzi Unicem
Argos
California Portland Cement (CPC)
Titan
Mitsubishi
American

What is happening with the existing US terminals?
Table 2
North American cement producers without
seaborne import capability
Eagle Materials Federal White
St. Marys (Votorantim Drake
CRH Colacem
GCC Armstrong
Martin Marietta Capital
Giant Royal
National Sumter
Continental
Quebec
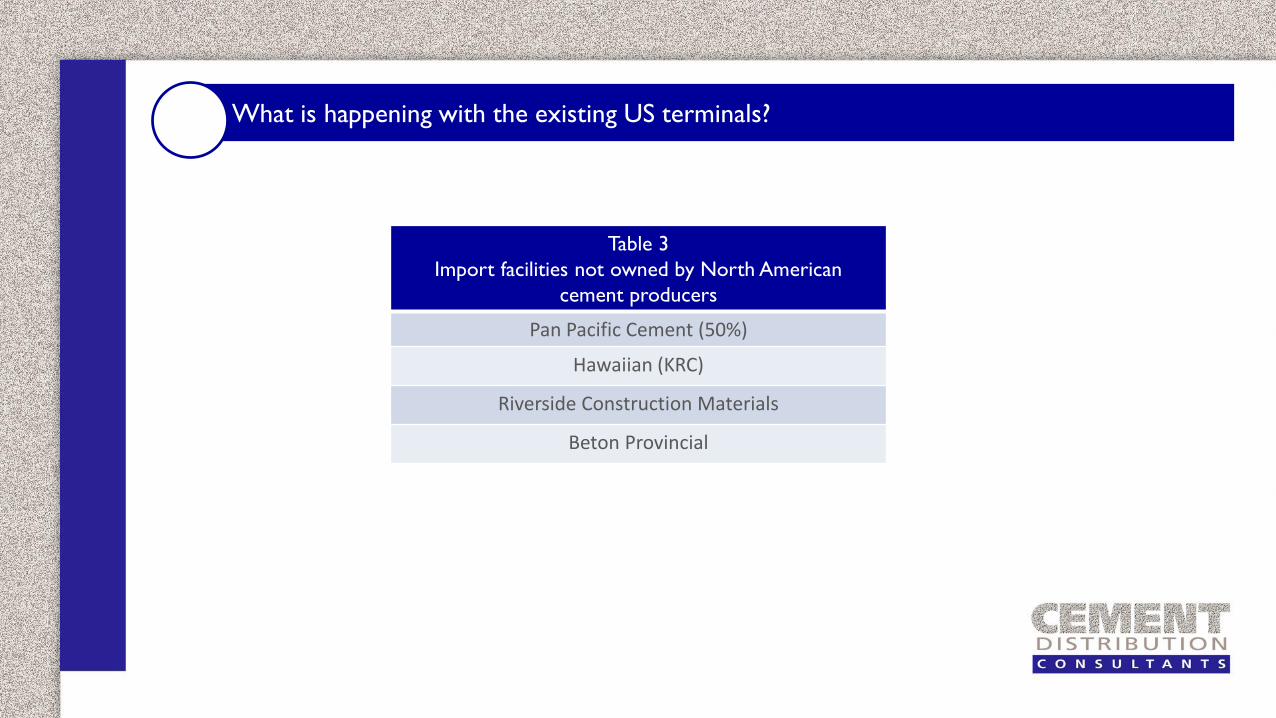
What is happening with the existing US terminals?
Table 3
Import facilities not owned by North American
cement producers
Pan Pacific Cement (50%)
Hawaiian (KRC)
Riverside Construction Materials
Beton Provincial
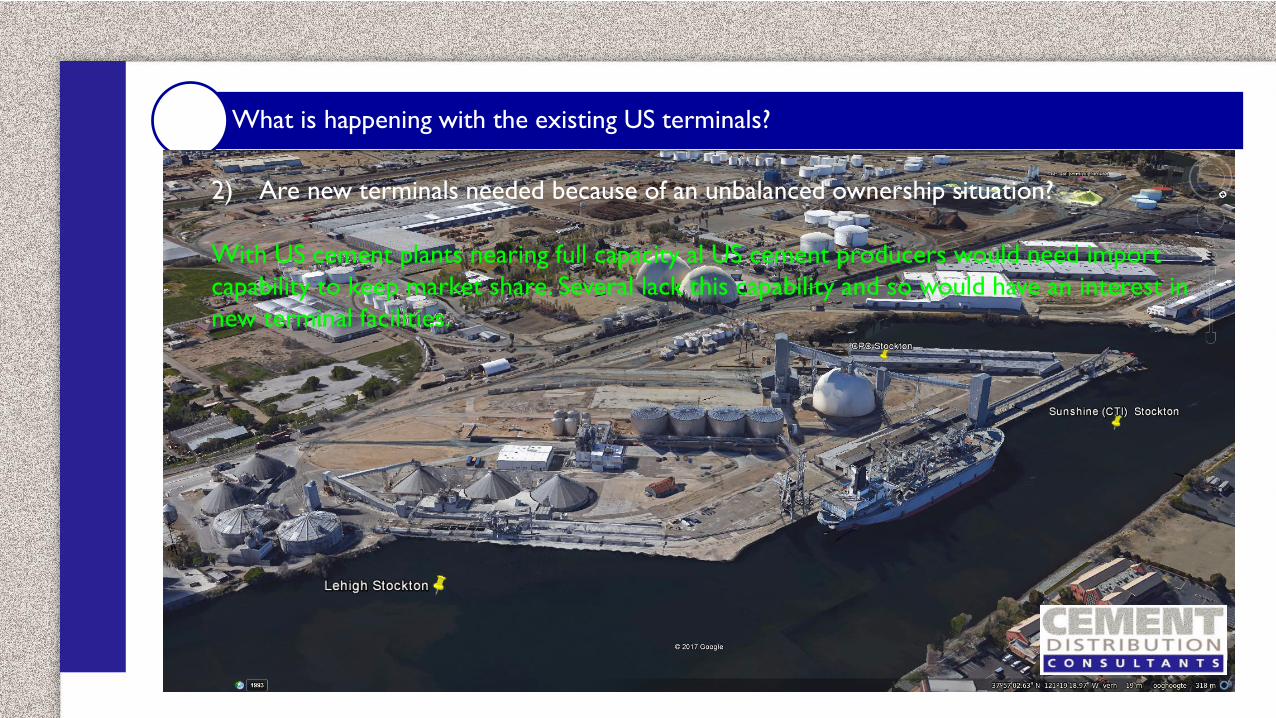
What is happening with the existing US terminals?
2) Are new terminals needed because of an unbalanced ownership situation?
With US cement plants nearing full capacity al US cement producers would need import
capability to keep market share. Several lack this capability and so would have an interest in
new terminal facilities.
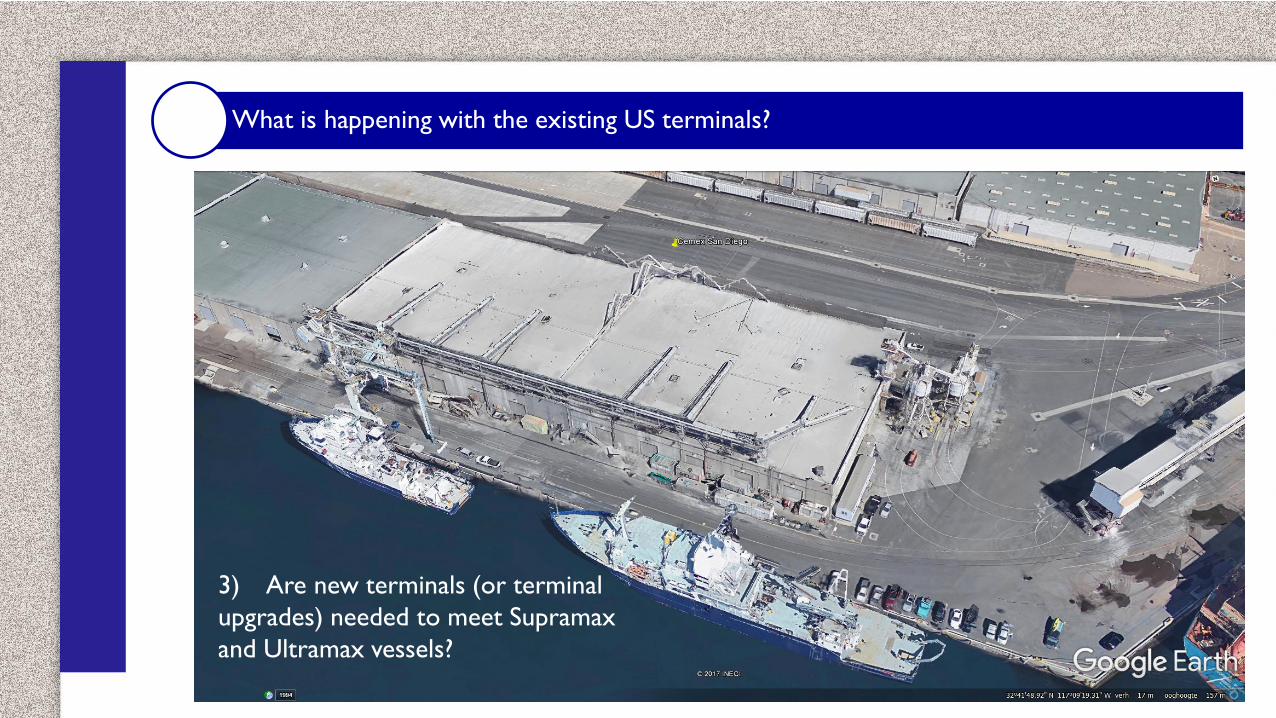
What is happening with the existing US terminals?
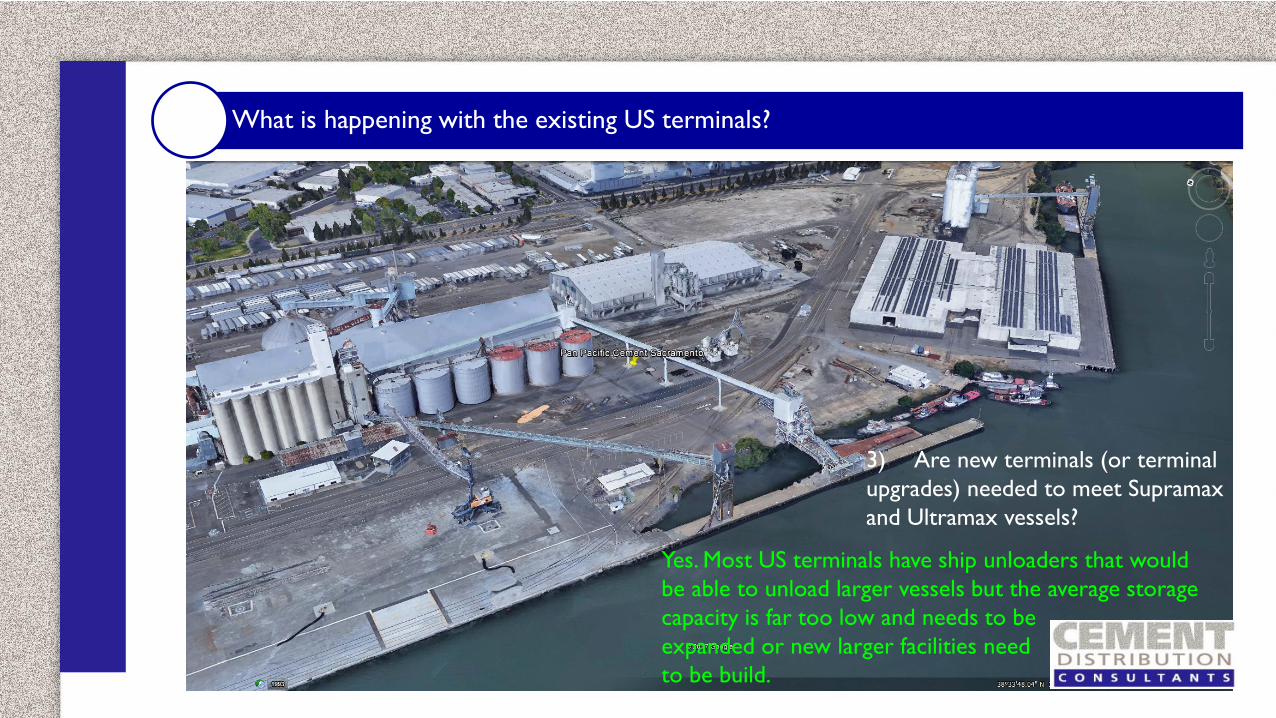
3) Are new terminals (or terminal
upgrades) needed to meet Supramax
and Ultramax vessels?
What is happening with the existing US terminals?
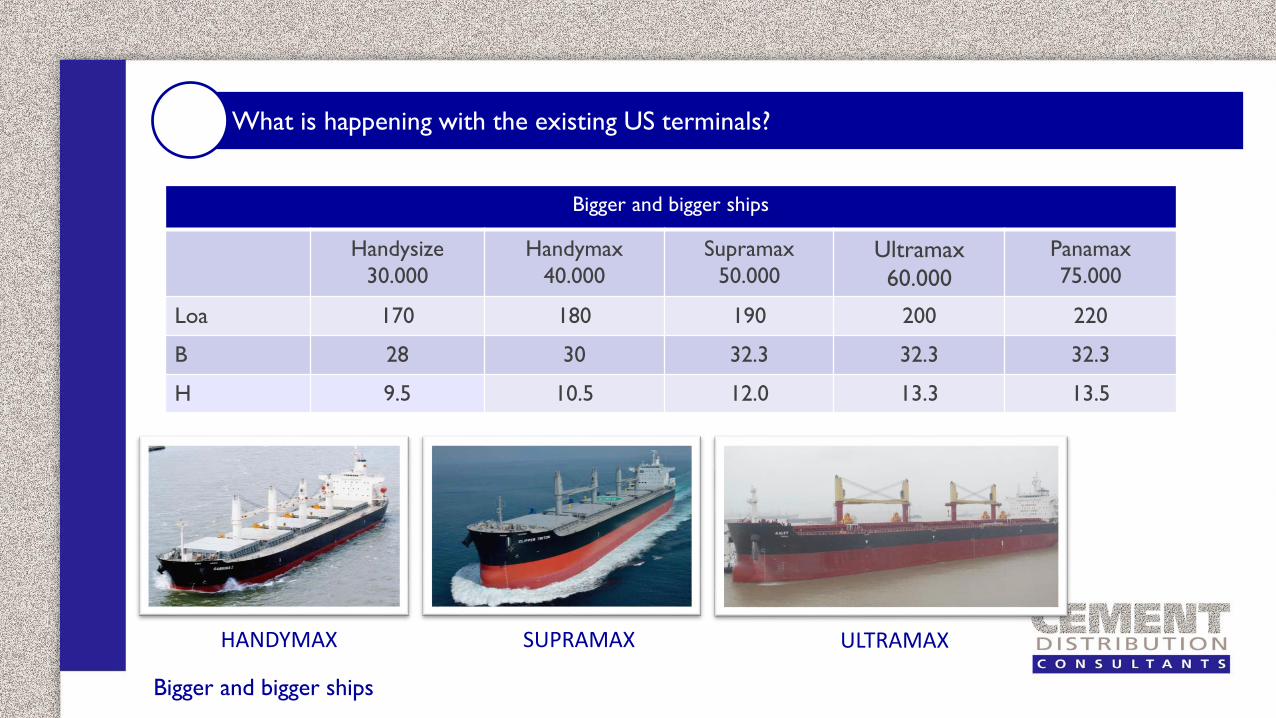
Bigger and bigger ships
Handysize
30.000
Handymax
40.000
Supramax
50.000Ultramax
60.000
Panamax
75.000
Loa 170 180 190 200 220
B 28 30 32.3 32.3 32.3
H 9.5 10.5 12.0 13.3 13.5
ULTRAMAXSUPRAMAXHANDYMAX
Bigger and bigger ships

What is happening with the existing US terminals?
Required storage capacity
Ship type Cargo
capacity
250.000
tpy
500.000
tpy750.000
tpy
1.000.000
tpy
Handysize 30.000 37.705 45.411 53.116 60.822
Handymax 40.000 46.849 53.699 60.548 67.397
Supramax 50.000 55.993 61.986 67.979 73.973
Ultramax 60.000 65.137 70.274 75.411 80.548
Panamax 75.000 78.853 82.705 86.558 90.411
Based on 15 days of buffer capacity and a ship unloading rate of 8.000 tpd
When multiple cement types are imported a calculation has to be made for every material separately
Required storage sizes
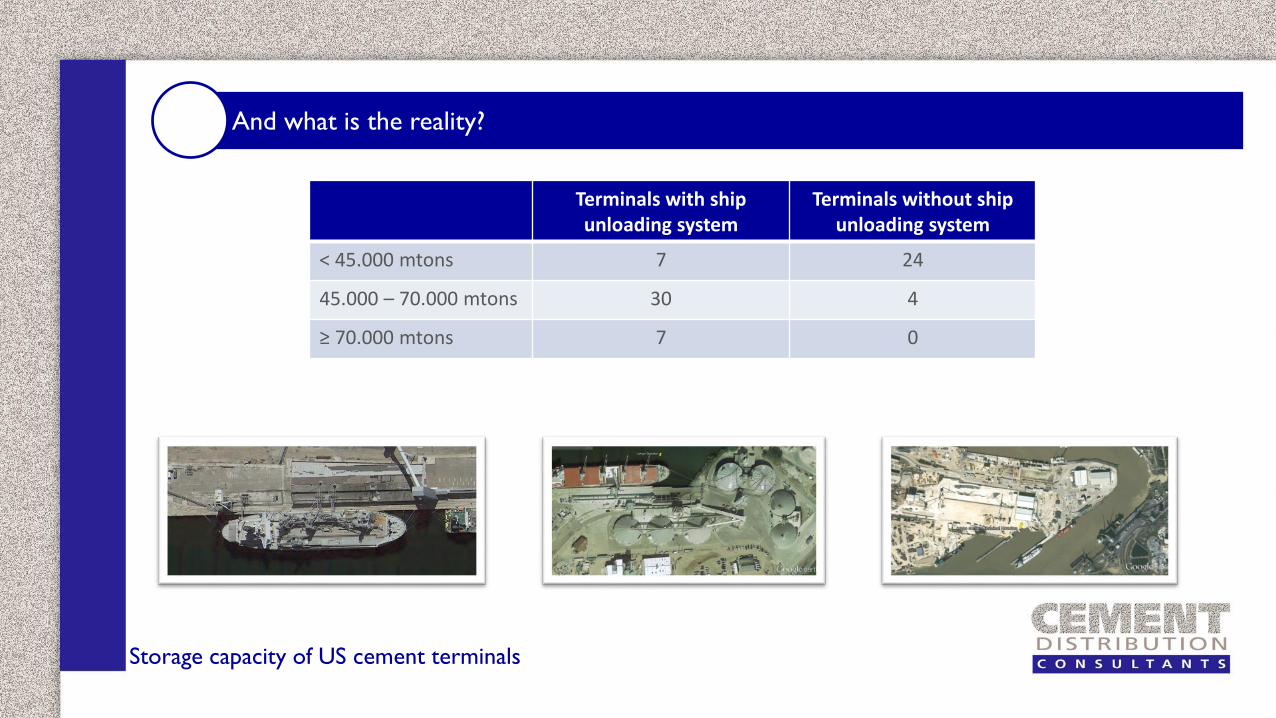
And what is the reality?
Storage capacity of US cement terminals
Terminals with ship unloading system
Terminals without ship unloading system
< 45.000 mtons 7 24
45.000 – 70.000 mtons 30 4
≥ 70.000 mtons 7 0
Nevada
Colorado
Wyoming
Washington
New Mexico
NJ
RI
Maine
Louisiana
Georgia
Tennessee
Missouri
Iowa
Wisconsin
Arkansas
Minnesota
Kansas
Nebraska
Oklahoma
South Dakota
North Dakota
Hawaii
Puerto Rico
Montana
Texas
California
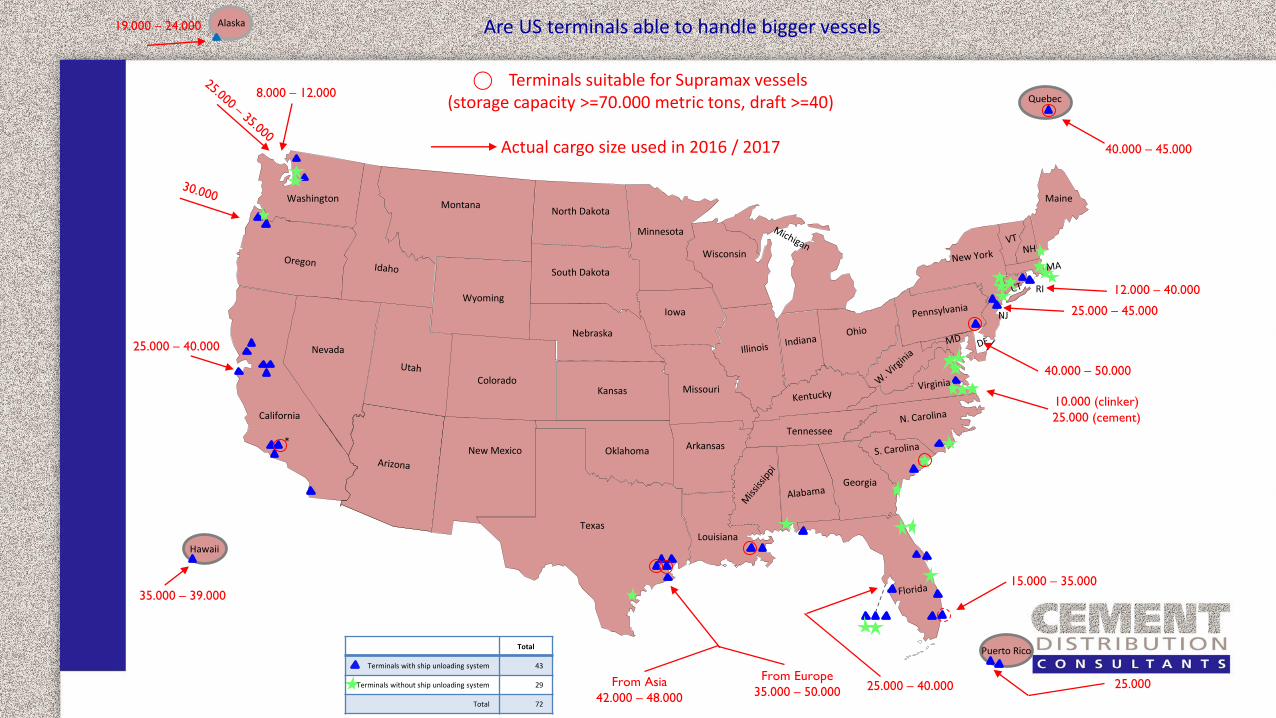
Are US terminals able to handle bigger vessels
Quebec
*
⃝ Terminals suitable for Supramax vessels(storage capacity >=70.000 metric tons, draft >=40)
Actual cargo size used in 2016 / 2017
Total
Terminals with ship unloading system 43
Terminals without ship unloading system 29
Total 72
Alaska
8.000 – 12.000
35.000 – 39.000
25.000 – 40.000
19.000 – 24.000
40.000 – 45.000
25.000 – 45.000
40.000 – 50.000
15.000 – 35.000
10.000 (clinker)
25.000 (cement)
12.000 – 40.000
25.000 – 40.000 25.000From Asia
42.000 – 48.000
From Europe
35.000 – 50.000
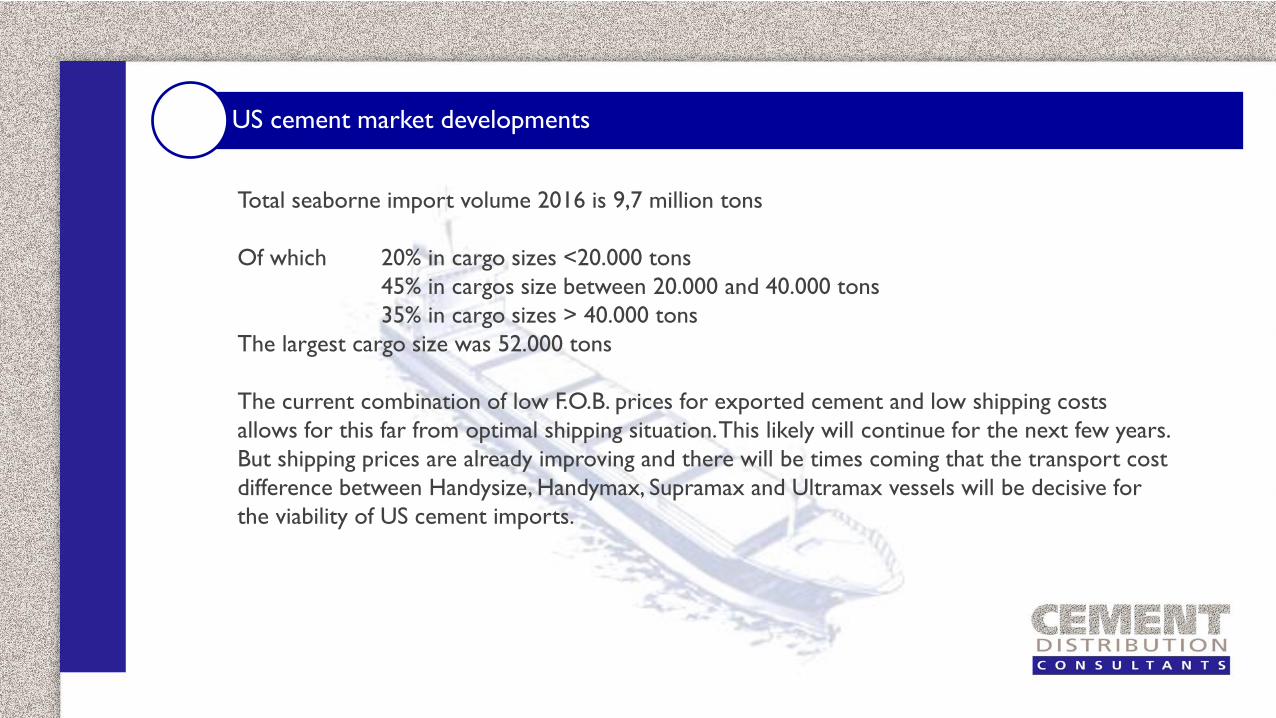
US cement market developments
Total seaborne import volume 2016 is 9,7 million tons
Of which 20% in cargo sizes <20.000 tons
45% in cargos size between 20.000 and 40.000 tons
35% in cargo sizes > 40.000 tons
The largest cargo size was 52.000 tons
The current combination of low F.O.B. prices for exported cement and low shipping costs
allows for this far from optimal shipping situation. This likely will continue for the next few years.
But shipping prices are already improving and there will be times coming that the transport cost
difference between Handysize, Handymax, Supramax and Ultramax vessels will be decisive for
the viability of US cement imports.
What is happening with the existing US terminals?
3) Are new terminals (or terminal
upgrades) needed to meet Supramax
and Ultramax vessels?
Yes. Most US terminals have ship unloaders that would
be able to unload larger vessels but the average storage
capacity is far too low and needs to be
expanded or new larger facilities need
to be build.
What is happening with the existing US terminals?
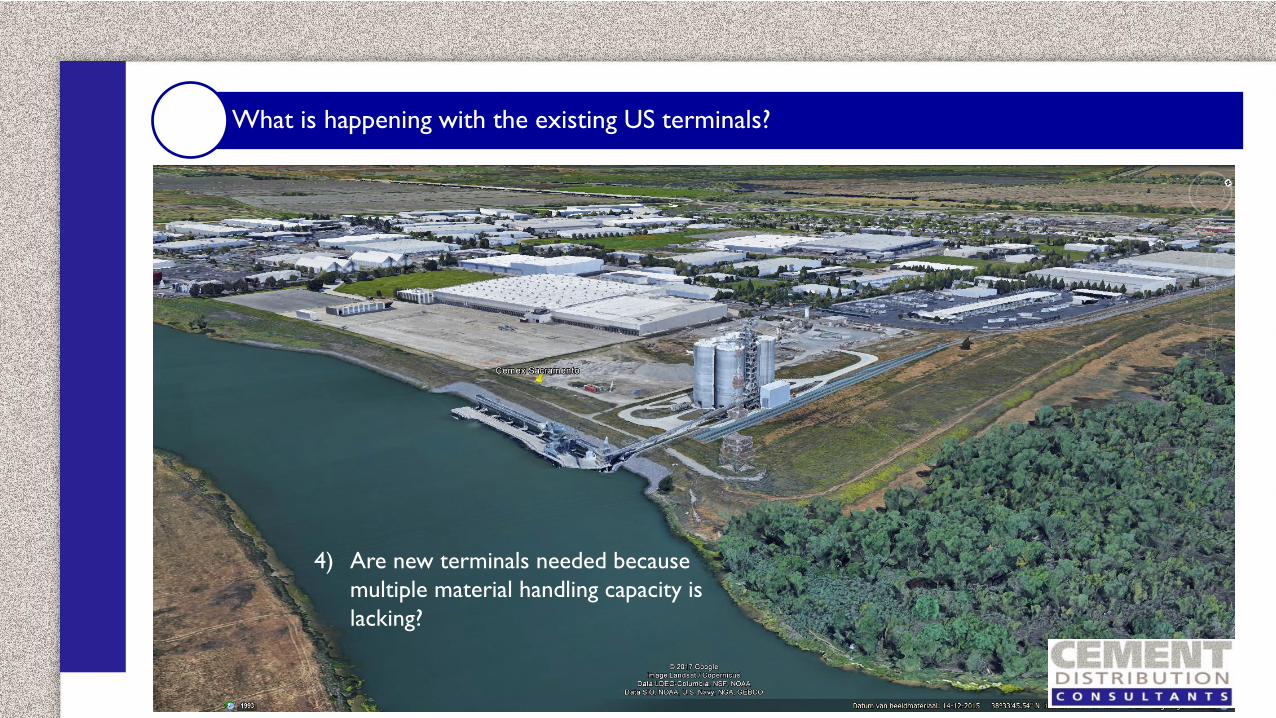
4) Are new terminals needed because
multiple material handling capacity is
lacking?

What is happening with the existing US terminals?
4) Are new terminals needed because multiple
material handling capacity is lacking?
When multiple materials can be imported as partial cargo
(being part of a cement shipment) about 50% of North
American import terminals would be able to do so. When
multiple materials would arrive in separate shipments (of at
least 15.000 tons) only about 4-5 would have this capability.
What is happening with the existing US terminals?
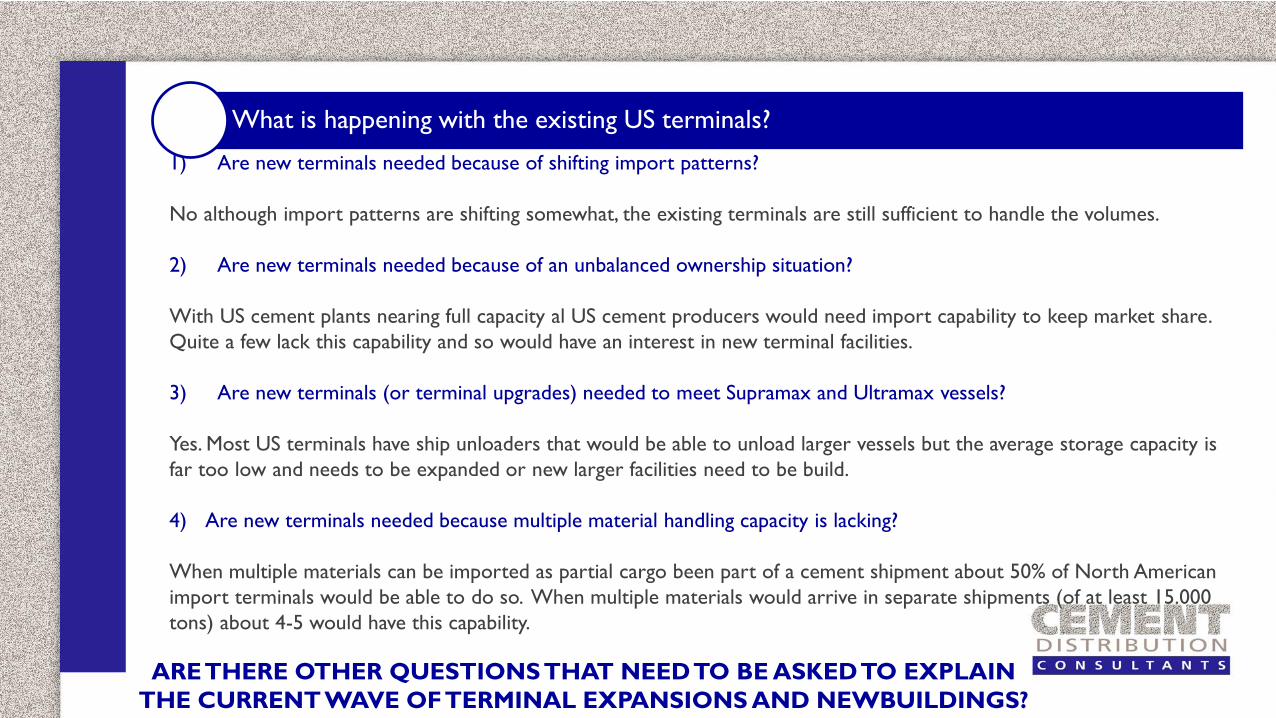
1) Are new terminals needed because of shifting import patterns?
No although import patterns are shifting somewhat, the existing terminals are still sufficient to handle the volumes.
2) Are new terminals needed because of an unbalanced ownership situation?
With US cement plants nearing full capacity al US cement producers would need import capability to keep market share.
Quite a few lack this capability and so would have an interest in new terminal facilities.
3) Are new terminals (or terminal upgrades) needed to meet Supramax and Ultramax vessels?
Yes. Most US terminals have ship unloaders that would be able to unload larger vessels but the average storage capacity is
far too low and needs to be expanded or new larger facilities need to be build.
4) Are new terminals needed because multiple material handling capacity is lacking?
When multiple materials can be imported as partial cargo been part of a cement shipment about 50% of North American
import terminals would be able to do so. When multiple materials would arrive in separate shipments (of at least 15.000
tons) about 4-5 would have this capability.
ARE THERE OTHER QUESTIONS THAT NEED TO BE ASKED TO EXPLAIN
THE CURRENT WAVE OF TERMINAL EXPANSIONS AND NEWBUILDINGS?

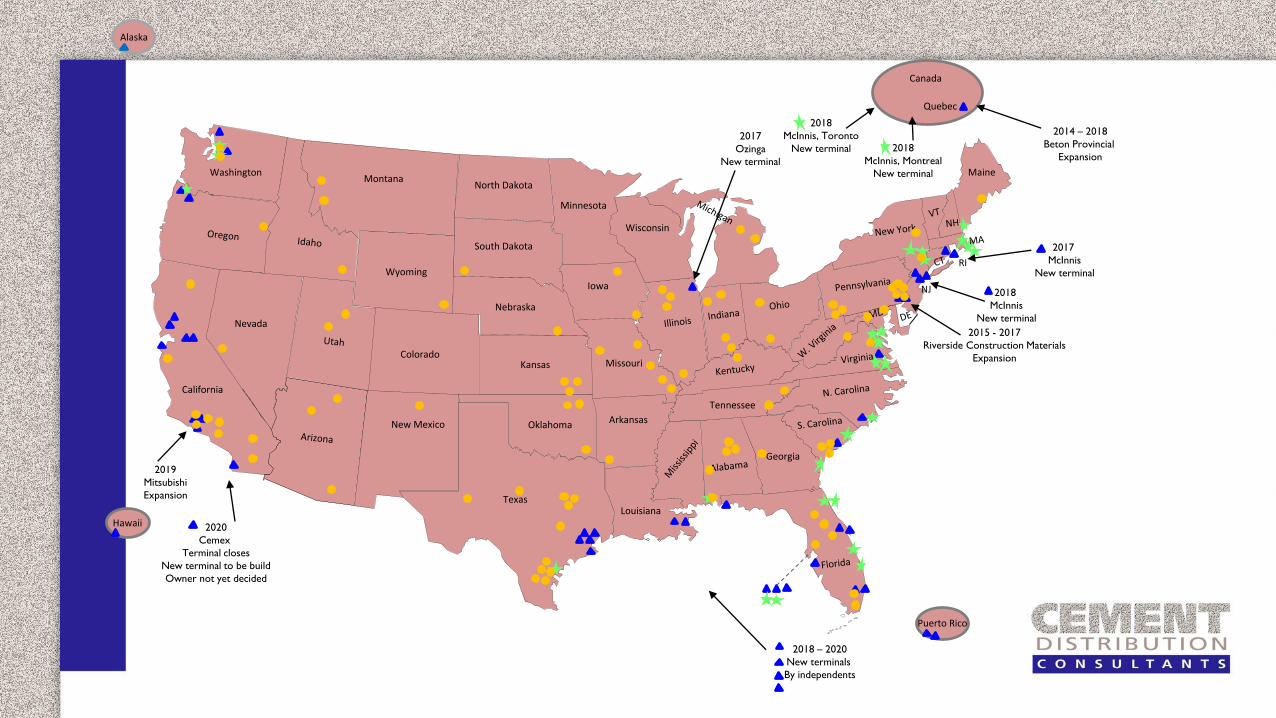
What is behind the new terminal construction?
Nevada
Colorado
Wyoming
Washington
New Mexico
NJ
RI
Maine
Louisiana
Georgia
Tennessee
Missouri
Iowa
Wisconsin
Arkansas
Minnesota
Kansas
Nebraska
Oklahoma
South Dakota
North Dakota
Hawaii
Alaska
Puerto Rico
Montana
Texas
California
Quebec
2014 – 2018
Beton Provincial
Expansion
2017
McInnis
New terminal
2017
Ozinga
New terminal
2018
McInnis, Montreal
New terminal
2018
McInnis, Toronto
New terminal
2018
McInnis
New terminal
2015 - 2017
Riverside Construction Materials
Expansion
2018 – 2020
New terminals
By independents
2019
Mitsubishi
Expansion
2020
Cemex
Terminal closes
New terminal to be build
Owner not yet decided
Canada

Current design philosophies

Current design philosophies
YOUR “PLANS”
THE UNIVERSE’S PLANS FOR YOU
“And the very same applies to business plans for cement import terminals
and the reality when they have been built”
Planning and reality
Current design philosophies
0
5,000
10,000
15,000
20,000
25,000
30,000
35,000
40,000
Imports (1.000 mt)
Source: Global Cement Report
Seaborne imports
Imports via GL +
rail Canada +
Mexico
A bit of history of US cement imports
Current design philosophies
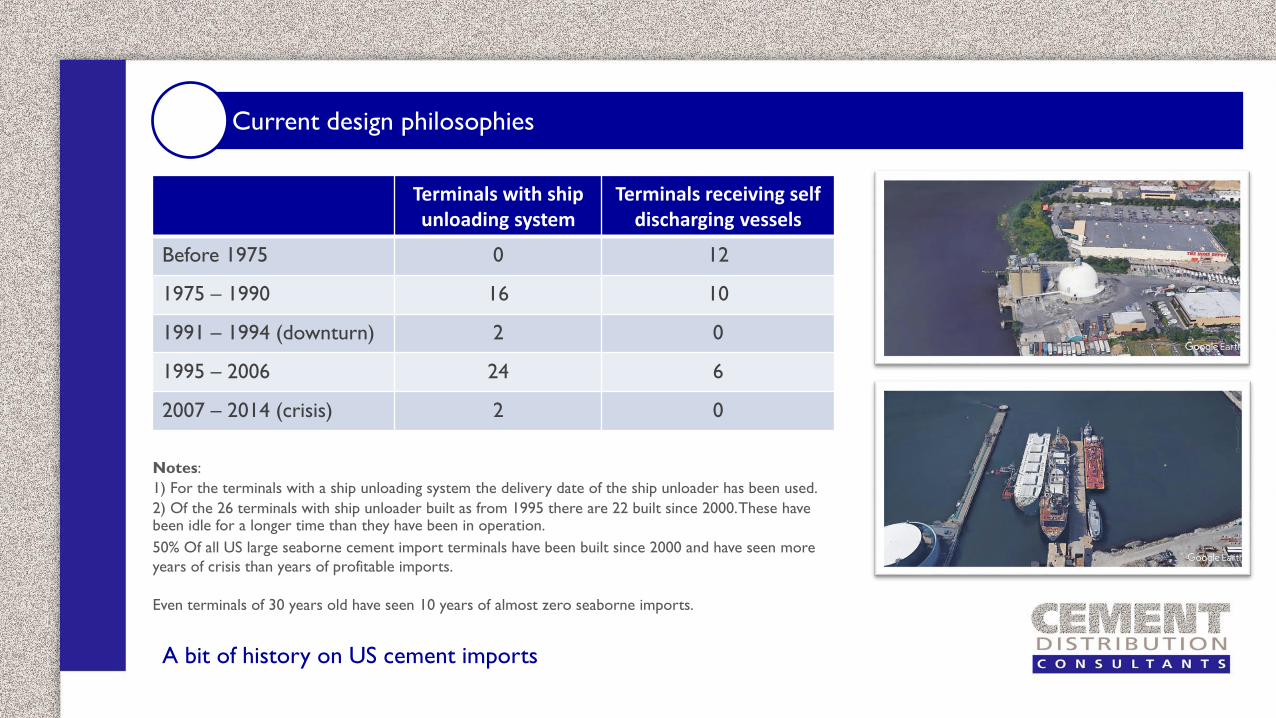
Terminals with ship unloading system
Terminals receiving self discharging vessels
Before 1975 0 12
1975 – 1990 16 10
1991 – 1994 (downturn) 2 0
1995 – 2006 24 6
2007 – 2014 (crisis) 2 0
Notes:
1) For the terminals with a ship unloading system the delivery date of the ship unloader has been used.
2) Of the 26 terminals with ship unloader built as from 1995 there are 22 built since 2000. These have been idle for a longer time than they have been in operation.
50% Of all US large seaborne cement import terminals have been built since 2000 and have seen more
years of crisis than years of profitable imports.
Even terminals of 30 years old have seen 10 years of almost zero seaborne imports.
A bit of history on US cement imports
Current design guidelines
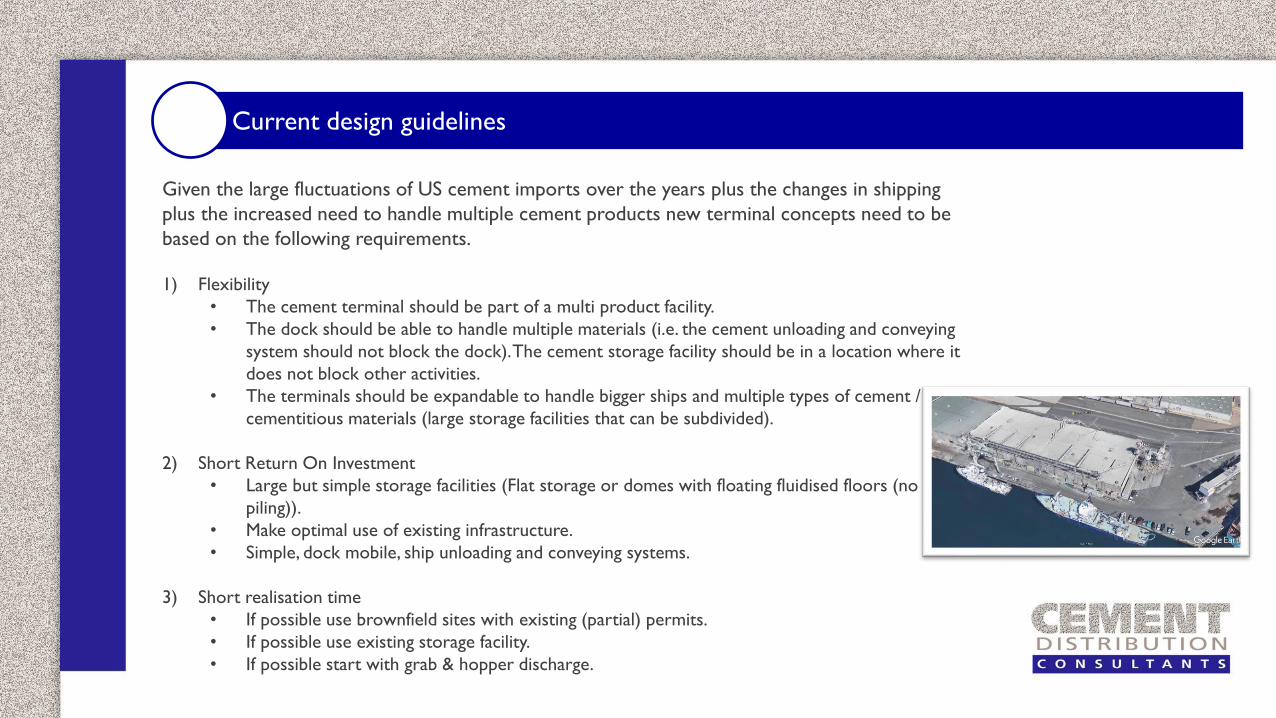
Given the large fluctuations of US cement imports over the years plus the changes in shipping
plus the increased need to handle multiple cement products new terminal concepts need to be
based on the following requirements.
1) Flexibility
• The cement terminal should be part of a multi product facility.
• The dock should be able to handle multiple materials (i.e. the cement unloading and conveying
system should not block the dock). The cement storage facility should be in a location where it
does not block other activities.
• The terminals should be expandable to handle bigger ships and multiple types of cement /
cementitious materials (large storage facilities that can be subdivided).
2) Short Return On Investment
• Large but simple storage facilities (Flat storage or domes with floating fluidised floors (no
piling)).
• Make optimal use of existing infrastructure.
• Simple, dock mobile, ship unloading and conveying systems.
3) Short realisation time
• If possible use brownfield sites with existing (partial) permits.
• If possible use existing storage facility.
• If possible start with grab & hopper discharge.

Current design guidelines
Very large storage facility
Supramax vessels
possible
Floating dock with pneumatic
Unloader for cementitious materials and
hoppers and belt conveyor system for
general bulk material.
Domes with “floating
fluidised floor. (No piling)
Multiple product truck
loading possible
Terminal design concepts
Riverside Construction Materials, Bristol, PA
Largest cement terminal in the world
(170.000 tons storage).
Capable to handle 3 types of cement or
cementitious materials as well as general bulk
products.
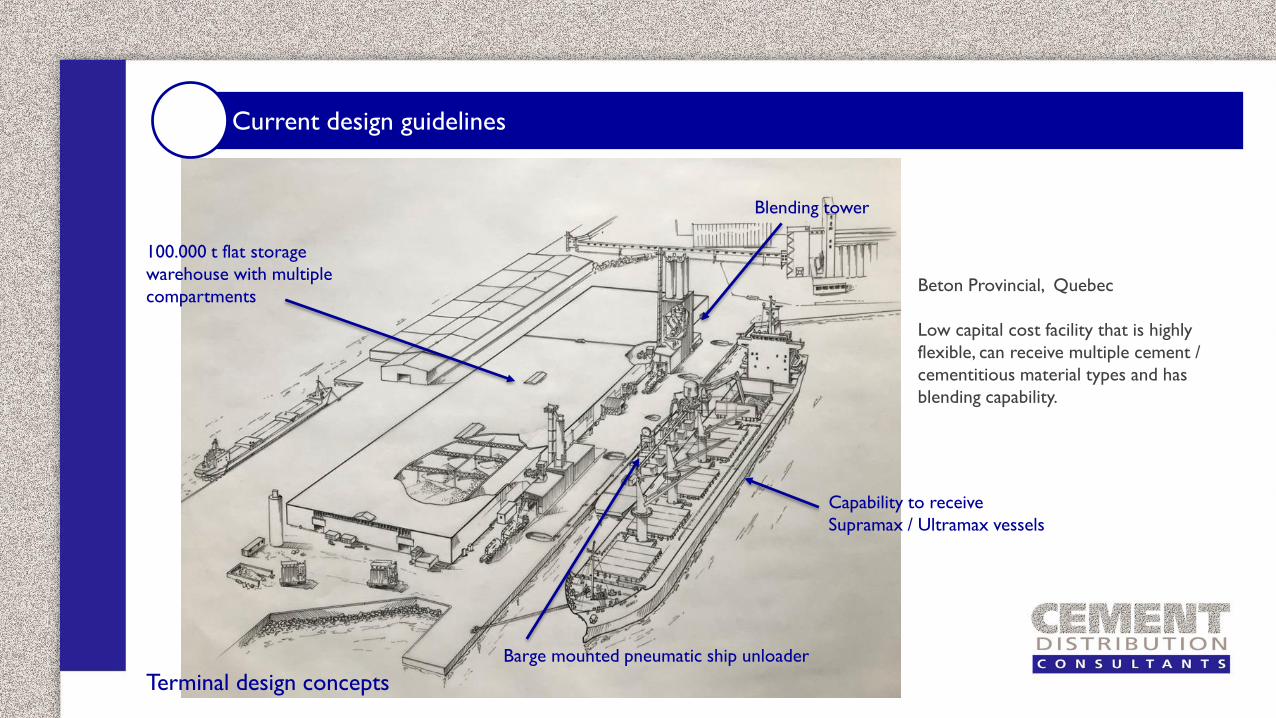
Current design guidelines
100.000 t flat storage
warehouse with multiple
compartments
Blending tower
Capability to receive
Supramax / Ultramax vessels
Barge mounted pneumatic ship unloader
Terminal design concepts
Beton Provincial, Quebec
Low capital cost facility that is highly
flexible, can receive multiple cement /
cementitious material types and has
blending capability.
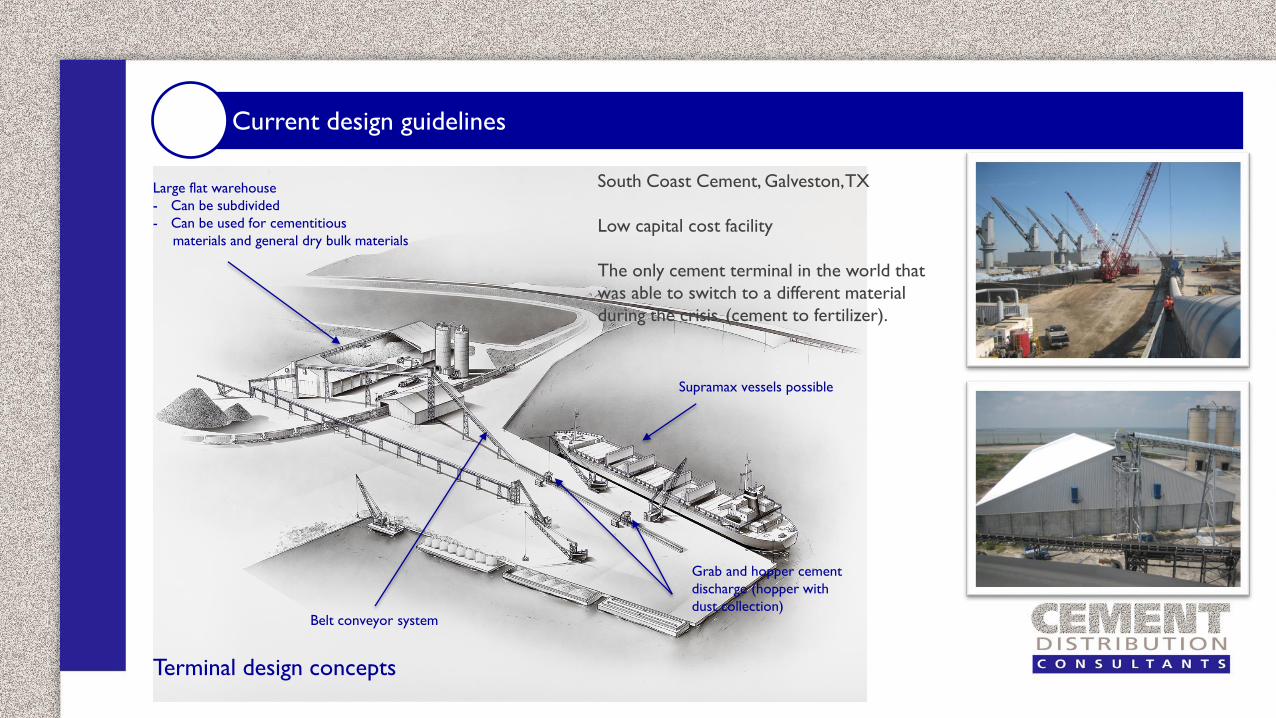
Current design guidelines
Large flat warehouse
- Can be subdivided
- Can be used for cementitious
materials and general dry bulk materials
Supramax vessels possible
Grab and hopper cement
discharge (hopper with
dust collection)Belt conveyor system
Terminal design concepts
South Coast Cement, Galveston, TX
Low capital cost facility
The only cement terminal in the world that
was able to switch to a different material
during the crisis. (cement to fertilizer).

Current design guidelines
Rail loading possible
High capacity
truck loadouts
Internal automated reclaim
buffer section to minimize
front end loader work
Pneumatic unloaders can
operate from several docks
(via underground pipelines
Large flat storage warehouse that
can be partitioned to handle multiple
cementitious materials
Terminal design concepts
Pan Pacific Cement,
Sacramento, CA
Large terminal with
several build-in features
for future flexibility.

Current design guidelines
Portable cement terminal concept
“Modular” ship unloading hoppers with pneumatic pumps
Modular truck loading bins and support structures which
only require a concrete slab
Existing flat storage warehouse conversion or new
warehouse that can be reused for other purposes
Containerized reclaim system equipment machine rooms
and MCC
Removable pipelines, dust collectors, auxiliary equipment
Portable office
Concept for a low cost, flexible
and portable cement terminal
Terminal design concepts
Final considerations

Final considerations
Although 2017 shows a lower growth of seaborne cement imports,
expectation for the coming years are still quite good.
It is clear that there is a need to upgrade existing facilities or build
larger new ones to meet larger ships and multiple material handling
capability. So far this is hardly happening but it will need to be
addressed in the coming years.
Almost all current expansion and new terminal construction projects
are realised by independents (i.e. companies without a cement
production base in North America) or newcomers (McInnis). This is
not strange. Many terminals have started out this way. Most of the
terminals have at least changed ownership once during their lifetime.
With the current projects it is clear that terminal design concepts
towards flexibility, low capital cost and quick realisation time are being
adapted although there is still room for improvement.
www.cementdistribution.com
Veembroederhof 63
1019 HD Amsterdam
The Netherlands
THANK YOU