norsk epidemiologi health inequalities and the welfare
TRANSCRIPT

Norsk Epidemiologi 2007; 17 (1): 9-20 9
Health inequalities and the welfare state: perspectives from social epidemiology
George A. Kaplan Center for Social Epidemiology and Population Health, University of Michigan, 1214 S. University Avenue,
Ann Arbor, Michigan 48104, USA Telephone: + (734) 615-9209 Telefax: + (734) 998-0006 E-mail: [email protected]
ABSTRACT
It might be assumed that welfare states that have done so much to reduce inequality of opportunity have also reduced inequality of health outcomes. While great advances have been seen in reducing the rates of many diseases in welfare states, disparities in health have not been eliminated. Is it the case that lowering risks overall will leave disparities that cannot be remediated, and that such efforts are at the point of diminishing returns? The evidence suggests that this is not true. Instead the lens of social epidemiology can be used to identify groups that are at unequal risk and to suggest strategies for reducing health inequalities through upstream, midstream, and downstream interventions. The evidence suggests that these interven-tions be targeted at low socioeconomic position, place-based limitations in opportunities and resources, stages of the life course and the accumulation of disadvantage across the life course, and the underlying health-related factors that are associated with the marginalization and exclusion of certain groups. In their commitment to the values of equity and social justice, welfare states have unique opportunities to demon-strate the extent to which health inequalities can be eliminated.
Coming to the topic of “Health Inequalities and the Welfare State” for a writer from outside the Nordic countries is a lot like bringing coals to Newcastle. Those of us who have strong commitments to social justice and understand its relationship to health and inequalities in health often hold up the Nordic social welfare states as examples – with low income inequa-lity, remarkable child health outcomes, strong labor participation in occupational regulation, strong econo-mic and social safety nets from cradle to grave, high marks on various measures of developmental health, and a generally strong commitment to compassionate foreign aid – all something quite lacking in my own country. Still the specter of pernicious inequality, in all its forms, and in all its consequences, evokes concern even where so much has been done to guard against it. First we must ask if health inequalities should be a concern in welfare states? Where such enormous prog-ress has been made in reducing infant mortality for example to 3 or 4 deaths/1000, relative measures of in-equality may not be the critical measures of inequality, representing as they do very low numbers of excess deaths between the best off and the worst off. Of more concern would be Geoffrey Rose’s observation to the effect that if everyone in the population smoked, then lung cancer would be a genetic disease (1). Is it the case that in countries that have gone so far to eliminate inequality of opportunity, that variations in outcome such as health represent only the role of individual differences in susceptibility that reflects the roll of genetic dice or other random factors? The answer from social epidemiology, I think, is “no.” In what follows I will try to indicate some of the perspectives that social epidemiology brings to this
matter, and speculate on how they might apply to so-cial welfare states. Admittedly, my speculations repre-sent those of someone far less familiar with the pushes and pulls in these societies than many of the readers of this journal. However, I think that the field of social epidemiology does give us a lens from which to view issues relevant to the mechanisms, both upstream and downstream, that produce inequalities in health within and across societies. First, let’s turn to the overall issue of what deter-mines levels and inequalities in population health. We know that all is not right – witness the daily headlines that focus on one health controversy or another – and we have responded by personal solutions or blaming others, focusing on cures rather than prevention, and sheer avoidance. Yet in countries such as the United States – spending more per capita on health than any other country, that has seen health spending as a share of GDP more than double during the last 30 years, and yet still ranks well behind other countries in many health outcomes (ranking greater than 30th from the top in life expectancy and infant mortality) – it is clear that priorities are askew. While this mismatch between economic inputs and health outputs, as some economists would have it, is not due to any single factor it is equally clear that there are major determinants of the health of our population that are simply not considered in our current thinking about how to improve health or reduce health inequa-lities. In order to restore some balance to our efforts to improve both the length and quality of life we need to put these on the table. What about genetics and the human genome? Near-ly every day the newspapers report on some new geno-mic promissory note promising to lead to a cure for

10 G.A. KAPLAN
disease X or Y. Won’t that knowledge help us improve the health of the population? Certainly the newspapers and Harold Varmus, a Nobel prize-winner and former Director of the US National Institutes of Health, think so. In 1999 he testified to the US Congress that “At the end of a century in which the average life expectancy in the United States has increased by nearly thirty years, victory over disease and disability has become an understandably popular and realistic goal” (2). Per-haps it is too soon to tell, but certainly these great promises have yet to be translated into any significant changes in the public’s health. For many diseases and inequalities in disease rates between groups there is probably little chance for any significant large-scale improvements coming from these discoveries, as inte-resting as they are. What is emerging instead is a view that emphasizes the importance of the environment in the expression of genetic vulnerability or perhaps in even modifying genes (3). Many believe that it is changing the behavior of individuals where our efforts should be focused. In-deed, there is ample evidence for an important role of cigarette smoking, poor diet, physical inactivity, and other behavioral “choices” in causing many important illnesses. But are these simply individual choices driven by preferences and values, or are they choices that are better seen as orchestrated by the social and marketing environments in which people live? If it’s not only the individual choice that people make that is important, don’t we also know that good medical care and access to it are an important determi-nant of levels of health in the population? But recall that in the US, individuals and the government spend more per person on health (really, disease) care than anywhere else in the world – even in the face of 47 million Americans who had no health insurance at
some time in 2005 (4) – and the results are disappoin-ting given this mammoth investment that amounted to nearly 1 of every 6 dollars spent in the US in 2004. If it’s not inadequate access to medical care, poor quality, or inefficiencies in the delivery of medical care, maybe it’s just a matter of education being criti-cally important. Certainly, one cannot quarrel with the far-reaching importance of an educated citizenry – al-though we really don’t know what it is about education that improves health. Or perhaps it all about reducing stress. Approaches centered on these views of what pro-duces health in populations have increasingly domina-ted our views on improving health and reducing disease for the last half century and much has been learned – yet we still seem to be on shaky ground in answering why some groups are more or less healthy than others. What could be missing from our thinking about sick or healthy societies? Increasingly, social epide-miologists and other are turning to a broad perspective that recognizes the multi-level determination of indivi-dual and population health (Figure 1) (5). The unifying element of such a perspective is that the factors contributing to health and health inequalities are seen from both an upstream and downstream perspective, with attention in-between as well. The claim is that understanding health and health inequalities potenti-ally requires attention to each of these levels. At the same time, one must recognize that what is the most effective level or levels to intervene at is largely an empirical question. This perspective has gradually emerged, largely driven by accumulated findings from researchers all over the globe, although it is clear that there has been far too little cross fertilization between social epide-
Figure 1. Upstream and downstream approach to population health (5).

HEALTH INEQUALITIES AND THE WELFARE STATE 11
miologists working in high income countries and researchers in middle and low income countries. In the process of elaborating this model, several key findings and issues have evolved and in the following section I will comment on each of these. I will also speculate as to how these findings might apply to issues of health inequalities in the welfare state, with a particular focus on Norway. SOCIOECONOMIC POSITION (SEP) AND HEALTH: EMERGING (AND NOT SO EMERGING) ISSUES Is there a fundamental association between SEP and health? It is often asserted by many researchers, inclu-ding the author of this paper in the past, that there is an inviolable association between socioeconomic position and health, excepting a few outcomes like breast cancer incidence. However, a statement such as this is far too broad and does not acknowledge variations in the nature of this association across time or place. For example, Kunitz (6) has shown that over the period from 1540-1901, there were periods in which the nobility was somewhat lower in life expectancy than the total population, about the same, and dramatically higher. In modern times we know that those in manual occupations have higher risk from stroke than those in non-manual occupations in many countries, but the pattern is not as uniform for deaths from ischemic heart disease, where those in the manual occupations have lower rates in some countries such as France, Switzerland, and Portugal (7). In the same vein, the association between measures of SEP and cardiovascu-lar mortality actually reversed direction over time (8-
9). Such reversals we would expect to be reflective of changes in the association between SEP and the risk factors for those outcomes, with appropriate lags, and such reversals as the socioeconomic patterning of smo-king have occurred widely in high income countries such as Norway (10). Thus, there is no automatic di-rection or magnitude of the association between socio-economic factors, with both depending on the factors, over the life course, that determine the socioeconomic distribution of risk factors and resources. WHAT IS THE ASSOCIATION BETWEEN SEP AND HEALTH OUTCOMES IN MODERN SOCIETIES? It is now common for many researchers to comment that the association between SEP and health outcomes displays a gradient in which even those who are well off are at greater risk than those better off (11-14). Attention to this “gradient,” often frames the discus-sion as if there were a linear relationship between SEP and health outcomes, but that is far from true. For ex-ample, Wolfson et al. (15), analyzing the relationship between household income and risk of death in a population representative of the United States and with almost 8 million person-years of follow-up demonstra-ted that the “gradient” is extremely non-linear with very little return of better health beyond approximately the 30th percentile of the income distribution (Figure 2). The steepness of the association in the first few tertiles and a very weak association thereafter suggests that most of the excess deaths in this population are among the poor. Schwartz (personal communication)
Figure 2. Relative risk of death by income and distribution of income (15).

12 G.A. KAPLAN
has found that almost one half the deaths occur among those in the bottom quintile of the income distribution in these data. Where investigators have used sufficient income categories they have also found evidence for a non-linear association for outcome across the life span, but few do so leaving the misleading implication that the association is quite linear. Appreciation of the extreme non-linearity of the association between SEP and outcome such as risk of death leads one away from a focus on the “gradient” to where the bulk of the excess risk is concentrated, and in the United States that is in the bottom quartile of the population. As it is difficult to think of interventions that would work effectively in the bottom quartile, where the association is steep, and equally well among those much better off (12) these findings argue for ef-forts focused on the poor or near-poor, many of whom in the United States are “working poor.” Is this concentration of poor health and highest risk of death among the poor found outside of the United States? There is little evidence as the question has not been much addressed. However, Martikainen et al. (16), in Finland find a more linear relationship with very little of the concavity found in the US. Some in-triguing data are reported by Mackenbach et al. (17) in a study in which they compared the shape of the gradi-ent between income and self-assessed health between seven countries. By (my) visual examination the shape of the gradient was most linear in Norway and Finland, while it was most curvilinear in England, France, Bel-gium, and Denmark, and intermediate in the Nether-lands. While there are other possible hypotheses, the fact that the association was steepest in England and most linear in Norway and Finland suggests the hypothesis that there may be something about social welfare states that reduces dramatically the excess health risks among the poor. This is an area of research that I and a number of colleagues from several coun-tries, Norway included, are now actively pursuing. MINIMUM NEEDS FOR SURVIVAL VS. CAPACITY/CAPABILITY Inspection of the relationship between GDP and life expectancy (Figure 3) originally displayed by Preston (18) and an update by Deaton (19), has suggested to some that the basic problem of providing minimum food, shelter, clean water, and sanitation has been met for residents of high income countries. While we know this is not true for many in some of these countries, amply demonstrated in the face of natural or un-natural disasters, the argument that basic material needs have been met for most of the populations of these countries can be seen as based on an antiquated notion of “basic needs”. A more realistic and contemporary view comes from the application of some of A. Sen’s argu-ments (20). Sen argues that in contrast to the usual measures of poverty or material well-being based on income alone, which often reflect the historical defi-
nition of basic needs, we must apply a more nuanced lens that considers what is possible to achieve in a given society and access to the capacities/capabilities required to achieve such ends. Thus, I think we have moved from the need for societies to provide material needs (of course, filling in the gaps of unmet needs where they exist), to the provision of “neo-material” needs. While it is difficult to provide a precise defi-nition of “neo-material needs,” one good example is access to a computer and computer literacy. While in no way could it be argued that such access/knowledge is a “basic condition for life,” lack of access to com-puters and to computer literacy in many places is patterned by SEP, and it is clear that in contemporary modern societies such access and skills provide great advantages with those advantages flowing forward throughout the life course. Thus, understanding how these “neo-material” goods and skills are patterned by SEP in middle and high income countries remains an important need, for they may be one of the pathways by which SEP structures health outcomes in such countries. RELATIVE VS. ABSOLUTE SEP In a related way, the GDP-life expectancy curve (Fi-gure 3) has led some to suggest that SEP is no longer an important determinant of health in wealthy coun-tries. Notwithstanding the problem of conflating argu-ments about aggregate association across countries with association for individuals within countries, the proposition is that “… the evidence suggests that what matters within societies is not so much the direct health effects of absolute material living standards so much as the effects of social relativities….In terms of income, the relationship is with relative rather than absolute income levels” (21). There is a paucity of analytical work on this topic with considerable argument based on the loose appli-cation of work from non-human primates that has focused on rank. For example, the work of Robert Sapolsky is widely quoted in support of effects of “rank” (which is often conflated with “relative posi-tion”) on neuroendocrine processes that are presumed to be important determinants of health. However, in a chapter that is not cited by the proponents of the relative SEP hypothesis, Sapolsky (22) comments that “a prime revisionist emphasis of this chapter has been how little, in fact, rank per se predicts any of those endpoints. Instead, it seems virtually meaningless to think about the physiological correlates of rank outside the context of a number of other modifiers” (emphasis in original). Abbot (23) similarly found little consis-tency in the relationship between rank and cortisol levels in non-human primates. Furthermore, the empi-rical evidence from population-based, epidemiologic studies relating psycho-neuro-endocrine dysregulation to prospectively-observed and well-defined disease endpoints is sparse and inconsistent.

HEALTH INEQUALITIES AND THE WELFARE STATE 13
The relative position/status hypothesis makes hea-vy use of statements about social comparison proces-ses without specifying who is being compared, what is being compared and at what geographic or social level are the comparisons being made. With a few excep-tions (e.g. 24-26) the discussion of the relative position hypothesis makes little reference to the more than 50 years of work on social comparison processes by social psychologists and sociologists. Distressingly, the relative position hypothesis implies that health inequalities are always with us as relative differences will always exist? If so, it is difficult to see how it is consistent with changes in the magnitude and direction of social inequalities in health over time or between places. However, as Sen (20) has pointed out “Relative deprivation in the space of incomes can yield absolute deprivation in the space of capabilities. In a country that is generally rich, more income may be needed to buy enough commodities to achieve the same social functioning….” As these commodities may be necessi-ties with regard to education, occupational success, and the intergenerational transmission of advantage and disadvantage it seems reasonable to refer to them as “neo-material.” This view of the links between capacities/capabi-lities and neo-material factors provides us with a lens with which to view a recent paper by Elstad at al. (26) that took up the issues of relative vs. absolute income and risk of death in Norway. Figure 4, adapted from
Elstad, shows the association between relative income and five year risk of death among residents of 63 eco-nomic regions. The relative income results reflect the age-adjusted risk of death of those who were ± 5% of the average income of the economic region in which they lived and are adapted from the table in their pa-per. The absolute income effects are crude risks, also taken from a table in the paper. The results of their analyses indicate a strong effect of absolute income with those with incomes around 65,000 NOK having twice the (crude) risk of death of those with incomes around 200,000 NOK, while there is no overall effect of relative income. In addition, the relative income effect among less well-off people was not present when a smaller level of geographic aggre-gation (249 municipalities) was considered and, as the authors point out, it is at this smaller level of aggrega-tion that social comparison processes are more likely to be operating. Of course they did find an apparent effect of relative income among the less well-off. The reasons for this are not clear, and lead one to ask if it is possible that the 10% range in income around 65,000 NOK actually taps neo-material differences (housing, education, working conditions, life course accumula-tion, etc.). From the relative income perspective it is not clear that an effect of relative income would only be expected among those less well-off. Indeed, the relative income hypothesis has often been used to ex-plain health variations among those better off.
Figure 3. Millenium Preston Curve (18).

14 G.A. KAPLAN
INCOME INEQUALITY – IS IT IMPORTANT FOR HEALTH? The road from Wilkinsons’s observation (27) that dif-ferences in income inequality between a small number of countries were associated with between-country differences in life expectancy for these countries, to work on within-country income inequality and morta-lity, has been strewn with both prospects and problems almost from the start (28-29). In our extension of Wil-kinson’s analyses to more countries and a later time period, and our review of 98 studies of the topic (the total published at the time of the review in 2003), it is abundantly clear that there is no generic relationship between country levels of income inequality and mor-tality or life expectancy (30-31). Similar conclusions about the relationship between within country income inequality differences and the distribution of mortality within countries remain in limbo due to conflicting re-sults, unresolved arguments about the most appropriate analytical method, the lack of a theoretical framework to identify the correct level of aggregation for such studies, and a lack of conceptual clarity about what income inequality “means” and hence what should be adjusted for in the analyses. However, there are some compelling observations that suggest the topic should continue to be pursued. For example Ross et al. (32-33) showed that income inequality differences between metropolitan areas were associated with mortality differences in the USA but not in Canada, and later showed that there was no such association in Sweden or Australia, but there was in Great Britain. Within the Nordic countries, while analyses in Sweden and Finland found no evidence for an association between within country income inequality and mortality, Dahl
et al. (34) find such an association in Norway. In their analyses, mortality (1994-99), was 25-30% higher in economic regions with the highest gini compared to the regions with the lowest gini, a magnitude much smaller than in the USA or the UK where the differen-ces are two-fold or more. It is not clear whether the different findings in Norway vs. Finland and Sweden represent real differences, differences in the way the analyses were carried or in the ways income inequality was measured, or the level of geographic aggregation in the studies. Interestingly, in the same study, it was possible to examine where income inequality had its greatest toll, and income inequality effects were strongest for those with incomes < 160,000 NOK (~ $25,000 US). Why should this be so? A view that I and my colleagues have proposed for some time is that it is not income inequality per se that is important but the neo-material context that is associated with different levels of income inequality, including differences in educational investments, working conditions, public health servi-ces, environmental controls, zoning, access to libraries and recreational areas, housing, quality nutrition, discrimination, etc. (30,35). Thus, finding that income inequality has the strongest “effect” among those who are poorer, prompts an examination of who these people are who are most affected and what their past and current lives are like. There is potentially much to be learned form such an examination, and most importantly it could lead to the discovery of areas of intervention, whereas the contrasting theories that income inequality effects reflect the results of social comparison processes do not readily suggest any such interventions.
Figure 4. Association between absolute and relative (±5% Mdn) income and 5-yr risk of death: 63 economic regions w/ populations from 19,539-473,454 (25).
0
5
10
15
20
25
30
35
40
45
50
65 75 85 95 105 115 125 135 145 155 167 182 200
Income (1000 NOK)
De
ath
s/1
00
0
0
5
10
15
20
25
30
35
40
45
50
65 75 85 95 105 115 125 135 145 155 167 182 200
Income (1000 NOK)
De
ath
s/1
00
0

HEALTH INEQUALITIES AND THE WELFARE STATE 15
LOCATION, LOCATION, LOCATION As one of the early contributors to the epidemiologic evidence that where you live has an impact on your health (36), it has been heartening to see the enormous increase in the empirical literature on this topic, with hundreds of studies now exploring this area of re-search. With regard to welfare states, the question arises as to whether a “place” effect exists where so much has been done to reduce inequality. While the range of social variation between “neighborhoods, places, or communities” in welfare states does not approach that of many other countries, there is still considerable variation in area level income, education, unemployment, nativity, environmental quality, hou-sing quality, etc. Perhaps this more limited variation has led to less consideration of the role of “place” in health inequali-ties within welfare states. However, the “geography of opportunity” is potentially an important generator of health inequalities and should be examined. Some evidence suggests that “place” might have an impor-tant role in health variations in the Nordic countries. For example, Stjärne et al. (37-38) found in Swe-den that neighborhood socioeconomic context and so-cial fragmentation were associated with the incidence of coronary heart disease. Also in Sweden, Sundquist et al. (39) found that area level of education and in-come (in ~ 6,000 small-area market areas of approxi-mately 1000-2000 people) was associated with CHD incidence independent of individual covariates and the CNI – a social deprivation index – of the same areas was associated with increased prevalence of “poor” self-reported health (40). In another Swedish Study, the association between neighborhood income and IHD mortality increased dramatically from 1986 to 1996 due to increased concentration of poverty in poor neighborhoods and affluent neighborhoods providing increased level of protection (41). Neighborhood unemployment in Finland and the Netherlands was associated with increased risk of death (42). Also, Bosma et al. (43) showed the impact of area income and education in the GLOBE study in the Netherlands. Finally, in Norway, Kravdal (44) found that levels of education and unemployment in municipalities were associated with variations in cancer survival. Many questions remain concerning the association between spatial characteristics and health outcomes (5, 45). For example, what is implied by the use of terms like “neighborhood” or “community?” Do these terms, by virtue of a relatively unexamined use of what they imply, promise too much and deliver too little? What are the links between spatial variables and the patho-biological process more proximal to disease? Do the findings on place effects stand up to epidemiological evidence – for example, based on what we know about the links between nutritional intake and disease out-comes, how much can neighborhood variations in
access to good food explain differences in rates of disease? What is the correct spatial grain? Do analyses address historical, longitudinal, or selection effects? Are neighborhoods “independent”? Are there “up-stream” determinants of neighborhood life and func-tion? Answering these questions will require concep-tual and methodological advances, new sources of data as well, and coming to terms with thorny causal issues. However, the evidence available suggests that such effects of “place” on health are important in welfare states and studies should continue in pinpoint why such effects are seen. LIFE COURSE PERSPECTIVES Proceeding from the pioneering work of Forsdahl (46), leading though the contributions of Barker and his colleagues (47), and now evidenced in the burgeoning field of life course epidemiology (48), it is clear that consideration of the contemporaneous and delayed effects of early exposures, the temporal chaining of exposures, and the accumulation of exposures over decades has found a place in epidemiology. Of course not all life course epidemiology is social epidemio-logy, but for the most part the social patterning of many exposures across the life course suggests an important role for social epidemiology. Importantly, the battles between those proposing that much of disease occurrence is set early in life, perhaps in utero, and those proposing an important role of exposures much later in life has been supplanted by a more nuanced perspective that sees both early biological programming and accumulation of risk across the life course as important (48). In both of these perspectives, the importance of childhood socioeconomic conditions looms large, because of early effects on development as well as the importance of childhood conditions in patterning subsequent social and economic trajectories. While welfare states have some of the best records regarding living conditions for childhood, and many mechanisms for weakening the effect of childhood conditions on subsequent social and economic trajectories, there is still some evidence for the importance of life course approaches, particularly those focused on the accumu-lation of disadvantage. For example, in the Kuopio Ischemic Heart Disease Risk Factor Study in eastern Finland, we found that both childhood socioeconomic conditions and the accumulation of disadvantage were associated with poorer cognitive function many decades later (49,50). Similarly, Wamala et al. (51) found that the risk of coronary heart disease in women in Stockholm County was strongly related to the accu-mulation of disadvantage over the life course – women in the most disadvantaged group had over six times the risk of coronary heart disease than women in the lowest risk group. As suggested above, adverse childhood socioeco-nomic conditions are important both because of their

16 G.A. KAPLAN
early effects (biological, behavioral, psychosocial) and because of their impact on opportunity structures later in life. One can ask then, what determines poor socio-economic conditions. Of course, in wealthy countries the phrase “childhood socioeconomic conditions” really refers to parental socioeconomic conditions. Internationally, the prevalence of children living in poverty is strongly associated with the wage structure
in the population. Figure 5 shows the strong relation-ship between child poverty rates and the percent of full time workers with wages less than two thirds of the median. In addition to wages and salaries, taxation and transfer policies have an important role in determining rates of child poverty. As can be seen in Figure 6, the impact of such policies is strong, with wide variations between countries and a major role in lowering child
Figure 5. Rates of child poverty and low-income wages (52).
Figure 6. Effects of tax and transfer policies on child poverty (53).
0
5
10
15
20
25
30
DK FI NO SW CH CZ FR BG HU NL GE AU GR PO CA UK IR NZ US MX
Rate
of
Ch
ild
Po
vert
y (
<50%
of
me
dia
n p
os
t-ta
x
an
d t
ran
sfe
r in
co
me)
0
5
10
15
20
25
30
DK FI NO SW CH CZ FR BG HU NL GE AU GR PO CA UK IR NZ US MX
Rate
of
Ch
ild
Po
vert
y (
<50%
of
me
dia
n p
os
t-ta
x
an
d t
ran
sfe
r in
co
me)
HEALTH INEQUALITIES AND THE WELFARE STATE 17
poverty rates in the Nordic welfare states (52). For ex-ample, child poverty is reduced almost five fold, from 15.5% to 3.4%, by tax and transfers in Norway. Such pro-child policies are, of course, just a component of a more general set of economic supports across the life course as indicated by strong correlations between child poverty rates and the portion of the national GDP that is spent on social transfer across the life course (53). It is also important to remember that the impact of poor childhood economic conditions on health can be modified by what is happening within the society over the life course. For example, in a cohort of men who were young during the middle and end of World War II in eastern Finland, we found that while there was a strong association between mortality and their econo-mic status when they were 42-60 years of age, there was no association with childhood socioeconomic sta-tus (54). During this period of rapid economic growth in Finland, it appears that a “rising (economic) tide lif-ted all boats”. The conclusion is that an understanding of life course effects on health will, to some extent, have to involve an understanding of what is happening in the society in which the life course is being lived. MAKING SOCIAL MARGINALIZATION VISIBLE The study of social marginalization and exclusion continues to reveal that social divides in societies often manifest themselves as health divides. Many societies have histories of ignoring such divides with Brazil and its historical rhetoric of being a “racial democracy” being one of the clearest examples of how such a view impeded the perception of clear health and social divides (55,56).
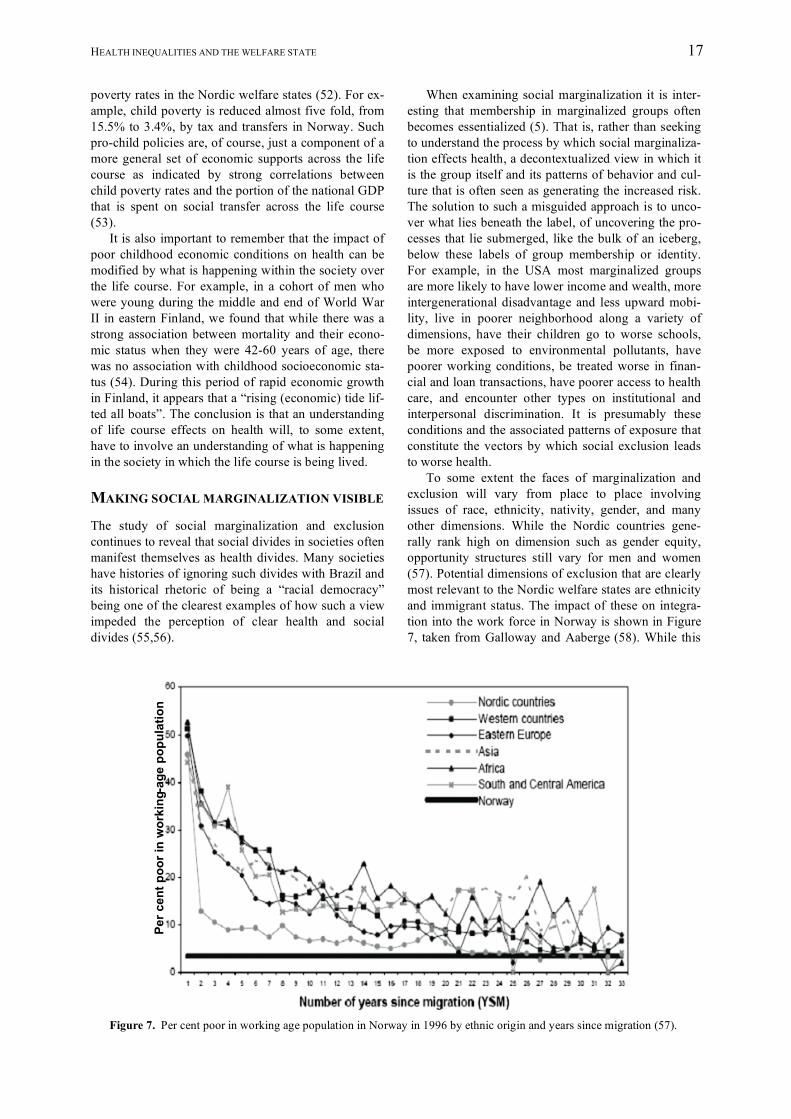
When examining social marginalization it is inter-esting that membership in marginalized groups often becomes essentialized (5). That is, rather than seeking to understand the process by which social marginaliza-tion effects health, a decontextualized view in which it is the group itself and its patterns of behavior and cul-ture that is often seen as generating the increased risk. The solution to such a misguided approach is to unco-ver what lies beneath the label, of uncovering the pro-cesses that lie submerged, like the bulk of an iceberg, below these labels of group membership or identity. For example, in the USA most marginalized groups are more likely to have lower income and wealth, more intergenerational disadvantage and less upward mobi-lity, live in poorer neighborhood along a variety of dimensions, have their children go to worse schools, be more exposed to environmental pollutants, have poorer working conditions, be treated worse in finan-cial and loan transactions, have poorer access to health care, and encounter other types on institutional and interpersonal discrimination. It is presumably these conditions and the associated patterns of exposure that constitute the vectors by which social exclusion leads to worse health. To some extent the faces of marginalization and exclusion will vary from place to place involving issues of race, ethnicity, nativity, gender, and many other dimensions. While the Nordic countries gene-rally rank high on dimension such as gender equity, opportunity structures still vary for men and women (57). Potential dimensions of exclusion that are clearly most relevant to the Nordic welfare states are ethnicity and immigrant status. The impact of these on integra-tion into the work force in Norway is shown in Figure 7, taken from Galloway and Aaberge (58). While this
Figure 7. Per cent poor in working age population in Norway in 1996 by ethnic origin and years since migration (57).
Per c
ent p
oor i
n w
orki
ng-a
ge p
opul
atio
nPe
r cen
t poo
r in
wor
king
-age
pop
ulat
ion

18 G.A. KAPLAN
is cross-sectional data, it suggests that over decades there is considerable improvement in the economic status of immigrants in Norway, but non-natives still lag behind natives. As the average age of immigrants is in the mid 20’s, many of the early years after immi-gration are spent with small children in the household. Thus, if this analysis is correct in pointing out a slower pace of integration into the labor force, there is an increased potential for a context for early life disad-vantage and all its subsequent consequences. There is some evidence consistent with this projec-tion. While the social disadvantages for immigrants in the Nordic countries are generally smaller than for other wealthy countries, social exclusions extend to employment, housing, access to and navigation through social systems, and interpersonal discrimina-tion. Consistent with this pattern, a number of studies document poorer health among immigrants. Children of immigrants in Denmark, Finland, Iceland, Norway, and Sweden were more likely (compared to non-immigrants) to have stomach pain, headache, back pain, sleep disorders, dizziness, and loss of appetite and low psychological well-being (58). Of course not all immigrant populations are alike and the challenges they face reflect a mix of historical and contemporary experiences, culture, and often insti-tutional and interpersonal discrimination based on
race, ethnicity, religion, gender, and cultural practices. Understanding inequalities in health between native and immigrant populations is a very complex issue, and undoubtedly require the analytic lens of Figure 1. CONCLUSION There appears to be ample evidence that despite the great achievements of welfare states in improving equ-ality of opportunity, important health variations exist. Current thinking in social epidemiology identifies a number of the ways in which unequal health outcomes may be produced. It is argued by some that the per-spective suggested by Figure 1 is far too complex and that we should look for simpler solutions, however there is a solid empirical basis that suggests that health inequalities can be reduced by targeting low socio-economic position, place-related opportunity structures and risks, the life course, and social marginalization. These are not simple matters from a policy perspec-tive; however there is no reason to believe that curing social divides and health divides should be an easy matter. Lest we throw up our hands in dismay about this complexity and retreat to the simpler and more familiar analytic terrain, we might mind the words of Albert Einstein, who is reputed to have said “every-thing should be as simple as it is, but not simpler”.
REFERENCES 1. Rose G. Sick individuals and sick populations. Int J Epidemiol 1985; 14: 32-8. 2. Varmus H. Statement before US House and Senate Appropriations Subcommittees on Labor, Health and
Human Services, and Education, February 23-24, 1999. http://www.mskcc.org/mskcc/html/1810.cfm 3. Yang Q, Khoury MJ. Evolving methods in genetic epidemiology. III. Gene-environment interaction in epide-
miologic research. Epidemiol Rev 1997; 19: 33-43. 4. DeNavas-Walt C, Proctor BD, Lee H. Current Population Reports: Consumer Income, Income, Poverty, and
Health Insurance Coverage in the United States: 2005. Washington, DC: U.S. Department of Commerce Economics and Statistics Administration, US Census Bureau, 2006.
5. Kaplan GA. What's wrong with social epidemiology, and how can we make it better? Epidemiol Rev 2004; 26: 124-35.
6. Kunitz SJ. Making a long story short: a note on men’s height and mortality in Britain from the first through the nineteenth centuries. Medical Hist 1987; 31: 269-80.
7. Kunst AE, del Rios M, Groenhof F, et al. Socioeconomic inequalities in stroke mortality among middle-aged men. Stroke 1998; 29: 2285-91.
8. Morgenstern H. The changing association between social status and coronary heart disease in a rural popula-tion. Soc Sci Med 1980; 14: 191-201.
9. Marmot MG, Adelstein AM, Robinson N, Rose GA. Changing social-class distribution of heart disease. BMJ 1978; ii: 1109-12.
10. Lund KE, Roenneberg A, Hafstad A. The social and demographic diffusion of the tobacco epidemic in Norway. In: Slama K, ed. Tobacco and Health. New York: Plenum Press, 1995: 565-71.
11. Syme SL, Berkman LF. Social class, susceptibility, and sickness. Am J Epidemiol 1976; 104: 1-8. 12. Haan MN, Kaplan GA, Syme SL. Socioeconomic status and health: old observations and new thoughts. In:
Bunker JP, Gomby DS, Kehrer BH, eds. Pathways to health: the role of social factors. Menlo Park, CA: Henry J. Kaiser Family Foundation, 1989: 76-135.
13. Marmot MG, Bobak M, Davey Smith G. Explanations for social inequalities in health. In: Amick BC et al., eds. Society and Health. New York: Oxford University Press, 1995.

HEALTH INEQUALITIES AND THE WELFARE STATE 19
14. Adler NE, Boyce T, Chesney M, Cohen S, Folkman S, Kahn R, Syme SL. Socioeconomic status and health: The challenge of the gradient. Am Psychol 1994; 4: 15-24.
15. Wolfson M, Kaplan G, Lynch J, Ross N, Backlund E. Relation between income inequality and mortality: empirical demonstration. BMJ 1999; 319: 953-5.
16. Martikainen P, Mäkelä P, Koskinen S, Valkonen T. Income differences in mortality: a register-based follow-up study of three million men and women. Int J Epidemiol 2001; 30: 1397-1405.
17. Mackenbach JP, Martikainen P, Looman CW, et al. The shape of the relationship between income and self-assessed health: an international study. Int J Epidemiol 2005; 34: 286-93.
18. Preston SH. The changing relationship between mortality and level of economic development. Pop Studies 1975; 29: 231-48.
19. Deaton A. Health in an age of globalization. In: Collins S, Graham C, eds. Brookings Trade Forum, 2004: Globalization, Poverty, and Inequality. Washington, DC: The Brookings Institute, 2004, 83-110.
20. Sen A. Inequality Reexamined. Cambridge: Harvard University Press, 1992. 21. Wilkinson RG. Unhealthy societies: the afflictions of inequality. London: Routledge, 1996. 22. Sapolsky RM. Hormonal correlates of personality and social contexts: from non-human to human primates.
In: Panter-Brick C, Worthman CM, eds. Hormones, health and behavior. New York: Cambridge University Press, 1999: 18-46.
23. Abbott DH, Keverne EB, Bercovitch FB, et al. Are subordinates always stressed? A comparative analysis of rank differences in cortisol levels among primates. Horm Behav 2003; 43: 67-82.
24. Yngwe MÅ, Fritzell J, Lundberg O, et al. Exploring relative deprivation: Is social comparison a mechanism in the relation between income and health? Soc Sci Med 2003; 57: 1463-73.
25. Yngwe MÅ. Fritzell J, Burström B, Lundberg O. Comparison or consumption? Distinguishing between different effects of income on health in the Nordic welfare states. Soc Sci Med 2005; 61: 627-35.
26. Elstad JI, Dahl E, Hofoss D. Associations between relative income and mortality in Norway: a register-based study. Eur J Public Health 2006; 16: 640-4.
27. Wilkinson RG. Income distribution and life expectancy. BMJ 1992; 304: 165-8. 28. Judge K. Income distribution and life expectancy: a critical appraisal. BMJ 1995; 311: 1282-5. 29. Editorial. The big idea. BMJ 1996; 312: 985. 30. Lynch JW, Davey Smith G, Hillemeier M, et al. Income inequality, the psychosocial environment, and health:
comparisons of wealthy nations. Lancet 2001; 358: 194-200. 31. Lynch JW, Harper S, Smith GD, et al. Is income inequality a determinant of population health? Part 1. A sys-
tematic review. Milbank Quarterly 2004; 82: 5-99. 32. Ross NA, Wolfson MC, Dunn JR, et al. Relation between income inequality and mortality in Canada and in
the United States: cross sectional assessment using census data and vital statistics. BMJ 2000; 320: 898-902. 33. Ross NA, Dorling D, Dunn JR, et al. Metropolitan scale relationship between income inequality and mortality
in five countries using comparable data. J Urban Health 2005; 82: 101-10. 34. Dahl E, Elstad JI, Hofoss D, Martin-Mollard M. For whom is income inequality most harmful? A multi-level
analysis of income inequality and mortality in Norway. Soc Sci Med 2006; 63: 2562-74. 35. Kaplan GA, Pamuk ER, Lynch JW, et al. Inequality in income and mortality in the United States: analysis of
mortality and potential pathways. BMJ 1996; 312: 999-1003. 36. Haan M, Kaplan GA, Camacho T. Poverty and health. A prospective evidence from the Alameda County
Study. Am J Epidemiol 1987; 125: 989-98. 37. Stjärne M, Ponce de Leon A, Hallqvist J. Contextual effects of social fragmentation and material deprivation
on risk of myocardial infarction – Results from the Stockholm Heart Epidemiology Program (SHEEP). Int J Epidemiol 2004; 33: 732-41.
38. Stjärne M, Ponce de Leon A, Hallqvist J. Neighborhood socioeconomic context, individual income and myocardial infarction. Epidemiology 2006; 17: 14-23.
39. Sundquist K, Winkleby M, Ahlen H, Johansson S-E. Neighborhood socioeconomic environment and incidence of coronary heart disease: a follow-up study of 25,319 women and men in Sweden. Am J Epidemiol 2004; 159: 655-62.
40. Malmström M, Sundquist J, Johansson S-E. Neighborhood environment and self-reported health status: a multilevel analysis. Am J Public Health 1999; 89: 1181-6.
41. Chaix B, Rosvall M, Merlo J. Recent increase of neighborhood socioeconomic effects on ischemic heart dis-ease mortality: a multilevel survival analysis of two large Swedish cohorts. Am J Epidemiol 2007; 165: 22-6.
42. van Lenthe FJ, Borrell LN, Costa G, et al. Neighbourhood unemployment and all cause mortality: a compari-son of six countries. J Epidemiol Community Health 2005; 59: 231-7.
43. Bosma H, van de Mheen HD, Borsboom GJJM, Mackenbach JP. Neighborhood socioeconomic status and all-cause mortality. Am J Epidemiol 2001; 153: 363-71.

20 G.A. KAPLAN
44. Kravdal O. Does place matter for cancer survival in Norway? A multilevel analysis of the importance of hospital affiliation and municipality socio-economic resources. Health & Place 2006; 12: 527-37.
45. Diez Roux AV. Commentary: Estimating and understanding area health effects. Int J Epidemiol 2005; 34: 284-5.
46. Forsdahl A. Are poor living conditions in childhood and adolescence an important risk factor for arterio-sclerotic disease? Br J Prev Soc Med 1977; 31: 91-5.
47. Barker DJ, Osmond C. Infant mortality, childhood nutrition, and ischaemic heart disease in England and Wales. Lancet 1986; 1: 1077-81.
48. Kuh D, Ben Shlomo Y, eds. A life course approach to chronic disease epidemiology, 2nd edition. Cambridge: Oxford University Press, 2007.
49. Kaplan GA, Turrell G, Lynch JW, et al. Childhood socioeconomic position and cognitive function in adult-hood. Int J Epidemiol 2001; 30: 256-63.
50. Turrell G, Lynch JW, Kaplan GA, et al. Socioeconomic position across the lifecourse and cognitive function in late middle age. J Gerontol: Soc Sci 2002; 57B: S43-51.
51. Wamala SP, Lynch JW, Kaplan GA, et al. Women’s cumulative exposure to socio-economic disadvantage and coronary heart disease risk the Stockholm female coronary risk study. Psychosom Med 2000; 62: 1311.
52. UNICEF. A league table of child poverty in rich nations. Innocenti Report Card No. 1. Florence: UNICEF Innocenti Research Centre, 2000.
53. UNICEF. Child poverty in rich countries, 2005. Innocenti Report Card No. 6. Florence: UNICEF Innocenti Research Centre, 2005.
54. Lynch JW, Kaplan GA, Cohen RD, et al. Childhood and adult socioeconomic status as predictors of mortality in Finland. Lancet 1994; 343: 524-7.
55. Reichmann R, ed. Race in contemporary Brazil: from indifference to inequality. University Park, Pennsylva-nia: Pennsylvania State University Press, 1999.
56. Chor D, Faerstein E, Kaplan GA, et al. Association of weight change with ethnicity and life course socio-economic position among Brazilian civil servants. Int J Epidemiol 2004; 33: 100-6.
57. Neft N, Levine A. Where women stand: an international report on the status of women in 140 countries 1997-1998. New York: Random House, 1997.
58. Galloway TA, Aaberge R. Assimilation effects on poverty among immigrants in Norway. J Pop Econ 2005; 18: 691-718.