nonprofit revenue diversification and organizational
TRANSCRIPT

NONPROFIT REVENUE DIVERSIFICATION AND ORGANIZATIONAL
PERFORMANCE: AN EMPIRICAL STUDY OF NEW JERSEY HUMAN
SERVICES AND COMMUNITY IMPROVEMENT ORGANIZATIONS
By Weiwei Lin
A dissertation submitted to the
Graduate School - Newark
Rutgers, the State University of New Jersey
in partial fulfillment of requirements
for the degree of
Doctor of Philosophy
School of Public Affairs and Administration
Written under the direction of
Professor Marc Holzer
and approved by
_____________________
_____________________
_____________________
_____________________
_____________________
Newark, New Jersey
October, 2010

© 2010
Weiwei Lin
ALL RIGHTS RESERVED

ii
ABSTRACT OF THE DISSERTATION
By Weiwei Lin
Dissertation Director:
Professor Marc Holzer
Examining nonprofit revenue diversification is important not only in
understanding nonprofit financial management dynamics but also in informing nonprofit
financial sustainability. This study draws on nonprofit financial management theories to
propose three research questions, and develops and empirically tests an integrated model
that investigates how contextual factors – organizational structure and capacity,
managerial experience, fund development effort and investment, and operating
environment – affect nonprofit revenue diversification and financial sustainability.
Questionnaires were administered to executive directors of 1,115 New Jersey
human services and community improvement organizations. Using data from 501
responding organizations, this study found certain organizational and environmental
characteristics have a significant influence on nonprofit revenue diversification. As
expected, some capacity, management, investment and environment measures have a
positive impact on funding variety, but fewer measures have a positive effect on revenue
balance. Multiple regression analyses reveal that most of the hypotheses regarding
predictors of financial sustainability are not confirmed which suggests that the research
model does not include other factors that significantly impact nonprofit financial

iii
sustainability.
Major findings of the study include: (a) organizational structure and capacity,
such as employee size, years of operation, board involvement, and internal development,
are positively related to nonprofit revenue diversification, particularly funding variety; (b)
managerial factors, including management’s attitude toward revenue diversification,
management’s influence on fund development strategies, and recent operational cutbacks,
have significant impact on funding variety, but less so on revenue balance; (c) using
designated fund development staff and developing good relationship with outside
stakeholders enhance revenue diversification; and (d) revenue diversification does not
help organizations maintain financially sustainable. Although these findings are only
suggestive, this study is a significant step forward in the development of a theory of
nonprofit financial performance including the analysis of revenue diversification which
will lead to a better understanding of a number of topics that have been understudied and
thus not well understood.

iv
Acknowledgements
Psalms 1:3: And he shall be like a tree planted by the rivers of water, that
bringeth forth his fruit in his season; his leaf also shall not
wither; and whatsoever he doeth shall prosper.
I would like to express my sincere appreciation and gratitude to a number of
people who have guided and helped me through my graduate studies and dissertation
research; this dissertation could not have been completed without their remarkable
support. I am very grateful to my dissertation chair Marc Holzer, and the members of
my committee Gregg Van Ryzin, Judith Kirchhoff, Kyle Farmbry, and Frederick Lane.
Professor Holzer provided advice, encouragement, and continuous support since the very
beginning of my doctoral program at Rutgers. I tremendously benefited from his
willingness to offer guidance and help as well as his constant push to expedite my
dissertation research. Professor Van Ryzin has been a great mentor and committee
member. I am very lucky to have worked with him at different stages of the dissertation
research, from questionnaire design to data analysis and to dissertation writing. His
insightful advice and timely responses significantly helped improve my work. Professor
Kirchhoff and Professor Farmbry both provided me with their knowledge and insight to
improve my dissertation. I appreciate Professor Lane’s strong belief in me and my
research topic; it was such a pleasure having him guide me in the past three years.
In addition to the dissertation committee, I want to acknowledge and thank a
number of individuals who have provided various kinds of assistance and help to my

v
dissertation research: Professor Dorothy Olshfski, Professor Tae Ho Eom, and Professor
Chao Guo. I also want to show my appreciation to Gail, Madelene, and Melissa, for
their excellent administrative assistance and friendship. I thank many of my colleagues
and friends at Rutgers, particularly Esi Ansah, Weerasak Krueathep, Jia Ma, Wenxuan Yu,
and Guozhen Zhao, for hanging out with me and providing feedback on my research.
I will never forget where my passion for nonprofit management originated and
what motivated me to pursue a degree in nonprofit studies. I express my sincere
appreciation to Professor Stephen Yenren Ting, my master thesis advisor at Nanjing
University and my mentor at the Amity Foundation, and all my other Amity colleagues
for the great work they have done for China’s nonprofit sector.
Finally, I give my very special thanks to my loved ones. Pursuing Ph.D.
degrees together has been a challenging and rewarding experience for my husband,
Yeting, and me – his in Computer Science and mine in Public Administration. We thank
Samuel, our wonderful baby boy, for going through the process with us. I dedicate this
dissertation to my parents, Zhiyong Lin and Guozhen Wang, for their unconditional love
and endless support all these years.

vi
TABLE OF CONTENTS
Abstract ii
Acknowledgements iv
List of Tables viii
List of Figures ix
Chapter One Introduction
1.1 Research Background 1
1.2 Purpose of the Study 2
1.3 Significance of the Study 4
1.4 Outline of the Dissertation 6
Chapter Two Literature Review
2.1 Nonprofit Financing 11
2.2 Nonprofit Organizational Performance 28
2.3 Research Gaps 40
Chapter Three Conceptual Framework and Research Hypotheses
3.1 Conceptual Framework and Research Questions 43
3.2 Hypotheses: Determinants of Revenue Diversification 46
3.3 Hypotheses: Predictors of Financial Sustainability 54
Chapter Four Data and Methodology
4.1 Unit of Analysis 60
4.2 Data Sources 61
4.3 Population and Sampling 62
4.4 Survey Instrument 68
4.5 Measurement 71
4.6 Survey Data Collection 80
4.7 Data Analysis Procedures 82
Chapter Five Data Analysis and Findings
5.1 Survey Response Rate 86
5.2 Descriptive Statistics 87
5.3 Validation of the Proposed Constructs 109

vii
5.4 Regression Analysis 114
Chapter Six Implications and Future Research
6.1 Theoretical Implications 142
6.2 Managerial Implications 144
6.3 Methodological Improvement 145
6.4 Limitations and Future Research Directions 146
6.5 Conclusions 150
References 152
Appendices 165

viii
LIST OF TABLES
Table 2.1 Revenue Strategy Profiles 20
Table 2.2 Summary of “Nonprofit Financial Performance” Measures 31
Table 4.1 Final Sample of the Study 65
Table 4.2 Summary of Four Groups 68
Table 4.3 Administration of Mail and Web Surveys 80
Table 5.1 Survey Response Rates 87
Table 5.2 Share of Revenue Categories by Sector 96
Table 5.3 Share of Funding Sources by Sector 97
Table 5.4 Revenue Diversification Index by Sector 98
Table 5.5 Cronbach Coefficient Alpha of the Sample Data 110
Table 5.6 Factor Analysis: Managerial Success 111
Table 5.7 Factor Analysis: Internal Development 112
Table 5.8 Factor Analysis: External Relationship 113
Table 5.9 Descriptive Statistics for Latent Variables 113
Table 5.10 Correlation Matrix for the Variables 115
Table 5.11 Correlations between Dominant Funding and Revenue Diversification 119
Table 5.12 Normality 121
Table 5.13 Summary of Multicollinearity 122
Table 5.14 Homoscedasticity Tests 123
Table 5.15 Revenue Diversification as a Function of Contextual Factors
126
Table 5.16 Summary of Hypotheses Testing Results (Models 1 and 2) 133
Table 5.17 Financial Sustainability as a Function of Contextual Factors
136
Table 5.18 Summary of Hypotheses Testing Results (Models 3, 4 and 5) 140

ix
LIST OF FIGURES
Figure 2.1 Typologies of Nonprofit Funding Sources 14
Figure 3.1 Theoretical Framework for the Study 43
Figure 3.2 Model of Nonprofit Revenue Diversification and Financial Performance 45
Figure 5.1 Frequency of Gender in the Sample 89
Figure 5.2 Age of Respondents 89
Figure 5.3 Tenure with Different Sectors 90
Figure 5.4 Distribution of Eight Service Fields 91
Figure 5.5 Employee Size in the Sample 92
Figure 5.6 Volunteer Size in the Sample 93
Figure 5.7 Number of Funding Sources in the Sample 94
Figure 5.8 Funding Variety by Service Field 95
Figure 5.9 Single Source Dominated Organizations 98
Figure 5.10 Financial Stress 99
Figure 5.11 Likelihood to Maintain Programs and Services 100
Figure 5.12 2007/2008 Expenditure versus 2009 Budget 102
Figure 5.13 Total Expenditure of Responding versus Sample Organizations 103
Figure 5.14 Board Size in the Sample 103
Figure 5.15 Growth of Programs and Services 104
Figure 5.16 Perception versus Practice of Revenue Diversification 105
Figure 5.17 Operational Cutbacks 106
Figure 5.18 Fund Development Professionals 107
Figure 5.19 Percentage of Budget for Fund Development 108
Figure 5.20 Difficulty in Obtaining Fund from Different Sources 109

1
CHAPTER ONE
INTRODUCTION
Chapter 1 presents an overview of this dissertation research. This chapter
explains the research background and the purpose of the study, discusses the theoretical
and practical importance of the study, and provides an outline of the dissertation.
1.1 Research Background
How are nonprofit organizations faring as the current economic downturn
reduces government budgetary spending, household incomes, and corporate revenues?
Since the inception of the economic recession at the beginning of 2008, the nonprofit
community has been increasingly concerned about their resource acquisition due to a
sharp drop in available funds from various sources they have been traditionally relying on.
Nonprofit organizations have been similarly concerned about their sustainable
development in the near future. Diversifying revenue structure has been increasingly
proposed as a special strategy to enhance nonprofit organization‟s revenue generation
capacity and to improve nonprofit financial sustainability.
Examining the determinants of nonprofit revenue diversification provides
useful knowledge to inform fund development strategies for nonprofit managers and
professionals. Moreover, donors, funders, and policy makers have increasingly paid
attention to the influence of different funding sources on nonprofit revenue pattern.

2
However, extant literature offers mixed results as to the relationships among nonprofit
funding sources, while no theoretical construct has been offered to explain the causal
complexity between contextual factors and revenue structure. Very few studies have
empirically examined the organizational and environmental determinants of nonprofit
revenue pattern and findings of these studies are inconclusive due to data limitations.
Exploring the predictors of nonprofit financial sustainability provides novel
information about managerial strategies nonprofit managers and professionals can depend
on to sustain their organizations in terms of resource acquisition and programmatic
development. Financial sustainability, as a measure of nonprofit financial performance
and more broadly nonprofit organizational performance, merits more research.
However, no comprehensive research effort has been made to evaluate network
relationships among nonprofit characteristics – institutional and environmental, nonprofit
revenue diversification, and nonprofit financial performance. As a result, it is important
to conduct a rigorous, theoretical investigation into contextual factors affecting nonprofit
revenue diversification and financial sustainability.
1.2 Purpose of the Study
The overall purpose of this study is to introduce empirical evidence that will
shed light on the network relationships among contextual characteristics, revenue
diversification, and organizational performance of nonprofit organizations. In other
words, the study aims to explore the determinants of nonprofit revenue diversification,

3
and its influence on nonprofit performance, particularly, how the level of diversification
impact nonprofits‟ ability to survive and thrive during the current economic downturn.
The study examines three research questions.
1. How does government funding affect nonprofit revenue generation patterns?
2. How do structural factors, managerial factors, and environmental factors affect
nonprofit revenue diversification?
3. How do nonprofit revenue diversification, structural factors, managerial factors,
and environmental factors affect nonprofit financial sustainability?
The first step of the study is better understanding the true relationship between
government funding and other nonprofit funding sources. Previous analyses are mainly
based on national statistics that do not distinguish between specific nonprofit sectors, and
most extant empirical studies fail to provide a convincing sampling frame. This study
intends to achieve a more clarified understanding by focusing only on two specific
nonprofit sectors – human services and community improvement – exclusively in the
state of New Jersey. It is expected that such a design helps to generate results directly
applicable to these two sectors in a more methodologically rigorous way, and that the
results can also be used as a meaningful reference to other sectors.
One primary goal of this study is to empirically examine the determinants of
nonprofit revenue diversification. Existing literature provides very limited information
about what factors predict or drive a nonprofit organization‟s level of revenue
diversification, and no theoretical framework is available to formulate systematic

4
investigation into the determining factors of revenue diversification. It is therefore
necessary to develop a model to explain variations of revenue diversification and
empirically test the model to shed more light on future research on the topic.
Another major topic of the study is the effect of revenue diversification on
nonprofit financial performance. There have historically been two seemingly
contradictory proposals in nonprofit financial management theory. The first one holds
that revenue diversification has a positive effect on nonprofit financial performance,
while the other proposes that a more diversified funding pattern might negatively impact
nonprofit performance. Very limited empirical research has specifically looked at the
relationship between nonprofit financing and nonprofit performance. This study
attempts to present a model so as to facilitate better understanding of this topic and hence
providing additional information for nonprofit managers in making decisions about
revenue generation strategies.
It is expected that the aforementioned analyses would yield some interesting
findings on these subjects and this study would stimulate more scholarly dialogue on the
topics of nonprofit funding strategies, revenue diversification, and financial performance.
1.3 Significance of the Study
This study makes several contributions to both knowledge building and practice
improvement in nonprofit financial management.
First, from a theoretical standpoint, this study proposes a comprehensive

5
framework of studying nonprofit financial performance that links structural, managerial
and environmental factors with nonprofit revenue diversification and then with financial
performance of nonprofit organizations.
Second, this study contributes to the research on nonprofit revenue
diversification. Extant literature fails to provide a good, clarified definition of revenue
diversification, and the use of this term has been rather inconsistent in existing empirical
studies. This study fills this gap by providing a clear definition of what revenue
diversification means for nonprofit organizations and empirically testing the definition.
Third, this study enhances our understanding of funding strategies, particularly
that of revenue diversification, and their relationship with financial sustainability. The
results from the analysis can be usefully applied by nonprofit organizations seeking to
design and implement more effective funding strategies in order to achieve more
satisfactory performance outcomes. In particular, this study brings new evidence and
some methodological refinements to bear on the linkage between nonprofit revenue
diversification and nonprofit performance. Suggestions are then provided as to how
future research can further develop and test the relationships explored in this study.
Finally, this study implemented an original research design that incorporates
two different survey methods with mixed groups to test the effect of these methods on
survey results. The comparative analysis of the methodological design provides useful
information for nonprofit researchers in their future survey studies.

6
1.4 Outline of the Dissertation
Following this introduction, Chapter 2 provides a survey of relevant literature
for the study. This chapter reviews the literature on conceptual framework on
government-nonprofit relationships in a dynamic societal context primarily drawn from
the rational choice theory in the field of economics. It then provides an overview of
related studies on nonprofit financial strategic pattern, revenue diversification,
organizational performance, and performance measurement of nonprofit organizations.
It also reviews the factors influencing nonprofit performance that have been examined in
previous studies. Finally, the chapter identifies research gaps that need to be addressed.
Drawn from the literature reviewed, Chapter 3 proposes a conceptual
framework of nonprofit performance that links nonprofit organizational and
environmental factors and nonprofit revenue diversification with nonprofit financial
sustainability measures. Based on the relationships demonstrated in the framework, this
chapter discusses the research questions and presents all research hypotheses designed to
answer the broad research questions.
Chapter 4 presents a detailed analysis of research design. The chapter
introduces data sources of the study and sample selection for the survey study. This
chapter includes a detailed description of survey instrument design and operationalization
of the variables. Data collection procedures and statistical techniques are described here
as well.
Chapter 5 reports data analysis results, including survey response rate,

7
descriptive statistics, and hypothesis testing results. By using multiple revenue
diversification and financial sustainability measures, regression coefficients are estimated
based on OLS specifications. The chapter interprets the findings from statistical
analyses, and then concludes with a discussion of hypothesis testing results.
Chapter 6 discusses theoretical contributions, managerial implications, and
methodological improvements. The chapter highlights this study‟s contributions to the
literature of nonprofit financial management that includes topics such as nonprofit
funding pattern, nonprofit revenue diversification, and nonprofit financial performance.
The chapter also assesses limitations of the study and suggests directions for future
research.

8
CHAPTER TWO
LITERATURE REVIEW
This chapter provides a survey of relevant literature and theoretical foundations
for the study. The chapter starts with a brief review of America‟s nonprofit sector.
One dimension of the significance of the nonprofit sector is its developing scale in recent
years. According to the National Center for Charitable Statistics (NCCS) at the Urban
Institute, approximately 1.57 million1 nonprofit organizations have been recognized by
the Internal Revenue Service (IRS) as of 2009 tax year. Meanwhile, nonprofit America
is a sizable part of the American economy. The sector has never been richer if measured
in private contributions and government grants and contracts (Light, 2000). The
visibility of the sector is highlighted by its scale of employment as well – the sector has a
substantial impact on employment (of both paid employees and unpaid volunteers). As
of 2006, nonprofit organizations employed 12.9 million paid employees, nearly 10
percent of the U.S. work force, and accounted for 8.11% of all wages and salaries paid in
the U.S. (Wing et al., 2006).
All nonprofit organizations are recognized as tax-exempt according to Section
501(c) of Title 26 of the U.S. Tax Code, and this formal exemption from paying federal
income taxes is the primary feature of a nonprofit entity. The IRS categorizes nonprofit
1 This number includes 997,579 public charities, 118,423 private foundations, and 453,570 other
types of nonprofit organizations, such as chambers of commerce, fraternal organizations and civic
leagues.

9
organizations under 27 different sub-sections of Section 501(c). For example, social
welfare organizations are categorized as 501(c)(4), business leagues 501(c)(6), and
fraternal beneficiary societies 501(c)(8).
About half of nonprofits in the U.S. are charitable organizations that are exempt
under Section 501(c)(3). This status permits donations to these organizations to be
tax-deductible to the donor. These organizations qualifying under section 501(c)(3),
together with the 501(c)(4) organizations, are of greatest interest to most nonprofit
researchers, because nonprofits under these two sections are generally dedicated
specifically to public charity and social welfare. 501(c)(3) subsection includes two
types of organizations: public charities and private foundations. As of April 2010,
501(c)(3) public charities include 509,231 filing organizations2 involved in a wide range
of service fields such as the arts, education, health care, and human services. The
88,879 filing 501(c)(3) private foundations3 are primarily grant-making organizations
that make grants to other nonprofit organizations. The nonprofit research community
traditionally treat these two types of organizations separately, with more research
attention targeted toward the 501(c)(3) public charities.
501(c)(3) organizations that report gross receipts of less than $25,000 in a fiscal
year were once not required to file a Form 990 with the IRS. This policy was recently
changed. A federal law – the Pension Protection Act of 2006 – now requires that all
2
Source: IRS Business Master File (modified by NCCS) 04/2010, retrieved from
http://nccsdataweb.urban.org/PubApps/nonprofit-overview-sumRpt.php?v=sum&t=pc&f=0 3 Ibid.

10
organizations file tax forms with the IRS the following year, regardless of their annual
revenue amount. Those that fail to do so for three consecutive years will lose their
tax-exempt status.
With a view to facilitating data collection and analysis and providing better
quality information for the nonprofit sector and for society at large, NCCS developed the
National Taxonomy of Exempt Enterprises (NTEE) system to classify nonprofit
organizations. The NTEE4 classification system breaks down the nonprofit universe
into 26 major groups under 10 broad categories as follows:
I. Arts, Culture, and Humanities A
II. Education – B
III. Environment and Animals - C, D
IV. Health - E, F, G, H
V. Human Services - I, J, K, L, M, N, O, P
VI. International, Foreign Affairs - Q
VII. Public, Societal Benefit - R, S, T, U, V, W
VIII. Religion Related - X
IX. Mutual/Membership Benefit - Y
X. Unknown, Unclassified - Z
It needs to be noted that the study population of the current research are
501(c)3 public charities. The purpose of this chapter is to summarize findings within
nonprofit financing and nonprofit performance disciplines that inform the conceptual
framework and research design of this study. The rest of this chapter is organized as
follows. The first section is an overview of nonprofit financing, including a discussion
4 Sources: http://www.guidestar.org/npo/ntee.jsp

11
of revenue categories and funding sources, followed by an exploration of relevant studies
on nonprofit revenue diversification. Next, nonprofit organizational performance is
discussed, with particular attention to nonprofit financial performance and financial
performance measurement. A discussion of factors influencing nonprofit performance
is provided to understand why certain practices are recommended to enhance nonprofit
performance. Finally, the chapter concludes with a discussion of gaps in the reviewed
research and how this study attempts to address these issues.
2.1 Nonprofit Financing
The key to organizational survival is the ability to acquire and maintain
resources (Pfeffer and Salancik, 1978 in Froelich, 1999). Financial resource acquisition
has always been a priority for nonprofit organizations as they try to solicit financial
support to pay for the programs they create and implement. It is widely accepted in the
nonprofit research community that the most fundamental and critical challenge that
nonprofit America has confronted is a significant fiscal squeeze. Lane (2006) defined
financial stress as an imbalance between revenue and expenses that threatens a
nonprofit‟s effectiveness in program and service delivery, and even the organization‟s
survival. According to Salamon (2003), “fiscal distress has been a way of life for (the
nonprofit) sector throughout its history.” Young (2007) easily found stories of fiscal
stress and failure of nonprofit organizations, particularly of some prominent ones.
It is not difficult to find some “hard data” to empirically support this scholarly

12
perception. In their 2003 report on the Indiana nonprofit sector, Grønbjerg and Clerkin
identified top three “major challenges” for different groups of nonprofit organizations.
“Obtaining funding” was the most visible challenge across the board: it was the top one
challenge for human service nonprofits (76%) and mutual benefits nonprofits (100%);
number two challenge for health nonprofits (73%), and arts, culture, and humanities
nonprofits (80%); and number three challenge for education nonprofits (48%). As the
American nonprofit sector is now trying to survive the most critical economic recession it
has ever been facing, obtaining sufficient funding is of even more particular importance.
In a 2009 survey by McLean and Brouwer, more than half of organizations reported
having experienced a decrease in contributions during the period from October 2008 to
February 2009, compared to the same period a year earlier. Eight percent of responding
organizations were having trouble making their ends meet and were “in imminent danger
of closing their doors because of a lack of financial resources (McLean and Brouwer,
2009).”
As the nonprofit sector is experiencing the current economic downturn, it is a
good time to revisit some important questions in nonprofit financial management, such as:
What sources are nonprofits relying on? How difficult it is for nonprofits to obtain and
secure these funding sources? And what are effects of these sources on an overall
nonprofit revenue structure as well as organizational performance?

13
2.1.1 Funding Sources of Nonprofit Organizations
Nonprofit organizations rely on a variety of sources to finance their daily
operations. Examining scholarly work on nonprofit finance reveals two general
typologies of nonprofit revenue sources. Some scholars (Froelich, 1999; Guo, 2006)
categorize nonprofit income into three broad types: government funding, private
contributions, and commercialized income. These three broad revenue categories can
be further broken down into more different sources (Fischer et al., 2007; Froelich, 1999;
Pratt, 2005; Sherlock and Gravelle, 2009; Young, 2007). For example, private
contributions can come from individual donors, corporate donors, grant making
foundations, and more.
This study develops and summarizes eight general revenue archetypes largely
from the work of Froelich (1999) and Pratt (2005) to further differentiate within the three
broad revenue categories. These eight funding sources are: government funding,
individual donations, corporation contributions, foundation grants, the United Way grants,
fees including membership dues, service charges, bank loans, and other that include
investment income. Figure 2.1 illustrates the two typologies to present the
correspondence between them. Government funding stands by itself as the first revenue
category for nonprofit organizations; individual donations, corporation contributions,
foundation grants, and the United Way grants are grouped under the second category
which is private contributions; and fees, bank loans, as well as all other types of income
are grouped under the third category which is commercialized income.

14
Figure 2.1 Typologies of Nonprofit Funding Sources
Nonprofit organizations are far from uniform in their dependence on these
different funding sources (Young, 2007), and distribution of nonprofit revenue –
percentage of total income derived from different funding sources – varies with service
fields. For example, nonprofits in fields such as education are, on average, most heavily
dependent on fees, while human services organizations rely mainly on government
funding. The following sections review the relevant literature on government funding,
private contributions, and commercialized income separately.
1. Government Funding
Government has been increasingly devolving the provision of public programs
and delivery of public services to cross-sectoral collaborations among public, private
for-profit, and nonprofit organizations. The collaborative relationship forged between

15
government and the nonprofit sector – a major collaborator with government – has
emerged as a new institutional arrangement through which to deal with a variety of social
concerns ranging from education, health care, to environmental protection.
Collaboration formed by government agencies and nonprofit organizations has become
the most popular mode of intersectoral collaboration at various levels. Nonprofit
managers are generally aware that government can be a good source of support for their
operation and development (Rushton and Brooks, 2007).
Government support for nonprofits come from different levels – federal, state
and local, and with various forms – direct funding such as grants and contracts for service,
as well as indirect assistance such as purchased services like Medicare payments.
Traditionally, government funding has been a prominently visible funding source for the
nonprofit sector across the board, only to different degrees, among all types of nonprofit
organizations. With regard to service field – an area that needs attention when
examining the funding relationship between government and nonprofits, it is reasonable
to expect substantial variation in this relationship among different substantive fields.
For instance, Boris and Steuerle (1999) have noted that government funding in such areas
as health and human services is much more extensive than in other areas like arts and
advocacy; thus, nonprofits operating in health and human services might display different
relationship with government from those in the other areas. Industry differences have
actually been recognized as a significant variable in different nonprofit models and it is
believed that there are systematic differences across service fields in terms of nonprofit

16
governance and performance.
Nonprofit funding from government sources could vary and has been varying
over time with changes in political environment, political leadership and policy initiative
(Salamon, 2003). Still, government has been a largely reliable and sustainable funder
for the nonprofit sector because government funding does not result in a serious problem
of revenue volatility like other sources such as private contributions (Froelich, 1999).
According to resource dependence theory, nonprofit organizations are constrained by the
resource environment as a consequence of their resource needs. If a certain type of
funding source is considered to be volatile, there is a risk associated with a heavy reliance
on this funding source. Although dependence on government funding is not associated
with revenue volatility, there are still such concerns regarding its negative effects like
changes in nonprofits‟ internal processes and structures, bureaucratization and loss of
administrative autonomy, and goal displacement (Froelich, 1999). Practically, certain
special demands are associated with a nonprofit revenue pattern dominated by
government funding including maintenance of political relationships and possibly
political skewing of mission or programs due to heavy dependence on inflexible funding
and necessary compliance with government funders.
Empirical evidence provides mixed results as to what kind of impact
government funding might have on other nonprofit revenue sources and it is still not well
understood whether government subsidies displace or leverage private giving or the two
sources of funds are independent (Brooks, 2000). Government support may diminish

17
public support to a nonprofit by taking responsibility for its funding, and can potentially
cause it to reduce its fund development efforts which will result in diminished revenue
from non-governmental sources. This phenomenon is referred to as crowding-out.
Another intuition on the effect of government funding on other financial sources for
nonprofits is that government support can serve as a signal of quality and reputability that
stimulates fund generation from other sources. This is what we call crowding-in.
There seems to be little consensus regarding this as a number of studies find significant
crowding-out effects while other studies find empirical evidence of crowding-in
(Sherlock and Gravelle, 2007). Brooks (2000) have found that for human and social
welfare as well as health organizations, federal spending does not have a significant
impact on private contributions while state spending crowds out statistically significant in
private contributions; for nonprofits operating in education, arts and culture, neither
federal spending nor state spending has a statistically significant impact on private
contribution. Brooks (2000) concluded these findings by stating that government
funding “tends to displace private giving more for necessities than „luxuries‟...” In
another study, Smith (2007) found that government grants have the potential to crowd-in
private donations to performing arts organizations. These findings suggest that the
impact of government support varies with service field, and that this effect is sensitive to
some methodological techniques such as sampling and estimation method.

18
2. Private Contributions
Private contributions5 are another very important revenue category for the
nonprofit sector. This category mainly includes funds from individual donors, corporate
donors, foundations, and other grant-making organizations such as the United Way.
There has been considerable stability in the source of private contributions over time in
the United States. Compared to cutbacks in government financial support, private
giving to the nonprofit sector has considerably growing over the past decade (Salamon,
2003).
While obtaining and maintaining government funding usually does not incur
high costs on nonprofit organizations, generating private contributions requires some
expenditure on fundraising. There has recently been an increased concern about
excessive fund-raising costs in some organizations. In addition to this concern, two
major constraints are associated with nonprofits‟ dependence on private contributions:
revenue volatility and goal displacement (Froelich, 1999). Revenue volatility is
particularly marked in individual and corporate donations due to the unpredictability and
instability of these two types of contributions. This volatility has been particularly
pronounced in the current economic crisis. There are two key elements of revenue
volatility, one is the gross amount of revenue fluctuations in a given period of time, for
example, in every month or year, and the other is the extent to which these fluctuations
5 Some use the terms “private donations” or “public support” to refer to this type of nonprofit revenue
category.

19
are related to cyclical changes in the economy. Compared to those in government
funding and commercialized income, the fluctuations in private contributions are more
related to cyclical economic ups and downs. As to the risk of goal displacement, Kelly
(1998) suggested that nonprofit organizations might have to alter their organizational
goals or priorities to acquire or sustain a particular contribution or foundation grant.
Empirical findings provide mixed results regarding this. For example, in their study on
the effect of funding changes on nonprofit organizations‟ program service delivery,
Hughes and Luksetich (2004) concluded that greater reliance on private donations and
corporate donations does not significantly change spending patterns nor affect level of
spending on programs and services.
3. Commercialized Income
In addition to seeking funding from government agencies and private donors
and donor agencies, nonprofit organizations nowadays increasingly engage themselves in
various commercial activities for revenue generation, such as selling products to
customers and charging fees for program services. Just like the other two major
nonprofit revenue categories, commercialized revenue generation has its advantages and
disadvantages. Studies suggest that there is significantly less revenue volatility or goal
displacement associated with nonprofit commercial activities. Table 2.1 is part of
Froelich‟s revenue strategy profiles that show the level of revenue volatility and goal
displacement effects of the three revenue categories.

20
Table 2.1 Revenue Strategy Profiles (Froelich 1999)
Government Funding Private Contributions Commercialized Income
Revenue volatility Low High Moderate
Goal displacement effects Moderately strong Strong Weak
While the benefits of commercialized income are easy to see, there are
potential costs to these revenues as well. Nonprofit researchers have identified two
types of unintended consequence of commercialized income – potential financial risk and
a potential loss of values distinctive to the nonprofit sector. Research has recommended
attention to potential financial risk associated with nonprofit venture failure, especially of
those small, start-up nonprofits. While very few studies have examined the
consequence, some empirical research has been conducted to evaluate the effect of
commercialized income on nonprofit performance (Hughes and Luksetich, 2004; Smith,
2007). Using a sample of 155 human services organizations, Guo (2006) examined
what kind of effect commercialized income might have on organizational performance,
and the study revealed some mixed results. On one hand, commercial activities have a
significant and positive impact on organization‟s self-sufficiency, reputation, and its
ability to attract and retain paid employees; on the other hand, commercial activities do
not seem to significantly contribute to an organization‟s ability to attract and retain
donors and volunteers, nor help mission attainment and program and service delivery.
The ongoing process of commercialization needs to be better understood, and the
longitudinal impact of commercialization on organizational performance is to be

21
examined in additional future research.
The answer to the critical question – does commercialization contribute to
nonprofit organization‟s core mission – varies. Existing literature provides examples of
both that support nonprofit mission and that do not. Success stories about creating
commercial activities to supplement funding and sustain mission achievement are
however rare (Foster and Bradach, 2005).
Despite the ongoing debate regarding the so-called optimal financing strategy
for nonprofits, the fact is that nonprofit organizations have been increasingly involved in
multiple funding strategies to generate money as they strive to reduce their vulnerability
to income uncertainties and the influence of resource providers. When nonprofits are
moving away from concentrated dependence on a single revenue strategy (Froelich,
1999), the topic of revenue diversification has been called to the forefront. One
potential answer to the question “how nonprofit organizations could have better prepared
themselves for the increasingly challenging and fierce resource environment” is by
diversifying their revenue structure, that is, seeking funds via a variety of sources in order
to support their missions.
2.1.2 Nonprofit Revenue Diversification
Revenue diversification is a key concept in economics, finance, and public
budgeting literatures. Financial literature notes that it is important for investors to build
an appropriate mix of investments so that their overall portfolio can achieve a maximum

22
return on investment without undo exposure to risk. Economists Harry Markowitz and
William Sharpe crafted Modern Portfolio Theory with intent to identify what they called
the efficient frontier which is a specific mix of assets that results in the highest return
recognizing the level of risk the investor is willing to accept. Revenue diversification
refers to the process of changing the level of diversity of revenue structure (Siegel et al.,
1995) and this concept has been applied to numerous other areas within economics and
finance. Revenue diversification has been advocated in the realm of public
administration as a desirable practice for both state and local governments. Over the
half past century, sub-national governments have been increasingly relying on multiple
sources of revenue (Carroll, 2005). Like corporate financing and public budgeting
research, nonprofit research generally views positively the rhetoric and practice of
revenue diversification. Several scholars have studied nonprofit revenue diversification
but it stills remains to be an understudied area where an overall theory of nonprofit
dependence on difference funding sources is missing (Fischer et al., 2007).
Definition and Measurement
Prior to developing a measure of nonprofit revenue diversification for empirical
analysis, it is essential to provide an explicit definition of the term, which is unfortunately
difficult to find within the extant literature on nonprofit research. Two different
definitions of this term diversification vaguely emerge from reviewing studies on
nonprofit funding. Revenue diversification refers to funding variety in some scholarly
work, and revenue balance in some other scholarly work (Carroll, 2009; Crittenden, 2000;

23
Fischer et al., 2007; Hager, 2001).
The usage of the term diversification has been inconsistent in nonprofit study.
Nonprofit researchers have proposed and used two different measures of nonprofit
revenue diversification that are related to the definitions discussed above. One simple
approach is to count the number of revenue sources relied upon by a certain nonprofit.
From a statistical point of view, there might be a caveat to this purely mathematical
method – it does not take into account the proportion of each resource that is included in
a nonprofit‟s revenue structure. It is arguable whether reliance on all major sources is
surely a more diversified structure than that on fewer sources. Even nonprofits that rely
on same number of revenue sources are not necessarily at the same level of revenue
diversification since some can have a revenue structure with relatively equal reliance on
each source while others may present heavy reliance on only one source with minor
reliance on the others.
Some scholars (Carroll, 2009; Fischer et al., 2007) introduced a concentration
index as another measure of nonprofit revenue diversification that incorporates all
revenue categories used in their studies to define diversification. This index is
developed from the Herfindahl-Hirschman Index (HHI) and writes as:
NN
R
RD
n
i
i
/)1(
11
2
where N is the total number of revenue categories, Ri is the fraction of revenue generated
by each of the revenue categories. This measure implies that higher values of RD

24
indicate grater levels of diversification of nonprofit revenue structures.
However, these are two caveats that must be attended with this modified HHI
measure. First, this measure of revenue diversification implies that each organization is
equivalent in its ability to diversify the revenue structure, which is not true in many cases.
Second, the revenue diversification measure assumes that each organization utilizes each
of the revenue categories for generating income. Again, this is not always the case.
For example, a certain organization is not involved in any commercial activities to
generate money. Therefore, when it is the case that an organization does not generate
revenue from one of the categories included in the HHI measure, the value of Ri
associated with that revenue category will equal zero. Aside from exhibiting a lower
score pertaining to the organization‟s level of revenue diversification, the implication of
this result is that an organization that does not have commercialized income and an
organization that does not have government funding could potentially show a
comparatively equivalent level of revenue diversification, even though the volatility of
the revenue structures between the two organizations could differ significantly. In such
cases, it would be difficult to determine the extent to which nonprofit revenue
diversification aids in preparing nonprofits for financial crises. These two issues could
be controlled for in the empirical model through the use of dichotomous variables.
In addition, whether a revenue pattern in which total revenue is equally
distributed in all revenue categories is necessarily the optimal structure for nonprofit
organizations is still questionable. Fischer et al. (2007) suggested that the best revenue

25
structure for a nonprofit may not be the most diversified, but rather the one that reflects
the importance of the various objectives of the organization.
Factors Influencing Revenue Diversification
Insufficient attention has been paid to examining the determining factors of the
overall level of revenue diversification for nonprofit organizations. Chang and
Tuckman (1996), in their early study on nonprofit revenue diversification, found that the
activity of a non-profit and the proportion of its expenditures that it devotes to
fund-raising affect its ability to diversify its financing pattern. Fischer and his
colleagues (2007) proposed a relationship between the nature of services provided and
the revenue mix of nonprofit organizations. The financing of nonprofit organizations is
significantly related to the publicness as determined by the nature of services and benefits
associated with the services (Fischer et al., 2007). The service field in which a nonprofit
operates, which is to some degree related to the nature of services provided by the
organization, may also affect the level of revenue diversification.
In addition to the intrinsic characteristic of nonprofit programs and services,
scholars suggested a number of other organizational characteristics that might influence
revenue diversification. Less mature organizations are not as likely as established
organizations to seek and manage multiple funding sources due to a lack of experience
(Fischer et al., 2007). Larger organizations are more likely to adopt diversification
strategies because of the sufficient capacity they can employ in fund development.
Organizations are better equipped to function independently with a higher level of

26
organizational resources and therefore rely less on government funding.
Pros and Cons of Revenue Diversification
Revenue diversification in the nonprofit sector has been largely motivated by
efficiency and organizational performance improvement. Many nonprofit organizations
now engage in a wide array of activities to provide the financial support necessary for
continued pursuit of their organizational missions. In addition, relying on different
revenue sources allows nonprofits to diversify risks and stabilize revenue streams
(Carroll and Stater, 2009; Greenlee and Trussel, 2000; Grønbjerg, 1993; Tuckman and
Chang, 1991), which in turn will enhance nonprofit outcomes. Most of these arguments
are based on findings from analysis that heavily relies on panel data sets generated from
IRS 990 form information. Very few researchers have attempted to examine revenue
diversification by gathering original information directly from organizations, and
Crittenden‟s 2000 study was probably the only such research effort to do so. The
findings of this study (Crittenden, 2000) include: a positive relationship existed between
revenue diversification and organizational performance of social service nonprofits; less
successful organizations were less diversified in terms of funding sources and more
dependent upon government support, and successful organizations tended to be more
balanced in their sources of revenue. These seem to support the findings and
conclusions derived from the panel data analyses that nonprofit organizations should
proactively develop a diversified funding pattern and that they should probably focus
more on non-governmental funding sources.

27
However, this motivation for diversifying revenue structures is arguably at odds
with the concern held by some nonprofit researchers that revenue complexity will result
in nonprofit financial illusions and even disasters. The organization often times has to
trade off each source against the other, and as indicated by Froelich (1999), although
revenue diversification has its appeal, it also carries constraints and sometimes risks.
For instance, satisfying the funding criteria of each provider is very likely to result in goal
conflicts, not to mention the increase in overheads of nonprofits (DiMaggio, 1986;
Tuckman, 1992; and Weisbrod, 1998a). Some researchers concluded that, compared to
a diversified financing pattern, there are benefits to relying on a more concentrated
revenue structure such as lower administrative structure and less fund-raising expenses
(Fischer et al., 2007). In addition, there has been much discussion as to whether
changing revenue sources (from largely a government-dominated pattern to develop more
sources for support) will have an effect on nonprofit‟s behavior such as management and
then on goals like program service delivery. Dealing with multiple funding
relationships obviously increases management complexity (DiMaggio, 1986; Grønbjerg,
1993) and nonprofits may be confronted with increasing goal conflicts due to varying
requirements from different funders (Ferris and Graddy, 1989; Weisbrod, 1998a).
In addition to the impact on organizational performance, some scholars have
noticed revenue structure‟s influence on board performance. Hodge and Picolo (2005)
observed variations in board practices among nonprofits that are dependent on
government funding, private contributions, and commercialized income. Executives of

28
organizations that largely depend on private contributions tend to use significantly more
board involvement practices than those organizations that are dependent on government
funding and commercialized income (Hodge and Picolo, 2005).
2.2 Nonprofit Organizational Performance
The nonprofit sector has been growing quickly in recent years, and nonprofit
management has undergone self-examination aimed at better organizational performance
(Frumkin, 2001; Salamon, 2003). However, performance is an elusive term for any
organization, particularly for nonprofit organization. Performance is the action or
process of carrying out or accomplishing a task, function, or mission, and organizational
performance is therefore dependent on objectives and missions assumed by organizations.
Performance measurement in the private business sector is much simpler because its
pursuit of profit makes gauging mission achievement straightforward. The multiple
services and goals however make the performance of nonprofits more ambiguous.
Nonprofit performance is therefore multi-dimensional and not easily
quantifiable (Brooks, 2002). Prior research has been trying to identify different
dimensions of organizational performance for nonprofit organizations. Forbes (1998)
identified goal attainment and resource acquisition for nonprofits. Herman and Renz
(2004) put forward two parallel theoretical perspectives on nonprofit performance – goal
approach and system resource approach. Kushner and Poole (1996) devised a model of

29
nonprofit organizational performance which contains four elements – resource acquisition,
efficiency of operations, goal attainment, and client satisfaction. Nobbie and Brudney
(2003) proposed five performance dimensions based on previous scholarly works – goal
achievement, financial viability and resource acquisition, internal process, CEO job
satisfaction, and CEO performance. Shoham et al. (2006) suggested that performance
should account for both internal dimension like input and output and external dimension
such as stakeholder satisfaction. Two broad dimensions of performance emerge from
the review: mission achievement and financial performance.
The significance of the financial aspect of nonprofit performance is highlighted
by some of the big challenges the nonprofit community has been facing recently – tighter
funding streams and rising expenses that have made nonprofit operations more difficult
and might affect the long term viability and effectiveness of individual organizations and
even the sector as a whole (Center for Non-Profit Corporations, 2005).
2.2.1 Nonprofit Performance Measurement
Performance evaluation is a difficult task in any organization. For nonprofit
organizations, performance measurement has further complications due to several
significant limitations. First, nonprofit performance is a multidimensional concept
combining both financial and non-financial dimensions. Nonprofit status itself limits
the accuracy and legitimacy of relying exclusively on financial performance indicators
that have been commonly used for corporate performance (Brooks, 2002; Brown, 2005).

30
Second, there is no single simple “best practices” way that is applicable to all types of
nonprofits that operate in tremendously varying programmatic and service areas.
While there is unfortunately a lack of clearly defined and comprehensive model
of nonprofit organizational performance, a comprehensive and easily applicable
performance measurement system is still to be developed despite considerable rhetoric
about the significance of measuring nonprofit performance. Prior studies investigating
nonprofit organizational performance usually adopt multiple assessment strategies to
address the limitations discussed above. In correspondence to the two dimensions of
nonprofit performance – mission achievement and financial performance, there are two
approaches of nonprofit performance measurement – one is outcome oriented and the
other is resource-oriented (Forbes, 1998; Herman and Renz, 2004; Tuckman and Chang,
1991).
A renewed interest in performance measurement brought about by the appeal of
outcome-based management results in a body of literature that is mostly descriptive and
normative. Many nonprofit scholars have observed that nonprofit organizations are
under increasing pressure to demonstrate their efficiency and effectiveness, as the current
funding environment increasingly stress the importance of nonprofit accountability and
measuring nonprofit performance (Salamon, 2003; Smith and Lipsky, 1993).
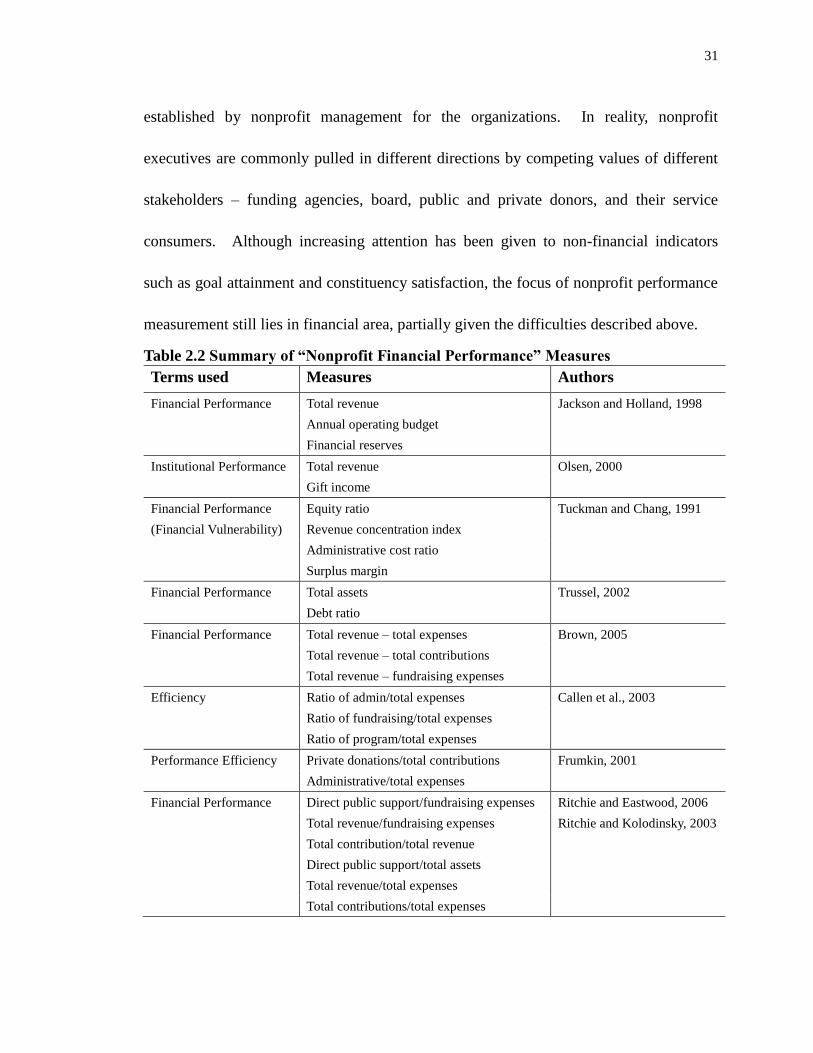
A set of criteria is developed to evaluate an organization‟s socially oriented
performance such as organizational growth and stakeholders‟ satisfaction. Nonprofit
performance could be ideally measured in terms of accomplishing goals and missions
31
established by nonprofit management for the organizations. In reality, nonprofit
executives are commonly pulled in different directions by competing values of different
stakeholders – funding agencies, board, public and private donors, and their service
consumers. Although increasing attention has been given to non-financial indicators
such as goal attainment and constituency satisfaction, the focus of nonprofit performance
measurement still lies in financial area, partially given the difficulties described above.
Table 2.2 Summary of “Nonprofit Financial Performance” Measures
Terms used Measures Authors
Financial Performance Total revenue Jackson and Holland, 1998
Annual operating budget
Financial reserves
Institutional Performance Total revenue Olsen, 2000
Gift income
Financial Performance Equity ratio Tuckman and Chang, 1991
(Financial Vulnerability) Revenue concentration index
Administrative cost ratio
Surplus margin
Financial Performance Total assets Trussel, 2002
Debt ratio
Financial Performance Total revenue – total expenses Brown, 2005
Total revenue – total contributions
Total revenue – fundraising expenses
Efficiency Ratio of admin/total expenses Callen et al., 2003
Ratio of fundraising/total expenses
Ratio of program/total expenses
Performance Efficiency Private donations/total contributions Frumkin, 2001
Administrative/total expenses
Financial Performance Direct public support/fundraising expenses Ritchie and Eastwood, 2006
Total revenue/fundraising expenses Ritchie and Kolodinsky, 2003
Total contribution/total revenue
Direct public support/total assets
Total revenue/total expenses
Total contributions/total expenses

32
There are multiple dimensions of nonprofit financial performance: input, output,
and outcome. Nonprofit input and output can be measured through accounting
information that allows nonprofit managers to compare key variables such as revenues
and costs, and to conduct further financial analysis. Previous studies use different
combinations of financial criteria to assess nonprofit financial performance based on
accounting information from IRS 990 forms. Table 2.2 offers some of the commonly
used measures identified from the literature. In nonprofit management and nonprofit
performance measurement, input and output are two dimensions that are usually difficult
to differentiate. Resource acquisition that encompasses both input and output has long
been regarded as a powerful indicator of both board performance and nonprofit
management (Callen et al., 2003; Nobbie and Brudney 2003; Olsen, 2000; Ritchie and
Kolodinsky, 2003). Tuckman and Chang (1991), in their seminal work on nonprofit
financial vulnerability, provided a number of performance measures for nonprofits. A
nonprofit is financially vulnerable if it is likely to cut back its service offerings
immediately when it experiences a financial shock. They use four financial criteria to
examine the financial vulnerability of a national sample of nonprofits. Nonprofits with
inadequate equity balances (the amount left over when liabilities are subtracted from
assets), lower revenue concentration, low administrative/total expenses ratio, and low or
negative operating margins are considered to be financially vulnerable.

33
2.2.2 Factors Influencing Nonprofit Performance
Organizational performance is determined by multiple contextual factors.
Organizational research has examined performance extensively in business field which
lend us a rich resource to investigate nonprofit performance. Weiner and Mahoney
(1981) created a comprehensive model of corporate performance that contains
environmental, organizational, and leadership factors and proposed that external
influences, organizational characteristics, and leadership contribute to corporate
performance. Nonprofit literature fails to provide a parallel model for analyzing
performance of nonprofit organizations, yet it would be useful to approach nonprofit
performance from those dimensions identified in corporate performance literature like
theirs.
1. Funding Sources and Revenue Structure
The relationship between government and nonprofits is recognized to be
impacting nonprofit governance and ultimately impacting nonprofit performance.
However, this relationship has not been systematically studied and existing research
provide rather mixed results as to the impact of government funding on revenue structure
and nonprofit performance.
Previous studies suggested there are some unintended consequences from
government funding on nonprofit management in terms of nonprofit‟s legitimacy and
ability to generate revenue from non-governmental sources (Brooks, 2005; Hughes and
Luksetich, 2004). Economists have found that “an extra dollar in (government)
subsidies crowds out between 5 - 40 cents in private donations.” (Brooks, 2005) One

34
explanation for this “crowding out” effect is that government funders usually tend to
place some restrictions on nonprofits so as to prohibit spending not directly associated
with program provision and service delivery. This however presents a dilemma because
nonprofits generally do not fundraise sufficiently (Brooks, 2005; Thornton, 2006), while
limiting the uses of government funds might affect the performance of nonprofits.
Compared to organizations relying principally on government funding, those
that rely on private donations are less efficient (Callen et al., 2003). Some scholars
(Hughes and Luksetich, 2004; Massarsky and Beinhacker, 2002) argue that a greater
reliance on private funding does not necessarily divert funding from program service
delivery. Hughes and Luksetich (2004) found that whether funds come from
government or private sources seems to have little impact on management expenses or
fundraising activities and does not significantly change nonprofit spending patterns.
Operating in a highly competitive and increasingly market-driven environment,
nonprofits are under pressure to rely on a much more diversified revenue structure to
generate funds ranging from earned income to individual donations. If the degree of
revenue diversification has a positive impact on performance, public administrators as
well as nonprofit managers might find it more politically palatable to invest resources
into fund raising and increase operating budgets that would attract more donors and
contributors. However, the issue of how revenue diversification affects non-profits has
not been fully explored. Chang and Tuckman (1996) found that diversified revenue
sources are more likely to be associated with a strong financial position than are

35
concentrated revenue sources. However, some researchers asked whether revenue
diversification is important to nonprofit performance and it is still not very clear what
effects diversification has on organizational outcomes (Fischer et al., 2007). By
reexamining Tuckman-Chang‟s vulnerability measures, Hager (2001) studied a group of
arts organizations to explore the reasons of organizational demise of nonprofits. For all
subsectors except dance organizations, the average failing organizations had a greater
concentration of revenues than the average survivor, which suggests that a balanced
revenue structure improves nonprofits‟ performance.
Structure and Capacity
Organizational structure of nonprofit organizations refers to the ways a
nonprofit is organized in terms of governance and management. Organizational
capacity of nonprofit organizations refers to the resources a nonprofit enjoys for
operation and management. Nonprofit organizations with less efficient structure and
fewer resources may find it more difficult to achieve their missions. Higher level of
capacity indicates an organization‟s capability to operate on its own as well as the level of
attention from potential donors and funders. Size is one capacity measure commonly
used in nonprofit research and has been found to be related to organizational
effectiveness (Herman and Renz, 1998).
Boards make a difference in nonprofit performance, but it is still not very clear
how they do this. Any variation in board composition and governance is likely to
influence the structure and functioning of nonprofit organizations, and ultimately

36
organizational performance. In their study of a group of New York City based nonprofit
organizations, O‟Regan and Oster (2002) found that nonprofit boards with high degrees
of government funding tend to focus less on some of the traditional functions – like
fund-raising – and more on fiduciary and boundary-spanning kinds of activities such as
financial monitoring and advocacy. Percentage of major donors on the board of a
sample of large sized6 New York state nonprofits was found to have a negative impact on
performance as board members of such organizations are more likely to be concerned
with the external fundraising environment rather than with internal efficiency issues
(Callen et al., 2003). Their study also discovered that nonprofits with a larger board and
nonprofits of a smaller size are more likely to have a higher level of fundraising/total
expenses ratio. Olsen (2005) identified some board characteristics as determinants of
nonprofit performance and found that board size, average tenure of board, and business
executive background on a board significantly improve financial performance of
nonprofit higher education institutions. However, some studies did not find any
significant relationship between board and nonprofit performance. For example,
Herman and Renz (1998) studied a sample of health and welfare charities that receive
some funding from the local United Way and did not find a relationship between board
performance and organizational performance.
Ritchie and Eastwood (2006) specifically examined the effect of executive
6 Over $2.5 million in1992 contributions, and direct contribution exceeded 10% of total 1992
receipts.

37
functional background on nonprofit performance. Drawing survey data from chief
executives of university and college foundations, they found that executive‟s prior
experience in the functional areas of accounting, production, and marketing significantly
enhanced the organization‟s financial performance.
Management
Management of nonprofit organizations refers to the process a nonprofit
employs to achieve its missions. Although our intuition would be that use of correct
management practices is related to better performance, there might not be any simple
“best practices” way to improve nonprofit performance. Herman and Renz (1998)
concluded that using more practitioner-identified correct management procedures and
more change management strategies are associated with a higher level of organizational
effectiveness. Strategic management attributes as demonstrated in strategy formulation
and strategic processes are also related to financial success of nonprofit organizations
(Crittenden, 2000). Keating and Frumkin (2003) recommended nonprofits create
effective internal management with a view to improving efficiency and outcome.
Gathering and evaluating data provides nonprofit organizations with
information to develop management strategies and techniques which can ultimately
improve operation and performance (Carman, 2005). At the same time, if nonprofits are
better able to utilize their evaluation information, including information of their financial
performance, resource providers will be more informed and therefore more likely to
connect positively with nonprofits. Nonprofits will benefit in terms of resource

38
acquisition which can further contribute to organizational performance.
Market orientation that has been studies extensively in the private business
sector was found to be a driver of performance for nonprofit organizations (Shoham et al.,
2006). They hence recommended that nonprofits should now start considering
implementing market oriented strategies to enhance their organizations‟ performance.
In their 2008 study of a national sample of 1,434 churches, White and Simas (2008)
found that market orientation has a significantly positive effect on church performance.
Crittenden (2000) suggested that a marketing orientation is advantageous for nonprofits
to obtain resources and make better decisions.
Executive characteristics are another factor that could impact organizational
performance because top managers are able to influence organizational change and
performance through strategic choices (Ritchie and Eastwood, 2006). Executive
functional experience could be meaningfully associated with some performance measures
like resource acquisition, particularly if executive expertise is in marketing, accounting,
and production areas (Ritchie and Eastwood, 2006).
Fund Development Effort
The past twenty years have witnessed a growing professionalization of
charitable fund-raising (Salamon, 2003). Nonprofit organizations nowadays devote
themselves to more serious fund development efforts in order to attract and secure more
charitable resources to facilitate their organizational operation. Fund development for
nonprofits requires not only various strategies, but also people and institutional

39
arrangements they use to generate grants and contributions (Hager et al., 2002). Hager
and his colleagues (2002) have found from a large sample of nonprofits of various sizes
and service fields that most nonprofits do not have a full-time fundraising staff person;
however, using a dedicated fundraising staff enhances involvement with fundraising of
those non-fundraising staff including executive directors, volunteers, and other
professional staff members. The presence of fund development professionals can
sometimes serve as an impetus for moving the fund development agenda forward to
result in more success in revenue generation.
Previous studies have consistently found a positive relationship between
fund-raising investment or effort and charitable donations achieved (Tinkelman and
Mankeney, 2007; Weisbrod and Domingues, 1986). Fundraising efforts have both a
direct positive effect on donations, and an indirect smaller lagged negative effect.
Other Factors
In addition to the funding relationship between government and nonprofits as
well as nonprofit revenue diversification, which actually present contradiction for
researchers to further investigate, there are some other factors that have an impact on
nonprofit financial performance. Organizational age, geographic location, and local
economic and political features are all the variables examined in the literature. Age has
not been found to have a strong relationship with organizational performance (Herman
and Renz, 1998). Carroll and Stater (2009) found some of the exogenous factors have
influence over nonprofit financial health, such as urban location and state context.

40
Ongoing and effective communication with significant stakeholders is important to
organizations in terms of enhancing understanding of these stakeholders and providing
outcomes that meet or exceed stakeholder expectation (Herman and Renz, 2004; Keating
and Frumkin, 2003).
Nonprofit financial performance is obviously a highly complicated mechanism
that requires a systematic examination. No one comprehensive model has ever been
developed and empirically evaluated to capture the structure of the nonprofit financial
performance.
2.3 Research Gaps
The review of existing literature reveals that there are several important
research topics in the study of nonprofit revenue strategies and organizational
performance. This section identifies a number of research gaps that this study tries to
address to contribute to current theoretical base.
First, revenue diversification has become an increasingly important concept and
practice in nonprofit research and management. The existing literature fails to provide a
clear definition of “revenue diversification,” and the use of this concept has been rather
inconsistent. This study defines revenue diversification as a reliance on multiple
funding sources and a relatively balanced revenue structure and empirically tests these
two dimensions of diversification by investigating their relationship with other variables.
Second, the determinants of nonprofit revenue diversification have not been

41
systematically studied. Insufficient attention has been paid to examine the factors that
impact the level of revenue diversification for nonprofit organizations. There is
therefore a need in developing a conceptual model that explains complex causal
relationships between various contextual factors and revenue diversification. This study
fills in this research gap by exploring the impact of organizational and environmental
factors on revenue diversification.
Third, previous studies have identified a number of structural and
environmental factors that affect nonprofit financial performance. However, relatively
little research has been conducted to systematically examine the impact of various
contextual factors on financial performance and an overall theory of nonprofit financial
performance remains to be developed. Some nonprofit scholars have proposed
diversifying revenue base to reduce financial stress and improve organizational
performance. Unfortunately there has been very fragmented empirical evidence to
evaluate this diversification-performance proposal. This study proposes an integrated
model to explore the predictors of nonprofit financial sustainability by including an
analysis of revenue diversification as a potential determining factor of performance.
Finally, nonprofit financial performance has been largely studied by utilizing
input and output measures. As noted in relevant literature, performance measurement in
nonprofit organizations is being more approached from outcome perspective. Hence, it
is useful to further explore the proposed relationships by focusing on outcome oriented
performance measures, such as level of financial stress and organization‟s ability to

42
maintain programs and services to predict whether an organization is financially
sustainable.

43
CHAPTER THREE
Conceptual Framework and Research Hypotheses
This chapter provides the theoretical framework for examining the relationship
between nonprofit revenue strategies and nonprofit organizational performance.
Specifically, it discusses how different contextual factors of nonprofit organizations –
organizational structure and capacity, management, fund development efforts, and
operating environment – affect nonprofit financial strategic pattern, and then, in turn, how
the financing strategies comprising this pattern affect organizational performance of
nonprofits; it also discusses the effects of these organizational factors on organizational
performance.
3.1 Theoretical Framework and Research Questions
Figure 3.1 Theoretical Framework for the Study
Figure 3.1 provides a simplified diagram of the theoretical framework adopted
in this study that includes three major components. The first component discusses

44
contextual factors of nonprofit organizations including organizational structure and
capacity, management, fund development efforts, and operating environment. The
second component considers the joint effects of these contextual factors on nonprofit
financial strategic pattern conceptualized as nonprofit revenue diversification. The third
component is a multidimensional view of nonprofit organizational performance through
which the joint effects of contextual factors and financial strategic pattern on
performance are discussed.
This study examines nonprofit revenue structure, financial sustainability, as
well as the network relationships among revenue strategic pattern, revenue diversification,
and nonprofit financial performance. Three broad research questions are therefore being
investigated:
(1) What is the effect of government funding, or other dominant funding sources, on
nonprofit revenue structure?
(2) What are the effects of structural factors, managerial factors, and environmental
factors on nonprofit revenue diversification?
(3) What are the effects of revenue diversification, structural factors, managerial
factors, and environmental factors on nonprofit financial sustainability?
Figure 3.2 provides a comprehensive model to demonstrate the relationships
between various factors with revenue diversification and financial sustainability. This
study predicts that variation in revenue diversification is correlated with different types of
contextual factors of nonprofit organizations. First, level of revenue diversification is

45
associated with organizational structure and capacity. Secondly, managerial behaviors
and experiences of organizations, particularly those that exert direct influence on
nonprofit financing, have some impact on revenue diversification. Third, efforts and
investments made by nonprofits in generating funds from various sources have a
significant impact on nonprofit revenue diversification. Fourth, characteristics of the
external environment in which nonprofits operate are associated with revenue
diversification.
Figure 3.2 Model of Nonprofit Revenue Diversification and Financial Performance
Another set of relationships shown in the above figure is that of nonprofit
revenue diversification and organizational performance. First, revenue diversification is
expected to influence the level of financial stress nonprofits are going through these days.
Secondly, revenue diversification is predicted to impact the likelihood of nonprofit

46
organizations maintaining their current level of programs and services. Finally,
nonprofit organizations‟ future funding success is considered to be related to revenue
diversification.
In order to understand how nonprofit revenue strategies and performance differ
with respect to the underlying variables and how revenue diversification impacts
performance, a number of hypotheses are derived from these theoretical perspectives to
explore the key variable relationships demonstrated in Figure 3.2. Having illustrated the
conceptual framework and research questions, the rest of this chapter introduces all
hypotheses and their rationales.
3.2 Determinants of Nonprofit Revenue Diversification
This study defines and measures nonprofit revenue diversification from two
dimensions – “funding variety” and “revenue balance.” First, revenue diversification is
defined as a reliance on multiple funding sources (funding variety); and second, it is
defined as a relatively equal reliance on different revenue categories (revenue balance).
This study adopts two typologies of nonprofit funding sources, as shown in Figure 2.1 in
the previous chapter, to address the questions related to the two different aspects of
nonprofit revenue diversification. First, nonprofit revenue is broadly categorized into
three groups: government funding, private contributions, and commercialized income.
These three nonprofit revenue categories are further broken down to eight nonprofit
funding sources: (1) government funding, (2) individual donations, (3) the United Way, (4)

47
foundations, (5) corporations or business, (6) fees/sales/dues, (7) banks, lending
institutions, and (8) all other income, such as asset income or rental income.
3.2.1 Impact of Various Funding Sources
The interrelationships between various funding sources can be complicated
when it comes to the impact on revenue diversification. This study predicts that reliance
on any single revenue source that is dominant in nonprofit organizations‟ financing
pattern is associated with a weaker representation of different types of funding sources in
this pattern. Therefore, this study predicts that:
H1: Organizations that have a dominant single funding source are more
likely to have fewer funding sources and a lower level of revenue
diversification.
3.2.2 Organizational Structure and Capacity
Organizational capacity is a prevalent concept in nonprofit research. This
study proposes that organizational capacity is a significant factor in predicting level of
nonprofit revenue diversification. Organizational capacity can be approached from
multiple perspectives. A prominent measure of nonprofit capacity used extensively in
nonprofit literature is budgetary size. This study uses real expenditure as a proxy of
budgetary size. Smaller organizations – that is, organizations with a smaller budgetary
size – tend to take advantage of every funding opportunity regardless of the amount of
money that might be generated. On the other hand, organizations with extra resources,

48
particularly financial resources, are more likely to invest in and develop new funding
relationships and pursue higher values rather than short-term, instrumental ones.
However, the story is different with revenue balance. While smaller organizations can
have multiple funding sources to financially support their operation, they may lack the
capacity and incentive to strategically manage these revenues so to maintain a balanced
revenue structure. Therefore, this study predicts that:
H2a: There is a curvilinear relationship (∪Shaped) between budget size
and funding variety.
H2b: Organizations with large budgets are more likely to have a higher
level of revenue balance.
Capacity of nonprofit board is another measure of organizational capacity that
has an effect on nonprofit financing. If board members are able to bring in a variety of
resources for an organization and are actively involved in decision making process, it is
more likely for the organization to be effective in funds generation and revenue
management. This study predicts that:
H3: Organizations that have larger boards are more likely to have more
funding sources and a higher level of revenue balance.
H4: Organizations that have more board meetings each year are more likely to
have more funding sources and a higher level of revenue balance.
If an organization has experienced a great deal of growth in terms of programs
and services for a relatively long period of time, which may indicate an increased
capacity for the organization, it is more likely for the organization to invest in

49
diversifying its revenue structure and strategically manage its revenue base. Therefore,
this study predicts that:
H5: Organizations that have experienced greater growth of programs
and services are more likely to have more funding sources and a
higher level of revenue balance.
In a similar vein, if an organization has been doing a good job in its internal
development, such as organizational structural improvement, leadership development,
and internal management improvement, it is more likely to have higher level of revenue
diversification.
H6: Organizations that do a good job in its internal organizational
development are more likely to have more funding sources and a
higher level of revenue balance.
3.2.3 Management
Managerial behaviors and experience have a significant impact on an
organization‟s revenue strategic pattern. Better managed organizations have more
resources and are therefore more efficient in generating operational funds. Successful
organizations are more likely to position themselves strategically in management and
seek to follow the so-called best practices recommended for nonprofit organizations.
This study predicts that:
H7: Organizations that enjoy greater managerial success are more likely
to have more funding sources and a higher level of revenue balance.
Managerial attitude toward the concept of “revenue diversification” is expected

50
to have a positive effect on the real level of diversification. If revenue diversification is
recognized by nonprofit executive, managers, and directors as an important strategy to
pursue, they will be motivated to develop more fund opportunities from different sources
as well as to balance the revenue structure to optimize the benefit of this structure for
their organization. This study therefore proposes that:
H8: Organizations that attach more importance to revenue
diversification are more likely to have more funding sources and a
higher level of revenue balance.
Nonprofit management literature indicates that different stakeholders –
nonprofit executive, nonprofit board, clients, donors, etc. – have their own standpoints at
various stages of nonprofit operation. Their attitudes toward whether nonprofits should
adopt a more diversified revenue pattern can vary depending on their positions in the
entire nonprofit operation environment. And this variation will lead to different
decisions regarding nonprofit financing strategies that will then influence revenue
diversification. Therefore, this study predicts that:
H9: Greater influence of ED and staff on revenue generation strategy is
associated with a greater funding variety and a higher level of
revenue balance.
Many nonprofit practitioners and scholars anticipate that a fiscal squeeze might
push nonprofit organizations in developing new funding strategies that include more
revenue sources than they previously had to make ends meet, if not for any other
objectives. This study uses operational cutbacks to gauge whether an organization is

51
feeling a severe fiscal squeeze. Organizations that have recently experienced any
operational cutbacks are more likely to seek new or additional funding sources and try to
balance the revenue base. This study therefore proposes that:
H10: Organizations that have recently experienced operational cutbacks
are more likely to have a greater funding variety and a higher level
of revenue balance.
3.2.4 Fund Development Efforts
How nonprofit organizations implement financing strategies, particularly those
directly related to fund development efforts and activities, is greatly related to nonprofit
financial performance. If organizations employ fund development professionals
working in functional areas such as fund-raising, media and public relations, and grant
writing, it is more likely for them to achieve greater success in generating revenues. In
addition to having designated staff members working on fund-raising and other related
activities, nonprofits can hire external fund development consultants whose adequate
experience, sufficient knowledge, and superior judgment can significantly help nonprofits
raise the money they need. Therefore, this study predicts that:
H11: Organizations that have internal fund development staffs are more
likely to have more funding sources and a higher level of revenue
diversification.
H12: Organizations that use external fund development consultants are
more likely to have more funding sources and a higher level of
revenue diversification.
Fund development efforts require that nonprofits not only invest in human

52
capital, but also dedicate monetary resources for purposes of marketing, advertising, and
relationship building with potential donors or funding agencies. Nonprofit
organizations might spend a certain percentage of their organizational budget for such
purposes. This study therefore predicts that:
H13: Organizations that spend more budgetary resources in fund
development and other related activities are more likely to have a
greater funding variety and a higher level of revenue balance.
3.2.5 Environmental Factors
Nonprofit revenue diversification is also influenced by some external factors
stemming from the outside environment in which nonprofits operate. Generally, if
nonprofits are doing an excellent job in developing external relationships in funding and
programmatic areas, they should be more successful in obtaining and securing funds from
different sources.
H14: Organizations that have better relationship with external partners
are more likely to have more funding sources and a higher level of
revenue balance.
This study proposes that regional economy has an important bearing on
nonprofit funding variety. An organization located in a county that enjoys economic
stability will encounter less difficulty in generating revenue, particularly revenue from
locally based funders.
H15: Regional economy is positively related to funding variety.

53
3.2.6 Other Institutional Factors
In addition to the organizational and environmental factors specified in
previous sections, some other institutional characteristics are also anticipated to be
associated with the variation of nonprofit revenue diversification, such as staff size,
organizational age, service field, and geographic location. This study also analyzes the
effects of these organizational demographics.
This study uses two operationalizations of staff size – the number of paid
employees (both full time and part time employees) and the number of volunteers.
Some types of nonprofits, such as certain human services organizations, rely on a large
number of volunteers to carry out the daily operation of their programs despite a
relatively smaller budgetary size, while some other nonprofits, like housing organizations,
usually do not need to employ volunteer labors although they are quite sizable in terms of
operating budget. It is therefore necessary to differentiate between these two
dimensions in analyzing the impact of staff size on nonprofit financing strategy and
pattern. This study hence predicts that:
H16a: Organizations that hire more employees are more likely to have more
funding sources.
H16b: Organizations that have more volunteers are more likely to have more
funding sources.
Maturity of organization is another story. When organizations grow up
gradually in their service fields, they are usually better able to develop an extensive
54
network with external partners and establish some reliable relationships that they can
depend on for long term financial support. At the same time, more established
organizations usually have greater managerial expertise and are more likely to adopt
practices proposed by nonprofit scholars to improve organizational performance.
Therefore, this study predicts that:
H17: Older organizations are more likely to have more funding sources and a
higher level of revenue balance.
3.3 What Predict Nonprofit Financial Sustainability?
Nonprofit organizational performance and performance measurement have
increasingly become two related research topics of great interest to scholars and
practitioners in public administration and nonprofit management. Reviewing relevant
literature reveals that multiple approaches have been developed and various measures
have been used to evaluate nonprofit organizational performance. This study focuses on
the financial aspect of nonprofit performance, and specifically evaluates financial
sustainability as a particular measure of nonprofit financial performance. This study is
interested in exploring what factors predict that nonprofit organizations are financially
sustainable. Understanding how nonprofit organizations can improve their financial
sustainability is of particularly significance during the current economic recession. This
study proposes a number of factors are related to nonprofit financing that have direct
impact how nonprofits perform these days. This study systematically examines the

55
effects of these factors on the three measures of financial sustainability: financial stress,
likelihood to maintain services, and future funding success.
3.3.1 Effect of Revenue Diversification on Financial Sustainability
Financial stress has been quite prevalent in the nonprofit sector in recent years.
This study agrees with previous research that revenue diversification has a positive effect
on organizational performance, and further postulates that keeping a more diversified and
healthier revenue generation strategy and pattern reduces the level of financial stress of
nonprofit organizations.
H18a: More funding sources are associated with a lower level of financial
stress.
H18b: A more balanced revenue structure is associated with a lower level of
financial stress.
Consequently, this study proposes that organizations that have a more
diversified and healthier revenue generation strategy and pattern are better able to
maintain their current level of programs and services.
H19a: Organizations with more funding sources are more likely to maintain the
level of programs and services.
H19b: Organizations with a more balanced revenue structure are more likely to
maintain the level of programs and services.
Diversifying nonprofit revenue structure has been proposed as a special and
good strategy to help nonprofits sustain financial success by maintaining a more flexible
revenue generation. Organizations that maintain a more diversified and balanced

56
revenue pattern are in a better position to garner funds in the near future, and therefore
are more likely to be optimistic to report that their organization will be successful in
obtaining funds.
H20a: Organizations that have more funding sources are more likely to be
successful in fund-raising.
H20b: Organizations that have a more balanced revenue structure are more
likely to be successful in fund-raising.
3.3.2 Organizational Structure and Capacity
This study hypothesizes that organizational capacity is positively associated
with financial sustainability. This study examines the effect of budgetary size on
nonprofit financial sustainability.
H21a: Organizations with a large budget are less likely to experience
financial stress.
H21b: Organizations with a large budget are more likely to maintain the
level of programs and services.
H21c: Organizations with a large budget are more likely to enjoy funding
success in the future.
Board has been repeatedly explored as an importance factor in nonprofit
performance. Board members are expected to bring in different types of resources to the
organization that contribute greatly to the organization‟s sustainable development. They
are also expected to be closely involved in decision-making process to leverage their
expertise so as to improve nonprofit efficiency and outcomes. Therefore, this study
predicts that:
H22a: Organizations with a large board are less likely to experience
financial stress.

57
H22b: Organizations with a large board are more likely to maintain level of
programs and services.
H22c: Organizations with a large board are more likely to enjoy funding
success.
H23a: Organizations that have more board meetings each year are less
likely to experience financial stress.
H23b: Organizations that have more board meetings each year are more
likely to maintain level of programs and services.
H23c: Organizations that have more board meetings are more likely to
enjoy funding success.
3.3.3 Management
Administration and management has long been considered a significant
determining factor of organizational performance. Managerial experience is strongly
associated with performance and this study proposes that managerial success can predict
financial sustainability:
H24a: Organizations that enjoy greater managerial success are less likely to
experience financial stress.
H24b: Organizations that enjoy greater managerial success are more likely to
maintain level of programs and services.
H24c: Organizations that enjoy greater managerial success are more likely to
enjoy funding success.
3.3.4 Fund Development Efforts
How much financial resource organizations can deploy to operate their
programs is a director indicator of whether the organizations are financially sustainable.
Fund development efforts and investment significantly enhances organization‟s ability to
obtain financial resources, therefore, this study predicts that:
H25: Nonprofits that invest more in fund development are more likely to
be financially sustainable.

58
3.3.5 Operating Environment
Literature indicates that the environment in which nonprofits operate has an
influence on nonprofit performance. A supportive and healthy environment – politically,
culturally, and economically – can tremendously improve nonprofit performance by
providing sufficient resources, particularly financial resource, necessary for a sustainable
development.
H26a: Organizations that have better relationship with external partners
are less likely to experience financial stress.
H26b: Organizations that have better relationship with external partners
are more likely to maintain level of programs and services.
H26c: Organizations that have better relationship with external partners
are more likely to enjoy funding success.
H27a: Regional economy is negatively associated with nonprofit
financial stress.
H27b: Regional economy is positively associated with the likelihood to
maintain level of programs and services.
H27c: Regional economy is positively associated with funding success.
3.3.6 Intervening Effect of Nonprofit Revenue Diversification
This study investigates several intervening factors in the relationship between
revenue diversification and nonprofit financial performance. The following hypotheses
take into account the factor of economic/financial condition of nonprofits while
examining the specific effect of revenue diversification on nonprofit performance.
Specifically, this study predicts that the potential performance-boosting effect from
revenue diversification is more significant as nonprofit organizations‟ budgetary size

59
increases.
H28a: The effect from funding variety on financial sustainability increases
significantly as budgetary size increases.
H28b: The effect from revenue balance on financial sustainability increases
significantly as budgetary size increases.
3.3.7 Other Factors
It is hypothesized that some other organizational factors – mostly
demographical characteristics – have significant effects on nonprofit financial
sustainability. For example, this study predicts that staff size is positively related to
financial sustainability. This suggests that organizations with more employees and more
volunteers are less likely to experience financial stress, and more likely to be able to
maintain programs and services as well as to be successful in future revenue generation.
Likewise, older organizations tend to be under less financial stress, and are more likely to
maintain services and generate revenue in the future. This study also examines different
service fields and the potential sectoral effects on nonprofit financial sustainability.

60
CHAPTER FOUR
DATA AND RESEARCH METHODS
This chapter outlines the research methods, instruments, and procedures
developed to explore the research questions and test the research hypotheses. Given the
relative scarcity of empirical research on topics being examined in this study and the
mixed results of prior research on relevant topics, this study is designed to adopt a
predominantly quantitative methodology that has two overall objectives. One is to
describe the general status and variation of key variables. The other is to examine the
relationships among the variables, and to search for the model that best fits the data.
This chapter has seven sections: (1) unit of analysis, (2) data sources, (3) sample selection
and sampling, (4) survey instrument, (5) measurement, (6) survey data collection
procedures, and (7) data analysis procedures.
4.1 Unit of Analysis
The unit of analysis is the major entity that is being analyzed in the study. It is
the element about which one observes and collects data. The unit of analysis in this
study is (nonprofit) organizations and the study is designed as a type of organizational
behavioral research. By measuring individual nonprofit organization‟s self-reported
revenue structure, contextual characteristics, and organizational performance, this study
intends to explore the pattern among these three broad themes as well as the internal

61
mechanism within each topic.
4.2 Data Sources
The data for this study come from two sources. Part of the financial data was
obtained from “GuideStar Premium” – a large database of IRS 990 forms maintained by
GuideStar. Subscription to GuideStar Premium allows full access to the contact
information and financial portfolio of nonprofit organizations as they report to the IRS
through 990 forms. Other financial information and organizational data were collected
through a survey sent to the person in charge of day-to-day management of the
organizations, such as executive director, chief executive officer, or other top level
administrator. These individual directors, administrators, and managers have extensive
knowledge about the variables in this research. In particular, they are actively involved
in financial management process such as fund raising and related activities and hence are
able to provide first hand information about nonprofit revenue strategy and financial
performance.
The researcher decided to supplement IRS 990 data by survey data based on
three considerations. First, IRS 990 forms do not provide some information about
organizational management and performance this study intends to analyze. Secondly,
the way nonprofit revenue sources are categorized in IRS 990 form is not consistent with
the aims of this study. And thirdly, there is a concern of mis-reporting of the IRS 990

62
form information that might skew the data and data analysis significantly.
Underreporting of nonprofit fundraising expenses was found to be prevalent (Krishnan et
al., 2006) and will provide inaccurate and misleading information.
Prior studies of nonprofit organizational effectiveness and financial
performance rely heavily on panel data sets exclusively drawn from IRS 990 forms.
This study, however, uses a design that is cross-sectional.
4.3 Population and Sampling
This section explains the selection criteria used to construct a study sample.
Given the purpose of this study, human services and community improvement
organizations were selected because of (1) their visibility among all types of nonprofits,
(2) their traditional and relatively heavy reliance on government as a major funding
source, and (3) their provision of similar goods and services primarily consumed by local
residents (Grønbjerg, 1993). The population of interest for this study includes the
following eight groups of nonprofit organizations:
Under NTEE Category V:
I. Crime & Legal-Related,
J. Employment,
K. Food, Agriculture & Nutrition,
L. Housing & Shelter,
M. Public Safety, Disaster Preparedness & Relief,
O. Youth Development, and
P. Human Services;
And under NTEE Category VII:

63
S. Community Improvement & Capacity Building
“Recreation & Sports” under Category V was eliminated because the programs
and services provided by these organizations are more recreational than humanitarian in
nature, and hence do not present a comparable group to other groups included in this
study. By contrast, “Community Improvement & Capacity Building” under Category
VII is highly similar to those under Category V in terms of the nature of programs and
services and the social significance they symbolize. This group was therefore included
in the study.
Finally, the decision was made to focus only on nonprofit organizations in New
Jersey due to access and budget constraints. GuideStar Premium, from which a
sampling frame was developed for the study, does not allow a nationwide search for
organizations; in other words, any search within the database is limited to a single state.
The survey population was defined to include human services and community
improvement organizations located in the State of New Jersey.
4.3.1 Selecting the Sample
A sampling frame was developed primarily from Guidestar Premium, and the
researcher then verified this information by checking other sources, such as the
organization‟s official websites. The researcher downloaded from GuideStar Premium
information on all organizations that meet the following four sampling selection
requirements:

64
(1) The organization is located in the State of New Jersey;
(2) The organization‟s NTEE code is one of the eight groups identified above, that is, I,
J, K, L, M, O, P, and S;
(3) IRS subsection of the organization is defined as 501(c)3 Public Charity; and
(4) The organization‟s annual income (of the most recent record year available in the
GuideStar Premium database) is no less than $100,000.
2,050 organizations were retrieved from the database by using the above four
selection criteria. The researcher removed small sized organizations (that report annual
income less than $200,000) to retain only medium and large size organizations. After
evaluating this original dataset, the researcher made some additional deletions and
corrections.
First of all, the researcher deleted 53 organizations whose NTEE codes do not
lie into any of the eight groups but are listed as one of them mistakenly, and then
rearranged the dataset by reassigning another 48 organizations that are misclassified but
belong to one of the eight groups anyway.
Next, the researcher decided to eliminate certain subgroups based on some
theoretical considerations. The researcher excluded 7 labor unions in group J, on the
theoretical ground that labor unions are primarily, if not entirely, reliant on membership
fees for organizational operation and that labor union is a unique political factor in the
U.S. and labor unions differ tremendously from other human services organizations in
terms of services provided. The researcher then removed 112 organizations in group

65
M24 (Fire Prevention/Protection/Control). The third group that needed modification
was P33 (Child Day Care). This group contained 210 organizations and was the largest
subgroup (10.5%) in the frame of 2,050 organizations. Because day care centers
primarily depend on fees instead of other sources of revenues, the researcher decided not
to have the entire subgroup included so as to avoid over-representing this subgroup and
hence distorting the data. The researcher randomly selected 30 organizations out of the
210. Due to the same concerns, the researcher also sub-sampled group L22 (Senior
Citizens‟ Housing/Retirement Communities) by randomly selecting 49 from 102 such
organizations (102 representing 5.1% of the 2,050). These modifications resulted in
1,295 organizations.
Table 4.1 Final Sample of the Study
I Crime & Legal-Related 46
J Employment 48
K Food, Agriculture & Nutrition 33
L Housing & Shelter 186
M Public Safety, Disaster Preparedness & Relief 23
O Youth Development 95
P Human Services 527
S Community Improvement & Capacity Building 157
Total 1,115
Further examining the 1,295 organizations revealed that the information of
some organizations as contained in the Guidestar Premium data base was not up-to-date –
some going back to the 1990s. It was therefore necessary to exclude those that have not
reported information since 2006, because it is very likely that organizations that did not

66
report their tax-related information with the IRS in recent years do not exist any longer or
their revenue size had dropped below the $25,000 cut-off point and hence they were
exempt from filing. Removing those that failed to report with the IRS since 2006 and
then several duplicates yielded a final sample of 1,115 organizations (Table 4.1).
4.3.2 Identifying Survey Recipients
When planning a survey to gather data for this study, the researcher was
confronted with two very important logistics questions: how to identify the appropriate
recipients within individual nonprofit organizations, and how to ensure a satisfactory
response rate (Berry et al., 2003)? This study took some steps to ensure that surveys
were to be mailed to the appropriate recipients.
The researcher manually checked all organizations one by one to verify the
following information (if available): organization‟s name, address, city, zip code, contact
person‟s name, contact person‟s job title, contact person‟s email address, telephone
number (preferably of contact person), organizational website address, EIN (employer
identification number), and the most recent year of which the Guidestar Premium data
base hosts the organizational information. The researcher relied on several other
sources to do the verification. First, the researcher checked Guidestar Premium data
base where the following information might be found: general information
(organization‟s name, address, EIN, telephone number, website address, personal contact
information such as name, email, and fax), people (name and job title of officers,

67
directors, trustees, and key employees as of the most recent fiscal year that information is
available), and documents (IRS 990 form in PDF format of the last available ten years).
Secondly, the researcher searched on the Internet to verify if this information, particularly
website URL address and contact information, is correct. Then, the researcher searched
online by using Google for missing information to complement that provided by the
Guidestar Premium data base. If a conflict occurs between GuideStar Premium
information and information obtained from Internet search, the researcher always relied
on the information obtained from organizational website and made corrections
accordingly when necessary.
Of the 1,115 organizations in the finalized mailing list, contact person‟s email
addresses of 320 organizations were obtained; the remaining 795 organizations only have
physical mailing addresses. Of these 795 organizations that email addresses are not
available, 528 organizations‟ personal contact information was obtained. In order to
implement a methodological experiment as part of the study, the researcher decided to
randomly and evenly split the 320 email addresses into two groups. While one group –
the “Web Survey” group – would be contacted through emails, the other would be
merged into the “Mail Survey” group that would be contacted through regular mails.
This would allow for an experiment to compare traditional mail surveys with newer web
surveys as a method for studying nonprofit organizations.
The effort in acquiring names turned out to be successful and worthwhile.
Finally, 76% (848 out of 1,115) of all surveys and 72% (688 out of 955) of the mail

68
surveys went out with a personal name. The rest were generically addressed to
“Executive Director/Chief Executive Officer” if an executive could not be identified by
name. Table 4.2 summarizes the information of the four different survey groups.
Table 4.2 Summary of Four Groups
Group Have Contact
Person’s Name?
Have Contact Person’s Email
Address? Survey Mode #
1 Web Yes Yes Web 160
2 Mail 1 Yes Yes Mail 160
3 Mail 2 Yes No Mail 528
4 Mail 3 No No Mail 267
Total 1,115
4.4 Survey Instrument
Survey research is one of the most important areas of measurement in public
administration research. As Berry et al. (2003) suggested survey research can have
“enormous advantages over many other forms of inquiry” if “solidly done.” The
evidence obtained from this survey was designed to have validity for both academic and
practitioner communities. Selecting the type of survey is an important decision in many
research contexts. By applying some rules and trying to balance the advantages and
disadvantages of different survey types (including mail survey, web survey,
group-administered questionnaire, personal interview, and telephone interview), I decided
to use a combination of traditional mail survey and web survey for the current study.
Writing questionnaires is a critical part of survey research since a survey cannot
succeed with poorly constructed questions. Following a suggestion by survey research

69
scholars (Berry et al. 2003; Dillman et al., 2008), an iterative process was adopted in
writing questionnaire for this study. The development of the survey instrument
proceeded in four stages: (1) literature and document review; (2) discussion with survey
experts and nonprofit practitioners; (3) development of a draft survey instrument; and (4)
pilot testing and finalization of the survey instrument. Technically, these steps were
followed in designing and finalizing the questionnaire: first, determining what is going to
be measured and generating an item pool; second, determining the format for
measurement; third, having the initial item pool reviewed; fourth, considering including
validation items; fifth, administering items to a development sample then evaluating the
items; and if necessary, optimizing scale length.
It is of great importance to bridge the differences resulting from the
academic-practitioner gap that characterizes much nonprofit research. The researcher
would like to ground this research in such ways as to make the results relevant, useful,
and applicable in real-world situations, and felt it imperative to rely on both scholarly
work and real world experiences. In addition to consulting academic (dissertation
committee members and some other professors in nonprofit study), the researcher drew
experiences from some MPA students at Rutgers-Newark who are currently working with
nonprofit organizations either as employees or board directors. Their input was then
incorporated into the development of the survey questionnaire.
The draft survey was pilot tested with a number of nonprofit representatives to
solicit comments and identification of questions that were unclear, confusing, or not

70
appropriate, particularly those newly developed variables or items that had not been
tested in previous research. The pilot study helped to identify possible problems for
correction.
As length is a key factor in the response rate of a survey, the rule of thumb is to
keep the questionnaire short and brief, so that it could be easily completed within about
fifteen minutes. An eight-page survey instrument comprised of 35 questions, most of
them being closed-ended questions, was determined. Questions are grouped in five
sections. Section 1 asks descriptive questions relating some basic organizational
characteristics including service field, geographic location, staff size, organizational age,
board size, number of annual board meetings, and number of fund development
professionals. Section 2 collects information about the organizations‟ funding
environment such as annual budget and revenue sources, and also the perceived difficulty
in obtaining revenues from different sources. In Section 3, respondents are asked to
share their fund development experiences and strategies, like what percentage of the
organizational budget goes to fund-raising and marketing activities, how much effort
devoted to generating revenues, and how successful they think their organization will be
in fund development in the future. Respondents are also asked to report their
organizational performance indices regarding financial management and strategic
development in Section 4. Finally, respondents‟ demographic information including
gender, age, job title and tenure with their organizations are collected in Section 5. At
the end of the survey, respondents are asked to provide their email address if they would

71
like to receive a copy of the survey results when they are released. Respondents are
allowed to consult with their colleagues, for instance, financial manager and human
resources manager, for assistance in answering survey questions when necessary.
This study uses direct or construct-specific labels for many questionnaire items
to improve cognition. In designing the questions, efforts were made to provide balanced
scales where categories are relatively equal distances apart conceptually. Several
strategies were adopted to avoid respondent fatigue, such as: changing format, mixing
Likert-scale and non-Likert-scale questions, and using both questions and statements.
The questionnaire is included in Appendix 1.
The survey questionnaire was reviewed and approved by the Rutgers
University Institutional Review Board (IRB) for the protection of human subjects in
research under the provision of Federal Regulation 15 CFR 46. A copy of the letter of
approval from the IRB is attached in Appendix 4.
4.5 Measurement
This section explains definitions and measures associated with the key
variables of this study. Besides adopting tested items in nonprofit literature, this study
develops new items for several constructs that have not been empirically tested to
supplement the existing measures. In order to obtain desirable accuracy, validity, and
reliability for the measurement, and particularly of the novel items, efforts were taken to

72
make sure that: terms are defined precisely; ambiguous items or terms are eliminated;
information requested is accessible to respondents; and directions are easy to follow
(survey) (O‟Sullivan et al. 2003).
This study chose to use a combination of 7-point and 5-point response scales to
measure gradations of a variety of opinions, attitudes, and behaviors of respondents.
Dillman et al. (2008) recommend limiting scales to four or five categories; but Peterson
(2000) suggests that reducing the number of scale categories decreases the correlation
coefficient between the variables being correlated. There is just no single, optimal
number of response scale categories for all scaling situation (Cox, 1980).
4.5.1 Revenue Diversification Measures
This study examines the level of revenue diversification of human services and
community improvement organizations, and aims to determine the driving factors of this
diversification level. Two measures of revenue diversification are adopted in this study:
“Funding Variety” measured as the number of funding sources, and “Revenue Balance”
measured by a concentration index capturing the distribution of revenue categories. The
range of possible nonprofit funding sources is from 1 to 8 as there are a total of eight
categories of funding sources as in this study – government funding, individual donations,
the United Way, foundations, corporations or businesses, program service revenues
(fees/sales/dues), banks and lending institutions, and all other income.
One weakness with the method of merely counting the numbers is that it does

73
not take into consideration the percentage of each category, nonprofit funding source in
this case. For example, a nonprofit that generates revenue equally from all the eight
sources will have a same index value as another nonprofit that relies heavily on one or a
few particular sources while obtaining a very small percentage of revenues from all other
sources. The researcher therefore uses another measure – “Revenue Balance” – to fix
this problem. The purpose of this variable is to better measure and control for the
overall diversification of revenue pattern. This study adopts a revised measure of HHI
to evaluate the diversity of nonprofit revenue streams, which is defined as
3/2
13
1
2
i
iR
RB
where R denotes the share – in proportion of actual weight – of each of the three broad
categories of nonprofit revenue – government funding, private contributions, and
commercialized income. The reason that the “3 revenue categories” typology is
preferred over the “8 funding sources” typology is that it makes more sense to expect or
assume a relatively balanced distribution of total revenue among the three broad
categories – government, private, and commercial, than that among the eight funding
sources. The value of the Revenue Balance index ranges from zero to one with
increasing values implying more balanced nonprofit revenue distribution among the
designated revenue categories.

74
4.5.2 Financial Sustainability Measures
Having identified multiple dimensions from nonprofit performance
measurement literature, this study designed a set of variables to measure nonprofit
financial sustainability. This study uses internal measures to gauge an organization‟s
performance. These measures are self-reported judgments rather than actual
performance data. Survey respondents were asked to evaluate their organization‟s
financial performance based on three indicators.
Financial Stress. Respondents were asked to rate the level of financial stress
their organization was experiencing by using a ten point scale.
Likelihood to Maintain Programs/Services. Respondents were asked to
predict how likely it is for their organization to maintain the current level of programs
and services.
Funding Success. Respondents were asked how successful they anticipate
their organization would be in generating revenues the following year from the various
funding sources.
4.5.3 Contextual Factors
This study groups all the contextual factors into four categories: structure and
capacity, management, fund development efforts, and operating environment.
Structure and Capacity
Organizational structure and capacity is examined by five variables: budget size,

75
board size, board meetings, organizational growth, and internal development.
Budget Size. This study uses the real expense as a proxy of nonprofit budget
size. The data was obtained from GuideStar Premium database and the real expenses
are as reported on the IRS form for the most recent filing year available when the search
was conducted during the summer of 2009. Of the 501 organizations, 2006 data are
used for 19 organizations, 2007 data for 367 organizations, and 2008 data for 115
organizations.
Board Size is measured as the number of board members.
Board Meeting is measured as the number of board meetings held each year.
Growth is measured by one question item about the growth of programs and
services the organization has experienced over the past five years.
Internal Development is captured by three questions regarding organizational
structure improvement, leadership development, and internal management improvement.
Management
Managerial factors consist of four measures: level of managerial success,
management‟s attitude toward revenue diversification, influence from executive director
and professional staff on funding strategies, and recent operational cutbacks.
Managerial Success is measured by six questions regarding management of the
organizations in service delivery, mission achievement, peer excellence, and performance
measurement.
Attitude toward RD is about management‟s perception of revenue

76
diversification as a special revenue strategy for nonprofit organizations. Respondents
were asked to indicate on a 7-point scale to what extent they believe that having revenue
from several sources is extremely important for organizations like theirs.
Influence from ED & Staff is measured by two questions about the influence
from executive director and professional staff on revenue generation or funding strategies
of nonprofit organizations.
Operational Cutbacks. Respondents were asked how much their organization
has had to cut programs or services, how many to lay off paid employees, and how much
to change employment (from full-time to part-time) since the beginning of 2008. This
study creates a dichotomous variable to indicate whether an organization has experienced
operational cutbacks recently. Organizations that reported program cut, employee lay
off, or employment shrinkage are all considered to be those that experienced cutbacks.
Fund Development Efforts
This study uses three categorical variables to measure nonprofit organizations‟
fund development efforts and investment: FR Staff, FR Consultant, and FR Budget.
FR Staff is measured as the number of internal fund development professionals
working in fund development, media and public relations, and grant writing areas. This
study creates a dichotomous variable to evaluate the effect of using designated fund
development staff.
FR Consultant is measured as the number of external fund development
consultants working in those areas. This study creates a dichotomous variable to

77
examine the impact of hiring professional fund development consultants.
FR Budget is measured as the percentage of organizations‟ budget that is
devoted to fund-raising and marketing activities.
Environmental Factors
Environmental factors consist of two measures: relationship with external
stakeholders (external relationship) and regional economy.
External Relationship is measured by two related questions exploring
organization‟s relationship with outside stakeholders in funding and programmatic areas.
Regional Economic Instability is measured by the coefficient of variation of the
residuals of monthly employment which was first developed by Conroy (1975) and has
been extensively used in regional economic studies such as Kort (1981) and Siegel et al.
(1995). This study defines counties as regions and regional economic instability as
follows:
Where
is observed monthly employment for county c and month m; and
is a linear
approximation of the long run growth trend in employment in county c and month m. A
nine year data (108 months) was used to calculate this index for all twenty one counties
in New Jersey.
First, a linear approximation of the trend component is estimated; the trend
component is then subtracted from the seasonally and randomly adjusted employment

78
series to derive an approximation of the cyclical component; this difference, or residual,
is then adjusted, by expressing the difference in percentage terms (dividing by ê) to
account for differences in scale among regions; these percentage deviations from trend
are then divided by M – 2 to adjust for degree of freedom lost in estimating e; finally,
squared percentage deviations are summed over all years to derive an estimate of overall
regional economic instability. The value of this index increases as the difference
between
and
increases, that is, as the deviation of employment from trend
increases. Thus, higher values of REI indicate greater relative economic instability.
4.5.4 Other Organizational Characteristics
Demographic characteristics are important factors that impact on organizational
performance. Most of the information of these variables is obtained through survey by
asking respondents to describe their organization in terms of size, age, geographic
location, etc.
Sector. Respondents were asked to indicate the main program activity of their
organizations. However, a better and more accurate measure of this variable would be
NTEE code. The study creates four dichotomous variables for the four largest
subgroups in the sample – multi-purpose human services organizations, housing
organizations, youth development organization, and community improvement
organizations.
Location. Geographic location of a nonprofit organization is measured as one

79
of the following four commonly used items: urban, suburban, rural, and other. The
study creates two dichotomous variables for urban location and suburban location.
Employee. As one measure of staff size, this variable is measured by the
number of both full-time and part-time paid employees in an organization.
Volunteer. Another measure for staff size is the number of volunteers.
NPAge. This variable is measured as the years that an organization has been
in operation. Organizational age represents in part the effect of organizational reputation
on charitable contributions. Well-established or older nonprofits are more likely to have
a better reputation in attracting all kinds of resources because of their superior
fundraising capacity and long-term connections within communities.
4.5.5 Respondent Demographics
Respondents‟ demographic information is also collected, such as tenure
(measured as the number of years worked in their current organization), tenure with the
nonprofit sector, with government, and with the private business sector. There is no
ground to hypothesize that most of the personal characteristic variables such as gender,
age, and job title would make any difference to study results. The reason they were
included in the questionnaire is to serve as control variables in data analyses and because
they have been commonly used in other nonprofit studies.

80
4.6 Survey Data Collection
As mentioned earlier, the data for the analysis come from two sources. Some
financial data were obtained from a large database of IRS 990 forms maintained by
GuideStar and accessible at its official website. Most of the organizational data were
obtained by a survey sent to the person in charge of day-to-day management of sample
organizations, such as executive director, chief executive officer, or administrator. One
logistical effort that can help obtain good survey response rates is adopting multiple
mailings (Berry et al. 2003), three separate mailings were therefore used with both mail
survey group and web survey group. The following table shows the schedule of each
mailing.
Table 4.3 Administration of Mail and Web Surveys
Mail Survey Group Web Survey Group
Initial mailing (955) July 15, 2009 Email invitation (160) July 17, 2009
Reminder postcard (938) July 24, 2009 Follow-up email # 1 July 22, 2009
Second mailing (746) August 12, 2009 Follow-up email #2 July 28, 2009
4.6.1 Mail Survey
Survey questionnaires were mailed with a one-page cover letter (see Appendix
2) on a letterhead developed to introduce the significance of the study and its relevance
with nonprofit organizations, and to instruct respondents to fill out the survey and to
return the material in an enclosed self-addressed envelope. Confidentiality was assured
in the cover letter; anonymity of the response was guaranteed by committing to publish

81
aggregate results only, without reference to specific organizations. A business return
and self-addressed envelope was enclosed in order to facilitate responses.
The mailing data was merged into the cover letter and envelope labels which
were printed. Labels with recipients‟ names and addresses were put on the 9"×10"
formal envelops of the School of Public Affairs and Administration (SPAA) of Rutgers
University – the institution the researcher is affiliated with, and labels with researcher‟
name were put on the #10 Business Reply Mail envelopes. Each survey instrument was
coded (the code began with MG meaning “mail group”, and then a sequential numerical
identifier), and this code was entered into the database.
This study adopted three separate physical mailings – two mails and one
reminder post card in between. About two weeks after the first survey mailing went out,
a reminder postcard was sent out. On the backside of the postcard was a brief letter (see
Appendix 2) that emphasized the importance of the survey, thanked those who already
replied, and reminded those who had not done so yet. Labels with recipients‟ names and
addresses were put on the front side of the postcards where logo and address of SPAA
were displayed. Four weeks after the first letter was sent, a second letter (see Appendix
2) and final contact was sent with another survey instrument enclosed. Organizations
that had already completed and returned the survey were removed from the mailing list.
4.6.2 Web Survey
This study used “SurveyMonkey” – an online survey service – to create and

82
implement the web survey. An email invitation was sent through SurveyMonkey to 160
recipients uploaded beforehand by the researcher. The main text of the email invitation
(see Appendix 3) was similar to that of the cover letter used for snail mail survey group,
with minor modifications to fit web survey situation. Respondents were asked to click
on the link provided that would direct them to the survey webpage hosted on
SurveyMonkey. A colorful logo of SPAA was provided on the survey webpage. After
the first email invitation was sent out, it was discovered that two recipients had already
opted out of receiving any email from SurveyMonkey, which means the true size of this
web survey group is 158. Six days after the invitation email was sent, a follow-up email
was sent to all of those who had not responded by then or who have responded but have
only partially completed the survey. Another six days later, a second follow-up email
and the last contact for the web survey group was sent to all non-respondents by that time.
All three contacts were sent out at 8:00 AM on the day they were scheduled to deliver.
4.6.3 Coding
A codebook was developed to help input the data into a Microsoft Excel file.
Briefly speaking, the data from the questionnaires were entered in the following way.
When nominal and ordinal data was encountered, the responses were scored on straight
scales. And interval data were entered without any transformation being performed.
This Excel file was then exported to the statistical software in the corresponding format.
All missing data was recorded as missing, no further data management was conducted.

83
4.7 Data Analysis Procedures
STATA 12.1 was chosen for statistical analysis. First, descriptive statistics
including central tendency and standard deviation (if appropriate) were calculated for all
variables, and a correlation matrix of key variables was provided. Bivariate statistics
helped identify some significant variations between different types of nonprofit
organizations and statistically significant association among many of the study variables.
4.7.1 Statistical Methods
This study employs two statistical techniques: exploratory factor analysis and
multiple regression analysis.
Factor analysis is a method for reducing the dimensionality of multivariate data
and understanding patterns of association among variables (Lattin et al., 2003). Factor
analysis verifies a feasible factor structure within a given set of survey questions for this
study. Principal component factor analysis is utilized to check the measurement
equivalence across all items. Reliability of the observed survey items were assessed
before conducting factor analysis.
Regression analysis is probably the most widely used form of analysis of
dependence to explore the relationship between a set of independent variables (or
predictor variables) and a single dependent variable (or outcome variable) (Lattin et al.,
2003). This study carries out multiple regression analysis to specify potential causal

84
relationships between contextual factors and nonprofit revenue diversification, as well as
between contextual factors, revenue diversification and organizational performance.
4.7.2 Model Specification
Ordinary least squares (OLS) regression models are employed to test the
proposed hypotheses and answer the research questions. Although OLS is extensively
used in the social sciences research, the results from OLS can be biased if some key
assumptions are violated. Despite these limitations, OLS is a helpful first-step in
exploring the research topic for this dissertation and can be used as a comparison to other
estimation techniques in future research efforts to see how estimates change when theory,
diagnostic tests, and data suggest alternative estimation techniques may produce better
estimates. The dependent variables of this study are mostly scale variables, and OLS
has been shown to be robust in such analyses.
This study develops two models to test research hypotheses proposed. A first
model is designed to test the significance of factors that are assumed to impact nonprofit
organization‟s funding pattern measured as the level of revenue diversification (RD).
The model is:
RD = f (CAPACITY, MANAGEMENT, INVESTMENT, ENVIRONMENT,
CONTROL) + ei
where CAPACITY includes organizational structure and capacity such as board size,
budget size, organizational growth and internal development; MANAGEMENT denotes
measures of managerial success, management‟s perception of revenue diversification,

85
inside stakeholders‟ influence on financing strategy, and operational cutbacks;
INVESTMENT reflects nonprofit‟s investment and efforts in fund development and
related activities; ENVIRONMENT indicates measures of operating environment of
nonprofits, such as organization‟s relationship with outside stakeholders, difficulty of
revenue generation, and regional economic status; CONTROL consists of measures of
organization‟s age, size, and service type; ei is a random error term. Two separate OLS
regressions are performed to investigate independent variables‟ effect on the two
measures of revenue diversification: funding variety and revenue balance.
Then, a second regression model is introduced to assess whether nonprofit
revenue diversification as measured by funding variety and revenue balance can predict
nonprofit financial sustainability. The empirical model is as follows:
Sustainability = f (RD, CAPACITY, MANAGEMENT, INVESTMENT,
ENVIRONMENT, CONTROL) + ei
where RD denotes revenue diversification measures; CAPACITY includes some
organizational characteristics such as board size, budget size, etc.; MANAGEMENT
denotes operational cutbacks; INVESTMENT indicates the level of fund development
efforts; ENVIRONMENT includes environmental factors; CONTROL consists of
measures of organization‟s age, size, and service type; and ei is a random error term.
Three separate regressions are used to examine independent variables‟ impact
on three measures of financial sustainability: financial stress, likelihood to maintain
programs and services, and future funding success.

86
CHAPTER FIVE
DATA ANALYSIS AND FINDINGS
Chapter 5 reports data analysis and hypothesis-testing results and discusses
their meaning. This chapter has four sections: (1) Survey Response Rate; (2)
Descriptive Statistics; (3) Validation of the Proposed Constructs; and (4) Regression
Analysis.
5.1 Survey Response Rate
Research methods textbooks argue strongly for securing a high survey return
rate so as to minimize nonresponse bias (Hager et al., 2003). What constitutes a good
response rate is not easily stated; some scholars suggest a typical return rate in
organizational surveys is around 30 percent. As of September 30, 2009, two and half
months after the initial mailing, a total of 505 responses were returned. Of the 505
responses, 501 valid responses7 are used for analysis. Considering the size of the initial
selected sample (1,115), the overall response rate is 45.3%, and the valid response rate is
44.9%. Seventeen survey invitations were returned because of wrong, out-dated, or
undeliverable addresses; and two email invitations were blocked because owners of the
two email accounts had opted out of receiving any email from SurveyMonkey where the
7 Valid response is defined as a completed survey with a small number of question items not answered by
the respondent. It could be an entirely completed or a partially completed survey. Surveys that are
apparently broken in any place of the questionnaire are considered to be not valid.

87
web survey was hosted.
Table 5.1 Survey Response Rates
Survey Mode Surveys sent Return Return rate Valid return Valid return rate
Web Survey 160 71 44.38% 71 44.38%
Mail Survey 955 434 45.45% 430 45.03%
Overall 1,115 505 45.29% 501 44.93%
A number of reasons might explain why the survey achieved such a respectable
return. First, Rutgers University with which the researcher is affiliated is the State
University of New Jersey, which makes it easier for nonprofit organizations in New
Jersey to identify with this study. Second, the survey was conducted at a time when the
nonprofit sector, and the entire American economy, was experiencing the most severe
economic recession since the Great Depression. Nonprofit executives were very likely
to be attracted to the purpose of the survey – examining how nonprofit revenue pattern
can hopefully help nonprofits survive the economic downturn. Finally, the
questionnaire was designed with a view to making it as easy as possible for respondents
to answer the questions and complete the entire survey.
More detailed comparative analysis of the two survey methods are provided in
Appendix 9 – A Comparative Study between Web and Mail Surveys.
5.2 Descriptive Statistics
Descriptive information for all survey items is summarized in tables provided

88
in Appendix 5. The results demonstrate that sufficient variation is present of all the
items. This section discusses the characteristics of some selected items, beginning with
personal characteristics of survey respondents – the person who completed the survey on
behalf of their organization.
5.2.1 Personal Characteristics of Respondents
Although most personal information as to this study‟s respondents is not
relevant to the core research questions, it is useful to include some basic personal
characteristics of the respondents.
Job Title
Most of survey respondents identified themselves as Executive
Director/CEO/President or Vice President of their organization (409, 84.2%). 12.8%
(63) of the respondents reported their job title as either “Professional Staff” or “Other”
that might include titles such as “HR manager.” Only 15 respondents (3%) are board
directors or board members. This suggests that most of the respondents provide
information and make judgment from nonprofit management‟s perspective rather than
from that of nonprofit board. It is important to distinguish between managers and board
members because they are different stakeholders and have different attitudes and opinions
of some nonprofit management issues.
Gender
Consistent with many other survey studies, there are more female respondents

89
(272, 55.3%) than male respondents (220, 44.7%) in the current survey. It is not sure
though whether this is reflective of gender difference in the study population8 or it is just
because females are more likely to respond to surveys.
Figure 5.1 Frequency of Gender in the Sample
Age
Respondents also cover a wide range in terms of age, and a majority of them
are apparently in their middle and elder ages as shown in Figure 5.2. More than 80%
(399) respondents are over 45 years old with about 10% (48) over 65, nearly 40% (192)
from 55 to 64, and another 32% (159) are in their ages from 45 to 54.
Figure 5.2 Age of Respondents
8 The gender information of the entire study population is not available.
272
220
0
100
200
300
Female Male
0.2%4.2%
15.0%
32.1%38.8%
9.7%
0%
10%
20%
30%
40%
≤ 25 25-34 35-44 45-54 55-64 ≥ 65
Age of Respondents

90
Tenure with Different Sectors
On average, respondents have worked at their current organization for 13 years.
They have worked an average of 20 years with the nonprofit sector. These nonprofit
managers also had some past experience working in either private business sector or the
government sector. Figure 5.3 shows the statistics.
Figure 5.3 Tenure with Different Sectors
5.2.2 Demographic Characteristics of Sample Organizations
Although the survey sample is exclusively from New Jersey and operating in
the two broad fields of human services and community improvement, variations are
presented in demographic characteristics such as geographic location, service field, years
in operation, staff size, etc.
Service Field
In terms of service field distribution, the 501 responding organizations seem to
be representative of the initial sample of the study (1,115). The information is
summarized in Figure 5.4. General type, or multi-purpose, human services
13
20
3.4
8.7
0
5
10
15
20
25
Current Organization
Nonprofit Sector
Government Private Business
Nu
mb
er
of
Ye
ars

91
organizations comprise over half of the entire sample (501), followed by community
improvement organizations and housing organizations each of which takes up 13% of the
entire sample. None of the other five service fields takes more than 10% of the entire
sample. It should be noted that many general type, multi-purpose human services
organizations have operations in some specialized areas such as youth development,
employment, and housing.
Figure 5.4 Distribution of Eight Service Fields
Location
A large proportion of these organizations are located in suburban regions (235,
47.4%), followed by those in urban regions (161, 32.5%). 8.3% (41) organizations are
located in rural regions, and the rest 11.9% (59) reported their geographic region as
“Other” which suggests that they might either have multiple physical location types, or
their services are not restricted to a particular type of region.
Crime5%
Employment4%
Food4%
Housing13%
Public Safety2%
Youth8%
HS51%
Community13%
Distribution of Service Fields

92
Years in Operation
Many responding organizations have existed for quite a long time. Sixty
percent of the sample were established more than 25 years ago. One quarter of the
entire sample (124) has been in operation for more than 50 years; 35% organizations (175)
have been in operation for 26 to 50 years. Another quarter (133, 27%) reported an
organizational age of 11 to 25 years. For those younger organizations, 13% (65) have
been in operation for less than 10 years, and two have an organizational life less than 3
years.
Staff Size
This study adopts two measures – number of paid employees and number of
volunteers to examine staff size; this distinction is based on the fact that some
organizations in certain service fields might rely more on volunteer labors for program
provision and service delivery.
Figure 5.5 Employee Size in the Sample
Figure 5.5 shows the distribution of responding organizations in terms of
number of paid employees. Diversity is reflected with a variety of different staff sizes.
3.0%
17.0%
25.9%
20.2%
10.8% 9.4%13.6%
0%
10%
20%
30%
None 1-5 6-15 16-50 51-100 101-200 More than 200
Number of Paid Employees

93
About 20% (100) organizations are operated by fewer than five employees. Of these,
fifteen organizations reported having no paid employee at all, which suggests that they
completely depend on volunteers. At the same time, about 23% (115) organizations
have an employee size greater than 100. 68 largest organizations (13.6%) employ more
than 200 people.
This study does not reveal a heavy dependence on volunteer labors. In
addition to a 12.1% (60) that do not use volunteers at all, nearly 50% (238) of the
organizations reported that fewer than 50 volunteers are working with them. As a
comparison, 5% (25) organizations use over 1,000 volunteers and another 4% (21) have
more than 500 volunteers.
Figure 5.6 Volunteer Size in the Sample
It should be noted though that the survey did not provide a clear definition of
volunteers nor an instruction on how to calculate the number of volunteers. It is
possible that some organizations recruit a large number of volunteers for their various
programs who might only need to dedicate a marginal amount of time, while some other
12.1%
47.9%
14.7% 16.1%
4.2% 5.0%
0%
10%
20%
30%
40%
50%
None Fewer than 50
51-100 101-500 501-100 More than 1000
Number of Volunteers

94
organizations use volunteer labors in a longer term and a more intensive fashion.
5.2.3 Revenue Diversification
This study uses two different measures to capture different aspects of revenue
diversification. First, this study uses the number of different funding sources to measure
funding variety; an organization can have from one up to eight funding sources. Then,
this study uses revenue balance to refer to the distribution of the three revenue categories
in the entire nonprofit financing, and the value of the index calculated for this measure
can range from 0 to 1.
Funding Variety
Figure 5.7 Number of Funding Sources in the Sample
Figure 5.7 demonstrates that New Jersey human services and community
improvement organizations are relying on multiple funding sources. About 90% (425)
organizations have more than one funding source. A majority of organizations (363,
0% 5% 10% 15% 20%
2.5%
7.4%
18.2%
18.0%
17.0%
14.0%
13.1%
10.0%1
2
3
4
5
6
7
8

95
77%) have at least three funding sources. However, no more than 10% (47) depend on
financial support from more than six funding sources.
The average number of funding sources is 4.2, but this number varies from
service field to service field. Figure 5.8 shows the sectoral differences; on average,
youth development and food organizations rely on more than five funding sources while
public safety organizations rely on three funding sources.
Figure 5.8 Funding Variety by Service Field
Revenue Balance
Revenue balance examines how nonprofit funding sources are distributed in
revenue structure. Table 5.2 shows the descriptive statistics of the three categories of
nonprofit revenues in the sample. Government funding obviously dominates nonprofit
financing pattern with an average share of 47.8%. Government funding is followed by
commercialized income which comprises 30.1% of nonprofit revenue. Sample
organizations depend the least on private contributions to generate financial support for
their operation.
4.63.4
5.1
3.83
5.24.3
3.4
0
4.2
Nu
mb
er
of
Fun
din
g So
urc
es

96
Table 5.2 Share of Revenue Categories by Sector (%)
Government Funding Private Contributions Commercialized Income
Crime & legal-related 44.9 41.1 14
Employment 43.2 6.7 50.2
Food & nutrition 28.4 58.5 13.1
Housing & shelter 53.7 20 28.3
Public safety 13 42.2 44.7
Youth development 25.9 32.5 41.5
HS – Multipurpose 53.1 17.8 28.8
Community Improve 45.8 19.2 35
All Sectors Together 47.8 22 30.1
Table 5.3 provides more detailed information by including shares of the eight
funding sources. In addition to government funding, service or program fees is the only
other funding source that takes more than ten percent of entire nonprofit revenue. The
third largest funding source is individual donation which generates slightly less than 10%
of total nonprofit revenue. On the contrary, a number of other funding sources only
generate very marginal revenues for nonprofits. For example, nonprofits rarely use
loans from banks or other lending institutions for financing purposes. The share of
revenues generated from this channel comprises only 1.6% of the entire nonprofit
financing. The United Way has a second smallest share (1.9%) in this financing pattern.
Table 5.3 also provides statistics broken down by different service fields which
presents sectoral variations in terms of share of funding sources. Although government
funding is dominant across the board, a number of other sources are also very visible in
several sectors. For example, public safety and youth development organizations have
adopted commercialized incomes such as fees, sales, and membership dues as the most

97
important funding source for their organization, while food and nutrition organizations
rely heavily on individual donations.
Table 5.3 Share of Funding Sources by Sector (%)
Sector Gov Donation UW Foundation Corp Fees Banks Other
Crime 44.9 14.9 1.8 18.3 6.1 10.4 .06 3.5
Employment 43.2 1.3 .7 1.5 3.2 37.7 .11 12.4
Food 28.4 34 1.9 16.1 6.5 8.9 .67 3.5
Housing 53.7 9.8 2.1 4.4 3.7 17 3.2 6.1
Public safety 13 39.1 0 .7 2.4 44.7 0 0
Youth 25.9 11.7 3.7 10 7.1 26.5 2.7 12.3
HS 53.1 8.6 2 5.1 2.1 24.4 1.2 3.2
Community 45.8 4.9 .6 7.8 5.9 27.1 2.1 5.8
All Sectors Together 47.8 9.9 1.9 6.6 3.6 23.5 1.6 5
Organizations in the sample are generally doing a good job in terms of trying to
develop more funding sources, considering that the average number of funding sources is
4.2. Revenue Diversification Index calculated to evaluate how balanced the nonprofit
revenue structure is reveals some additional information. Table 5.4 shows that when
taking into consideration the share of each funding source, the level of funding
diversification is not as visible as suggested by the number of funding sources.
According to the “RB Index” column in the table, food organizations are the
most diversified while employment organizations are the least diversified, meaning that
distribution of different funding sources is more balanced in food organizations. The
sectoral difference is much less significant if the revenue balance index is calculated by
using share of the three broad revenue categories, as displayed in the “RB3 Index”

98
column. This again proves that it would make more sense to use the three revenue
categories to calculate revenue balance rather than the eight funding sources.
Table 5.4 Revenue Diversification Index by Sector
Sector # of Funding Sources RB Index
(8 funding sources)
RB3 Index
(3 revenue categories)
Crime 4.6 .47 .846
Employment 3.4 .34 .931
Food 5.1 .65 .878
Housing 3.8 .46 .978
Public safety 3 .37 .93
Youth 5.2 .63 .989
HS 4.3 .37 .998
Community 3.4 .42 .982
All Sectors Together 4.2 .42 .942
This study reveals an interesting observation that financing pattern in some
service fields is visibly dominated by a single funding source. If a single source
dominant financing pattern is defined as a revenue structure that has more than half
(above 50%) of its total revenues generated from a single funding source, 76% are being
dominated by a certain funding source. A majority of the 361 organizations defined as
single-source dominated are dominated by either government funding (220, 61%) or
service fees (98, 27%).
Figure 5.9 Single-Source Dominated Organizations
76%
24%
0%
40%
80%
Single-Source Dominant Non Dominant

99
5.2.4 Nonprofit Financial Sustainability
This study adopts multiple measures to evaluate nonprofit financial
sustainability – self-reported financial stress, likelihood to maintain programs and
services, and anticipated fund development success in the future..
Financial Sustainability
Respondents were asked to rate on a 10 point scale the level of financial stress
their organization is under, where 1 means “no stress at all” and 10 “extreme stress.”
12.37% respondents report that their organization is currently under extreme financial
stress. Only 2% organizations reported they were not experiencing financial stress at all.
The statistics supported a widely held perception that nonprofit organizations are
confronted with a very critical and challenging fiscal situation.
Figure 5.10 Financial Stress
Despite a seemingly visible and critical financial stress, over two thirds
organizations are confident in their organization‟s ability to maintain the level of
programs and services that it has always delivered. Over 15% of the respondents are
0%
5%
10%
15%
20%
Financial Stress

100
very confident by stating that it is “extremely likely” for their organization to maintain
current level of services, while only about 5% feel that it is extremely unlikely they will
be able to do that.
Figure 5.11 Likelihood to Maintain Programs and Services
An interesting observation is the association between the level of financial
stress and the anticipated likelihood of maintaining programs and services. Nearly two
thirds organizations reported a financial stress above the mid-level of the scale provided
in the questionnaire. The average level of financial stress is 6.4, while the confidence
level that organizations will continue to provide the same quality programs and services
is 6.7, higher than that of the reported level of financial stress. Although it is good to
know that nonprofit organizations demonstrate self-confidence in their future
development, it merits further investigation to see if there is any effect from survey
design on the two results. The “likelihood to maintain services” question is directly
after the “financial stress” question and respondents might be very sensitive to such an
order and could be cautious in providing their answers to the “likelihood” question and
0%
5%
10%
15%
20%
25%
Likelihood to Maintain Services/Programs

101
some of them would over-report on their organization‟s ability to maintain programs and
services.
5.2.5 Organizational Structure and Capacity
Organizational structure refers to the ways an organization is organized in
terms of governance and management; organizational capacity refers to the resources
employed by an organization to governance, management, and operation activities. This
study uses multiple measures to capture nonprofit organization‟s structure and capacity.
Budgetary Size
The budget variable is a measure of the fiscal capacity of nonprofit
organizations. This study collects information about the real expenditures the sample
organizations reported with the IRS on the most recent 990 form available when the data
was collected. Comparing the two figures reveals some changes from the time they last
filed with the IRS (in most cases for the tax year of 2007 or 2008) to the time the survey
was conducted (summer of 2009). Figure 5.12 offers a comparison between
self-reported budgetary scale and a proxy measured by total expenditure, and does not
present too much difference between real expenditure of 2007 or 2008 and proposed
budget of 2009 of responding organizations.
Nearly 30% (147) organizations‟ 2009 budget falls between one million to five
million U.S. dollars. It is interesting to note that although the sample was selected with
one criteria that “budget size be no less than $200,000” as reflected from the statistics

102
available from the GuideStar Premium dataset, 8% (40) organizations still reported a
budget size less than $200,000. The possible explanation for this discrepancy is that
some organizations might have experienced a decrease in their budgetary scope from the
time they filed their latest IRS tax report. The gap revealed here might also be an
evidence of operational shrinkage of the nonprofit sector due to the economic recession
and financial stress.
Figure 5.12 2007/2008 Expenditure versus 2009 Budget
Responding organizations are generally representative of the entire sample in
terms of organizational expenditure. Figure 5.13 shows that very small organizations
are slightly less likely to respond to the survey and to over-report their budgets than are
mid-sized and large organizations. However, the difference does not seem significant
enough to merit a concern over response bias. It would be safe to conclude that sample
organizations are representative in demographic features and other organizational
characteristics such as capacity.
3.4%
25.4%
16.4%
34.9%
9.2% 10.8%8.0%
22.3%
16.7%
29.5%
10.6%12.9%
0%
10%
20%
30%
40%
Less than $200,000
$200,001 to 500,000
$500,001 to 1M
$1 to 5M $5 to 10M Over $10M
Expenditure 2007/2008 Budget 2009

103
Figure 5.13 Total Expenditure of Responding versus Sample Organizations
Board Size
A majority (about two thirds) of responding organizations have a board with at
least 11 board members.
Figure 5.14 Board Size in the Sample
Board Meetings Each Year
Over half of responding organizations have their boards meet more than six
times each year. Another 40% organizations do have at least four board meetings every
year. This suggests that most organizations follow the typical practice of having board
3.4%
25.4%
16.4%
34.9%
9.2%10.8%
6.4%
26.3%
16.9%
33.7%
7.9% 8.8%
0%
10%
20%
30%
40%
Less than $200,000
$200,001 to 500,000
$500,001 to 1M
$1 to 5M $5 to 10M Over $10M
Responding Organizations Entire Sample
0.4%
8.2%
26.8%33.1%
14.4% 17.2%
0%
10%
20%
30%
40%
None 1-5 6-10 11-15 16-20 More than 20
Board Size

104
meetings every month or every other month.
Organizational Growth
One survey question asks respondents to report how much growth of programs
and services their organization has experienced over the past five years. The bar chart
below shows a very positive and confident evaluation of the programmatic growth of
responding organizations. A large proportion of organizations have experienced either
“a fair amount of” or “a great deal of growth,” and only 7% organizations experienced no
programmatic growth at all.
Figure 5.15 Growth of Programs and Services
5.2.6 Management
This study considers a number of management-related factors as indicators of
nonprofit revenue diversification and nonprofit financial sustainability.
Attitude toward Revenue Diversification
This study attempts to understand nonprofit managers‟ perception about
revenue diversification as an important strategy for nonprofit organizations to pursue.
31%
40%
22%
7%
0%
10%
20%
30%
40%
50%
A great deal A fair amount Only a little None at all
Organizational Growth

105
As to the perceived importance of this concept, 71% respondents very strongly believe
that having a diversified revenue structure is extremely important for organizations like
theirs.
Figure 5.16 Perception versus. Practice of Revenue Diversification
By contrast, organizations in the sample do not seem to do a good job in
implementing what they believe to be an “extremely important” strategy. Only 17%
respondents claim that their organization has definitely been doing a great job at
diversifying its revenue sources. Figure 5.16 displays an obvious discrepancy between
perception and practice.
Operational Cutbacks
Survey results show that the nonprofit sector has experienced a rather visible
recession in terms of programmatic shrinkage and personnel layoffs. Over half of
responding organizations have cut programs or services since the inception of the
economic downturn at the beginning of 2008, while slightly less than half of them had to
0%
20%
40%
60%
80%
Completely disagree Completely agree
Having revenues from several sources is extremely important for nonprofits like ours.
My org has been doing a good job at diversifying its revenue sources.

106
either lay off employees or reduce employment scale. Figure 5.17 demonstrates that
over two thirds of responding organizations have experienced operational cutbacks.
Figure 5.17 Operational Cutbacks
5.2.7 Fund Development Efforts and Investment
Fund Development Professionals
Survey results reveal that using external consultants is a rare practice for
nonprofits – 418 out of 501 (83.4%) responding organizations do not hire any external
fund development consultants. Fifty seven percent (278) of the organizations reported
that at least one employee in their organization work as fundraising professional. These
findings are consistent with previous research (Brooks, 2005; Hager et al., 2002) that
despite the increased importance and visibility of fund development, most nonprofit
organizations “fundraise insufficiently to meet their goal of maximizing program and
service delivery (Brooks, 2005).” The following figure shows the summary statistics.
However, it should be noted that the survey instrument does not explain
explicitly what an “internal fund development staff” means. Non-fundraising staff, such
No Cutbacks,
32.5%
Some Cutbacks,
67.5%

107
as executive directors, board members, and volunteers, involved in fund development is
not uncommon in many nonprofit organizations, particularly those smaller ones. It is
not sure whether some sample organizations would consider themselves as having a
designated staff member for fund development, although that person might not
necessarily work full time for that purpose.
Figure 5.18 Fund Development Professionals in the Sample
Fund Development Budget
What percentage of total operating budget is devoted to fund-raising and
related activities is another measure of fund development efforts and investment. Figure
5.19 shows that 18% organizations (86) do not invest in fund-raising and marketing
activities at all, while over half of the organizations only spend less than 5% of their
budget in activities for revenue generation. Only 7.6% responding organizations devote
more than ten percent of their budget to fund development. These findings are
consistent with previous studies on nonprofit fundraising and seem to support the
argument that nonprofit organizations fundraise insufficiently (Brook, 2005).
42.8%34.8%
17.5%
2.5% 2.5%
83.4%
13.4%
2.4% 0.2% 0.6%0%
30%
60%
90%
None Only 1 2-3 4-5 More than 5
% o
f O
rgan
izat
ion
s
Internal Fundraising Staff External Fundraising Consultants

108
Figure 5.19 Percentage of Budget for Fund Development
5.2.8 Operating Environment
The environment in which organizations operate is potentially related to
organizational effectiveness in revenue generation and other performance measures.
This study assesses nonprofit operating environment by examining regional economic
instability and nonprofit organization‟s external relationship with outside stakeholders.
Regional Economy
The regional economic instability variable is calculated with county-level
statistics and therefore reflects variations between the twenty one counties in the State of
New Jersey. Values of this variable range from 6.9 to 17.5, with higher values
indicating higher levels of local economic instability. The mean score for this index is
8.6 with a standard deviation of 1.4.
Perceived Difficulty in Fund Development
Figure 5.20 demonstrates that different funding sources present varying
requirements and demands nonprofits need to comply with for sustained support.
17.7%
52.8%
21.9%
4.7% 2.9%
0%
10%
20%
30%
40%
50%
60%
None Less than 5% 5% to 10% 11% to 20% More than 20%
Percentage of Budget Dedicated to Fund-Raising

109
Generating revenues from commercialized income such as service fees and membership
dues presents the least difficulty, followed by government funding. Corporation
donations are the most difficult kind of fund to obtain.
Figure 5.20 Difficulty in Obtaining Fund from Different Sources
5.3 Validation of the Proposed Constructs
It is not an uncommon practice in social science research to use latent variables
to measure concepts that cannot be directly observed. This study adopts three major
latent variables for analysis: “Managerial Success,” “Internal Development,” and
“External Relationships.” Usually multiple indicators are used to compose a single
measure of a latent variable. This study tests the reliability and unidimensionality of
each composite variable.
5.3.1 Test for Reliability
The Cronbach Alpha test has been widely used to test the reliability of survey
items and therefore Cronbach Coefficient Alpha (Table 5.5) was computed to test the
3.94.6 4.9 4.9 5.2
3.5
4.84.3
1
3
5
7D
iffi
cult
y Sc
ore

110
internal consistency of the three scales. Generally, an Alpha value 0.7 or above is
desirable and an Alpha value higher than 0.60 is minimally acceptable. Among the
latent variables, “Managerial Success” and “Internal Development” have alpha values
higher than 0.80. “External Relationship” has a value of 0.60, the lowest of all three.
A possible explanation of this relatively low value is because of the fact that this latent
variable is composed of only two items – adding one more item that is designed to
measure the same latent concept might improve the alpha value.
Table 5.5 Cronbach Coefficient Alpha of the Sample Data
Variable Items Mean Std. Dev. α without α Raw α Std.
Managerial Success
wellmanage 5.87 1.22 .82
.85
.87
effective 6.28 1.02 .82
mission 6.14 1.10 .82
moresuccess 5.66 1.38 .83
evaluate 5.21 1.49 .81
datadriven 4.59 1.76 .85
Internal Development
structure 3.47 .90 .86
.87
.87 leadership 3.44 .96 .80
manage 3.58 .93 .80
External Relationship externalfu~g 2.82 1.06 -
.60 .60 externalpr~m 3.51 1.01 -
The results suggest that these measurements are reliable in terms of internal
consistency. Factor analysis is however still needed to further assess the
unidimensionality of the items, which will be discussed later after factor analysis is
conducted.
5.3.2. Test for Unidimensionality
Confirmatory factor analyses are performed to test the construct validity of

111
items of latent variables. The three latent variables were analyzed separately, and all
factor loadings in the three factor analysis results are above 0.6 which is generally used as
a cutoff value, and the Eigenvalue index confirms that one factor should be chosen or
kept for each latent variable. The results are summarized below.
Managerial Success
Table 5.6 Factor Analysis: Managerial Success
Factor analysis/correlation Number of obs = 486
Method: principal-component factors Retained factors = 1
Rotation: (unrotated) Number of params = 6
--------------------------------------------------------------------------
Factor | Eigenvalue Difference Proportion Cumulative
------------+------------------------------------------------------------
Factor1 | 3.62140 2.86603 0.6036 0.6036
Factor2 | 0.75537 0.20182 0.1259 0.7295
Factor3 | 0.55355 0.10569 0.0923 0.8217
Factor4 | 0.44786 0.11358 0.0746 0.8964
Factor5 | 0.33429 0.04675 0.0557 0.9521
Factor6 | 0.28753 . 0.0479 1.0000
--------------------------------------------------------------------------
LR test: independent vs. saturated: chi2(15) = 1319.30 Prob>chi2 = 0.0000
Factor loadings (pattern matrix) and unique variances
---------------------------------------
Variable | Factor1 | Uniqueness
------------+----------+--------------
wellmanage | 0.8016 | 0.3574
effective | 0.7990 | 0.3616
mission | 0.8242 | 0.3207
moresuccess | 0.7374 | 0.4563
evaluate | 0.8024 | 0.3561
datadriven | 0.6881 | 0.5266
---------------------------------------
For “Managerial Success” in Table 5.6, the six items all have factor loading
higher than 0.6. The item “datadriven” has the lowest loading of 0.69. In Cronbach
Coefficient analysis for “Managerial Success”, α Raw is 0.85, α Std. is .87. The α
without “datadriven” is 0.85, which indicates that no significance difference would be

112
resulted by dropping this item from the scale. All the six items were hence retained for
future analyses.
Internal Development
For “Internal Development” in Table 5.7, all factor loadings are higher than 0.8.
Considering also its high Cronbach α, the researcher retained all the three items in future
analyses.
Table 5.7 Factor Analysis: Internal Development
Factor analysis/correlation Number of obs = 484
Method: principal-component factors Retained factors = 1
Rotation: (unrotated) Number of params = 3
--------------------------------------------------------------------------
Factor | Eigenvalue Difference Proportion Cumulative
-------------+------------------------------------------------------------
Factor1 | 2.39552 2.03844 0.7985 0.7985
Factor2 | 0.35708 0.10968 0.1190 0.9175
Factor3 | 0.24740 . 0.0825 1.0000
--------------------------------------------------------------------------
LR test: independent vs. saturated: chi2(3) = 748.78 Prob>chi2 = 0.0000
Factor loadings (pattern matrix) and unique variances
---------------------------------------
Variable | Factor1 | Uniqueness
------------+----------+--------------
structure | 0.8693 | 0.2444
leadership | 0.9064 | 0.1784
manage | 0.9046 | 0.1817
---------------------------------------
External Relationship
Only two items are included for the latent variable “External Relationship”.
Table 5.8 shows the factor loadings on the two items are higher than 0.8. Although the
Cronbach coefficient value (0.60) is not very high, it is acceptable, therefore allowing
using the two items for the latent variable in future analyses.

113
Table 5.8 Factor Analysis: External Relationship
Factor analysis/correlation Number of obs = 474
Method: principal-component factors Retained factors = 1
Rotation: (unrotated) Number of params = 1
--------------------------------------------------------------------------
Factor | Eigenvalue Difference Proportion Cumulative
-------------+------------------------------------------------------------
Factor1 | 1.42447 0.84894 0.7122 0.7122
Factor2 | 0.57553 . 0.2878 1.0000
--------------------------------------------------------------------------
LR test: independent vs. saturated: chi2(1) = 93.87 Prob>chi2 = 0.0000
Factor loadings (pattern matrix) and unique variances
---------------------------------------
Variable | Factor1 | Uniqueness
-------------+----------+--------------
externalfu~g | 0.8439 | 0.2878
externalpr~m | 0.8439 | 0.2878
---------------------------------------
5.3.3 Descriptive Analysis for the Latent Variables
The statistics are summarized in Table 5.9. On average, responding
organizations seem to be rather successful in organizational management (mean=5.63 out
of 1-7 scale; SD=1.03). But they are not highly confident of their internal development
and external relationship with outside stakeholders.
Table 5.9 Descriptive Statistics for Latent Variables
N Minimum Maximum Mean S.D.
Managerial Success 486 1.83 7 5.63 1.03
Internal Development 484 1 5 3.50 .83
External Relationship 474 1 5 3.16 .87
Note: Factor-based scale is used.9
9 A factor-based scale does not use an optimally weighted formula to estimate subject scores on the
underlying factor. For example, if v1, v2, and v3 have high loadings on factor 1, then each subject‟s score
on factor 1 is calculated as v1+v2+v3. In contrast, an estimated factor score is calculated as
b1v1+b2v2+b3v3 (b1, b2, and b3 are scoring coefficients).

114
5.4 Regression Analysis
Regression analysis is conducted to examine the potential causal relationships
between outcome variables and explanatory variables using STATA. There are two
main research models for testing the effects of explanatory variables on each dependent
variable: one for examining revenue diversification and the other for financial
sustainability. Five separate regressions were run to assess a total of five dependent
variables: Model 1 for “Funding Variety,” Model 2 for “Revenue Balance,” Model 3 for
“Financial Stress,” Model 4 for “Likelihood to Maintain Services,” and Model 5 for
“Future Funding Success.”
5.4.1 Correlation Analysis
Correlation analysis is a bivariate measure of the strength or degree of the
linear relationship between any two variables. Correlation analysis can reveal basic
relationships among various variables, including the key variables – funding variety,
revenue balance, financial stress, funding success, likelihood to maintain programs and
services, and future funding success. A correlation matrix describing these correlations
appears in Table 5.10. It seems that even if all independent variables are included in one
regression model, multicollinearity would not be a concern here because no high
correlations (above .70 or .80) are observed.

115
Table 5.10 Correlation Matrix for the Variables
fund rd3 stress maintain cutback growth influed ManSuc IntDev ExtRel impdiv divers suc09 frstaff frconsul frbudget REI budget board bdmt
fund 1
(472)
rd3 .602**
(472)
1
(472)
stress .032
(465)
.073
(465)
1
(493)
maintain -.113*
(468)
-.056
(468)
-.391**
(492)
1
(496)
cutbacka .130**
(469)
.063
(469)
.321**
(491)
-.261**
(494)
1
(498)
growth .240**
(469)
.142**
(469)
-.194**
(490)
.049
(493)
-.187**
(495)
1
(498)
influed .322**
(470)
.159**
(470)
-.055
(491)
-.006
(494)
.021
(496)
.153**
(496)
1
(499)
ManSuc -.029
(452)
-.123**
(452)
-.165**
(472)
.138**
(475)
.208**
(478)
.293**
(479)
.118**
(480)
1
(480)
IntDev -.145**
(443)
-.183**
(443)
-.165**
(464)
.220**
(467)
-.129**
(471)
.117*
(469)
.028
(469)
.423**
(461)
1
(471)
ExtRel .365**
(443)
.268**
(443)
-.094*
(464)
.023
(467)
-.046
(471)
.292**
(469)
.243**
(469)
.230**
(461)
.000
(471)
1
(471)
impdiver .345**
(465)
.268**
(465)
.151**
(486)
-.050
(489)
.036
(491)
.139**
(493)
.220**
(493)
-.069
(480)
.069
(468)
.199**
(468)
1
(494)
diverse .335**
(461)
.300**
(461)
-.155**
(482)
.111*
(485)
-.078
(487)
.273**
(489)
.258**
(489)
.255**
(480)
.200**
(466)
.408**
(466)
.422**
(490)
1
(490)

116
fund rd3 stress maintain cutback growth influed ManSuc IntDev ExtRel impdiv divers suc09 frstaff frconsul frbudget REI budget board bdmt
suc09 .139**
(462)
.145**
(462)
-.324**
(483)
.293**
(486)
-.191**
(488)
.164**
(488)
.102*
(490)
.159**
(473)
.097*
(465)
.207**
(465)
-.024
(487)
.173**
(483)
1
(491)
frstaff a .417**
(457)
.279**
(457)
-.023
(479)
-.005
(482)
.046
(483)
.156**
(483)
.330**
(484)
.055
(466)
.016
(456)
.190**
(456)
.219**
(479)
.297**
(475)
.116*
(476)
1
(486)
frconsult a .041
(472)
.048
(472)
-.074
(493)
-.018
(496)
.046
(498)
.077
(498)
.097*
(499)
-.099*
(480)
-.040
(471)
.059
(471)
.031
(494)
.080
(490)
.045
(491)
.134**
(486)
1
(501)
frbudget .246**
(458)
.331
(458)
.016
(477)
-.119**
(480)
.054
(482)
.064
(482)
.232**
(483)
-.154*
(465)
-.052
(456)
.157**
(456)
.186**
(478)
.163**
(474)
.028
(475)
.326**
(470)
.239**
(485)
1
(485)
REI -.111*
(472)
-.047**
(472)
.007
(493)
.008
(496)
-.017
(498)
-.070
(498)
-.040
(499)
-.008
(480)
-.030
(471)
-.056
(471)
-.062
(494)
-.011
(490)
-.032
(491)
-.065
(486)
-.037
(501)
-.065
(485)
1
(501)
budget .103*
(471)
-.092*
(471)
.022
(492)
-.047
(495)
.149**
(497)
.041
(497)
.168**
(498)
.125**
(479)
.026
(470)
.046
(470)
-.022
(493)
.030
(489)
.034
(490)
.163**
(485)
.077
(500)
-.047
(484)
.033
(500)
1
(500)
board .373**
(472)
.195**
(472)
-.047
(493)
.015
(496)
.103*
(498)
.095*
(498)
.266**
(499)
.069
(480)
-.056
(471)
.218**
(471)
.180**
(494)
.211**
(490)
.114*
(491)
.257**
(486)
.037
(501)
.147**
(485)
-.083
(501)
.220**
(500)
1
(501)
bdmeet .191** .158** -.010 .060 .060 .014 .054 -.036 .087 .096* .119** .116* .080 .023 .007 .062 -.020 -.012 .222 1
(471) (471) (492) (495) (497) (498) (498) (479) (470) (470) (493) (489) (490) (485) (500) (484) (500) (499) (500) (500)
Note:
1. ** Coefficient significant at the .01 level.
2. * Coefficient significant at the .05 level.
3. Numbers in parentheses are sample sizes
4. a Dummy variables

117
For relations between some variables that are not included in the correlation
matrix, some interesting observations could be made as well. For example, percentage
of government funding is positively correlated with effort in obtaining government funds,
but negatively correlated with efforts in obtaining non-governmental funds (both
significant). This suggests that government funding tends to reduce nonprofit
organization‟s efforts in development fund opportunities with other funding sources.
There is no significant correlation between percentage of government funding and
external relationship, which suggests that external relationship does not necessarily help
nonprofits‟ ability to obtain government funding, or that maintaining funding relationship
with government does not require a good relationship with other outside stakeholders.
Effort in government funds generation is positively correlated with effort in
non-governmental revenue generation and perceived importance of revenue
diversification (both significant). Notably, percentage of government funding is
negatively correlated with investment in fund raising activities (significant). While
investment is positively and significantly correlated with effort in non-governmental
funds generation, it has no significant correlation with effort in government funding
generation.
The correlation analysis provides important implications for examining the
relationships between dependent variables for the two research models in this study.
Funding variety and revenue balance are positively related at .01 significant level
(r=.602). Both funding variety and revenue balance are positively related with financial
118
stress but the relationships are not statistically significant; they are however both
significantly and positively related with future funding success (r=.139, and r=.145).
Funding variety and revenue balance are negatively related with likelihood to maintain
services, with the correlation between funding variety and likelihood to maintain services
significant at .05 (r=-.113). Financial stress and future funding success are negatively
correlated at .01 (r=-.324) while likelihood to maintain services and future funding
success are positively correlated at .01 (r=.293).
It is interesting to analyze the relationships between some independent
variables as well. Operational cutbacks is positively correlated to managerial success,
budgetary size, and board size, and negatively correlated to organizational growth and
internal development. Organizational growth is positively and significantly correlated
with most of the other independent variables including managerial success, internal
development, external relationship, importance of revenue diversification, fund-raising
staff, and board size. Managerial success is significantly and positively related to
internal development, external relationship, importance of revenue diversification, and
board size, but negatively correlated with both fund-raising staff and fund-raising
consultants.
Internal development is not significantly correlated with most of the other
variables. On the contrary, external relationship is positively with quite many other
variables, such as importance of revenue diversification, fund-raising staff, fund-raising
budget, board size, and annual board meetings. Perceived importance of revenue

119
diversification is positively related to fund-raising staff and fund-raising budget but not
fund-raising consultants. Fund-raising staff is positively related to fund-raising
consultants and fund-raising budget, as well as budgetary size and board size.
The correlation matrix shows that there is only a moderate correlation between
almost all of the independent variables, which indicates that these variables are very
likely to measure different concepts or constructs. In addition to this preliminary
observation, other indices are assessed later in this chapter.
The first research hypothesis of this study is to examine basic relationships
between any single dominant funding source and nonprofit revenue structure. The
correlation analysis provides important implications for future study for examining the
relationships. Correlation coefficients in Table 5.11 demonstrate that reliance on any
single revenue source that is dominant in nonprofit financing pattern is associated with a
weaker representation of different types of funding sources in the financing pattern as
well as a less balanced distribution of these sources.
Table 5.11 Correlations between Dominant Funding and Revenue Diversification
Dominant a
Funding Variety Revenue Balance
Dominant a
1
(475)
Funding Variety -.395** 1
(472) (472)
Revenue Balance -.575** .602** 1
(472) (472) (472)
** Significant at the .01 level
Sample size in parentheses. a Dummy variable

120
5.4.2 Regression Diagnostics
Without verifying regression assumptions underlying regression analysis,
statistical results may be inaccurate and misleading. Preliminary regression analyses
were conducted to detect potential outliers, multicollinearity, heteroskedasticity, and
non-normality problems. Final regression models are confirmed after performing
regression diagnostics.
Unusual Data
A single observation (or a very small group of observations) that is
substantially different from all other observations can make a huge difference in the
results of regression analysis. Unusual data can influence the regression model in three
ways: outliers, leverage, and influence. An outlier is an observation with large residual.
An outlier may indicate a sample peculiarity or may be caused by a data entry error.
Outliers can be identified by examining the studentized residuals. Observations with
studentized residuals exceeding +3 or -3 might be outliers.
First, after generating studentized residuals, one potential outlier (ID#=548,
r=3.05) is identified for Model 1 – the regression model for funding variety. Dropping
the outlier identified does not significantly change the regression results nor the
diagnostic test results, therefore the observation is retained in the regression model. No
potential outlier is identified for Model 2 – the regression model for revenue balance. It
is concluded that no severe outliers in the revenue diversification models.
Regarding the financial sustainability models, no potential outlier is identified

121
for Model 3 for financial stress and Model 4 for likelihood to maintain services. Three
outliers (ID#=418, r=3.82; ID#=1024, r=3.60; ID#=734, r=3.36) are identified for Model
5, the regression model for future funding success. Dropping the outliers significantly
improves the regression results, it was therefore determined that the three observations
were removed from the dataset for Model 5.
Normality
This study conducts two tests to detect normality of residuals: the Shapiro-Wilk
W test and the iqr test.
Table 5.12 Normality
Model Shapiro-Wilk W IQR
z Prob.>z # severe outliers % severe outliers
Model 1: Funding Variety 0.005 0.49805 0 0.00%
Model 2: Revenue Balance 2.800 0.00256 0 0.00%
Model 3: Financial Stress 3.281 0.00052 0 0.00%
Model 4: Maintain Services 5.823 0.00000 0 0.00%
Model 5: Future Funding Success 3.757 0.00009 0 0.00%
Shapiro-Wilk W test result fails to reject the null hypothesis of the normality
assumption for Model 1 at a five percent significance level. However, the probability
value for Model 2 is very small, which suggests that residuals are not normally
distributed for the regression model for revenue balance. As with the financial
sustainability models, Shapiro-Wilk W test results show that the p values are all very
small in the three models, so the null hypothesis of the normality assumption for the three
regression models is rejected. The iqr test is then conducted to cross check the
Shapiro-Wilk W statistics. The iqr test results show that the models do not have any

122
severe outliers. It is therefore concluded that the distribution of residuals is fairly
symmetric.
Multicollinearity
Multicollinearity means a high degree of correlation among a set of predictor or
independent variables. An increased degree of multicollinearity will inflate the standard
errors for the coefficients and result in unstable estimates of the coefficients. Two
methods are commonly used for diagnosing multicollinearity: correlation matrix of the
independent variables and Variance Inflation Factors (VIFs). Correlation matrix is
examined in previous section and no significant correlation was detected between any
pair of independent variables.
Table 5.13 Summary of Multicollinearity
Model Mean VIF
Model 1: Funding Variety 1.93
Model 2: Revenue Balance 1.93
Model 3: Financial Stress 3.18
Model 4: Maintain Services 3.11
Model 5: Future Funding Success 3.11
The average VIF score is 1.93 for both models for revenue diversification, and
most variables have VIF less than 2. The two variables that have the largest VIF scores
are Expenditure (in thousands) and Expenditure2. Based on VIF and tolerance for the
regression, no significant multicollinearity is found among the independent variables in
both regression models for revenue diversification.
As for the three models for financial sustainability, based on VIF and tolerance
for the regression, no significant multicollinearity is found among the independent

123
variables in all three models. While most variables have VIF scores less than 2, several
variables that are computed with Expenditure in the three models have high VIF scores
(greater than 15), thus moderately raises the average VIF score.
Homoscedasticity
Table 5.14 Homoscedasticity Tests
Model 1: Funding Variety
Bruesch-Pagan/Cook-Weisberg Test White‟s Test
Ho: Constant variance H0: homoscedasticity
Variables: fitted values of Funding Variety Ha: unrestricted heteroskedasticity
chi2 (1) = 0.37 chi2 (307) = 293.04
Prob > chi2 = 0.5416 Prob > chi2 = 0.7071
Model 2: Revenue Balance
Bruesch-Pagan/Cook-Weisberg Test White‟s Test
Ho: Constant variance H0: homoscedasticity
Variables: fitted values of Revenue Balance Ha: unrestricted heteroskedasticity
chi2 (1) = 0.73 chi2 (307) = 323.18
Prob > chi2 = 0.3939 Prob > chi2 = 0.2518
Model 3: Financial Stress
Bruesch-Pagan/Cook-Weisberg Test White‟s Test
Ho: Constant variance H0: homoscedasticity
Variables: fitted values of Financial Stress Ha: unrestricted heteroskedasticity
chi2 (1) = 1.34 chi2 (256) = 260.56
Prob > chi2 = 0.2474 Prob > chi2 = 0.4091
Model 4: Likelihood to Maintain Programs/Services
Bruesch-Pagan/Cook-Weisberg Test White‟s Test
Ho: Constant variance H0: homoscedasticity
Variables: fitted values of Maintain Ha: unrestricted heteroskedasticity
chi2 (1) = 0.32 chi2 (256) = 249.07
Prob > chi2 = 0.5693 Prob > chi2 = 0.6100
Model 5: Future Funding Success
Bruesch-Pagan/Cook-Weisberg Test White‟s Test
Ho: Constant variance H0: homoscedasticity
Variables: fitted values of Funding Success Ha: unrestricted heteroskedasticity
chi2 (1) = 3.94 chi2 (256) = 258.05
Prob > chi2 = 0.0472 Prob > chi2 = 0.0485

124
The homogeneity of variance of the residuals is another main assumption for
regression analysis. This study conducts the White‟s test and the
Breusch-Pagan/Cook-Weisberg test to detect heteroskedasticity and all the five regression
models meet the regression assumption of homoscedasticity. Table 5.14 presents the
results of both Breusch-Pagan/Cook-Weisberg test and White‟s test. Probability values
yielded by White‟s test and Breusch-Pagan test suggest that the null hypothesis of
homoscedasticity cannot be rejected at .05 significant level for models one through four,
indicating that there is homogeneity of variance of the residuals for these models. In
Model 5, the null hypothesis is rejected at the .05 significance level by both
Breusch-Pagan test and White‟s test. However, the two p values are not very small,
which suggests that the possible heteroskedasticity is not so severe as to merit further
investigation. It is therefore determined that Model 5 does not need to be corrected.
Finally, based on the diagnostic test results to detect the underlying regression
assumptions, three severe outliers are eliminated from Model 5 for final analysis.
5.4.3 Regression Analysis: Revenue Diversification as Dependent
The regression model10
for predicting the effect of exploratory variables on
revenue diversification is:
RevenueDiversification = β0 + β1Budget + β2Budgetsqu + β3Board + β4Boardmeet +
β5Growth + β6IntDevelopment + β7ManagerialSuccess + β8Attitude + β9EDInfluence +
β10OperationalCutback + β11FRStaff + β12FRConsultant + β13FRBudget + β14ExtRelation +
10
There are two separate models – Model 1 for examining funding variety and Model 2 revenue balance.

125
β15REI + β16HS + β17Youth + β18Housing + β19Community + β20Urban + β21Suburban +
β22OrganizationAge + β23EmployeeSize + β24VolunteerSize
The regression analysis for Model 1 demonstrates significant support for the
hypothesized links between revenue diversification and most of the predictor variables.
There are two measures for the dependent variable. One is funding variety, measured as
the total number of funding sources an organization has; and the other is revenue balance
that is calculated by a revised HHI index. Table 5.15 summarizes the regression results
of both models – one with “funding variety” as dependent variable while the other with
“revenue balance” as dependent variable. Adjusted R2 for the funding variety regression
model is .401, accounting for 40% of the variance and the F (24, 371) statistics is 12.03
(p<.000). Adjusted R2 for the revenue balance regression model is .255, accounting for
about 25% of the variance and the F (24, 371) statistics is 6.64 (p<.000).
Hypothesis 2a predicts a curvilinear relationship ( ∪ shaped) between
organization‟s budgetary size and funding variety. The coefficient for budgetary size
squared is significant in Model 1 of Table 5.14 (b=.064, p<.05) and the direction of the
coefficient is consistent with the hypothesized relationship. This finding confirms
Hypothesis 2a and shows that both larger and smaller organizations – in terms of
budgetary size – are more likely to depend on more funding sources. This finding
suggests that smaller organizations tend to take advantage of every funding opportunity
regardless how big the fund is and therefore are very likely to rely on more funding
sources, while larger organizations, with more organizational capacity and resources, are

126
also highly likely to enjoy more funding sources. However, increased budgetary size is
generally associated with a decreased funding variety.
Table 5.15 Revenue Diversification as a Function of Organizational and
Environmental Characteristics
Funding Variety Revenue Balance
Model 1 Model 2
Background b SE b SE
Employees .129* (.071) -.018 (.013) Volunteers .220*** (.066) -.008 (.012) Organization Age .230*** (.087) .038** (.016) HS -.181 (.226) -.020 (.042) Youth .162 (.316) .062 (.059) Housing -.337 (.283) .070 (.053) Community -.504* (.296) -.023 (.055) Urban .230 (.212) .066* (.040) Suburban .189 (.203) .034 (.038)
Capacity Budget Size -.006** (.003) -.001 (.001) Budget_Squared .064** (.028) .007 (.005) Board Size .057 (.077) .003 (.014) Board Meetings .299*** (.109) .048* (.020) Growth .320*** (.090) .036* (.017) Internal Development -.284*** (.085) -.041*** (.016)
Management Managerial Success -.072 (.092) -.015 (.017) Attitude to RD .145** (.059) .031*** (.015) ED Influence .206** (.093) -.011 (.017) Operational Cutbacks .414** (.165) .049 (.031)
Investment FR Staff .625*** (.169) .086*** (.031) FR Consultant -.066 (.218) .007 (.041) FR Budget .018 (.093) .055*** (.017)
Environment External Relations .327*** (.083) .047*** (.015) REI -.064 (.054) .008 (.010)
R2 .438 .301
Adj R2 .401*** .255***
N 396 396
*p<.1; **p<.05; ***p<.01
Hypothesis 2b predicts that organizations with large budget are more likely to
have a higher level of revenue balance. Regression results do not support this
hypothesis. This finding suggests that organizations do not necessarily try to manage
their financing pattern in a way that helps obtain a more balanced revenue structure, even

127
when they might have sufficient resources and capacity to do so.
Hypotheses 3 predicts that board size is positively related to both funding
variety and revenue balance, which is not confirmed by regression results. However,
regression coefficients support Hypothesis 4 that number of board meetings each year
significantly increases funding variety (b=.299, p<.01) and level of revenue balance
(b=.048, p<.1). These findings seem to suggest that board involvement in nonprofit
management and decision-making matters more than just the number of people sitting on
board in predicting nonprofit revenue diversification.
Hypothesis 5 predicts that organizations that have recently experienced
organizational growth in terms of programs and services are more likely to have more
funding sources and a higher level of revenue balance. The coefficients for
organizational growth are significant in Model 1 (b=.320, p<.01) and in Model 2 (b=.036,
p<.1) and the directions of the coefficients are consistent with the hypothesized
relationships. This finding supports Hypothesis 5 and shows growth and development
of services and programs, as an important indicator of organizational capacity,
significantly improves the level of funding variety and revenue balance.
Hypothesis 6 predicts that internal organizational development is positively
related to both funding variety and revenue balance. The coefficients for internal
development are significant in Model 1 (b=-.284, p<.01) and in Model 2 (b=-.041, p<.01),
however, the directions of the coefficients are inconsistent with the hypothesized
relationships. The results indicate that better internal development as self-reported by

128
organizations significantly reduces the number of funding sources as well as the level of
revenue balance.
Hypothesis 7 predicts that organizations enjoying greater managerial success
are more likely to have more funding sources and a more balanced revenue structure.
Surprisingly, regression results do not support this hypothesis. These findings certainly
needs further investigation as understanding the dynamics of nonprofit management and
its impact on revenue structure are critical to inform nonprofit fund development.
Hypothesis 8 predicts that organizations that attach more importance to revenue
diversification are more likely to have more funding sources and a higher level of
revenue balance. The coefficients for perceived importance of revenue diversification
are significant in Model 1 (b=.145, p<.05) and Model 2 (b=.031, p<.01) and the direction
of the coefficients are consistent with the hypothesized relationship. This finding
supports Hypothesis 8 and shows that management‟s perception of the importance of
diversifying revenue structure has a significant influence on real diversification status as
indicated by funding variety and revenue balance.
Hypothesis 9 predicts that influence of executive director and professional staff
on revenue generation strategy is positively associated with funding variety and revenue
balance, which is only partially confirmed by the regression results. The coefficient in
Model 1 (b=.206, p<.05) is significant and the direction of the coefficient is consistent
with the hypothesized relationship. This finding suggests that internal management‟s
influence on revenue generation strategy has a significant impact on funding variety.

129
However, this influence has no effect on revenue balance, as the coefficient in Model 2 is
not significant and the direction of the coefficient is inconsistent with what is
hypothesized.
Hypothesis 10 predicts that organizations that have experienced recent
operational cutbacks are more likely to have a greater funding variety and a higher level
of revenue balance. This hypothesis is only partially confirmed by regression results.
The coefficient for operational cutbacks is significant in Model 1 (b=.414, p<.05), but not
significant in Model 2. The significant relationship between operational cutbacks and
funding variety suggests that if organizations experience recent cutbacks, they are highly
likely to have an incentive to develop new funding relationships and seek more funding
sources. However, they are not necessarily motivated to balance their revenue structure,
which they might consider to be of little importance, at least for the time being when their
most critical concern is to have ends meet.
Regression results provide evidence to support Hypothesis 11 which predicts
that organizations with designated employees working on fund-raising and related
activities are more likely to have more funding sources and a higher level of revenue
balance. The coefficient for fund development staff which is a dummy variable are
significant in Model 1 (b=.625, p<.01) and Model 2 (b=.086, p<.01), and the direction of
the coefficients are consistent with the hypothesized relationships. This finding shows
that designating fund development staff helps nonprofit organizations increase the total
number of funding sources and improve the balance among the three broad revenue

130
categories.
The same is expected from the relationship between the use of external fund
development consultants and revenue diversification. However, the findings shown in
Table 5.15 do not provide evidence to argue such a significant relationship as predicted
by Hypothesis 12. This study constructs a dummy variable to measure the use of
external fund development professionals. Of the 501 responding organizations, only 83
(16.6%) reported they hire outside fund development consultants to help with related
activities. The unbalanced distribution of organizations that use external fund
development consultants and those that do not might explain the insignificant result of
the relationship.
Hypothesis 13 predicts that fund development expenditure as measured by
percentage of operating budget has significant and positive impact on revenue
diversification measures. Regression results only partially confirm this hypothesis.
The coefficient for fund development budget is not significant in Model 1 and is
significant in Model 2 (b=.055, p<.01). The insignificant result in Model 1 may reflect
measurement limitations. This study constructs a categorical variable to measure the
effect of fund development budget on revenue diversification. However, the categories
(scales in this case) might not be able to fully capture the variations in fund development
expenditure. A better way would be to use a continuous variable (percentage in this
case) as an alternative measurement. However, using continuous level measuremtn
makes it more difficult for respondents to answer the question and this was exactly the

131
reason a categorical variables was used rather than a continuous one when the survey was
designed.
Hypothesis 14 predicts that a better relationship with outside stakeholders such
as funding agencies, major donors, and service recipients significantly increases funding
variety and improves revenue balance. Regression results provide evidence to support
this hypothesis. The coefficients for external relationships are significant in Model 1
(b=.327, p<.01) and Model 2 (b=.047, p<.01), and the directions of the coefficients are
consistent with the hypothesized relationships. The findings show that developing a
good relationship with outside stakeholders can significantly improve revenue
diversification in terms of both funding variety and revenue balance.
Regression results do not provide evidence to argue that regional economic
situation is a significant predictor of revenue diversification as proposed in Hypothesis 15.
Neither of the coefficients for regional economic instability is significant in Model 1 and
Model 2. This variable is constructed at county level, which means organizations
located in a same county share a same value for this variable. A possible interpretation
of this finding is that the regional difference in economy within the state of New Jersey is
not significant enough to present varying effect on nonprofit revenue generation.
The regression models also analyze the effects of some control variables on
revenue diversification. According to Hypotheses 16a and 16b, both employee size and
volunteer size significantly improves funding variety. Regression coefficients for
employee size (b=.129, p<.1) and volunteer size (b=.220, p<.01) are both significant in

132
Model 1, and the direction of the coefficients are consistent with the hypothesized
relationships. These findings demonstrate that staff size has significant impact on
nonprofit revenue diversification.
Organizational age can be used as a good proxy for organizational capacity and
reputation. Hypothesis 17 predicts that mature and more established organizations are
more likely to have more funding sources and a higher level of revenue balance, which is
supported by the regression results. Regression coefficients for organizational age are
significant in Model 1 (b=.230, p<.01) and Model 2 (b=.038, p<.05), and the direction of
the coefficients are consistent with the hypothesized relationships.
In addition, there have been very minor sectoral and geographic differences in
terms of their effects on nonprofit revenue diversification. The only service field that
presents a different influence is Community Improvement; organizations in this field tend
to have fewer funding sources (b=-.504, p<.1). In terms of geographical locations,
organizations located in urban areas are more likely to have a more balanced revenue
structure (b=.066, p<.1).
In summary, regression results presented from Table 5.15 provide evidence to
argue that organizational and environmental factors have significant effects on nonprofit
revenue diversification. First, organizational capacity significantly affects variations of
funding variety and revenue balance. Second, managerial factors have significant and
positive effects on funding variety, but less so on revenue balance. Third, fund
development efforts‟ effects on revenue diversification are rather mixed. Finally, one of

133
the two environmental factors proves to be a significant predictor of revenue
diversification. Table 5.16 provides a summary of the hypothesis testing results for
Model 1 and Model 2.
Table 5.16 Summary of Hypotheses Testing Results (Models 1 and 2)
Research Hypotheses
C: Confirmed NC: Not Confirmed Results
H2a There is a curvilinear relationship (∪shaped) between budget size and funding variety. C
H2b Budget size is positively related to revenue balance. NC
H3a Board size is positively related to funding variety. NC
H3b Board size is positively related to revenue balance. NC
H4a # of board meetings is positively related to funding variety. C
H4b # of board meetings is positively related to revenue balance. C
H5a Organizational growth is positively related to funding variety. C
H5b Organizational growth is positively related to revenue balance. C
H6a Internal development is positively related to funding variety. NC*
H6b Internal development is positively related to revenue balance. NC*
H7a Managerial success is positively related to funding variety. NC
H7b Managerial success is positively related to revenue balance. NC
H8a Management‟s attitude toward RD is positively related to funding variety. C
H8b Management‟s attitude toward RD is positively related to revenue balance. C
H9a Influence from ED and staff on funding strategy is positively related to funding variety. C
H9b Influence from ED and staff on funding strategy is positively related to revenue balance. NC
H10a Recent operational cutbacks are positively related to funding variety. C
H10b Recent operational cutbacks are positively related to revenue balance. NC
H11a Use of fund development staff is positively related to funding variety. C
H11b Use of fund development staff is positively related to revenue balance. C
H12a Use of fund development consultants is positively related to funding variety. NC
H12b Use of fund development consultants is positively related to revenue balance. NC
H13a Fund development expenditure is positively related to funding variety. NC
H13b Fund development expenditure is positively related to revenue balance. C
H14a External relationship is positively related to funding variety. C
H14b External relationship is positively related to revenue balance. C
H15a Regional economy is positively related to funding variety. NC
H15b Regional economy is positively related to revenue balance. NC
H16a Employee size is positively related to funding variety and revenue balance. C
H16b Volunteer size is positively related to funding variety and revenue balance. C
H17 Organizational age is positively related to funding variety and revenue balance. C
Note: * indicates that the finding is significant but not consistent with the hypothesized direction.

134
5.4.4 Regression Analysis: Financial Sustainability as Dependent
The regression model for predicting the effect of exploratory variables on
financial sustainability is:
FinancialSustainability = β0 + β1FundingVariety + β2RevenueBalance + β3Budget +
β4Board + β5Boardmeeting + β6OperationalCutbacks + β7FRStaff + β8FRConsultant +
β9FRBudget + β10ExtRelation + β11REI + β12FundingVariety*Budget +
β13RevenueBalance*Budget + β14HS + β15Youth + β16Housing + β17Community + β18Urban
+ β19Suburban + β20OrganizationAge + β21EmployeeSize + β22VolunteerSize
Table 5.17 summarizes the regression results of the three models that use financial stress,
likelihood to maintain services, and future funding success to operationalize and measure
nonprofit financial sustainability. Adjusted R2 for the Financial Stress regression model
is .110, accounting for 11% of the variance and the F (22, 377) statistics is 3.24 (p<.000).
Adjusted R2 for the Maintain Services regression model is .079, accounting for about 8%
of the variance and the F (22, 379) statistics is 2.56 (p<.000). Adjusted R2 for the
Future Funding Success regression model is .113, accounting for about 11% of the
variance and the F (22, 373) statistics is 2.36 (p<.000).
The regression analysis does not provide much evidence to support the
hypothesized links between financial sustainability and most of the predictor variables.
Hypotheses 18a and 18b predict that revenue diversification decreases the level
of financial stress of nonprofit organizations. However, they are not supported by the
regression results. The direction of the coefficient for funding variety is consistent with
the hypothesized relationship in Model 3; but the coefficient is not significant. This

135
insignificant finding suggests that organizations enjoying multiple funding sources do not
particularly experience lower level of financial stress. The coefficient for Revenue
Balance is significant in Model 3 (b=1.039, p<.05), but the direction of the coefficient is
inconsistent with the hypothesized relationship. This finding suggests that a more
balanced revenue structure significantly increases the level of nonprofit financial stress.
One possible explanation of this finding is that when trying to balance their revenue
structure, organizations creates just one more task to manage and thus more stress on
their operations. Another important interpretation of this result is that reliance on
non-government sources hurt nonprofit organizations more during the economic crisis
because these funding sources are more volatile. Relying on government funding,
instead, turns out to be a relatively safe option for nonprofits surviving the economic
crisis as government funding is more reliable than non-government funding sources.
Hypotheses 19a and 19b predict that revenue diversification enhances the
likelihood to maintain the current level of programs and services, which are not supported
by the regression results. The coefficient for Funding Variety is significant in Model 4
(b=-.185, p<.1), but the direction of the coefficient is inconsistent with the hypothesized
relationship. This finding suggests that organizations that have more funding sources
are less likely to maintain the level of programs and services. The direction of the
coefficient for Revenue Balance in Model 4 is consistent with the hypothesized
relationship; however the coefficient is not significant. This insignificant finding
suggests that a more balanced revenue pattern does not particularly enhance the

136
likelihood to maintain programs and services.
Table 5.17 Financial Sustainability as a Function of Organizational and
Environmental Characteristics
Financial Stress Maintain Program/Service Future Funding Success
Model 3 Model 4 Model 5
Rev Diversification b SE b SE b SE
Funding Variety -.063 (.092) -.185* (.101) .097** (.045) Revenue Balance 1.039** (.503) .574 (.557) .284 (.249) FundVariety*Budget .021 (.081) .073 (.087) .018 (.039) RevBalance*Budget -.765 (.509) .488 (.563) .013 (.250)
Contextual Characteristics Budget .007 (.007) -.014 * (.008) -.001 (.003) Board Size -.065 (.121) .080 (.134) -.001 (.060) Board Meetings .039 (.171) .267 (.189) .028 (.085) Operational Cutbacks 1.465*** (.258) -1.439*** (.285) -.461*** (.128) FR Staff .048 (.272) .403 (.300) .192 (.134) FR Consultant -.402 (.341) -.122 (.378) .192 (.168) FR Budget .088 (.148) -.387** (.164) -.028 (.073) External Relationship -.263** (.126) .011 (.139) .225*** (.063) REI -.037 (.084) -.005 (.094) .015 (.042)
Background
Employees -.231** (.103) .244** (.114) -.023 (.051) Volunteers -.128 (.106) .066 (.118) .002 (.052) Organization Age .109 (.137) -.033 (.152) -.008 (.068) HS .390 (.354) -.242 (.392) .120 (.175) Youth .144 (.510) -.602 (.558) .113 (.251) Housing -.312 (.448) -.612 (.498) .308 (.225) Community .087 (.463) .611 (.514) .240 (.230) Urban -.323 (.339) .416 (.373) .184 (.167) Suburban -.644** (.324) .129 (.357) .210 (.160)
R2 .159 .129 .162
Adj R2 .110*** .079*** .113***
N 400 402 395
*p<.1; **p<.05; ***p<.01
Hypotheses 20a and 20b predict that revenue diversification enhances nonprofit
organizations‟ future funding success, which is partially supported by regression results.
The coefficient for Funding Variety is significant (b=.097, p<.05) in Model 5, and the
direction of the coefficient is consistent with the hypothesized relationship. This finding
suggests that organizations having more funding sources are more likely to be successful
in fund development in the future. However, the coefficient for Revenue Diversification

137
is not significant in Model 5, which suggests that keeping a balanced revenue pattern
does not necessarily help organizations in terms of raising funds.
According to hypotheses 21, budgetary size has a negative effect on financial
stress, and positive effects on maintaining programs/services and on future funding
success. The coefficients for Budget Size are not significant in Model 3 and Model 5,
and significant (b=-.014, p<.1) in Model 4 with a direction that is inconsistent with the
hypothesized relationship. These findings suggest that a large budget does not
necessarily guarantee a better financial sustainability. On the contrary, the regression
results show that larger organizations are less likely to maintain the current level of
programs and services. Correlation analysis shows that budgetary size and operational
cutbacks are positively related at significance level of .01. This suggests that larger
organizations are more likely to experience cutbacks, and this might explain why larger
organizations are less likely to maintain services.
Hypotheses 22 and 23 predict that both board size and number of annual board
meetings can predict nonprofit financial sustainability, which are not confirmed by the
regression results. Across the board, nonprofit board does not seem to have any
significant impact on the three measures of financial sustainability.
Hypotheses 24a, b, and c predict that recent experience of operational cutbacks
significantly reduces the likelihood that organizations are financially sustainable. The
coefficients for Operational Cutbacks are significant in all the three models, and the
directions of all the coefficients are consistent with the hypothesized relationships.

138
These findings suggest that operational cutbacks significantly increase organization‟s
financial stress, reduce the likelihood to maintain programs and services, and affect future
fund development.
Hypothesis 25 predicts that fund development efforts and investment
significantly enhances nonprofit financial sustainability. Of the nine sub-hypotheses
regarding the relationships between the three fund development efforts measures (Fund
Development Staff, Fund Development Consultants, and Fund Development Budget) and
the three financial sustainability measures, only one relationship turns out to be
statistically significant – the coefficient for Fund Development Budget in Model 4 is
significant (b=-.387, p<.05), however, the direction of the coefficient is inconsistent with
the hypothesized relationship. This inconsistent relationship, which merits further
investigation, seems to suggest that organizations that spend more on fund development
are less likely to maintain their services and programs.
Hypotheses 26a, b, and c predict that developing a better relationship with
external stakeholders helps nonprofit organizations maintain financially healthy. The
coefficients for External Relationship are significant in Model 3 (b=-.263, p<.05) and
Model 5 (b=.225, p<.01), and the directions of the coefficients are consistent with the
hypothesized relationships. The findings suggest that organizations that enjoy a healthy
relationship with outside stakeholders or partners are less likely to experience financial
stress while more likely to be successful in revenue generation in the future.
Hypotheses 27a, b, and c predict a significant effect from regional economic

139
situation on nonprofit financial sustainability. The regression results do not provide
sufficient evidence to argue for such a relationship. The insignificant result might be
due to the marginal regional differences in an economically homogeneous state like New
Jersey. Also, the current economic crisis could have minimized the regional differences
to a degree that does not present sufficient variations for meaningful analysis.
Hypotheses 28a and b predict that the performance-boosting effect from
revenue diversification is more significant as nonprofit organizations‟ budgetary size
increases. The coefficients for the interaction variables are not significant and the
results do not provide sufficient evidence to argue that budgetary size increases revenue
diversification‟s positive effect on nonprofit financial sustainability.
Finally, this study examines some other variables‟ effects on nonprofit financial
sustainability, such as number of employees, number of volunteers, years of operation,
and geographic location. The regression results do not provide sufficient evidence to
argue for most of the hypothesized relationships. The coefficients for employee size are
significant in Model 3 (b=-.231, p<.05) and Model 4 (b=.244, p<.05), and the directions
of the two coefficients are consistent with the hypothesized relationships. These
findings suggest that large organizations that employ more staff members are less likely
to experience financial stress while more likely to be sustainable in terms of program and
service provision. In addition, the coefficient for Suburban is significant in Model 3
(b=-.644, p<.05), which suggests that organizations located in suburban regions are less
likely to experience financial stress than organizations located in non-suburban regions.

140
In summary, regression results presented from Table 5.17 do not provide
sufficient evidence to argue that revenue diversification is a strong indicator of nonprofit
financial sustainability. Table 5.18 provides a summary of hypothesis testing results for
Models 3, 4 and 5.
Table 5.18 Summary of Hypotheses Testing Results (Models 3, 4 and 5)
Research Hypotheses
C: Confirmed NC: Not Confirmed Results
H18a Funding variety is negatively related to financial stress NC
H18b Revenue balance is negatively related to financial stress NC*
H19a Funding variety is positively related to likelihood to maintain services. NC*
H19b Revenue balance is positively related to likelihood to maintain services. NC
H20a Funding variety is positively related to future funding success. C
H20b Revenue balance is positively related to future funding success. NC
H21a Budget size is negatively related to financial stress. NC*
H21b Budget size is positively related to likelihood to maintain services. NC
H21c Budget size is positively related to future funding success. NC
H22a Board size is negatively related to financial stress. NC
H22b Board size is positively related to likelihood to maintain services. NC
H22c Board size is positively related to future funding success. NC
H23a # of board meetings is negatively related to financial stress. NC
H23b # of board meetings is positively related to likelihood to maintain services. NC
H23c # of board meetings is positively related to future funding success. NC
H24a Experience of operational cutbacks is positively related to financial stress. C
H24b Experience of operational cutbacks is negatively related to likelihood to maintain services. C
H24c Experience of operational cutbacks is negatively related to future funding success. C
H25 Fund-raising efforts and investment is positively related to financial sustainability. NC
H26a External relationship is negatively related to financial stress. C
H26b External relationship is positively related to likelihood to maintain services. NC
H26c External relationship is positively related to future funding success. C
H27 REI is negatively related to financial sustainability. NC
H28a Budget size is positively related to funding variety‟s effect on financial sustainability. NC
H28b Budget size is positively related to revenue balance‟s effect on financial sustainability. NC
Note: * indicates that the finding is significant but not consistent with the hypothesized direction.
Although funding variety enhances the likelihood of future funding success, it
does not reduce the level of financial stress; what is more, it reduces the likelihood for

141
organizations to maintain their current programs and services. Revenue balance is not
related to the other two measures while it significantly increases financial stress. In
addition, only a few other contextual variables are found to strongly predict financial
sustainability, such as fund development budget, external relationship with outside
stakeholders, and staff size. Interestingly, results show that whether organizations have
experienced recent operational cutbacks is a strong indicator of nonprofit financial
sustainability.

142
CHAPTER SIX
IMPLICATINS AND FUTURE RESEARCH
This chapter discusses theoretical contributions, managerial implications, and
methodological improvements and suggests future research directions. The chapter
highlights this study‟s contributions to the literature of nonprofit revenue diversification,
nonprofit financial management, and nonprofit performance. The chapter further
illustrates important managerial implications for nonprofit managers, individual donors
and institutional funders, and policy makers. The chapter concludes with a discussion
on the study‟s limitations and directions for future research.
6.1 Theoretical Contributions
This study contributes to the literature of nonprofit revenue diversification,
nonprofit financial management, and nonprofit performance. First, the study provides a
definition of nonprofit revenue diversification the use of which has been inconsistent in
existing literature and empirically tests this definition. The findings suggest that
revenue diversification should be approached from both “variety” and “balance”
perspectives as they capture two dimensions of nonprofit revenue structure.
Second, this study develops an integrated model that addresses the multiple
predictors of nonprofit financial performance through a multidimensional perspective by
linking the analysis of nonprofit revenue diversification. The model predicts how

143
variations of revenue diversification and nonprofit financial sustainability are correlated
with different assumptions about organizational features, managerial factors, and
environmental characteristics. This theoretical contribution is important to explain
financial performance heterogeneity among nonprofit organizations by taking into
account their distinct organizational capacity, managerial factors, fund development
efforts, and environmental factors. In addition, this study adds new knowledge to
understand revenue diversification by investigating what determine the level of funding
variety and revenue balance as well as their effects on nonprofit financial sustainability.
The findings of this study suggest that nonprofit organizations‟ structure and
capacity can help them to improve their revenue diversification, particularly funding
variety. The regression results demonstrate that capacity measures including budget size,
board involvement, programmatic growth, organizational size, and organizational age, are
very strong indicators of a high level of nonprofit revenue diversification. This study
also reveals that managerial experiences of nonprofit organizations are significant
indicators of revenue diversification, especially funding variety. The regression results
show that management perception of revenue diversification and internal management‟s
influence on fund development strategies are strongly related to nonprofit revenue
diversification. In addition, fund development effort and investment of nonprofit
organizations is found to be of great significance in determining funding variety and
revenue balance of these organizations. However, the findings of this study do not
present a strong relationship between operating environment and revenue diversification.

144
Finally, the effect of diversification on performance has not been sufficiently
studied, and this study takes an important step to evaluate the relationship between
revenue diversification and nonprofit performance. In terms of whether nonprofit
organizations should strategically manage their fund development to create a diversified
and balanced revenue structure, the findings of this study conclude that revenue
diversification does not necessarily help organizations to maintain financially sustainable.
Instead, nonprofits having more funding sources are less likely to maintain their current
level of programs and services and a more balanced revenue structure increases the
financial stress of nonprofits. These findings partially challenge the “diversification
improves performance” proposition that has been held by some nonprofit researchers and
this theoretical contribution is crucial to inform future research efforts in this area to
further investigate diversification-performance relationship.
6.2 Managerial Implications
Development professional, researchers, and nonprofit practitioners have been
increasingly paying attention to nonprofit revenue structure and financial performance.
Moreover, there are some debates on the usefulness of diversifying revenue sources of
nonprofit organizations. The findings of this study provide a number of important
management implications that help shed light on understanding revenue diversification,
financial sustainability, and the relationship between them.
First, the findings from this study provide rather weak evidence that revenue

145
diversification impact financial sustainability of nonprofits. Furthermore, in addition to
the insignificant relationships, this study shows that a diversified revenue structure can
actually weaken financial sustainability. For example, more funding sources decreases
the likelihood to maintain services and a more balanced structure heightens the level of
financial stress. It however needs to be cautioned that the analysis is conducted at a
very special time when America‟s nonprofit sector is going through probably the worst
financial recession it has ever experienced and so the data might not be as typical and
representative as those if collected at another time.
Second, it is worth noting that funding variety and revenue balance present
different kinds of impact on financial performance. The findings suggest that while
having more funding sources help organizations secure revenues more successfully in the
future, maintaining a balanced revenue structure does not benefit organizations, even
worse, organizations will be under more pressure by doing so. Therefore this study
concludes that organizations need to design fund development plans very carefully and
make decisions regarding whether they should develop new funding relations or they
should try to balance their revenue structure according to resource sufficiency and
performance priorities.
6.3 Methodological Improvements
Several methodological improvements drawn from this study can be useful for
future research on nonprofit financial management and performance measurement. First,

146
earlier studies indicate that sample selection affects the comparison of nonprofit revenue
diversification and performance and results in inconsistent and contradictory findings.
This study constructs a more comparable sample by developing distinct sample selection
criteria that focus on a group of homogenous organizations based on NTEE classification
(human services and community improvement organizations) in a same location (New
Jersey).
Second, accurate measurement and information regarding variables are critical
to research on nonprofit revenue diversification. Instead of relying completely on 990
Form data, this study collects survey data to calculate the two diversification measures
which overcomes the limitation of the 990 Form data.
Finally, as discussed in literature review, measuring organizational performance
is difficult due to multiple missions of nonprofit organizations; measuring financial
performance nonprofits is also difficulty due to a great array of efficiency and outcome
measures. The study specifically examines nonprofit financial sustainability by
investigating the three measures of financial stress, likelihood to maintain services, and
future funding success. Such a design creates future possibility of exploring more
performance measures that not only compare efficiency but also sustainable development
of nonprofit organizations.
6.4 Limitations and Future Research directions
Despite its theoretical contributions and methodological improvements, this

147
study has a number of limitations – some of which are mentioned in previous chapters –
that might influence the robustness of regression results and the generalizability of the
findings. Future research can overcome these limitations by extending the integrated
model and testing alternative hypotheses derived from other theoretical perspectives,
creating improved measurements and collecting more reliable performance data, using
advanced statistical models, and conducting qualitative research as follow-up studies.
First, as shown in the regression results tables, the full models only explain
total variance in funding variety and revenue balance for about 40% and 26%. The
explanatory power of the three models for financial sustainability is even less at around
10% on average. These percentages suggest that other contextual factors that might
have influence on nonprofit revenue diversification and financial sustainability are not
included in the research models in this study. Therefore, the study would recommend
that future research develop and test alternative hypotheses derived from other theoretical
perspectives to examine research questions such as: How does leadership, organizational
learning process, and market competitiveness affect nonprofit revenue diversification and
financial sustainability? Exploring these new research questions provide useful
knowledge that can complement the findings of this study and provide additional
managerial implications.
Second, data limitations influence the accuracy of regression results and sample
characteristics affect the generalizability of the findings. This study heavily uses survey
data that are mostly self-reported estimates of variables, which raises the concern of

148
measurement validity. A majority of variables are categorical or scale variables that are
unable to fully present the variations. These measurement limitations reduce the
research models‟ capacity to reveal potentially significant relationships between variables.
To overcome measurement limitations, this study suggests that researchers consider
collecting more continuous variables to better differentiate nonprofit revenue patterns,
organizational features, and environmental characteristics. In addition, this study
suggests that creating more construct variables to measure contextual variables would be
useful to facilitate advanced data analysis.
This study‟s sample is limited to two general types of organizations located in
one region. These organizations‟ institutional features and management dynamics might
differ significantly from other types of organizations, and the homogeneity in geographic
locations presented in the sample may limit the variations of some key variables in the
study such as regional economic instability. This study therefore suggests that future
research further test the research models by investigating organizations operating in other
service fields and other locations. It would be helpful to replicate the study elsewhere in
the U.S. to compare the results with the current ones based on the New Jersey sample.
Third, future research can use advanced statistical models to examine the
sophisticated relationships between contextual factors, revenue diversification, and
financial performance. Overcoming some data and measurement limitations would
provide more opportunities to implement advanced analytical methods. For instance, by
creating more construct variables, researchers can construct structural equation modeling

149
to investigate the complex causal relationships and subtle relations such as mediating
effects; furthermore, panel data makes it possible for researchers to conduct more
rigorous statistical analysis.
Fourth, it remains to be explored what an “optimal revenue structure” is for
nonprofit organizations. Given that this study does not provide sufficient evidence to
argue for a positive relationship between revenue diversification and financial
sustainability and fails to reveal other important predictors of financial sustainability,
future research still needs to collect information to formulate the so-called “best practices”
for organizations regarding fund development and management.
Finally, the preliminary findings suggest that researchers may implement case
studies to collect qualitative data that can hopefully help interpret the findings from the
quantitative analysis and explore more relevant topics to be included in future research
models. It is also useful to conduct follow-up studies to track the long term trend
toward a diversified revenue generation pattern in the nonprofit sector. Financial
literature suggests that revenue diversification, as a strategy to divert investment risk for
corporations, is not able to cope with the risks associated with a systemic crisis. Future
study will be helpful to further investigate whether the potential performance-boosting
effect from revenue diversification has been offset by the particular economic
environment when the current research was conducted.

150
6.5 Conclusion
Examining nonprofit revenue diversification is important not only in
understanding nonprofit financial management dynamics but also in informing nonprofit
financial sustainability. This study draws on nonprofit financial management theories to
propose three research questions, and develops and empirically tests an integrated model
that investigates how contextual factors – organizational structure and capacity,
managerial experience, fund development effort and investment, and operating
environment – affect nonprofit revenue diversification and financial sustainability.
Questionnaires were administered to executive directors of 1,115 New Jersey
human services and community improvement organizations. Using data from 501
responding organizations, this study found certain organizational and environmental
characteristics have a significant influence on nonprofit revenue diversification. As
expected, some capacity, management, investment and environment measures have a
positive impact on funding variety, but fewer measures have a positive effect on revenue
balance. Multiple regression analyses reveal that most of the hypotheses regarding
predictors of financial sustainability are not confirmed which suggests that the research
model does not include other factors that significantly impact nonprofit financial
sustainability.
Major findings of the study include: (a) organizational structure and capacity,
such as employee size, years of operation, board involvement, and internal development,
are positively related to nonprofit revenue diversification, particularly funding variety; (b)

151
managerial factors, including management‟s attitude toward revenue diversification,
management‟s influence on fund development strategies, and recent operational cutbacks,
have significant impact on funding variety, but less so on revenue balance; (c) using
designated fund development staff and developing good relationship with outside
stakeholders enhance revenue diversification; and (d) revenue diversification does not
help organizations maintain financially sustainable. Although these findings are only
suggestive, this study is a significant step forward in the development of a theory of
nonprofit financial performance including the analysis of revenue diversification which
will lead to a better understanding of a number of topics that have been understudied and
thus not well understood.

152
REFERENCES
Andreasen, Alan R., Ronald C. Goodstein, and Joan W. Wilson. 2005. Transferring
“Marketing Knowledge” to the Nonprofit Sector. California Management Review
47(4): 46-67.
Austin, Michael J. 2003. The Changing Relationship between Nonprofit Organizations
and Public Social Service Agencies in the Era of Welfare Reform. Nonprofit and
Voluntary Sector Quarterly 32(1): 97-114.
Babbie, Earl R. 2008. The Basics of Social Research (4th
ed). Belmont, CA: Thompson
and Wadsworth.
Baruch, Yehuda, and Brooks C. Holtom. 2008. Survey Response Rate Levels and Trends
in Organizational Research. Human Relations 61(8): 1139-1160.
Bell, Jeanne, Richard Moyers, and Timothy Wolfred. 2006. Daring to Lead 2006: A
National Study of Nonprofit Executive Leadership. San Francisco: CompassPoint
Nonprofit Services.
Berry, Jeffrey M., David F. Arons, Gary D. Bass, Matthew F. Carter, and Kent E. Portney.
2003. Surveying Nonprofits: A Methods Handbook. Washington, D.C.: The Aspen
Institute.
Bielefeld, Wolfgang. 2006. Quantitative Research for Nonprofit Management. Nonprofit
Management and Leadership 16(4):395-409.
Blasi, Gerald J. 2002. Government Contracting and Performance Measurement in Human
Services. International Journal of Public Administration 25(4):519-538.
Boris, Elizabeth T., and C. Eugene Steuerle. eds. 1999. Nonprofits and Government:
Collaboration and Conflict. Washington, DC: The Urban Institute Press.
Brooks, Arthur C. 2000. Is There a Dark Side to Government Support for Nonprofits?
Public Administration Review 60(3): 211-218.
_______. 2002. Can Nonprofit Management Help Answer Public Management‟s “Big
Questions”? Public Administration Review 62(3): 259-266.
_______. 2003. Do Government Subsidies to Nonprofits Crow Out Donations or Donors?

153
Public Finance Review 31(2): 166-179.
_______. 2004. The Effects of Public Policy on Private Charity. Administration and
Society 36(2): 166-185.
_______. 2005. What Do Nonprofit Organizations Seek? (And Why Should
Policymakers Care?). Journal of Policy Analysis and Management 24(3):
543-558.
Brown, William A. 2005. Exploring the Association between Board and Organizational
Performance in Nonprofit Organizations. Nonprofit Management and Leadership
15(3): 317-339.
Burlingame, Dwight F. ed. 1997. Critical Issues in Fund Raising. New York: John Wiley
& Sons, Inc.
Callen, Jeffrey L., April Klein, and Daniel Tinkelman. 2003. Board Composition,
Committees, and Organizational Efficiency: The Case of Nonprofits. Nonprofit
and Voluntary Sector Quarterly 32(4): 493-520.
Carroll, Deborah A. 2005. Are State Governments Prepared For Fiscal Crisis? A Look At
Revenue Diversification During The 1990s. Public Finance Review 33(5):
603-633.
Carroll, Deborah A., and Keely Jones Stater. 2009. Revenue Diversification in Nonprofit
Organizations: Does it Lead to Financial Stability? Journal of Public
Administration Research and Theory 19(4): 947-966.
Center for Non-Profit Corporations. 2005. New Jersey’s Non-Profit Sector: An Economic
Force for Building A Better New Jersey (2004-2005 Edition).
Chang, Cyril F., and Howard P. Tuckman. 1991. Financial Vulnerability and Attrition as
Measures of Nonprofit Performance. Annals of Public and Cooperative
Economics 62(4): 655-672.
________. 1996. Revenue Diversification among Nonprofits. Voluntas 5(3): 273-290.
Christian, Leah Melani, Don A. Dillman, and Jolene D. Smyth. 2007. Helping
Respondents Get It Right the First Time: The Influence of Words, Symbols, and
Graphics in Web Surveys. Public Opinion Quarterly 71(1): 113-125.

154
Cole, Shu Tian. 2005. Comparing Mail and Web-Based Survey Distribution Methods:
Results of Surveys to Leisure Travel Retailers. Journal of Travel Research 43:
422-430.
Cox, Eli P. 1980. The Optimal Number of Response Alternatives for a Scale: A Review.
Journal of Marketing Research 17(4): 407-422.
Conroy, Michael E. 1975. The Concept and Measurement of Regional Industrial
Diversification. Southern Economic Journal 41(1): 492-505.
Couper, Mick P. 2000. Web Surveys: A Review of Issues and Approaches. Public Opinion
Quarterly 64: 464-494.
Couper, Mick P., and Peter V. Miller. 2008. Web Survey Methods: Introduction. Public
Opinion Quarterly 72(5): 831-835.
Couper, Mick P., Michael W. Traugott, and Mark J. Lamias. 2001. Web Survey Design
and Administration. Public Opinion Quarterly 65: 230-253.
Crittenden, William F. 2000. Spinning Straw into Gold: The Tenuous Strategy, Funding,
and Financial Performance Linkage. Nonprofit and Voluntary Sector Quarterly
29(1): 164-182.
Cycyota, Cynthia S., and David A. Harrison. 2006. What (Not) to Expect When
Surveying Executives: A Meta-Analysis of Top Manager Response Rates and
Techniques over Time. Organizational Research Methods 9(2): 133-160.
De Vita, Carol J. 1997. Viewing Nonprofits across the States. No. 1, August 1997, The
Urban Institute.
Dillman, Don A., Jolene Smyth, and Leah Melani Christian. 2008. Internet, Mail and
Mixed-Mode Surveys: The Tailored Design Method (3rd
ed). Hoboken, NJ: John
Wiley Co.
DiMaggio, Paul. 1986. Nonprofit Enterprise in the Arts: Studies in Mission and
Constraint. New York: Oxford University Press.
Dolnicar, Sara, Christian Laesser, and Katrina Matus. 2009. Online Versus Paper: Format
Effects in Tourism Surveys. Journal of Travel Research 47(3): 259-316.
Ferris, James, and Elizabeth A. Graddy. 1989. Fading Distinction among the Nonprofit,

155
Government, and For-Profit Sectors. In Virginian Hodgkinson and Richard Lyman
(eds), The Future of the Nonprofit Sector. San Francisco: Jossey-Bass.
Fischer, Robert L., Amanda L. Wilsker, and Dennis R. Young. 2007. Exploring the
Revenue Mix of Nonprofit Organizations – Does It Relate to Publicness?
Andrew Young School of Policy Studies Research Paper Series. Retrieved from
http://aysps.gsu.edu/publications/2007/downloads/07-32%20FischerWilskerYoun
g-ExploringtheRevenueMix.pdf
Foster, William, and Jeffrey Bradach. 2005. Should Nonprofits Seek Profits? Harvard
Business Review 83(2): 92-100.
Fricker, Ronald D., and Matthias Schonlau. 2002. Advantages and Disadvantages of
Internet Research Surveys: Evidence from the Literature. Field Methods 14(4):
347-367.
Frolich, Karen A. 1999. Diversification of Revenue Strategies: Evolving Resource
Dependence in Nonprofit Organizations. Nonprofit and Voluntary Sector
Quarterly 28(3): 246-268.
Froelich, Karen A., and Terry W. Knoepfle. 1996. Internal Revenue Service 990 Data:
Fact or Fiction? Nonprofit and Voluntary Sector Quarterly 25(1): 40-52.
Frumkin, Peter. 2003. The End of Public-Nonprofit Relations? A Comment on Plowden.
Nonprofit and Voluntary Sector Quarterly 32(3): 436-438.
_______. 2001. Strategic Positioning and the Financing of Nonprofit Organizations: Is
Efficiency Rewarded in the Contributions Marketplace? Public Administration
Review 61(3): 266-275.
Greenlee, Janet S., and K. L. Brown. 1999. The Impact of Accounting Information On
Contributions To Charitable Organizations. Research in Accounting Regulation 13:
111-125.
Greenlee, Janet S., and John M. Trussell. 2000. Predicting the Financial Vulnerability of
Charitable Organizations. Nonprofit Management and Leadership 11(2):199-210.
Grønbjerg, Kirsten A. 1993. Understanding Nonprofit Funding: Managing Revenues in
Social Service and Community Development Organizations. San Francisco:
Jossey-Bass.

156
________. 2001. The U.S. Nonprofit Human Service Sector: A Creeping Revolution.
Nonprofit and Voluntary Sector Quarterly 30(2): 276-297.
Grønbjerg, Kirsten A., and Richard Clerkin. 2003. The Indianapolis Nonprofit Sector:
Management Capacities and Challenges. Retrieved from
http://www.indiana.edu/~nonprof/results/npsurvey/indymanag.html
Guo, Baorong. 2006. Nonprofits Charity for Profit? Exploring Factors Associated with
the Commercialization of Human. Public Administration Review 67(3): 458-473.
Guo, Chao. 2007. When Government Becomes the Principal Philanthropist: The Effects
of Public Funding on Patterns of Nonprofit Governance. Public Administration
Review 67(3): 458-473.
Hager, Mark A. 2001. Financial Vulnerability among Arts Organizations: A Test of the
Tuckman-Chang Measures. Nonprofit and Voluntary Sector Quarterly 30(2):
376-392.
Hager, Mark A., Thomas Pollak, and Kennard Wing. 2002. How Fundraising is Carried
out in U.S. Nonprofit Organizations. International Journal of Nonprofit and
Voluntary Sector Marketing 7(4): 311-324.
Hager, Mark A., Sarah Wilson, Thomas H. Pollak, and Patrick Michael Rooney. 2003.
Response Rates for Mail Surveys of Nonprofit Organizations: A Review and
Empirical Test. Nonprofit and Voluntary Sector Quarterly 32(2): 252-267.
Hattie, John. 1985. Methodology Review: Assessing Unidimensionality of Tests and
Items. Applied Psychological Measurement 9(2): 139-164.
Hendrick, Rebecca. 2002. Revenue Diversification: Fiscal Illusion or Flexible Financial
Management. Public Budgeting and Finance 22(4): 52-72.
Herman, Robert D., and David O. Renz. 1997. Multiple Constituencies and Social
Construction of Nonprofit Organizational Effectiveness. Nonprofit and Voluntary
Sector Quarterly 26(2): 185-206.
_______. 1998. Nonprofit Organizational Effectiveness: Contrast between Especially
Effective and Less Effective Organizations. Nonprofit Management and
Leadership 9(1): 23-37.
_______. 2004. Doing Things Right: Effectiveness in Local Nonprofit Organizations: A

157
Panel Study. Public Administration Review 64(6): 694-704.
_______. 2008. Advancing Nonprofit Organizational Effectiveness Research and Theory:
Nine Theses. Nonprofit Management and Leadership 18(4): 399-415.
Hill, Gregory C. 2005. The Effects of Managerial Succession on Organizational
Performance. Journal of Public Administration Research and Theory 15(1):
585-597.
Hodge, Matthew M., and Ronald F. Piccolo. 2005. Funding Source, Board Involvement
Techniques, and Financial Vulnerability in Nonprofit Organizations: A Test of
Resource Dependence. Nonprofit Management & Leadership 16(2): 171-190.
Hoffman, John P. 2004. Generalized Linear Models: An Applied Approach. Pearson
Education.
Horne, Christopher S., Janet L. Johnson, and David M. Van Slyke. 2005. Do Charitable
Donors Know Enough – and Care Enough – About Government Subsidies to
Affect Private Giving to Nonprofit Organizations? Nonprofit and Voluntary Sector
Quarterly 34(1): 136-149.
Hughes, Patricia, and William Luksetich. 2004. Nonprofit Arts Organizations: Do
Funding sources Influence Spending Patterns? Nonprofit and Voluntary Sector
Quarterly 33(2): 203-220.
Jacobs, Fred A., and Nicholas N. Marudas. 2006. Excessive, Optimal, and Insufficient
Fundraising among the Nonprofit Times 100. International Journal of Nonprofit
and Voluntary Sector 11(2):105-114.
Jackson, Douglas K., and Thomas P. Holland. 1998. Measuring the Effectiveness of
Nonprofit Boards. Nonprofit and Voluntary Sector Quarterly 27(2): 159-182.
Jones, Michael, and Michael McKee. 2004. Feedback Information and Contributions to
Not-for-profit enterprises: Experimental Investigations and Implications for
Large-scale Fund-raising. Public Finance Review 32(5): 512-527.
Kaplowitz, Michael D., timothy D. Hadlock, and Ralph Levine. 2004. A Comparison of
Web and Mail Survey Response Rates. Public Opinion Quarterly 68(1): 94-101.
Keating, Elizabeth K., and Peter Frumkin. 2003. Reengineering Nonprofit Financial
Accountability: Toward a More Reliable Foundation for Regulation. Public

158
Administration Review 63(1): 3-15.
Kort, John R. 1981. Regional Economic Instability and Industrial Diversification in the
U.S. Land Economics 57(4): 596-608.
Krishnan, Ranjani, Yetman, Michelle H., and Yetman, Robert J. 2006. Expense
Misreporting in Nonprofit Organizations. The Accounting Review 81(2): 399-420.
Kuechler, Manfred. 1998. The Survey Methods: An Indispensable Tool for Social Science
Research Everywhere?. American Behavioral Scientist 42(2): 178-200.
Kushner, Roland J., and Peter P. Poole. 1996. Exploring Structure-Effectiveness
Relationships in Nonprofit Arts Organizations. Nonprofit Management and
Leadership 7(2): 119-136.
Lane, Frederick S. 2006. Managing Fiscal Stress. In Dennis R. Young (ed), Wise
Decision-Making In Uncertain Times: Using Nonprofit Resources Effectively.
New York: Foundation Center.
Lattin, James, J. Douglas Carroll, and Paul E. Green. 2003. Analyzing Multivariate Data.
Pacific Grove, CA: Thomson Learning, Inc.
LeRoux, Kelly M. 2005. What Drives Nonprofit Entrepreneurship? A Look at Budget
Trends of Metro Detroit Social Service Agencies. American Review of Public
Administration 35(4): 350-362.
Light, Paul C. 2000. Making Nonprofits Work: A Report on The Tides of Nonprofit
Management Reform. Washington, D.C.: The Aspen Institute, Brookings Institute
Press.
_______. 2002. Pathways to Nonprofit Excellence. Washington, D.C.: The Aspen
Institute, Brookings Institute Press.
_______. 2004. Sustaining Nonprofit Performance: The Case for Capacity Building and
the Evidence to Support It. Washington, D.C.: The Aspen Institute, Brookings
Institute Press.
Louie, Alison, and Arthur C. Brooks. 2006. Engaging Business with Nonprofits. In
Dennis R. Young (ed), Wise Decision-Making In Uncertain Times: Using
Nonprofit Resources Effectively. New York: Foundation Center.

159
Luksetich, William. 2008. Government Funding and Nonprofit Organizations. Nonprofit
and Voluntary Sector Quarterly 37(3): 434-442.
Malhotra, Neil. 2008. Completion Time and Response Order Effects in Web Surveys.
Public Opinion Quarterly 72(5): 914-934.
Massarsky, Cynthia, and Samantha L. Beinhacker. 2002. Enterprising Nonprofits:
Revenue Generation in the Nonprofit Sector. New Haven, CT: Yale School of
Management – The Goldman Sachs Foundation Partnership on Nonprofit
Ventures. Working Paper.
McLean, Chuck, and Carol Brouwer. 2009. The Effects of the Economy on the Nonprofit
Sector: October 2008-February 2009. GuideStar.
Miller, Judith. 1997. A Hands-On Generation Transforms the Landscape of Philanthropy.
The New York Times December 9, G8.
National Center for Charitable Statistics. 2006. U.S. and state profile. Retrieved from
http://nccsdataweb.urban.org/PubApps/profile1.php?state=US
New Jersey Department of Labor and Workforce Development. 2004-2009.
Unemployment Rate and Labor Force Estimates. Retrieved from
http://lwd.dol.state.nj.us/labor/lpa/employ/emp_index.html
Nobbie, Patricia Dautel, and Jeffrey L. Brudney. 2003. Testing the Implementation,
Board Performance, and Organizational Effectiveness of the Policy Governance
Model in Nonprofit Boards of Directors. Nonprofit and Voluntary Sector
Quarterly 32(4): 571-595.
Nonprofit Finance Fund. 2009. Nonprofit Finance Fund‟s 2009 Zoomerang Survey
Results. Retrieved from
http://www.nonprofitfinancefund.org/docs/2009/SurveyResults.pdf
Okten, Cagla, and Burton A. Weisbrod. 2000. Determinants of Donations in Private
Nonprofit Markets. Journal of Public Economics 75: 255-272.
Olsen, David E. 2000. Agency Theory in the Not-for-Profit Sector: Its Role at
Independent Colleges. Nonprofit and Voluntary Sector Quarterly 29(2): 280-296.
O‟Regan, Katherine, and Sharon Oster. 2002. Does Government Funding Alter Nonprofit
Governance? Evidence from New York City Nonprofit Contractors. Journal of

160
Policy Analysis and Management 21(3): 359-379.
Oster, Sharon M. 1995. Strategic Management for Nonprofit Organizations: Theory and
Cases. New York: Oxford University Press.
O‟Sullivan, Elizabethann, Gary R. Rassel, and Maureen Berner. 2003. Research Methods
for Public Administrators (4th
ed.). Addison Wesley Longman, Inc.
Peterson, Robert A. 2000. Constructing Effective Questionnaires. Thousand Oaks, CA:
Sage Publications.
Pollak, Thomas H. 2004. What We Know about Overhead Costs in the Nonprofit Sector.
Washington, DC: The Urban Institute.
Porter, Stephen R., and Michael E. Whitcomb. 2007. Mixed-Mode Contacts in Web
Surveys: Paper is Not Necessarily Better. Public Opinion Quarterly 71(4):
635-648.
_________. 2003. The Impact of Contact Type on Web Survey Response Rates. Public
Opinion Quarterly 67: 579-588.
Powell, Walter W., and Richard Steinberg. 2006. The Nonprofit Sector: A Research
Handbook (2nd
edition). New Haven: Yale University Press.
Pratt, Jon. 2004. Analyzing the Dynamics of Funding: Reliability and Autonomy.
Nonprofit Quarterly (Summer 2004): 8-13.
Ritchie, William J., William P. Anthony, and Arthur J. Rubens. 2004. Individual
Executive Characteristics: Explaining the Divergence between Perceptual and
Financial Measures in Nonprofit Organizations. Journal of Business Ethics 53(2):
267-281.
Ritchie, William J., and Karen Eastwood. 2006. Executive Functional Experience and Its
Relationship to the Financial Performance of Nonprofit Organizations. Nonprofit
Management and Leadership 17(1): 67-80.
Ritchie, William J., and Robert W. Kolodinsky. 2003. Nonprofit Organization Financial
Performance Measurement: An Evaluation of New and Existing Financial
Performance Measures. Nonprofit Management and Leadership 13(4): 367-381.
Rushton, Michael, and Arthur C. Brooks. 2007. Government Funding of Nonprofit

161
Organizations. Dennis C. Young (ed.) Financing Nonprofits: Putting Theory into
Practice. Lanham, MD: The Rowman & Littlefield Publishing Group, Inc.
Salamon, Lester M. 1987. Partners in Public Service: The Scope and Theory of
Government-Nonprofit Relations. Walter W. Powell (ed.) The Nonprofit Sector: A
Research Handbook. New Haven: Yale University Press.
_______. 1995. Partners in Public Service: Government-Nonprofit Relations in the
Modern Welfare State. Baltimore, MD: The Johns Hopkins University Press.
_______. 1999. America’s Nonprofit Sector: A Primer (2nd
ed). New York: The
Foundation Center.
_______. 2003. The Resilient Sector: The State of Nonprofit America. Washington D.C.:
Brookings Institution Press.
Salamon, Lester M., and Stephanie Lessans Geller. 2010. Nonprofits and Recessions:
New Data from Maryland – Nonprofit Employment Bulletin Number 33. Johns
Hopkins Center for Civil Society Studies and the Maryland Association of
Nonprofit Organizations.
Salamon, Lester M., and S. Wojciech Sokolowski. 2006. Employment in America’s
Charities: A Profile – Nonprofit Employment Bulletin Number 26. Johns Hopkins
Center for Civil Society Studies.
Savas, E.S. 2002. Competition and Choice in New York City Social Services. Public
Administration Review 62(1): 82-91.
Shannon, David M., and Carol C. Bradshaw. 2002. A Comparison of Response Rate,
Response Time, and Costs of Mail and Electronic Surveys. The Journal of
Experimental Education 70(2):179-192.
Shoham, Aviv, Ayalla Ruvio, Eran Vigoda-Gadot, and Nitza Schwabsky. 2006. Market
Orientation in the Nonprofit and Voluntary Sector: A Meta-Analysis of Their
Relationships with Organizational Performance. Nonprofit and Voluntary Sector
Quarterly 35(3):453-476.
Sherlock, Molly F., and Jane G. Gravelle. 2009. An Overview of the Nonprofit and
Charitable Sector. Retrieved from http://www.fas.org/sgp/crs/misc/R40919.pdf
Siegel, Paul B., Thomas G. Johnson, and Jeffery Alwang. 1995. Regional Economic

162
Diversity and Diversification. Growth and Change 26(2): 261-284.
Simmons, Walter O., and Rosemarie Emanuele. 2004. Does Government Spending
Crowd Out Donations of Time and Money? Public Finance Review 32(5):
498-511.
Smith, Steven Rathgeb. 2006. Institutional Collaborations and Transformations. In
Dennis R. Young (ed), Wide Decision-Making In Uncertain Times: Using
Nonprofit Resources Effectively. New York: Foundation Center.
Smith, Steven Rathgeb, and Michael Lipsky. 1993. Nonprofit for Hire: The Welfare State
in the Age of Contracting. Cambridge, MA: Harvard University Press.
Smith, Thomas More. 2007. The Impact of Government Funding on Private
Contributions to Nonprofit Performing Arts Organizations. Annals of Public and
Cooperative Economics 78(1):137-160.
Stone, Melissa Middleton, Mark A. Hager, and Jennifer J. Griffin. 2001. Organizational
Characteristics and Funding Environments: A Study of a Population of United
Way-Affiliated Nonprofits. Public Administration Review 61(3): 276-289.
Thornton, Jeremy. 2006. Nonprofit Fund-Raising in Competitive Donor Market.
Nonprofit and Voluntary Sector Quarterly 35(2): 204-224.
_______. 2004. Using Nonprofit Organization-level Financial Data to Infer Managers‟
Fund-raising Strategies. Journal of Public Economics 88: 2181-2192.
Tinkelman, Daniel, and Kamini Mankaney. 2007. When is Administrative Efficiency
Associated with Charitable Donations? Nonprofit and Voluntary Sector Quarterly
36(1): 41-64.
Trochim, William M. K. 2001. The Research Methods Knowledge Base (2nd
ed).
Cincinnati, OH: Atomic Dog Publishing.
Trussel, John M. 2002. Revisiting the Prediction of Financial Vulnerability. Nonprofit
Management & Leadership 13(1): 17-31.
Tuckman, Howard P., and Cyril F. Chang. 1991. A Methodology for Measuring the
Financial Vulnerability of Charitable Nonprofit Organizations. Nonprofit and
Voluntary Sector Quarterly 20(4): 445-460.

163
_______. 1992. Nonprofit Equity: A Behavioral Model and Its Policy Implications.
Journal of Policy Analysis and Management 11(1): 76-87.
Urban Institute. 2007. National Taxonomy of Exempt Entities-Core Codes: 2007 Desk
Reference. By the National Center for Charitable Statistics, Center on Nonprofit
and Philanthropy at the Urban Institute. Washington, D.C. Retrieved from
http://nccsdataweb.urban.org/kbfiles/322/NTEE-CC-Manual-2007a.pdf
Van Slyke, David. M., and Arthur Brooks. 2005. Why Do People Give? New Evidence
and Strategies for Nonprofit Managers. American Review of Public
Administration 35(3): 199-222.
Weiner, Nan, and Thomas A. Mahoney. 1981. A Model of Corporate Performance As A
Function of Environmental, Organizational and Leadership Influences. Academy
of Management Journal 24(3): 453-470.
Weisbrod, Burton A. 1998a. To Profit or Not to Profit: The Commercial Transformation
of the Nonprofit Sector. New York: Cambridge University Press.
_______. 1998b. Guest Editor‟s Introduction: The Nonprofit Mission and Its Financing.
Journal of Policy Analysis and Management 17(2): 165-174.
White, Darin W., and Clovis F. Simas. 2008. An Empirical Investigation of the Link
between Market Orientation and Church Performance. International Journal of
Nonprofit and Voluntary Sector Marketing 13: 153-165.
Wing, Kennard T., Thomas H. Pollak, and Amy Blackwood. 2008. The Nonprofit
Almanac 2008. Washington, D.C.: The Urban Institute Press.
Winkler, Marjorie A. 1997. Management and Financial Implications of Nonformula Fund
Raising. In Dwight F. Burlingame (ed), Critical Issues in Fund Raising. New
York: John Wiley & Sons.
Young, Dennis R. 1987. Executive Leadership in Nonprofit Organizations. In W.
Powell (eds), The Nonprofit Sector: A Research Handbook. New Haven, CT: Yale
University Press.
_______. 1997. The Management of Nonprofit Organization Resources. In Burlingame,
Dwight F. (ed), Critical Issues in Fund Raising. New York: John Wiley & Sons,
Inc.

164
_______. 2006. Issues for Research. In Dennis R. Young (ed), Wise Decision-Making in
Uncertain Times: Using Nonprofit Resources Effectively. New York: Foundation
Center.
_______. 2007. Why Study Nonprofit Finance? In Dennis R. Young (ed), Financing
Nonprofits: Putting Theory into Practice. Lanham, MD: The Rowman &
Littlefield Publishing Group, Inc.

165
APPENDICES
Appendix 1 Questionnaire 166
Appendix 2 Three Contacts of Mail Survey 174
Appendix 3 Three Contacts of Web Survey 177
Appendix 4 Notice of Exemption from IRB Review 181
Appendix 5 Descriptive Information of Questionnaire Items 182
Appendix 6 Full Data Analysis Results 185
Appendix 7 Survey Methods Study Results 196
Appendix 8 A Comparative Study between Web and Mail Surveys 200

166
Appendix 1: Questionnaire

167

168

169

170

171

172

173

174
Appendix 2: Three Contacts of Mail Survey
[Initial Mailing]
July 15, 2009
Dear Mr. ABC,
We are writing to invite your participation in a survey about how the current economic situation
affects New Jersey’s nonprofits like yours, particularly in the area of resource acquisition and
development. The survey is sponsored by the School of Public Affairs and Administration (SPAA) at
Rutgers, the State University of New Jersey, and directed by Professor Marc Holzer, and Weiwei Lin.
The mission of SPAA is to conduct important, timely research on issues of importance to the public
and nonprofit sectors in New Jersey and the nation.
You are one of a small group of nonprofit representatives who have been selected, so your
participation is very important to the study. We would greatly appreciate your taking only about 15
minutes to complete the enclosed questionnaire, and then return it in the self-addressed envelope.
Please be assured that your answers are completely confidential, and all results will be reported only
in aggregate form. The reported results will not identify you or your organization individually. We
would gladly provide you with a copy of the survey results when they are released.
We would be happy to answer any questions you might have about this study; please feel free to
contact Ms. Lin at (201) ***-**** or [email protected] .
As a token of appreciation, we are enclosing a flyer about our “Public Performance Measurement &
Reporting Network” (PPMRN) website. We hope you enjoy the free resources PPMRN provides on
a broad range of issues influencing the performance of public and nonprofit organizations and
agencies.
Thank you for your help and we look forward to receiving your response.
Sincerely,
Marc Holzer
Dean, Board of Governors Professor
SPAA
Rutgers, the State University of New Jersey
Weiwei Lin
Research Associate
SPAA
Rutgers, the State University of New Jersey
This study has been reviewed and approved by the Rutgers University Institutional Review Board, and if you have any
questions about your rights as a participant in this study, you may contact them by telephone at (732) 932-0150 × 2104

175
[Postcard]
July 22, 2009
Last week we sent you a questionnaire to ask your opinion about how the current economic
situation affects New Jersey nonprofits like yours.
If you have already completed and returned the questionnaire, please accept our sincere thanks. If
not, please do so today. We are very grateful for your help with this important study.
If you did not receive a questionnaire, or if it was misplaced, please contact Weiwei Lin at
201-***-**** or [email protected] and we will get another one in the mail to you
today.
Sincerely,
Marc Holzer Weiwei Lin
Dean and Board of Governors Professor Research Associate
School of Public Affairs and Administration School of Public Affairs and Administration
Rutgers University-Newark Rutgers University-Newark

176
[Second Mailing]
August 5, 2009
Dear Mr. ABC,
About three weeks ago we wrote to you asking if you would participate in a survey study about
how the current economic situation affects New Jersey nonprofits, particularly in the area of
resource acquisition and development. To the best of our knowledge, it has not yet been
returned.
We are writing again because of the importance that your responses have for this study. It is
only by hearing from each nonprofit representative in our small sample like you that we can be
sure that the results truly represent New Jersey nonprofit world. Therefore, we hope that you’ll
be able to take only about 15 minutes from your busy schedule to fill it out and send it back in the
self-addressed, postage-paid reply envelop we provided for your convenience.
Again, please be assured that all responses will be held in the strictest confidence, and all results
will be reported only in aggregate form. The reported results will not identify you or your
organization individually. If you have any questions about the study, please feel free to contact
Ms. Lin at [email protected] .
We hope that you enjoy the questionnaire.
Sincerely,
Marc Holzer
Dean, Board of Governors Professor
School of Public Affairs and Administration
Rutgers, the State University of New Jersey
Weiwei Lin
Research Associate
School of Public Affairs and Administration
Rutgers, the State University of New Jersey
This study has been reviewed and approved by the Rutgers University Institutional Review Board, and if you have any
questions about your rights as a participant in this study, you may contact them by telephone at (732) 932-0150 × 2104

177
Appendix 3: Three Contacts of Web Survey
[Initial Email Invitation]
To: [Email]
From: [email protected]
Subject: Rutgers University "Survey of Nonprofit Resource Acquisition and Development"
Body: [FirstName]
[LastName]
[CustomValue]
Dear [FirstName],
We are writing to invite your participation in a survey about how the current economic
situation affects New Jersey’s nonprofits like yours, particularly in the area of resource
acquisition and development. The survey is sponsored by the School of Public Affairs and
Administration (SPAA) at Rutgers, the State University of New Jersey, and directed by
Professor Marc Holzer, and Weiwei Lin. The mission of SPAA is to conduct important,
timely research on issues of importance to the public and nonprofit sectors in New Jersey
and the nation.
You are one of a small group of nonprofit representatives who have been selected, so your
participation is very important to the study. We would really appreciate your taking only
about 15 minutes to complete the survey; please click on the link below to begin the
survey:
Survey link: http://www.surveymonkey.com/s.aspx
Please be assured that your answers will be completely confidential, and all results will be
reported only in aggregate form. The reported results will not identify you or your
organization individually. We would gladly provide you with a copy of the survey results
when they are released.
We would be happy to answer any questions you might have about this study; please feel
free to contact Ms. Lin at (201) 349-5285 or [email protected]
Thank you for your help by completing the survey.

178
Sincerely,
Marc Holzer
Dean and Board of Governors Professor
School of Public Affairs and Administration
Rutgers, the State University of New Jersey
Weiwei Lin
Research Associate
School of Public Affairs and Administration
Rutgers, the State University of New Jersey
(P.S.: This study has been reviewed and approved by the Rutgers University Institutional
Review Board, and if you have any questions about your rights as a participant in this
study, you may contact them by telephone at (732) 932-0150 × 2104 or

179
[Follow-up Email #1]
To: [Email]
From: [email protected]
Subject: Rutgers University "Survey of Nonprofit Resource Acquisition and Development"
Body: [FirstName]
[LastName]
[CustomValue]
Dear [FirstName],
Last week we sent you an email asking you to respond to a survey about how the current
economic situation affects New Jersey nonprofits like yours.
If you have already completed the survey, we really appreciate your participation. If you
have not yet responded, we encourage you to take only about fifteen minutes and complete
the survey.
Please click on the link below to begin the survey.
Survey link: http://www.surveymonkey.com/s.aspx
You are one of a small group of nonprofit representatives who have been selected, so your
response is very important. We are very grateful for your help with this study.
Sincerely,
Marc Holzer
Dean, Board of Governors Professor
School of Public Affairs and Administration
Rutgers, the State University of New Jersey
Weiwei Lin
Research Associate
School of Public Affairs and Administration
Rutgers, the State University of New Jersey

180
[Follow-up Email #2]
To: [Email]
From: [email protected]
Subject: Please complete Rutgers University nonprofit survey.
Body: [FirstName]
[LastName]
[CustomValue]
Dear [FirstName],
We are writing you about our study of New Jersey nonprofits during the current economic
downturn. We are hoping you may be able to give about fifteen minutes to help us collect
important information for the “Rutgers University Survey of Nonprofit Resource
Acquisition and Development.”
The study is drawing to a close, so we wanted to email everyone who has not responded to
make sure you had a chance to participate. We are writing again because of the importance
that your response has for helping get accurate results.
Please click on the link below to begin the survey.
Survey link: http://www.surveymonkey.com/s.aspx
Thank you in advance for completing the survey. Your response is important! Nonprofit
executives are the best source of information to help build a stronger nonprofit sector in the
state of New Jersey.
Sincerely,
Marc Holzer
Dean, Board of Governors Professor
School of Public Affairs and Administration
Rutgers, the State University of New Jersey
Weiwei Lin
Research Associate
School of Public Affairs and Administration
Rutgers, the State University of New Jersey

181
Appendix 4: Notice of Exemption from IRB Review

182
Appendix 5: Descriptive Information of Questionnaire Items
Descriptive Information for Managerial Factors Items
Questionnaire Item N Mean Std. Dev. Min Max
wellmanage 495 5.874747 1.224112 1 7
effective 499 6.278557 1.022125 2 7
mission 497 6.138833 1.101155 1 7
moresuccess 494 5.659919 1.378527 1 7
evaluate 493 5.206897 1.491777 1 7
datadriven 494 4.591093 1.761316 1 7
imp_diverse 494 6.277328 1.462864 1 7
diversifying 490 4.416327 1.871686 1 7
inf_ed 499 4.539078 .8665909 1 5
inf_staff 490 3.285714 1.371638 1 7
inf_chair 492 3.512195 1.238328 1 5
inf_board 496 3.397177 1.153612 1 5
growth 498 2.941767 .9008282 1 4
structure 487 3.468172 .8995388 1 5
leadership 487 3.443532 .9560261 1 5
manage 484 3.576446 .9260118 1 5
procut 494 1.734818 .8332116 1 4
employcut 497 1.503018 .7408657 1 4
employchange 494 1.469636 .6816109 1 4
cut_gov 429 1.806527 .9334662 1 5
cut_donation 396 2.179293 .9550269 1 5
cut_uw 262 2.248092 1.272874 1 5
cut_founda~n 343 2.209913 1.104068 1 5
cut_corp 345 2.257971 1.005856 1 5
cut_fee 305 1.744262 .9033062 1 5
cut_bank 212 2.023585 1.116193 1 5
Descriptive Information for Fund Development Investment Items
Question Item N Mean Std. Dev. Min Max
frstaff 486 1.87037 .9533807 1 5
frconsultant 501 1.211577 .5469421 1 5
percentage 485 2.22268 .8929829 1 5
effort_gov 496 3.564516 1.360285 1 5
effort_don~n 487 3.344969 1.32563 1 5
effort_uw 483 2.256729 1.321829 1 5
effort_fou~n 485 3.171134 1.305421 1 5
effort_corp 486 3.148148 1.301334 1 5

183
effot_fee 473 2.885835 1.582368 1 5
effort_bank 465 2.333333 1.2843 1 5
Descriptive Information for Environmental Factors Items
Question Item N Mean Std. Dev. Min Max
externalfu~g 479 2.820459 1.057509 1 5
externalpr~m 483 3.507246 1.011064 1 5
inf_volunt~r 491 2.181263 1.173576 1 5
inf_donor 486 2.576132 1.245762 1 5
dif_gov 454 3.900881 1.921494 1 7
dif_donation 438 4.59589 1.62607 1 7
dif_uw 317 4.883281 1.878157 1 7
dif_founda~n 419 4.935561 1.550783 1 7
dif_corp 434 5.182028 1.500285 1 7
dif_fee 332 3.506024 1.900062 1 7
dif_bank 310 4.777419 1.811186 1 7
REI 501 8.575381 1.384715 6.909562 17.516
Descriptive Information for Performance Items
Question Item N Mean Std. Dev. Min Max
suc09_gov 459 4.568627 1.944979 1 7
suc09_dona~n 450 3.706667 1.616507 1 7
suc09_uw 356 2.733146 1.756797 1 7
suc09_foun~n 439 3.332574 1.559654 1 7
suc09_corp 440 3.170455 1.497314 1 7
suc09_fee 364 4.126374 2.022046 1 7
suc09_bank 152 2.875 1.885155 1 7
stress 493 6.385396 2.476218 1 10
maintain 496 6.6875 2.615634 1 10
Descriptive Information for Diversification Items
Question Item N Mean Std. Dev. Min Max
gov 475 .4784745 .3752253 0 1
donation 473 .0994757 .1860288 0 1
uw 473 .0186854 .0558965 0 .71
foundation 473 .0657865 .1197326 0 .9
corp 473 .0359218 .0676152 0 .4
fee 473 .2346784 .3270797 0 1
bank 473 .0158911 .0622483 0 .75
fund 472 4.165254 1.87684 1 8
rd 472 .4242183 .2910375 0 .9542857

184
Descriptive Information for All Other Items
Question Item N Mean Std. Dev. Min Max
gov08 497 2.476861 .9692697 1 5
foundation08 494 2.38664 1.273184 1 5
corp08 490 2.818367 1.540745 1 5
suc_gov 440 4.943182 1.964131 1 7
suc_donation 440 3.811364 1.677496 1 7
suc_uw 341 3.108504 1.994835 1 7
suc_founda~n 423 3.527187 1.811912 1 7
suc_corp 418 3.382775 1.677011 1 7
suc_fee 357 4.302521 1.988257 1 7
suc_bank 311 3.109325 1.823045 1 7

185
Appendix 6 Full Data Analysis Results (1) Funding Variety as Dependent Variable Source | SS df MS Number of obs = 396
-------------+------------------------------ F( 24, 371) = 12.03
Model | 574.123328 24 23.9218054 Prob > F = 0.0000
Residual | 737.533237 371 1.98796021 R-squared = 0.4377
-------------+------------------------------ Adj R-squared = 0.4013
Total | 1311.65657 395 3.32064953 Root MSE = 1.41
------------------------------------------------------------------------------
fund | Coef. Std. Err. t P>|t| [95% Conf. Interval]
-------------+----------------------------------------------------------------
exp_shiwan | -.0067922 .0028228 -2.41 0.017 -.0123429 -.0012414
expsqu | .0644548 .0283061 2.28 0.023 .0087944 .1201153
board | .0565538 .0774626 0.73 0.466 -.095767 .2088745
boardmeet | .2989451 .1088151 2.75 0.006 .0849734 .5129167
growth | .319891 .0900022 3.55 0.000 .1429125 .4968694
IntDev | -.2836771 .0848403 -3.34 0.001 -.4505053 -.116849
ManageSucc~s | -.0722142 .0916807 -0.79 0.431 -.2524932 .1080648
imp_diverse | .144897 .0592423 2.45 0.015 .0284041 .2613898
influed | .2061727 .0931205 2.21 0.027 .0230625 .389283
staffdummy | .624718 .1686333 3.70 0.000 .293121 .9563149
consultdummy | -.0664281 .2184122 -0.30 0.761 -.4959091 .363053
percentage | .017518 .0930975 0.19 0.851 -.165547 .200583
ExtRelation | .3268551 .0825855 3.96 0.000 .1644607 .4892495
rei | -.0636436 .0536294 -1.19 0.236 -.1690993 .0418122
HS | -.18068 .2256346 -0.80 0.424 -.6243631 .2630031
Youth | .1615788 .3164288 0.51 0.610 -.4606401 .7837977
Housing | -.3366719 .2830336 -1.19 0.235 -.8932231 .2198793
Community | -.5039564 .2958604 -1.70 0.089 -1.08573 .0778172
Urban | .2300012 .2122116 1.08 0.279 -.1872871 .6472895
Suburban | .1888205 .2027025 0.93 0.352 -.2097694 .5874104
npage | .2301162 .087449 2.63 0.009 .0581584 .402074
employee | .1290398 .071053 1.82 0.070 -.0106773 .2687568
volunteer | .2196367 .0656473 3.35 0.001 .0905492 .3487241
justcut | .4144271 .165272 2.51 0.013 .0894396 .7394145
_cons | -1.801679 .9232998 -1.95 0.052 -3.617237 .0138778
------------------------------------------------------------------------------
. Funding Variety: predict R1, rstudent (105 missing values generated)
list id r1 in 1/10
+------------------+
| id r1 |
|------------------|
1. | 450 -2.493619 |
2. | 508 -2.465974 |
3. | 1083 -2.364105 |
4. | 671 -2.229665 |
5. | 64 -2.218692 |
|------------------|
6. | 938 -2.210676 |
7. | 186 -2.136673 |
8. | 649 -1.853391 |
9. | 808 -1.824774 |
10. | 495 -1.817656 |
+------------------+
. list id r1 in 387/396
+-----------------+
| id r1 |
|-----------------|
387. | 290 2.012207 |
388. | 149 2.039019 |
389. | 1093 2.115507 |
390. | 478 2.155252 |
391. | 387 2.221614 |
|-----------------|
392. | 22 2.406335 |
393. | 635 2.532725 |
394. | 370 2.542666 |
395. | 402 2.767379 |
396. | 548 3.223442 |
+-----------------+
swilk r
Shapiro-Wilk W test for normal data
Variable | Obs W V z Prob>z
-------------+-------------------------------------------------
r | 396 0.99633 1.002 0.005 0.49805

186
. iqr r
mean= 1.7e-09 std.dev.= 1.366 (n= 396)
median= -.0015 pseudo std.dev.= 1.386 (IQR= 1.87)
10 trim= -.025
low high
-------------------
inner fences -3.761 3.719
# mild outliers 0 2
% mild outliers 0.00% 0.51%
outer fences -6.567 6.525
# severe outliers 0 0
% severe outliers 0.00% 0.00%
. vif
Variable | VIF 1/VIF
-------------+----------------------
exp_shiwan | 6.85 0.146075
expsqu | 4.59 0.217698
employee | 2.86 0.349538
HS | 2.53 0.395067
Suburban | 2.04 0.489725
Urban | 1.95 0.513843
Community | 1.89 0.528937
Housing | 1.82 0.549370
board | 1.65 0.606825
ManageSucc~s | 1.64 0.609984
Youth | 1.57 0.638798
npage | 1.55 0.643421
IntDev | 1.42 0.703375
volunteer | 1.41 0.711047
staffdummy | 1.36 0.733136
influed | 1.35 0.739404
ExtRelation | 1.34 0.746372
growth | 1.34 0.747233
percentage | 1.32 0.755125
imp_diverse | 1.20 0.833314
boardmeet | 1.19 0.837345
rei | 1.19 0.840172
consultdummy | 1.17 0.854033
justcut | 1.15 0.870189
-------------+----------------------
Mean VIF | 1.93
. estat imtest
Cameron & Trivedi's decomposition of IM-test
---------------------------------------------------
Source | chi2 df p
---------------------+-----------------------------
Heteroskedasticity | 293.04 307 0.7071
Skewness | 35.36 24 0.0632
Kurtosis | 0.58 1 0.4464
---------------------+-----------------------------
Total | 328.98 332 0.5365
---------------------------------------------------
. estat hettest
Breusch-Pagan / Cook-Weisberg test for heteroskedasticity
Ho: Constant variance
Variables: fitted values of fund
chi2(1) = 0.37
Prob > chi2 = 0.5416

187
(2) Revenue Balance as Dependent Variable Source | SS df MS Number of obs = 396
-------------+------------------------------ F( 24, 371) = 6.64
Model | 11.0345299 24 .459772081 Prob > F = 0.0000
Residual | 25.6732687 371 .069200185 R-squared = 0.3006
-------------+------------------------------ Adj R-squared = 0.2554
Total | 36.7077986 395 .092931136 Root MSE = .26306
------------------------------------------------------------------------------
rd3 | Coef. Std. Err. t P>|t| [95% Conf. Interval]
-------------+----------------------------------------------------------------
exp_shiwan | -.0008617 .0005267 -1.64 0.103 -.0018974 .0001739
expsqu | .0066338 .0052812 1.26 0.210 -.003751 .0170185
board | .0034686 .0144525 0.24 0.810 -.0249504 .0318876
boardmeet | .0484937 .020302 2.39 0.017 .0085722 .0884151
growth | .0360063 .016792 2.14 0.033 .0029869 .0690258
IntDev | -.0413678 .0158289 -2.61 0.009 -.0724935 -.0102421
ManageSucc~s | -.0146212 .0171052 -0.85 0.393 -.0482565 .019014
imp_diverse | .0306313 .011053 2.77 0.006 .0088968 .0523658
influed | .0112524 .0173738 0.65 0.518 -.0229111 .0454159
staffdummy | .0855894 .0314625 2.72 0.007 .0237222 .1474566
consultdummy | .0065138 .0407499 0.16 0.873 -.0736159 .0866436
percentage | .0554539 .0173695 3.19 0.002 .0212989 .089609
ExtRelation | .0471692 .0154083 3.06 0.002 .0168707 .0774677
rei | .0079362 .0100058 0.79 0.428 -.011739 .0276115
HS | -.0202471 .0420974 -0.48 0.631 -.1030266 .0625324
Youth | .0621348 .0590372 1.05 0.293 -.0539547 .1782244
Housing | .0696136 .0528065 1.32 0.188 -.0342241 .1734512
Community | -.0229089 .0551997 -0.42 0.678 -.1314524 .0856346
Urban | .0656379 .039593 1.66 0.098 -.012217 .1434928
Suburban | .0340092 .0378189 0.90 0.369 -.0403571 .1083754
npage | .0378407 .0163157 2.32 0.021 .005758 .0699235
employee | -.0184244 .0132566 -1.39 0.165 -.0444919 .0076431
volunteer | .0077259 .012248 0.63 0.529 -.0163584 .0318102
justcut | .0491009 .0308354 1.59 0.112 -.0115331 .1097349
_cons | -.48444 .1722632 -2.81 0.005 -.8231747 -.1457053
------------------------------------------------------------------------------
. Revenue Balance: predict R2, rstudent(105 missing values generated)
. list id r2 in 1/10
+------------------+
| id r2 |
|------------------|
1. | 83 -2.58701 |
2. | 1083 -2.460635 |
3. | 234 -2.386093 |
4. | 78 -2.359695 |
5. | 1129 -2.312805 |
|------------------|
6. | 471 -2.256738 |
7. | 72 -2.21782 |
8. | 508 -2.105632 |
9. | 606 -2.089553 |
10. | 667 -2.026882 |
+------------------+
. list id r2 in 387/396
+----------------+
| id r2 |
|----------------|
387. | 23 1.855576 |
388. | 53 1.887501 |
389. | 396 1.895829 |
390. | 923 1.914521 |
391. | 402 1.970161 |
|----------------|
392. | 840 2.053524 |
393. | 290 2.064437 |
394. | 240 2.138843 |
395. | 630 2.173023 |
396. | 298 2.365901 |
+----------------+
. swilk r
Shapiro-Wilk W test for normal data
Variable | Obs W V z Prob>z
-------------+-------------------------------------------------
r | 396 0.98811 3.245 2.800 0.00256
Shapiro-Wilk W test for normal data
. iqr r

188
mean= -1.2e-10 std.dev.= .2549 (n= 396)
median= .0073 pseudo std.dev.= .2996 (IQR= .4041)
10 trim= .0023
low high
-------------------
inner fences -.8097 .8068
# mild outliers 0 0
% mild outliers 0.00% 0.00%
outer fences -1.416 1.413
# severe outliers 0 0
% severe outliers 0.00% 0.00%
. vif
Variable | VIF 1/VIF
-------------+----------------------
exp_shiwan | 6.85 0.146075
expsqu | 4.59 0.217698
employee | 2.86 0.349538
HS | 2.53 0.395067
Suburban | 2.04 0.489725
Urban | 1.95 0.513843
Community | 1.89 0.528937
Housing | 1.82 0.549370
board | 1.65 0.606825
ManageSucc~s | 1.64 0.609984
Youth | 1.57 0.638798
npage | 1.55 0.643421
IntDev | 1.42 0.703375
volunteer | 1.41 0.711047
staffdummy | 1.36 0.733136
influed | 1.35 0.739404
ExtRelation | 1.34 0.746372
growth | 1.34 0.747233
percentage | 1.32 0.755125
imp_diverse | 1.20 0.833314
boardmeet | 1.19 0.837345
rei | 1.19 0.840172
consultdummy | 1.17 0.854033
justcut | 1.15 0.870189
-------------+----------------------
Mean VIF | 1.93
. estat imtest
Cameron & Trivedi's decomposition of IM-test
---------------------------------------------------
Source | chi2 df p
---------------------+-----------------------------
Heteroskedasticity | 323.18 307 0.2518
Skewness | 61.92 24 0.0000
Kurtosis | 20.08 1 0.0000
---------------------+-----------------------------
Total | 405.19 332 0.0037
---------------------------------------------------
. estat hettest
Breusch-Pagan / Cook-Weisberg test for heteroskedasticity
Ho: Constant variance
Variables: fitted values of rd3
chi2(1) = 0.73
Prob > chi2 = 0.3939

189
(3) Financial Stress as Dependent Variable Source | SS df MS Number of obs = 400
-------------+------------------------------ F( 22, 377) = 3.24
Model | 362.059391 22 16.457245 Prob > F = 0.0000
Residual | 1913.78061 377 5.07634114 R-squared = 0.1591
-------------+------------------------------ Adj R-squared = 0.1100
Total | 2275.84 399 5.70385965 Root MSE = 2.2531
------------------------------------------------------------------------------
stress | Coef. Std. Err. t P>|t| [95% Conf. Interval]
-------------+----------------------------------------------------------------
fund | -.0633613 .0919414 -0.69 0.491 -.2441435 .117421
rd3 | 1.039082 .502914 2.07 0.039 .0502138 2.02795
exp_shiwan | .0068096 .0072488 0.94 0.348 -.0074434 .0210627
board | -.0650306 .1211268 -0.54 0.592 -.3031994 .1731382
boardmeet | .0390844 .1714434 0.23 0.820 -.2980207 .3761895
justcut | 1.46503 .2584397 5.67 0.000 .9568664 1.973194
staffdummy | .047874 .2718938 0.18 0.860 -.4867442 .5824923
consultdummy | -.4017586 .3413216 -1.18 0.240 -1.072891 .269374
percentage | .0881853 .1482666 0.59 0.552 -.2033479 .3797185
ExtRelation | -.2628383 .1258316 -2.09 0.037 -.510258 -.0154186
rei | -.0367905 .0846135 -0.43 0.664 -.203164 .129583
fund_exp | .0210272 .0806121 0.26 0.794 -.1374784 .1795329
rd3_exp | -.7651468 .5093036 -1.50 0.134 -1.766579 .236285
employee | -.2308347 .1034007 -2.23 0.026 -.4341491 -.0275203
volunteer | -.1277527 .1060049 -1.21 0.229 -.3361877 .0806823
npage | .1091472 .1369112 0.80 0.426 -.160058 .3783524
HS | .3895128 .3542924 1.10 0.272 -.307124 1.08615
Youth | .1441993 .5095177 0.28 0.777 -.8576534 1.146052
Housing | -.3119398 .4475456 -0.70 0.486 -1.191938 .5680586
Community | .0865212 .4632875 0.19 0.852 -.8244301 .9974725
Urban | -.3230992 .3390511 -0.95 0.341 -.9897673 .343569
Suburban | -.6438363 .3240523 -1.99 0.048 -1.281013 -.00666
_cons | 6.373696 1.227663 5.19 0.000 3.959772 8.78762
------------------------------------------------------------------------------
. Funding Variety: predict R1, rstudent(101 missing values generated)
list id r1 in 1/10
+-----------------+
| id r1 |
|-----------------|
1. | 17 -2.886873 |
2. | 840 -2.566617 |
3. | 58 -2.512438 |
4. | 852 -2.488196 |
5. | 278 -2.446256 |
|-----------------|
6. | 389 -2.394686 |
7. | 82 -2.273545 |
8. | 776 -2.244247 |
9. | 414 -2.203973 |
10. | 576 -2.109327 |
+-----------------+
list id r1 in 391/400
+-----------------+
| id r1 |
|-----------------|
391. | 1086 1.66611 |
392. | 1004 1.676469 |
393. | 100 1.676591 |
394. | 818 1.714646 |
395. | 550 1.722615 |
|-----------------|
396. | 746 1.764313 |
397. | 1155 1.993388 |
398. | 375 2.116155 |
399. | 621 2.239176 |
400. | 236 2.39125 |
+-----------------+
swilk r
Shapiro-Wilk W test for normal data
Variable | Obs W V z Prob>z
-------------+-------------------------------------------------
r | 400 0.98558 3.970 3.281 0.00052

190
iqr r
mean= 2.1e-09 std.dev.= 2.19 (n= 400)
median= .2927 pseudo std.dev.= 2.327 (IQR= 3.139)
10 trim= .0777
low high
-------------------
inner fences -6.279 6.278
# mild outliers 0 0
% mild outliers 0.00% 0.00%
outer fences -10.99 10.99
# severe outliers 0 0
% severe outliers 0.00% 0.00%
. vif
Variable | VIF 1/VIF
-------------+----------------------
exp_shiwan | 17.77 0.056259
fund_exp | 15.74 0.063541
rd3_exp | 5.04 0.198472
HS | 2.47 0.405063
employee | 2.41 0.414507
fund | 2.22 0.450250
Suburban | 2.07 0.484190
Urban | 1.97 0.507343
Community | 1.85 0.540594
rd3 | 1.84 0.542403
Housing | 1.81 0.551227
board | 1.62 0.617011
Youth | 1.55 0.645821
npage | 1.52 0.657418
volunteer | 1.45 0.688248
staffdummy | 1.40 0.712394
percentage | 1.32 0.755935
ExtRelation | 1.27 0.788928
boardmeet | 1.18 0.848359
rei | 1.17 0.851317
consultdummy | 1.15 0.866317
justcut | 1.12 0.892293
-------------+----------------------
Mean VIF | 3.18
. estat imtest
Cameron & Trivedi's decomposition of IM-test
---------------------------------------------------
Source | chi2 df p
---------------------+-----------------------------
Heteroskedasticity | 260.56 256 0.4091
Skewness | 40.16 22 0.0104
Kurtosis | 9.25 1 0.0024
---------------------+-----------------------------
Total | 309.97 279 0.0979
---------------------------------------------------
. estat hettest
Breusch-Pagan / Cook-Weisberg test for heteroskedasticity
Ho: Constant variance
Variables: fitted values of stress
chi2(1) = 1.34
Prob > chi2 = 0.2474

191
(4) Likelihood to Maintain Services as Dependent Variable Source | SS df MS Number of obs = 402
-------------+------------------------------ F( 22, 379) = 2.56
Model | 351.948738 22 15.9976699 Prob > F = 0.0002
Residual | 2364.16072 379 6.23789107 R-squared = 0.1296
-------------+------------------------------ Adj R-squared = 0.0791
Total | 2716.10945 401 6.77334028 Root MSE = 2.4976
------------------------------------------------------------------------------
maintain | Coef. Std. Err. t P>|t| [95% Conf. Interval]
-------------+----------------------------------------------------------------
fund | -.1853409 .1014964 -1.83 0.069 -.3849074 .0142256
rd3 | .5739225 .5570908 1.03 0.304 -.5214535 1.669298
exp_shiwan | -.0142619 .0077979 -1.83 0.068 -.0295944 .0010706
board | .0803101 .1339704 0.60 0.549 -.1831084 .3437285
boardmeet | .2671466 .1893467 1.41 0.159 -.1051549 .6394481
justcut | -1.438637 .2853478 -5.04 0.000 -1.9997 -.8775739
staffdummy | .4033277 .3002761 1.34 0.180 -.187088 .9937435
consultdummy | -.1216108 .3781819 -0.32 0.748 -.8652083 .6219867
percentage | -.3874419 .1639449 -2.36 0.019 -.7097974 -.0650864
ExtRelation | .0112528 .1391888 0.08 0.936 -.2624263 .2849319
rei | -.0054587 .0936027 -0.06 0.954 -.1895043 .1785869
fund_exp | .0730547 .0874279 0.84 0.404 -.0988498 .2449592
rd3_exp | .4883641 .5632524 0.87 0.386 -.619127 1.595855
employee | .244159 .1141722 2.14 0.033 .0196686 .4686493
volunteer | .0657693 .117619 0.56 0.576 -.1654982 .2970368
npage | -.0329584 .1520272 -0.22 0.828 -.3318809 .2659641
HS | -.2423555 .3921629 -0.62 0.537 -1.013443 .528732
Youth | -.6015627 .5576748 -1.08 0.281 -1.698087 .4949614
Housing | -.6115197 .4977577 -1.23 0.220 -1.590232 .367193
Community | .611003 .5137374 1.19 0.235 -.3991296 1.621136
Urban | .4157924 .3734347 1.11 0.266 -.3184709 1.150056
Suburban | .1291242 .357056 0.36 0.718 -.5729347 .8311831
_cons | 6.742352 1.356745 4.97 0.000 4.074661 9.410044
------------------------------------------------------------------------------
. Funding Variety: predict R2, rstudent(99 missing values generated)
list id r2 in 1/10
+------------------+
| id r2 |
|------------------|
1. | 1092 -2.778226 |
2. | 530 -2.766037 |
3. | 375 -2.656354 |
4. | 669 -2.648568 |
5. | 173 -2.587676 |
|------------------|
6. | 470 -2.538434 |
7. | 731 -2.453695 |
8. | 631 -2.442769 |
9. | 236 -2.345289 |
10. | 27 -2.185475 |
+------------------+
list id r2 in 393/402
+-----------------+
| id r2 |
|-----------------|
393. | 193 1.559923 |
394. | 605 1.565634 |
395. | 732 1.582836 |
396. | 387 1.613197 |
397. | 580 1.624277 |
|-----------------|
398. | 924 1.717127 |
399. | 424 1.718531 |
400. | 1151 1.750761 |
401. | 379 1.808704 |
402. | 576 1.927258 |
+-----------------+
swilk r
Shapiro-Wilk W test for normal data
Variable | Obs W V z Prob>z
-------------+-------------------------------------------------
r | 402 0.95823 11.551 5.823 0.00000

192
. iqr r
mean= 3.1e-09 std.dev.= 2.428 (n= 402)
median= .5293 pseudo std.dev.= 2.577 (IQR= 3.476)
10 trim= .1854
low high
-------------------
inner fences -6.857 7.046
# mild outliers 0 0
% mild outliers 0.00% 0.00%
outer fences -12.07 12.26
# severe outliers 0 0
% severe outliers 0.00% 0.00%
. vif
Variable | VIF 1/VIF
-------------+----------------------
exp_shiwan | 16.95 0.058999
fund_exp | 15.10 0.066211
rd3_exp | 5.03 0.198778
HS | 2.47 0.404399
employee | 2.41 0.414564
fund | 2.21 0.451748
Suburban | 2.05 0.487832
Urban | 1.96 0.510602
Community | 1.85 0.539845
rd3 | 1.85 0.540324
Housing | 1.80 0.556105
board | 1.62 0.618100
Youth | 1.55 0.644429
npage | 1.53 0.654248
volunteer | 1.44 0.695461
staffdummy | 1.40 0.712527
percentage | 1.33 0.752171
ExtRelation | 1.26 0.795003
boardmeet | 1.17 0.852556
rei | 1.17 0.853676
consultdummy | 1.15 0.866396
justcut | 1.11 0.897440
-------------+----------------------
Mean VIF | 3.11
. estat imtest
Cameron & Trivedi's decomposition of IM-test
---------------------------------------------------
Source | chi2 df p
---------------------+-----------------------------
Heteroskedasticity | 249.07 256 0.6100
Skewness | 77.15 22 0.0000
Kurtosis | 3.23 1 0.0725
---------------------+-----------------------------
Total | 329.45 279 0.0203
---------------------------------------------------
. estat hettest
Breusch-Pagan / Cook-Weisberg test for heteroskedasticity
Ho: Constant variance
Variables: fitted values of maintain
chi2(1) = 0.32
Prob > chi2 = 0.5693

193
(5) Future Funding Success as Dependent Variable
(Original Regression Model Results) Source | SS df MS Number of obs = 398
-------------+------------------------------ F( 22, 375) = 2.36
Model | 70.1547501 22 3.18885228 Prob > F = 0.0006
Residual | 507.651545 375 1.35373745 R-squared = 0.1214
-------------+------------------------------ Adj R-squared = 0.0699
Total | 577.806295 397 1.45543147 Root MSE = 1.1635
------------------------------------------------------------------------------
Suc09 | Coef. Std. Err. t P>|t| [95% Conf. Interval]
-------------+----------------------------------------------------------------
fund | .067217 .0475617 1.41 0.158 -.0263041 .1607381
rd3 | .3734448 .2603048 1.43 0.152 -.1383951 .8852848
exp_shiwan | -.0017437 .0036396 -0.48 0.632 -.0089004 .005413
board | .0029856 .0627563 0.05 0.962 -.1204127 .1263839
boardmeet | .0533322 .0897958 0.59 0.553 -.1232342 .2298985
justcut | -.4525983 .1339464 -3.38 0.001 -.7159784 -.1892181
staffdummy | .1571402 .1406488 1.12 0.265 -.1194189 .4336993
consultdummy | .179691 .176253 1.02 0.309 -.1668771 .5262591
percentage | -.0359435 .0765715 -0.47 0.639 -.1865069 .1146199
ExtRelation | .1591296 .065592 2.43 0.016 .0301554 .2881038
rei | .0023338 .0438831 0.05 0.958 -.0839541 .0886216
fund_exp | .0304071 .0407607 0.75 0.456 -.0497412 .1105553
rd3_exp | -.0137689 .2626065 -0.05 0.958 -.5301348 .502597
employee | .0043378 .0533311 0.08 0.935 -.1005278 .1092034
volunteer | .0008414 .0545237 0.02 0.988 -.1063692 .108052
npage | -.0243791 .0714709 -0.34 0.733 -.1649131 .1161549
HS | .014541 .1826304 0.08 0.937 -.344567 .3736491
Youth | -.0547706 .2600267 -0.21 0.833 -.5660638 .4565226
Housing | .2601254 .2342909 1.11 0.268 -.2005631 .7208139
Community | .122491 .2403811 0.51 0.611 -.3501728 .5951547
Urban | .2195533 .1755772 1.25 0.212 -.125686 .5647925
Suburban | .2410122 .1677169 1.44 0.152 -.0887712 .5707955
_cons | 3.044909 .64141 4.75 0.000 1.783698 4.30612
------------------------------------------------------------------------------
. Funding Variety: predict R3, rstudent (103 missing values generated)
list id r3 in 1/10
+------------------+
| id r3 |
|------------------|
1. | 375 -2.155401 |
2. | 631 -2.090291 |
3. | 419 -2.078884 |
4. | 1156 -2.019528 |
5. | 731 -1.895212 |
|------------------|
6. | 64 -1.888433 |
7. | 277 -1.831233 |
8. | 189 -1.815374 |
9. | 596 -1.787526 |
10. | 68 -1.713186 |
+------------------+
List id r3 in 389/398
+-----------------+
| id r3 |
|-----------------|
389. | 122 2.468071 |
390. | 57 2.531564 |
391. | 399 2.58269 |
392. | 251 2.588998 |
393. | 437 2.624007 |
|-----------------|
394. | 840 2.842599 |
395. | 341 2.851582 |
396. | 734 3.356047 |
397. | 1024 3.59969 |
398. | 418 3.815143 |
+-----------------+

194
(Finalized Regression Model Results) Source | SS df MS Number of obs = 395
-------------+------------------------------ F( 22, 372) = 3.27
Model | 88.1076184 22 4.00489175 Prob > F = 0.0000
Residual | 455.3065 372 1.2239422 R-squared = 0.1621
-------------+------------------------------ Adj R-squared = 0.1126
Total | 543.414118 394 1.37922365 Root MSE = 1.1063
------------------------------------------------------------------------------
Suc09 | Coef. Std. Err. t P>|t| [95% Conf. Interval]
-------------+----------------------------------------------------------------
fund | .096545 .0454882 2.12 0.034 .0070987 .1859914
rd3 | .2836861 .2486476 1.14 0.255 -.205245 .7726172
exp_shiwan | -.0007397 .0034658 -0.21 0.831 -.0075546 .0060752
board | -.0013028 .0597476 -0.02 0.983 -.1187882 .1161827
boardmeet | .0278201 .0857024 0.32 0.746 -.1407017 .196342
justcut | -.4614983 .1278211 -3.61 0.000 -.7128408 -.2101559
staffdummy | .1916462 .1338625 1.43 0.153 -.0715758 .4548682
consultdummy | .1922119 .1676165 1.15 0.252 -.1373827 .5218065
percentage | -.0275056 .072845 -0.38 0.706 -.1707452 .1157341
ExtRelation | .2249646 .063307 3.55 0.000 .1004803 .349449
rei | .014851 .0417789 0.36 0.722 -.0673015 .0970035
fund_exp | .0179393 .0388086 0.46 0.644 -.0583724 .0942511
rd3_exp | .0127519 .2498045 0.05 0.959 -.478454 .5039578
employee | -.0233931 .0509046 -0.46 0.646 -.1234899 .0767037
volunteer | .002621 .0518531 0.05 0.960 -.0993409 .1045829
npage | -.007691 .0684273 -0.11 0.911 -.1422439 .1268619
HS | .1203427 .1752607 0.69 0.493 -.2242832 .4649686
Youth | -.1129057 .2509598 -0.45 0.653 -.6063834 .380572
Housing | .3082189 .2250743 1.37 0.172 -.1343585 .7507962
Community | .2403717 .2297905 1.05 0.296 -.2114796 .6922229
Urban | .1842836 .1672238 1.10 0.271 -.1445388 .513106
Suburban | .2115489 .1597317 1.32 0.186 -.1025413 .5256391
_cons | 2.87869 .610717 4.71 0.000 1.677799 4.07958
------------------------------------------------------------------------------
. swilk r
Shapiro-Wilk W test for normal data
Variable | Obs W V z Prob>z
-------------+-------------------------------------------------
r | 395 0.98216 4.855 3.757 0.00009
. iqr r
mean= 1.9e-09 std.dev.= 1.075 (n= 395)
median= -.0708 pseudo std.dev.= .9591 (IQR= 1.294)
10 trim= -.0557
low high
-------------------
inner fences -2.648 2.527
# mild outliers 0 8
% mild outliers 0.00% 2.03%
outer fences -4.589 4.468
# severe outliers 0 0
% severe outliers 0.00% 0.00%

195
. vif
Variable | VIF 1/VIF
-------------+----------------------
exp_shiwan | 17.05 0.058660
fund_exp | 15.18 0.065860
rd3_exp | 5.05 0.197827
HS | 2.47 0.404883
employee | 2.43 0.410718
fund | 2.12 0.472791
Suburban | 2.05 0.486684
Urban | 1.96 0.510081
Community | 1.85 0.540035
rd3 | 1.81 0.553133
Housing | 1.78 0.562904
board | 1.61 0.622543
Youth | 1.56 0.642580
npage | 1.53 0.653469
volunteer | 1.42 0.706681
staffdummy | 1.38 0.722044
percentage | 1.31 0.765848
ExtRelation | 1.25 0.801436
boardmeet | 1.19 0.840383
rei | 1.17 0.851828
consultdummy | 1.15 0.868027
justcut | 1.11 0.900942
-------------+----------------------
Mean VIF | 3.11
. estat imtest
Cameron & Trivedi's decomposition of IM-test
---------------------------------------------------
Source | chi2 df p
---------------------+-----------------------------
Heteroskedasticity | 258.05 256 0.4524
Skewness | 58.89 22 0.0000
Kurtosis | 2.41 1 0.1203
---------------------+-----------------------------
Total | 319.35 279 0.0485
---------------------------------------------------
. estat hettest
Breusch-Pagan / Cook-Weisberg test for heteroskedasticity
Ho: Constant variance
Variables: fitted values of Suc09
chi2(1) = 3.94
Prob > chi2 = 0.0472

196
Appendix 7 Survey Methods Study Results
(RQ2: do respondents to the web survey have the same demographic profiles as those to the mail survey?)
tabulate age group2, chi2
| group2
Age | 1 2 | Total
-----------+----------------------+----------
2 | 4 4 | 8
3 | 10 22 | 32
4 | 24 26 | 50
5 | 28 40 | 68
6 | 5 6 | 11
-----------+----------------------+----------
Total | 71 98 | 169
Pearson chi2(4) = 2.5398 Pr = 0.638
. ttest tenure, by(group2)
Two-sample t test with equal variances
------------------------------------------------------------------------------
Group | Obs Mean Std. Err. Std. Dev. [95% Conf. Interval]
---------+--------------------------------------------------------------------
1 | 70 10.72857 1.051209 8.795044 8.631467 12.82568
2 | 98 11.13776 .9617878 9.521214 9.228873 13.04664
---------+--------------------------------------------------------------------
combined | 168 10.96726 .7098629 9.200875 9.5658 12.36872
---------+--------------------------------------------------------------------
diff | -.4091837 1.443846 -3.259852 2.441485
------------------------------------------------------------------------------
diff = mean(1) - mean(2) t = -0.2834
Ho: diff = 0 degrees of freedom = 166
Ha: diff < 0 Ha: diff != 0 Ha: diff > 0
Pr(T < t) = 0.3886 Pr(|T| > |t|) = 0.7772 Pr(T > t) = 0.6114
tabulate gender groupttest, chi2
| groupttest
Gender | 1 2 | Total
-----------+----------------------+----------
1 | 35 49 | 84
2 | 35 48 | 83
-----------+----------------------+----------
Total | 70 97 | 167
Pearson chi2(1) = 0.0043 Pr = 0.948

197
(RQ5: do responses generated in the web survey have the same mean values as those generated in the mail survey?) . ttest ManageSuccess, by(groupttest)
Two-sample t test with equal variances
------------------------------------------------------------------------------
Group | Obs Mean Std. Err. Std. Dev. [95% Conf. Interval]
---------+--------------------------------------------------------------------
1 | 68 .1508132 .1007772 .8310297 -.0503388 .3519652
2 | 98 -.0280587 .1124714 1.11341 -.2512833 .1951659
---------+--------------------------------------------------------------------
combined | 166 .0452141 .0782719 1.008463 -.1093294 .1997577
---------+--------------------------------------------------------------------
diff | .1788719 .1590369 -.1351519 .4928957
------------------------------------------------------------------------------
diff = mean(1) - mean(2) t = 1.1247
Ho: diff = 0 degrees of freedom = 164
Ha: diff < 0 Ha: diff != 0 Ha: diff > 0
Pr(T < t) = 0.8688 Pr(|T| > |t|) = 0.2624 Pr(T > t) = 0.1312
. ttest IntDev, by(groupttest)
Two-sample t test with equal variances
------------------------------------------------------------------------------
Group | Obs Mean Std. Err. Std. Dev. [95% Conf. Interval]
---------+--------------------------------------------------------------------
1 | 71 -.0549436 .1166939 .9832801 -.2876822 .177795
2 | 99 -.0418308 .1058285 1.052981 -.2518441 .1681824
---------+--------------------------------------------------------------------
combined | 170 -.0473074 .0783455 1.0215 -.2019692 .1073545
---------+--------------------------------------------------------------------
diff | -.0131128 .1593295 -.3276586 .3014331
------------------------------------------------------------------------------
diff = mean(1) - mean(2) t = -0.0823
Ho: diff = 0 degrees of freedom = 168
Ha: diff < 0 Ha: diff != 0 Ha: diff > 0
Pr(T < t) = 0.4673 Pr(|T| > |t|) = 0.9345 Pr(T > t) = 0.5327
. ttest ExtRelation, by(groupttest)
Two-sample t test with equal variances
------------------------------------------------------------------------------
Group | Obs Mean Std. Err. Std. Dev. [95% Conf. Interval]
---------+--------------------------------------------------------------------
1 | 71 .3629254 .1105883 .9318333 .1423641 .5834868
2 | 99 .2769551 .0924786 .9201501 .0934344 .4604758
---------+--------------------------------------------------------------------
combined | 170 .3128603 .070812 .9232749 .1730704 .4526503
---------+--------------------------------------------------------------------
diff | .0859704 .1438588 -.1980335 .3699742
------------------------------------------------------------------------------
diff = mean(1) - mean(2) t = 0.5976
Ho: diff = 0 degrees of freedom = 168
Ha: diff < 0 Ha: diff != 0 Ha: diff > 0
Pr(T < t) = 0.7245 Pr(|T| > |t|) = 0.5509 Pr(T > t) = 0.2755

198
. ttest fund, by(groupttest)
Two-sample t test with equal variances
------------------------------------------------------------------------------
Group | Obs Mean Std. Err. Std. Dev. [95% Conf. Interval]
---------+--------------------------------------------------------------------
1 | 66 4.833333 .2088746 1.696905 4.416182 5.250485
2 | 94 4.744681 .1656474 1.606011 4.415738 5.073624
---------+--------------------------------------------------------------------
combined | 160 4.78125 .1296075 1.63942 4.525276 5.037224
---------+--------------------------------------------------------------------
diff | .0886525 .2640154 -.4328023 .6101073
------------------------------------------------------------------------------
diff = mean(1) - mean(2) t = 0.3358
Ho: diff = 0 degrees of freedom = 158
Ha: diff < 0 Ha: diff != 0 Ha: diff > 0
Pr(T < t) = 0.6313 Pr(|T| > |t|) = 0.7375 Pr(T > t) = 0.3687
. ttest rd3, by(groupttest)
Two-sample t test with equal variances
------------------------------------------------------------------------------
Group | Obs Mean Std. Err. Std. Dev. [95% Conf. Interval]
---------+--------------------------------------------------------------------
1 | 66 .4665634 .035653 .2896463 .3953594 .5377673
2 | 94 .4881852 .0325358 .3154465 .4235755 .5527949
---------+--------------------------------------------------------------------
combined | 160 .4792662 .0240589 .3043232 .43175 .5267823
---------+--------------------------------------------------------------------
diff | -.0216218 .0489961 -.1183937 .07515
------------------------------------------------------------------------------
diff = mean(1) - mean(2) t = -0.4413
Ho: diff = 0 degrees of freedom = 158
Ha: diff < 0 Ha: diff != 0 Ha: diff > 0
Pr(T < t) = 0.3298 Pr(|T| > |t|) = 0.6596 Pr(T > t) = 0.6702
. ttest suc09, by(groupttest)
Two-sample t test with equal variances
------------------------------------------------------------------------------
Group | Obs Mean Std. Err. Std. Dev. [95% Conf. Interval]
---------+--------------------------------------------------------------------
1 | 71 4.056942 .133278 1.12302 3.791127 4.322756
2 | 99 3.720154 .0960941 .9561241 3.529458 3.910849
---------+--------------------------------------------------------------------
combined | 170 3.860812 .0797143 1.039347 3.703448 4.018176
---------+--------------------------------------------------------------------
diff | .3367877 .1600206 .0208775 .652698
------------------------------------------------------------------------------
diff = mean(1) - mean(2) t = 2.1047
Ho: diff = 0 degrees of freedom = 168
Ha: diff < 0 Ha: diff != 0 Ha: diff > 0
Pr(T < t) = 0.9816 Pr(|T| > |t|) = 0.0368 Pr(T > t) = 0.0184

199
. ttest stress, by(groupttest)
Two-sample t test with equal variances
------------------------------------------------------------------------------
Group | Obs Mean Std. Err. Std. Dev. [95% Conf. Interval]
---------+--------------------------------------------------------------------
1 | 69 6.405797 .2936663 2.439376 5.819795 6.991799
2 | 98 6.44898 .2388355 2.364351 5.974957 6.923002
---------+--------------------------------------------------------------------
combined | 167 6.431138 .1848218 2.388423 6.066233 6.796042
---------+--------------------------------------------------------------------
diff | -.0431825 .3764669 -.7864958 .7001308
------------------------------------------------------------------------------
diff = mean(1) - mean(2) t = -0.1147
Ho: diff = 0 degrees of freedom = 165
Ha: diff < 0 Ha: diff != 0 Ha: diff > 0
Pr(T < t) = 0.4544 Pr(|T| > |t|) = 0.9088 Pr(T > t) = 0.5456
ttest justcut, by(groupttest)
Two-sample t test with equal variances
------------------------------------------------------------------------------
Group | Obs Mean Std. Err. Std. Dev. [95% Conf. Interval]
---------+--------------------------------------------------------------------
1 | 71 .7183099 .0537641 .4530247 .6110807 .8255391
2 | 99 .6868687 .0468476 .4661274 .5939012 .7798362
---------+--------------------------------------------------------------------
combined | 170 .7 .0352506 .4596114 .6304118 .7695882
---------+--------------------------------------------------------------------
diff | .0314412 .0716487 -.1100067 .172889
------------------------------------------------------------------------------
diff = mean(1) - mean(2) t = 0.4388
Ho: diff = 0 degrees of freedom = 168
Ha: diff < 0 Ha: diff != 0 Ha: diff > 0
Pr(T < t) = 0.6693 Pr(|T| > |t|) = 0.6614 Pr(T > t) = 0.3307

200
Appendix 8 A Comparative Study between Web and Mail Surveys
This section is dedicated to a discussion of the results of survey methods
implemented in the current study. Although popularity of web surveys is rising,
traditional paper surveys administered via regular mail are still the most commonly used
survey method in nonprofit research. Web surveys have a number of advantages over
mail surveys: they are cheaper, require less labor work, and can be administered
significantly faster (Dolnicar et al., 2009). However, mail surveys dominate because of
the relatively easy access to mailing lists or sampling frames. Very few empirical studies
have examined different survey methods in nonprofit research despite the fact that survey
is a very common empirical research method in nonprofit study. In order to compare the
different survey methods and their effects on response rate and data quality, this study
uses two survey channels – web survey and mail survey – that have included four groups.
The survey questionnaire was conducted with a group of 1,115 New Jersey
human services and community improvement organizations. Efforts were made to obtain
information about the potential recipients of the survey questionnaire – executive
directors or chief executive directors. Finally, 876 (76%) surveys went out with a
personal name; the rest were generically addressed to “Executive Director/Chief
Executive Directors.” Email addresses were identified for 320 executive directors out of
the 876. The researchers randomly split these 320 into two halves. One half was used as
an experimental group for Web survey, and the other half was merged with other groups
for mail survey. Table 1 provides the summary information of the four groups.

201
Table 1 Summary of Four Groups
Group Have Contact
Person’s Name?
Have Contact Person’s Email
Address? Survey Mode #
1 Web Yes Yes Web 160
2 Mail 1 Yes Yes Mail 160
3 Mail 2 Yes No Mail 528
4 Mail 3 No No Mail 267
Total 1,115
Web survey group (Web group) participants were contacted exclusively by
email messages. For this group, the contact person’s name and personal email address
are available. The contact person’s name and personal email address are also available
for the first mail group (Mail 1 group). This group is comparable to the Web group.
The second mail group (Mail 2 group) has the contact person’s name, but does
not have their email address. The third mail group (Mail 3 group) has neither the contact
person’s name nor their email address; and the surveys were addressed to “Executive
Director/CEO.”
For the purpose of this survey method study, the analyses were primarily
focused on comparing the results from Web survey respondents and the Mail 1 survey
respondents. This study primarily explores five research questions. Does the Web survey
generate the same response rate as the regular mail survey? Do respondents to the Web
survey have the same demographic profiles as those to the mail survey? Does the Web
survey have the same data quality as the regular mail survey? Do scales in the Web
survey have the same levels of internal consistency as those in the regular mail survey?
And, do responses generated in the web survey have the same mean values as those
generated in the mail survey?

202
1. Response Rate
One way to evaluate survey performance is by comparing response rates
(Fricker and Schonlau, 2002). The overall response rate for this dissertation survey study
is 44.9%. Mail 1 group achieved the highest response rate of the four groups, followed
by Mail 2 group. It is interesting to note that Mail 2 group (addressed to a real contact
person whose email address cannot be obtained) achieved a response rate that is slightly
higher than the total average, while Mail 3 group (addressed to “Executive Director/CEO”
instead of a real contact person’s name) only had a 26.2% response rate, lowest of the
four groups.
Table 2 Survey Response Rates
n %
Web 71 44.4
Mail 1 100 62.5
Mail 2 260 49.2
Mail 3 70 26.2
Total 501 44.9
An interesting observation from some previous studies is that if web surveys
generally do not achieve response rates equal to those of mail surveys (Fricker and
Schonlau, 2002). After comparing the two comparable groups – Web group and Mail 1
group, this study shows that, consistent with previous studies in other social sciences
studies (Cole, 2005; Fricker and Schonlau, 2002), mail survey achieved a higher response
rate (62.5%) than web survey (44.4%). Table 9.3 shows that the difference between the
response rates of these two groups is statistically significant (chi-square with one degree
of freedom = 10.56, p = 0.001). This might suggest that higher cost and longer waiting
time associated with conventional regular mail survey is still worthwhile to achieve a

203
more satisfactory response rate in nonprofit survey research, given that detailed personal
contact information is available.
Table 3 Comparison of Response Rates
Web Mail 1 Web + Mail 1
n % n % n % p λ
Responded
71
44
100
62.5
171
53
.001* 10.56
Not-Responded 89 56 60 37.5 149 47
Total 160 100 160 100 320 100
*Significant at α=.01
2. Demographic Profiles of Organizations and Respondents
In addition to the comparison between the two comparable groups, it is very
important to evaluate if these two groups, combined as a sub-sample, are representative
of the entire study sample. Table 4 and 5 show that the two comparable groups are highly
similar in terms of their budgetary size; furthermore, when combined as a single group,
they do not differ from the entire study sample although they tend to have a larger
budgetary size than the average.
Table 4 Comparison of Responding Organizations (Budgetary Size)
Web Mail 1 Total
M SD M SD p t M SD M SD p t
Budget
(in $1,000)
3915
6161
3916
6767
.999 -.001
3915
6505
3656
6426
.603 .520
(N=70) (N=100) (N=170) (N=500)
There is no statistically significant difference between Web group and Mail 1 group
in terms of their service field distribution (chi-square with seven degrees of freedom =
2.13, p = 0.952).

204
Table 5 Comparison of Responding Organizations (Service Field)
Web Mail 1 Web + Mail 1 Total
Variable n % n % p λ n % n % p λ
Service Field
Crime
4
5.6
6
6
.952 2.13
10
5.8
24
4.8
.315 8.21
Employment 1 1.4 2 2 3 1.8 19 3.8
Food 3 4.2 5 5 8 4.7 20 4
Housing 7 9.9 11 11 18 10.5 68 13.6
Public Safety 0 0 1 1 1 .6 8 1.6
Youth 9 12.7 15 15 24 14 42 8.4
HS 40 56.3 47 47 87 50.9 256 51.5
Community 7 9.9 13 13 20 11.7 64 12.8
Total 71 100 100 100 171 100 501 100
Table 6 and Table 7 exhibit the profiles of Web group and Mail 1 group respondents.
Table 9.6 Comparison of Respondents’ Profiles (Gender and Age)
Web Mail 1 Web + Mail 1
Variable n % n % n % p λ
Gender
Male
35
50
48
49
83
50
.948 .0043
Female 35 50 49 51 84 50
Total 70 100 97 100 167 100
Age
25-34
4
5.6
4
4.1
8
4.8
.638 2.54
35-44 10 14.1 22 22.5 32 18.9
45-54 24 33.8 26 26.5 50 29.6
55-64 28 39.4 40 40.8 68 40.2
≥65 5 7 6 6.1 11 6.5
Total 71 100 98 100 169 100
Results from chi-square and t-tests indicate that there is no statistically
significant difference between the two comparable Web group and Mail 1 group
respondents in terms of gender (chi-square with one degree of freedom = .0043, p = .948),
age (chi-square with four degree of freedom = 2.5398, p = .638), and number of years
working with the current organization (t = .2834, p = .7772).

205
Table 9.7 Comparison of Respondents’ Profiles (Tenure with Current Organization)
Web Mail 1 Web + Mail 1
M SD M SD M SD p t
Years 10.7
(N=70)
8.8 11.1
(N=98)
49 11
(N=168)
9.2 .777 .283
3. Data Quality
Survey data quality can refer to different aspects of survey response – item
nonresponse, the honesty of responses, and the completeness of responses (Fricker and
Schonlau, 2002). This study uses response completeness as an indicator of data quality
which is measured as (1) the number of respondents with missing items and (2) the
percentage of missing items (Dolnicar et al., 2009; Fricker and Schonlau, 2002;). Table 8
lists the number of respondents that completed all survey questions – only 21% of Web
survey responses and 19% of Mail 1 survey responses have no missing value for all the
question items. There is no statistical difference between Web survey and Mail 1 survey
in terms of percentage of fully completed responses.
Table 8 Comparison of % of Fully Completed Responses
Web Mail 1 Web + Mail1
n % n % n % p λ
Completed 15 21 20 20 35 20 .857 .032
With missing items 56 79 80 80 136 80
Total 71 100 100 100 171 100
Table 9 exhibits the results from t-test, indicating that the there is no difference
between Web survey and Mail 1 survey in terms of the number of missing items,
although web survey had slightly more missing fields than the mail survey.

206
Table 9 Comparison of # of Missing Items
Web Mail 1 Web + Mail 1
M SD M SD M SD p t
% of missing items 6.01 .76 5.61 .54 5.78 .44 .613 0.51
(N=71) (N=99) (N=170)
These results suggest that using the two survey modes – Web survey and
regular mail survey – generate responses that have equal data quality.
4. Internal Consistency of Scales
A number of scales were developed in this nonprofit revenue diversification
study to measure nonprofit organization’s managerial characteristics that potentially
influence the level of revenue diversification and organizational performance. These
characteristics are the managerial success (5 items, Scale 1), organization’s internal
development (3 items, Scale 2), and external relationships (2 items, Scale 3). Factor
analysis was conducted to examine the dimensionality of each scale.
Table 10 Reliability Coefficients of Scales in Web and Mail Surveys
Data Set Scale 1 Scale 2 Scale 3
Web .7990 .8703 .4135
Mail 1 .8769 .9011 .6488
Web + Mail 1 .8519 .8736 .5952
Cronbach’s alpha was calculated for each scale to demonstrate its internal
consistency. When combining the two groups’ data together, the overall internal
consistency coefficients for Scales 1 to 3 were .8591, .8736, and .5952, respectively.
Table 10 also lists the Cronbach’s alpha of each scale for the Web group and Mail 1 group.
Mail 1 group had higher reliability coefficients on all the three scales.

207
5. Comparing the Mean Values of Responses (scales and single items)
Table 11 presents the mean values of the three scales discussed in previous
section and the five single items that are primary dependent variables for the study.
Comparing the two comparable groups does not show too much difference in responses
to the survey questions.
Table 11 Mean Comparisons between Web and Mail 1 Surveys
N Mean SD t p
Scale 1 1.125 .262
Web 68 .1508 .8312
Mail 1 98 -.0281 1.1134
Scale 2 -.082 .935
Web 71 -.0549 .9833
Mail 1 99 -.0418 1.0530
Scale 3 .598 .551
Web 71 .3629 .9318
Mail 1 99 .2770 .9201
Funding Variety .336 .738
Web 66 4.8333 1.6969
Mail 1 94 4.7447 1.6060
Revenue Balance -.4413 .660
Web 66 .4666 .2896
Mail 94 .4882 .3154
Funding Success 2.105 .037*
Web 71 4.0569 1.1230
Mail 1 99 3.7202 .9561
Financial Stress -.115 .909
Web 69 6.4058 2.4394
Mail 1 98 6.4490 2.3644
Cutbacks .439 .661
Web 71 .7183 .4530
Mail 1 99 .6869 .4661
*Significant at α = .05
Respondents from the two groups showed no difference on mean scores of all
three scales: Managerial Success (t = 1.125, p = .262), Internal Development (t = -.082, p
= .935), External Relationships (t = .598, p = .551). As Table 6.9 indicates, mean scores

208
of Managerial Success and External Relationships from the Web survey were lower than
those from the Mail 1 survey, while the score of Internal Development from the Web
survey was higher than that from the Mail 1 survey.
Similarly, the two groups did not differ significantly on most of the five major
dependent variables except on “Funding Success”. Web survey respondents report a
significantly higher level of funding success than Mail 1 survey respondents.
6. Conclusion
Using two comparable samples, this study found that a regular mail hard copy
questionnaire achieved a significantly higher response rate to a Web survey. The
findings of this research also suggests that, a Web survey application can achieve a
comparable data quality and content to a questionnaire delivered by regular mail despite a
lower response rate. Considering the cost and time advantage of Web survey
administration, Web-based survey can be an alternative for researchers who might not
have sufficient funding resource or need to get the research project completed as quickly
as possible.
In addition to the comparisons presented in previous sections, there are other
issues that researchers must take into account when trying to optimize their survey design.
For example, the cost differential and time differential between the mailed hard copy
questionnaire treatment and the Web survey treatment were found to be substantial and
very complicated. Administering a mail survey is associated with a high cost on postage,
while obtaining more detailed contact information for Web survey such as personal email
addresses can be even more expensive.

209
Since the email information was hand collected for the current study, there was no
monetary cost associated with that, but a lot of time and effort was devoted to that
purpose. The length of time it takes to field and complete a survey usually covers
obtaining relevant contact information, contacting (including follow-ups), and response
time. Fricker et al. (2002) suggest that decreasing the time in one or more of different
parts of the survey processes will decrease the overall time of survey study.
During the first stage of fielding a survey, identifying contact information for Web
survey is either time-consuming (if the information is manually collected) or costly (if it
is purchased). However, preparing mail survey also takes a large amount of time or a
large volume of labor (printing, labeling, and stuffing envelopes, etc.).
During the second stage of survey administration, Web survey obviously requires
much less time for initial as well as follow-up contacts, as electronically transmitted
survey invitations are sent and received instantaneously and survey response time is
therefore tremendously shortened. A three round Web survey can be easily administered
within 3 weeks or a shorter period of time; while a three round regular mail survey
usually takes more than 3 weeks to administer.
Response time is yet another factor to be considered for survey timeliness.
Researchers usually will not start analyzing data until they judge that a large portion of
anticipated responses are in. With Web survey, this happens several days after the last
round of email invitation is sent out. But with mail survey, researchers usually wait
several weeks for all the responses to be in.
Several suggestions are summarized based on what is found in the current study
for future nonprofit survey studies. First, it is highly recommended that researchers try to

210
obtain detailed contact information so that surveys can be addressed to a real contact
person. This will help the survey get more attention from the potential respondents who
are more committed to responding. Second, it is suggested that survey researchers use
mail survey if there is no time pressure or budgetary constraint that prevent them from
investing in this particular survey mode. Respondents might prefer this mode as well
because reading a paper version gives them more time to think through certain survey
questions than when they are reading from computer screen. Third, Web survey is still an
excellent survey mode. If the sample size is large enough, it is very safe to use Web
survey because there will be very little coverage error.
Web surveys are increasingly popular nowadays because they are much cheaper to
conduct and are faster. Previous research found that web surveys yield higher response
rates when combined with other survey modes (Fricker and Schonlau, 2002). Further
research comparing these two methods and even other approach, such as mix modes
methods, is needed to help identify the optimal survey mode for nonprofit research.

211
Curriculum Vitae
Weiwei Lin
1977 Born May 30 in Suzhou, Jiangsu Province, China.
1991 Graduated from Wuxian High School, Suzhou.
1995 Graduated from Nanjing Civil Engineering Institute, Nanjing, China.
1995-2001 Construction Commission of the Municipal Government of Suzhou.
2001 Bachelor of Arts in English Language and Literature, Nanjing Normal University.
2003 Master of Arts in English Linguistics, Nanjing University.
2004-2010 SPAA, Rutgers University, Newark, New Jersey.
2010 Ph.D. in Public Administration, Rutgers University.