nonlinear seismology a reality. the quantitative data · 2015-10-22 · nonlinear seismology a...
TRANSCRIPT
Romanian Reports in Physics, Vol. 65, No. 2, P. 512–523, 2013
NONLINEAR SEISMOLOGY A REALITY. THE QUANTITATIVE DATA*
GHEORGHE MARMUREANU, ALEXANDRU MARMUREANU, CARMEN ORTANZA CIOFLAN
National Institute for Earth Physics (NIEP) P.O.Box MG-2, RO-077125 Bucharest-Măgurele, Romania,
E-mail: [email protected]
Received August 29, 2012
Motto: The nonlinear seismology is the rule, The linear seismology is the exception !
Paraphrasing Tullio Levi-Civita…
Abstract. The central point of the discussion in last 10–15 years was whether soil amplification is function of earthquake magnitude. Laboratory tests made by using Hardin or Drnevich resonant columns consistently show the decreasing of dynamic torsion function (G) and increasing of torsion damping function (D%) with shear strains (γ) induced by deep strong Vrancea earthquakes; G = G(γ), respectively, D%= D% (γ), therefore nonlinear viscoelastic constitutive laws are required. Aki [1] wrote: „Nonlinear amplification at sediments sites appears to be more pervasive than seismologists used to think… Any attempt at seismic zonation must take into account the local site condition and this nonlinear amplification”. The difficulty to seismologists in demonstrating the nonlinear site effects has been due to the effect being overshadowed by the overall patterns of shock generation and propagation. In other words, the seismological detection of the nonlinear site effects requires a simultaneous understanding of the effects of earthquake source, propagation path and local geological site conditions. The authors, in order to make evidence of nonlinear effects, introduced the spectral amplification factor (SAF) as ratio between maximum spectral absolute acceleration (Sa), relative velocity (Sv), relative displacement (Sd) and peak values of acceleration (amax), velocity (vmax) and displacement (dmax), respectively, from processed strong motion record. The evidence for nonlinearity at least for Bucharest and extra-Carpathian area is given by a systematic relative decrease in the variability of peak ground acceleration with the increasing earthquake magnitude. The researches made in this paper show that using real spectral amplification factors, amplifications showing local effects, have values which differ totally from those of crustal earthquake from USA, Europe, Asia etc.
Key words: seismic hazard, nonlinear seismology, nonlinear behavior of soils, spectral amplification factors, seismic risk.
* The scientific paper was presented by authors on April 24, 2012, Session NH4.2, European
Geophysical Union (EGU) General Assembly, Vienna, April 22–28, 2012.

2 Nonlinear seismology a reality. The quantitative data 513
1. INTRODUCTION
Most cities and villages are located on alluvial deposits/sediments, on Quaternary layers in river valleys [8]. The central question of the discussion is whether soil amplification is amplitude dependent. The dependence of soil response on strain amplitude become a standard assumption in the geotechnical field and engineering seismology.
From the geological point of view, Bucharest City is located in the central
part of the Moesia Platform in the Romanian Plain [8], at about 140 km far from Vrancea area. Above a Cretaceous and a Miocene deposit (with the bottom at roundly 1,400 m of depth), a Pliocene shallow water deposit (~ 700m thick) was settled (Fig. 1). The surface geology consists mainly of Quaternary alluvial deposits.
Fig. 1 – Geological cross-section in the eastern part of the Romanian Plain (NE - SW)
(Vrancea-Ploiesti-Bucharest- Giurgiu-Danube river).
On the other part, in 1996, it was the question: Nonlinear Soil Response – A Reality? [2]. The difficulty to seismologists in demonstrating the nonlinear site

Gh. Marmureanu, Al. Marmureanu, Carmen Ortanza Cioflan 3 514
effects has been due to the effect being overshadowed by the overall patterns of shock generation and propagation.
Laboratory tests developed in Engineering Seismology Laboratory from NIEP by using resonant columns Hardin and Drnevich consistently show the decreasing of dynamic torsion function (G,daN/cm2) and increasing of torsion damping function (D%) with shear strains (γ) induced by deep strong Vrancea earthquakes; G = G(γ), respectively, D% = D(γ)% reduction in shear modulus (G) and increase in damping ratio (D) with increasing shear strain (γ), i.e., G = G(γ), respectively, D% = D(γ)% (Fig. 1).
Fig. 2 – Normalized curves for sand with gravel from NIEP resonant columns [7].
For smaller earthquakes, the strains are smaller and we are in the left-hand side of Fig. 2: for strong earthquakes, the strains are larger and we are in the right-hand side of Fig. 2. Consequently the responses of a system of nonlinear viscoelastic materials (clays, marls, gravel, sands etc.) subjected, for example to vertically traveling shear waves are far away from being linear and generating large discrepancies. In this case, in the wave equation:
2 3 2
2 1 2 1 2 12 2 2
1 1
( , ) ( , ) ( , ),
u x t u x t u x tG
x t x t∂ ∂ ∂
+ η = ρ∂ ∂ ∂ ∂
(1)
where G(daN/cm2) is the dynamic torsion modulus function and D(%) is the torsion damping function; both of them are functions of shear strains (γ), frequency (ω), confining pressure (σ), depth (h), temperature (t), void ratio (v) etc., that is: G = G(γ,ω, σ, h, t, v,…) and D = D(γ,ω,σ,h, t, v,…).
In main ground motion equation, ground displacement u(t) has general form:

4 Nonlinear seismology a reality. The quantitative data 515
u(t) = s(t)*g(t)*i(t),
where: s(t) = source function, g(t) = propagation function and, i(t) = instrument recording function.
Modern seismology strives to describe mathematically each of the filters contributing to the observed displacements and seismological research efforts classically bifurcate in two major categories: (i) – studying the source terms and their associated phenomena, and, (ii) – studying propagation terms and the associated Earth structure.
The nature of elasticity allows us to treat mathematically the process of excitation, propagation, and recording of seismic waves as a sequence of linear filters that combine to produce observed seismograms. On the other hand, the difficulty to seismologists in demonstrating the nonlinear site effects has been due to the effect being overshadowed by the overall patterns of shock generation and propagation. In other words, the seismological detection of the nonlinear site effects requires a simultaneous understanding of the effects of earthquake source, propagation path and local geological site conditions.
Fig. 3 – The ways of seismic waves from source to free field.
Let’s see the actual data from records made during of last strong and deep Vrancea earthquakes, that are: March 4, 1977 (MW = 7.4; h = 109 km); August 30,1086 (MW = 7.1; h = 131 km), May 30, 1990 (MW = 6.9; h = 79 km) and May 31, 1990 (MW = 6.4, h = 90 km).

Gh. Marmureanu, Al. Marmureanu, Carmen Ortanza Cioflan 5 516
2. RECORDED DATA ON SEISMIC STATIONS FROM EXTRA-CARPATHIAN AREA
In order to find the quantitative characteristics of the nonlinear soil behavior and nonlinear site response, the authors [4–7] introduced so-called „the spectral (seismic) amplification factor” (SAF) as ratio between maximum spectral absolute acceleration (Sa), relative velocity (Sv), relative displacement (Sd) and peak values of acceleration (amax), velocity (vmax) and displacement (dmax), respectively, from processed strong motion record). The theoretical support to spectral amplification factor approach is given in [7].
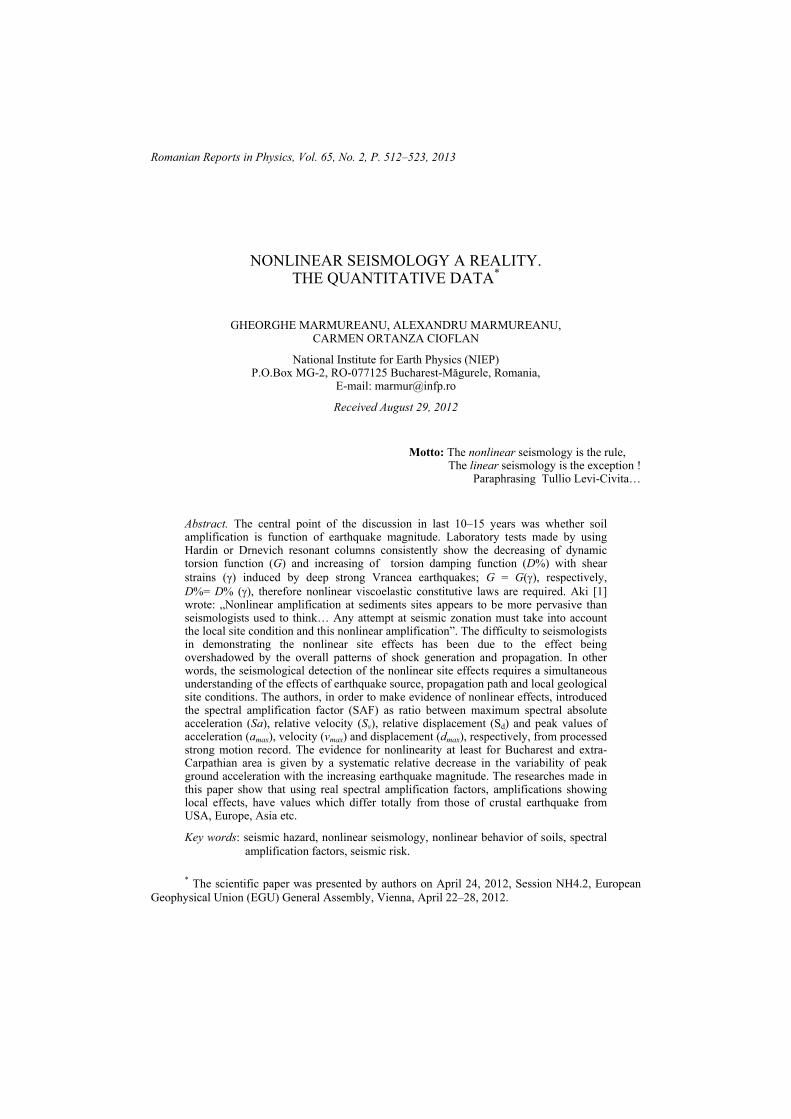
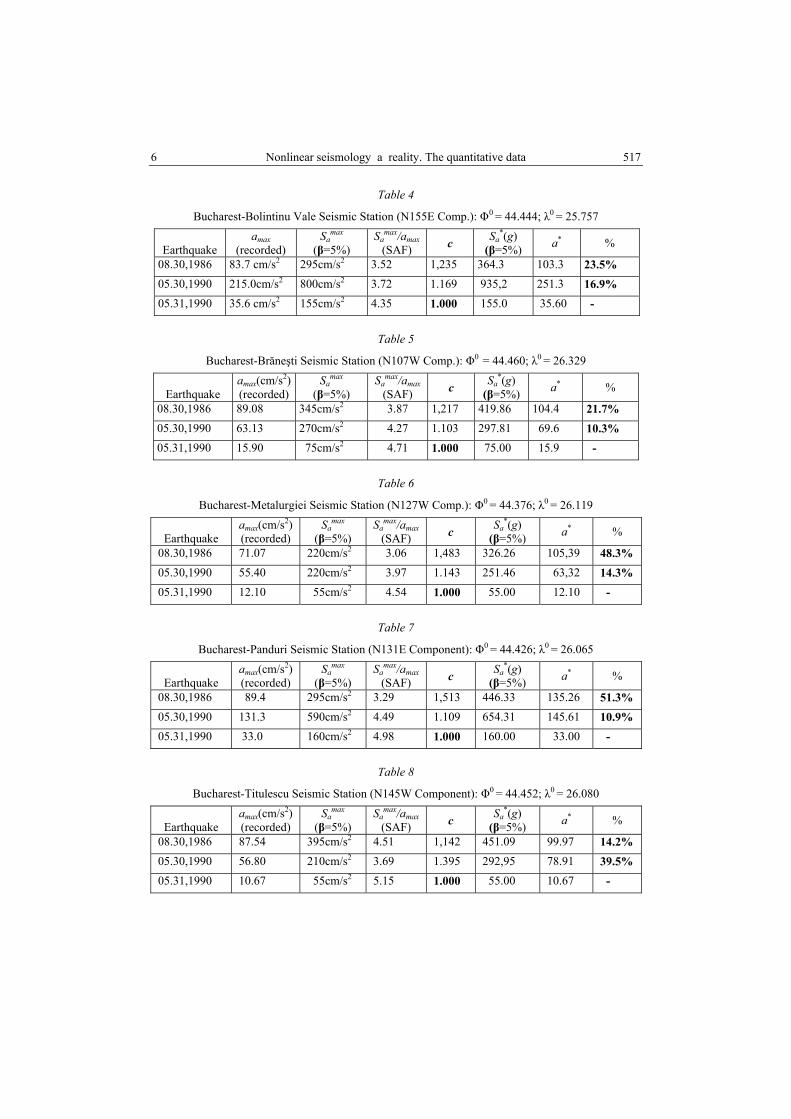
The concept was used by us for last STRESS TEST asked by IAEA Vienna for Romanian Cernavoda Nuclear Power Plant after strong Japan earthquake on March 11, 2011 (MW = 9,0). In Tables 1–19 are given the nonlinear effects function of Vrancea earthquake magnitude and site of seismic stations locations from Bucharest and other cities from extra-Carpathian area, that is, from Iasi to Craiova, records obtained by NIEP and INCERC Bucharest [3, 5]. In Tables 1–19 are given spectral amplification factors (SAF) for absolute accelerations at 5% fraction of critical damping (β = 5%) at 18 seismic stations for last four Vrancea strong earthquakes: March, 4, 1977 (MW = 7.4); August, 30, 1986 (MW = 7.1); May, 30, 1990 (MW = 6.9) and May, 31, 1990 (MW = 6.4).
Table 1
Bucharest-INCERC Seismic Station (E-W Comp.): Φ0 = 44.442; λ0 = 26.105
Earthquake
amax(cm/s2) (recorded)
Samax
(β=5%) Sa
max/amax (SAF) c Sa
*(g) (β=5%) a* %
04.03,1977 188,4 440cm/s2 2.33 1,214 1025.2 228.7 21.4% 08.30,1986 109.1 249cm/s2 2.28 1.241 309.0 135.4 24.1% 05.30,1990 98,9 280cm/s2 2.83 1.000 280.0 98.9 -
Ţable 2
Bucharest-INCERC Seismic Station (N-S Comp.): Φ0 = 44.442; λ0 = 26.105
Earthquake
amax(cm/s2) (recorded)
Samax
(β=5%) Sa
max/amax (SAF) c Sa
*(g) ( β=5%) a* %
04.03,1977 206,9 650cm/s2 3.14 1,322 859.3 273.5 32.2% 08.30,1986 96.96 255cm/s2 2.62 1.583 403.6 153.4 58.3% 05.30,1990 66,21 275cm/s2 4.15 1.000 275.0 66.2 -
Table 3
Bucharest-Balta Albă Seismic Station (E-W Comp.): Φ0 = 44.413; λ0 = 26.169
Earthquake
amax(cm/s2) (recorded)
Samax
(β=5%) Sa
max/amax (SAF) c Sa
*(g) (β=5%) a* %
08.30,1986 89.08 345cm/s2 3.87 1,217 419.86 104.41 21.7% 05.30,1990 63.13 270cm/s2 4.27 1.103 297.81 69.63 10.3% 05.31,1990 15.90 75cm/s2 4.71 1.000 75.00 15.90 -
6 Nonlinear seismology a reality. The quantitative data 517
Table 4
Bucharest-Bolintinu Vale Seismic Station (N155E Comp.): Φ0 = 44.444; λ0 = 25.757
Earthquake
amax (recorded)
Samax
(β=5%) Sa
max/amax (SAF) c Sa
*(g) (β=5%) a* %
08.30,1986 83.7 cm/s2 295cm/s2 3.52 1,235 364.3 103.3 23.5% 05.30,1990 215.0cm/s2 800cm/s2 3.72 1.169 935,2 251.3 16.9% 05.31,1990 35.6 cm/s2 155cm/s2 4.35 1.000 155.0 35.60 -
Table 5
Bucharest-Brăneşti Seismic Station (N107W Comp.): Φ0 = 44.460; λ0 = 26.329
Earthquake
amax(cm/s2) (recorded)
Samax
(β=5%) Sa
max/amax (SAF) c Sa
*(g) (β=5%) a* %
08.30,1986 89.08 345cm/s2 3.87 1,217 419.86 104.4 21.7% 05.30,1990 63.13 270cm/s2 4.27 1.103 297.81 69.6 10.3% 05.31,1990 15.90 75cm/s2 4.71 1.000 75.00 15.9 -
Table 6
Bucharest-Metalurgiei Seismic Station (N127W Comp.): Φ0 = 44.376; λ0 = 26.119
Earthquake
amax(cm/s2) (recorded)
Samax
(β=5%) Sa
max/amax (SAF) c Sa
*(g) (β=5%) a* %
08.30,1986 71.07 220cm/s2 3.06 1,483 326.26 105,39 48.3% 05.30,1990 55.40 220cm/s2 3.97 1.143 251.46 63,32 14.3% 05.31,1990 12.10 55cm/s2 4.54 1.000 55.00 12.10 -
Table 7
Bucharest-Panduri Seismic Station (N131E Component): Φ0 = 44.426; λ0 = 26.065
Earthquake
amax(cm/s2) (recorded)
Samax
(β=5%) Sa
max/amax (SAF) c Sa
*(g) (β=5%) a* %
08.30,1986 89.4 295cm/s2 3.29 1,513 446.33 135.26 51.3% 05.30,1990 131.3 590cm/s2 4.49 1.109 654.31 145.61 10.9% 05.31,1990 33.0 160cm/s2 4.98 1.000 160.00 33.00 -
Table 8
Bucharest-Titulescu Seismic Station (N145W Component): Φ0 = 44.452; λ0 = 26.080
Earthquake
amax(cm/s2) (recorded)
Samax
(β=5%) Sa
max/amax (SAF) c Sa
*(g) (β=5%) a* %
08.30,1986 87.54 395cm/s2 4.51 1,142 451.09 99.97 14.2% 05.30,1990 56.80 210cm/s2 3.69 1.395 292,95 78.91 39.5% 05.31,1990 10.67 55cm/s2 5.15 1.000 55.00 10.67 -

Gh. Marmureanu, Al. Marmureanu, Carmen Ortanza Cioflan 7 518
Table 9
Bucharest-Carlton Seismic Station (N75E Comp.): Φ0 = 44.436; λ0 = 26.102
Earthquake
amax(cm/s2) (recorded)
Samax
(β=5%) Sa
max/amax
(SAF) c Sa*(g)
( β=5%) a* %
08.30,1986 79.60 240cm/s2 3.015 1,276 306.24 101.64 27.6% 05.30,1990 114.7 305cm/s2 2.659 1.447 210.78 165.97 44.7% 05.31,1990 19.48 75cm/s2 3.850 1.000 75.00 19.48 -
Table 10
Galaţi-IPJ (GLT2) Seismic Station (N97WE Comp.): Φ0 = 45.430; λ0 = 28.058
Earthquake
amax(cm/s2) (recorded)
Samax
(β=5%) Sa
max/amax
(SAF) c Sa*(g)
(β=5%) a* %
08.30,1986 69.10 220cm/s2 3.183 1,334 293.48 92.17 33.4% 05.30,1990 74.23 250cm/s2 3.368 1.260 315.00 93.53 26.0% 05.31,1990 47.11 200cm/s2 4.245 1.000 200.00 47.11 -
Table 11
Iaşi-Centru (IAS2) Seismic Station (N-S Comp.): Φ0 = 47.160; λ0 = 27.570
Earthquake
amax(cm/s2) (recorded)
Samax
(β=5%) Sa
max/amax
(SAF) c Sa*(g)
(β=5%) a* %
08.30,1986 64.10 190cm/s2 2.964 1.363 563.16 87.36 36.3% 05.30,1990 109.5 390cm/s2 3.561 1.135 442.65 124.28 13.5% 05.31,1990 45.76 185cm/s2 4.042 1.000 185.00 45.76 -
Table 12
Iaşi-Copou (IAS2) Seismic Station (N-S Comp.): Φ0 = 47.193; λ0 = 27.562
Earthquake
amax(cm/s2) (recorded)
Samax
(β=5%) Sa
max/amax
(SAF) c Sa*(g)
(β=5%) a* %
08.30,1986 68.18 225cm/s2 3.300 1.293 290.92 88.15 29.3% 05.30,1990 97.22 395cm/s2 4.063 1.050 414.75 102,08 13.5% 05.31,1990 49.44 211cm/s2 4.267 1.000 211.00 49.44 -
Table 13
Bucharest-Măgurele Seismic Station (E-W Comp.): Φ0 = 47.347; λ0 = 26.030
Earthquake
amax(cm/s2) (recorded)
Samax
(β=5%) Sa
max/amax (SAF) c Sa
*(g) (β=5%) a* %
08.30,1986 113.8 307cm/s2 2.6982 1.329 408.6 151.46 32.9% 05.30,1990 90.25 324cm/s2 3.5869 1.000 324.0 90.25 -
8 Nonlinear seismology a reality. The quantitative data 519
Table 14
Ploieşti-(PLS) Seismic Station (N100E Comp.): Φ0 = 44.930; λ0 = 26.020
Earthquake
amax(cm/s2) (recorded)
Samax
(β=5%) Sa
max/amax (SAF) c Sa
*(g) (β=5%) a* %
08.30,1986 207.2 730cm/s2 3.523 1.124 820.5 232.89 12.4% 05.30,1990 72.6 235cm/s2 3.236 1.224 287.6 88.86 22.4% 05.31,1990 16.4 65cm/s2 3.963 1.000 65.00 16.40 -
Table 15
Vaslui-(VLS1) Seismic Station (N100E Comp.): Φ0 = 46.637; λ0 = 27.733
Earthquake
amax(cm/s2) (recorded)
Samax
(β=5%) Sa
max/amax (SAF) c Sa
*(g) (β=5%) a* %
08.30,1986 171.3 550cm/s2 3.210 1.275 701.25 218.40 27.5% 05.30,1990 130.0 440cm/s2 3.236 1.209 531.91 157.17 20.9% 05.31,1990 51.3 210cm/s2 4.094 1.000 210.00 51.30 –
Table 16
Bacău-(BAC2) Seismic Station (E-W Comp.): Φ0 = 46.567; λ0 = 26.900
Earthquake
amax(cm/s2) (recorded)
Samax
(β=5%) Sa
max/amax (SAF) c Sa
*(g) (β=5%) a* %
08.30,1986 72.20 292cm/s2 4.0443 1.457 425.44 105.19 45.7% 05.30,1990 132.43 684cm/s2 5.1649 1.141 780.44 151.10 24.1% 05.31,1990 63.07 372cm/s2 5.8942 1.000 372.00 63.07 -
Table 17
Cernavoda -(CVD2) Seismic Station (E-W Comp.): Φ0 = 44.340; λ0 = 28.030
Earthquake
amax(cm/s2) (recorded)
Samax
(β=5%) Sa
max/amax (SAF) c Sa
*(g) ( β=5%) a* %
08.30,1986 62.78 256cm/s2 4.0777 1.420 363.52 89.14 42.0% 05.30,1990 100.06 475cm/s2 4.7471 1.219 579.02 121.97 21.9% 05.31,1990 49.73 288cm/s2 5.7912 1.000 288.00 49.73 -
Table 18
Craiova-(CRV) Seismic Station (N05E Comp.): Φ0 = 47.321; λ0 = 23.798
Earthquake
amax(cm/s2) (recorded)
Samax
(β=5%) Sa
max/amax (SAF) c Sa
*(g) ( β=5%) a* %
08.30,1986 140.7 690cm/s2 4.9040 1.1435 789.01 160.89 14.4% 05.30,1990 62.41 350cm/s2 5.6080 1.000 350.00 62.41 -

Gh. Marmureanu, Al. Marmureanu, Carmen Ortanza Cioflan 9 520
Table 19
Râmnicu Sărat -(RMS2) Seismic Station (N55E Comp.): Φ0 = 45.380; λ0 = 27.040
Earthquake
amax(cm/s2) (recorded)
Samax
(β=5%) Sa
max/amax (SAF) c Sa
*(g) (β=5%) a* %
08.30,1986 140.3 400cm/s2 2.8510 1.215 486.0 170.46 21.5% 05.31,1990 66.4 230cm/s2 3.4638 1.000 230.0 66.40 -
At the same seismic station, for example at Bucharest-Panduri Seismic
Station (Table 7), horizontal components and β=5% damping, the values of the SAF for accelerations are: 3.29 for August 30, 1986 Vrancea earthquake (MW = 7.1); 4.49 for May 30, 1990 (MW = 6.9) and 4.98 for May 31, 1990 (MW = 6.4). Vrancea earthquake on May 31, 1990 (MW = 6.4) could be assumed that the response is still in elastic domain and then we have the possibility to compare to it.
A characteristic of the nonlinearity is a systematic decrease in the variability of peak ground acceleration with the increasing earthquake magnitude. Spectral amplification factor decrease from 4.98 for Vrancea earthquake with magnitude MW = 6.4 to 3.29 for Vrancea strong earthquake with magnitude MW = 7.1 (Table 7, damping β=5%). The amplification factors decrease as the magnitude of earthquake increase. The ground accelerations tends to decrease as Vrancea earthquake magnitude increase. For example, if we maintain the same amplification factor (SAF=4.98) as for relatively strong earthquake on May 31, 1990 with magnitude MW = 6,4 then at Bucharest-Panduri Seismic Station for earthquake on May 30, 1990 (MW = 6.9) the peak acceleration has to be a*max=145.61 cm/s2 (+10.9%) and the recorded value was only, amax=131.3 cm/s2. Also, for Vrancea earthquake on August 30, 1986 (MW = 7.1), the peak acceleration has to be a*max=135.26 cm/s2( that is, +51.3%) instead of real value of 89.4 cm/s2 recorded at Panduri-Bucharest Seismic Station during of last strong earthquake on August 30,1986 earthquake with magnitude MW = 7.1 (Table 7). In fact, the recorded acceleration from strong Vrancea on August 30, 1986 with magnitude MW = 7.1 is smaller with 51.3% that has to be if the soil would have a linear response.
3. SPECTRAL AMPLIFICATION FACTORS AS COMPARED TO REGULATORY GUIDE 1.60-USA & IAEA Safety Series No. 5-SG-S1
The recorded ground accelerations and the response spectra of past earthquakes provide a basis for the rational design for example of NPP structures to resist to large earthquakes. A calculated response spectrum is not the same as a specified standard/design spectrum (Fig. 4).
Design response spectra are a relatively smooth relation obtained by analyzing, evaluating and statistically combining a number of individual response spectra derived from the of significant past earthquakes or from a ground

10 Nonlinear seismology a reality. The quantitative data 521
acceleration process generation. This standard/design response spectrum is scaled up to the value of ground acceleration, velocity and displacement specific to each site by using so called spectral amplification factors (Table 20) [9]. These idealized spectrum curves to be used as design spectrum curves (Housner, 1959, U.S., Atomic Energy Commission, 1963) are given in Fig. 8, curves accepted by IAEA Vienna (Safety Series No.5-SG-S1).
Fig. 4 – Design spectra for irradiator nuclear installation from “Horia Hulubei” National Institute
of Physics and Nuclear Engineering (IFIN-HH) from Măgurele-Bucharest for SDE level with amax = 0.2g [7].
Values of spectrum amplification factors for control points: A, B, C, D (Fig. 4) [9] are given in Table 20, values given by Regulatory Guide 1.69 of the U. S. Atomic Energy Commission and accepted by IAEA Vienna.
Table 20
Spectral amplification factors (SAF) given by RG 1.60 from USA and IAEA Vienna
Amplification factors for control points (Fig. 20) Acceleration Displacement
Percent of critical damping β(%)
A(33 Hz) B(9 Hz) C(2.5 Hz) D(0.25 Hz) 0.5% 1.0 4.96 5.95 3.20 2.0% 1.0 3.54 4.25 2.50
5.0% 1.0 2.61 3.13 2.05 7.0% 1.0 2.27 2.72 1.88
10.0% 1.0 1.90 2.28 1.70

Gh. Marmureanu, Al. Marmureanu, Carmen Ortanza Cioflan 11 522
4. CONCLUSIONS
1. The significance of nonlinear-elastic soil response to strong earthquakes has long been a contentious matter. On the one hand, soil samples behave nonlinearly in laboratory tests made on Hardin and Drnevich resonant columns at strains larger than 10-5 or 10-4, a result that is standard in geotechnical research field. On the other hand, it is also routine in seismology to assume that soil amplification factors measured from weak motions apply to strong motions, i.e., effects of nonlinearity are complete neglected;
2. The central question of the discussion is whether soil amplification is function of earthquake amplitude dependent. The dependence of soil response on strain amplitude become a standard assumption in the geotechnical field and in earthquake and engineering seismology;
3. With a view to understand the characteristics of nonlinear soil behavior and the nonlinearity in the seismology, this study examines the ways that nonlinearity would expected to appear on strong motion records made on Romania territory during to last Vrancea earthquakes. In order to find the quantitative characteristics of the nonlinear soil behavior and nonlinear site response, authors introduced so-called „the spectral (seismic) amplification factors which are defined as the ratio between maximum spectral values of absolute acceleration (Sa), relative velocity (Sv) and displacement (Sd ) from response spectra for a fraction of critical damping (β%) and peak values of ( )y t , ( )x t , respectively, x(t) from processed strong motion records for the same seismic station processing;
4. From Tables 1–19 we can see that there is a strong nonlinear dependence of the spectral amplification factors (SAF) for absolute accelerations on earthquake magnitude for all records made on extra-Carpathian area from Iasi to Craiova for last strong Vrancea earthquakes;
5. The amplification factors decrease as the strength increase. This is consistent with data from Tables 1 to 19, which confirm that the ground accelerations tends to decrease as earthquake magnitude increase. As the excitation level increases, the response spectrum is larger for the linear case than that for the nonlinear one. This is consistent with the one degree of freedom oscillator theory [7], since the peaks of the displacement seismograms in the linear and nonlinear cases are controlled by frequencies that are not amplified due to the nonlinearity;
6. The amplification factors decrease with increasing the magnitudes of deep strong Vrancea earthquakes and this values are far of that given by Regulatory Guide 1.60 of the U. S. Atomic Energy Commission;
7. The new research direction developed by NIEP and other scientists from World has and will have a large scientific impact in this XXI Century and “it will open up a new challenge for seismologists studying nonlinear site effects in 2-D and 3-D irregular geological structures, leading them to a fascinating research subject in nonlinear physics” [1].

12 Nonlinear seismology a reality. The quantitative data 523
Acknowledgements. This work is performed in the frame of the National Plan for Research, Development and Innovation, NII, Partnership Program; Project “Bridging the gap between seismology and earthquake engineering. From the seismicity of Romania towards refined implementation of seismic action of European Norm EN 1998-1 in earthquake resistant design of buildings (BIGSEES), Contract nr.72/2012-2015.
This work was supported partially by CNCSIS-UEFISCDI PNII-Human resources, project code PD.187, contract No. 128/29.07.2010-2012.
REFERENCES
1. A. Aki, Local Site Effects on Weak and Strong Ground Motion, Tectonophysics, 218, 93–111 (1993). 2. I.A.Beresnev, Kuo-Liang Wen, Nonlinear soil response –A reality? Bulletin of the Seismological
Society of America, 86, 6, pp. 1964–1978. 3. I.S.Borcia, Procesarea înregistrărilor mişcărilor seismice vrâncene puternice, Edit. Soc.
Academice “Matei-Teiu Botez”, 2008. 4. C.O. Cioflan, A. Mărmureanu, Gh. Marmureanu, The quantitative evidence of the soil nonlinear
behavior during of strong Vrancea earthquakes in real/nonlinear seismology, Romanian Reports in Physics, 63, 3, pp. 839–851 (2011).
5. Gh. Marmureanu, E. Cojocaru, C. Moldoveanu, The strong Vrancea earthquakes and the dynamic (spectral) amplification factors, in Revue Roumaine des Sciences Techniques, série Mécanique Appliquée, Romanian Academy Publishing House, 40, 2–3, 293–315 (1995).
6. Gh. Mărmureanu, M. Mişicu, C.O. Cioflan, F.S. Bălan, Nonlinear Seismology - The Seismology of the XXI Century, Lecture Notes of Earth Sciences, Perspective in Modern Seismology, Vol. 105, Springer Verlag, 2005, pp. 47–67.
7. Gh. Marmureanu, C.O. Cioflan, A. Marmureanu, Researches on local seismic Hazard (microzonation) of Bucharest metropolitan area. Microzoning maps for accelations, fundamental periods and intensities for maximum Vrancea earthquake magnitude of 7.5 on Richter scale (in Romanian), Tehnopress, Iasi, 2010.
8. Trendafiloski, G., Wyss, M., Rosset, Ph., Mărmureanu, Gh., Constructing city models to estimate losses due to earthquakes worldwide: Application to Bucharest Romania, Earthquake Spectra, 25, 3, 665–685 (2009).
9. *** U.S. Atomic Commission, Regulatory Guide 1.60: Design Response Spectra for Seismic Design of Nuclear Power Plants, 1973.