nonlinear numerical method for earthquake site response analysis i
TRANSCRIPT

HAL Id: hal-00179375https://hal.archives-ouvertes.fr/hal-00179375
Submitted on 18 Mar 2008
HAL is a multi-disciplinary open accessarchive for the deposit and dissemination of sci-entific research documents, whether they are pub-lished or not. The documents may come fromteaching and research institutions in France orabroad, or from public or private research centers.
L’archive ouverte pluridisciplinaire HAL, estdestinée au dépôt et à la diffusion de documentsscientifiques de niveau recherche, publiés ou non,émanant des établissements d’enseignement et derecherche français ou étrangers, des laboratoirespublics ou privés.
Nonlinear numerical method for earthquake siteresponse analysis I - elastoplastic cyclic model and
parameter identification strategyFernando Lopez-Caballero, Arézou Modaressi-Farahmand-Razavi, Hormoz
Modaressi
To cite this version:Fernando Lopez-Caballero, Arézou Modaressi-Farahmand-Razavi, Hormoz Modaressi. Nonlinear nu-merical method for earthquake site response analysis I - elastoplastic cyclic model and parameteridentification strategy. Bulletin of Earthquake Engineering, Springer Verlag, 2007, 5 (3), pp.303-323.<10.1007/s10518-007-9032-7>. <hal-00179375>

Nonlinear numerical method for earthquake site response
analysis I- elastoplastic cyclic model & parameter
identification strategy
Fernando Lopez-Caballero and Arezou ModaressiLaboratoire MSS-Mat CNRS UMR 8579,Ecole Centrale Paris, Grande Voie desVignes, 92295 Chatenay-Malabry Cedex, France
Hormoz ModaressiDevelopment Planning and Natural Risks Department, BRGM, BP 6009,45060Orleans Cedex 2, France
Abstract. This paper, along with its companion paper, presents the importance ofthe adequate soil behaviour model to simulate earthquake site response analysis. Anelastoplastic model taking into account the elementary necessary plastic mechanismssuch as progressive friction mobilization, Coulomb type failure, critical state anddilatancy/contractance flow rule, is used. However, one of the obstacles in the use ofelastoplastic models in the everyday design processes for evaluation of the seismic soilresponse is the difficulty in identifying their parameters. In this paper, a methodologyto identify a coherent set of parameters of the elastoplastic model for a given typeof soil is presented. The strategy behind the decision making process proposed hereis based on the use of minimum physical and easily measurable properties of the soilto directly provide or indirectly assess the required model parameters.
Keywords: Constitutive model; Cyclic Loading; Elastoplastic; Parameter identifi-cation; Liquefaction
1. Introduction
To simulate numerically seismic soil response, two approaches can beconsidered: the equivalent-linear approach and a truly non-linear elasto-plastic modeling. The variation of shear modulus and material dampingratio with shear strain, known as G − γ and D − γ curves, has beenknown to be a significant feature of the soil behaviour submitted tocyclic loading since the pioneer works by Seed and Idriss (1970). Thisobservation resulted in the equivalent-linear approach that has beenextensively used since then. Even though its shortcomings have beenrepeatedly enumerated in the past, it has become the major tool inpractical engineering applications due to its simplicity. On the otherhand, the emergence of cyclic elastoplastic constitutive models for soilsin the late 70’s and early 80’s has opened a new horizon for soil dy-namics studies, (e.g. Prevost and Hoeg, 1975; Ghaboussi and Dikmen,1978; Aubry et al., 1982 among others).
c© 2006 Kluwer Academic Publishers. Printed in the Netherlands.
paper_I_LMM_vc02.tex; 18/12/2006; 14:31; p.1

2 Fernando Lopez-Caballero et al.
The information concerning the capability of these models in rep-resenting the variation of the shear modulus and the damping ratioin a wide range of shear strain, namely from 10−6 to 10−2 is scarce.Pande and Pietruszczak (1986) compared several constitutive modelsand reported that almost all of them, except those based directly onthis property, were inefficient in reproducing this feature of soil be-haviour. In this paper, we will give some numerical results showingthat it is possible to simulate realistic G − γ and D − γ curves usingan elastoplastic model.
The use of models based on the elastoplasticity theory is moresuitable than equivalent-linear approach as they represent a rationalmechanical process. In this kind of model, parameters should be chosenso that they are closely related to the rheology that describes the ma-terial properties at various strain levels. In some cases these rheologicalmodels do not necessarily have physical parameters. Sometimes thereare indirect parameters that cannot be measured in the laboratory.
Thus, one of the obstacles in using such models is the difficultyin identifying their parameters. In addition, the lack of knowledge ofsoil properties is common in seismic studies and unfortunately, thecost of laboratory and in-situ tests is quite expensive, so a completegeotechnical description of a site is very rare.
The elastoplastic model implemented in CyberQuake (Modaressi andFoerster, 2000) is used here and a methodology to identify the modelparameters with a minimum laboratory data is proposed. This modelis a derivation of the ECP elastoplastic models (also known as Hujeux’smodel) developed, refined and enhanced by Aubry and co-workers sincethe early 80’s (Aubry et al. (1982), Hujeux (1985) for the 3D cyclicbehaviour, Aubry et al. (1990) for the interface behaviour). Mellal(1997) integrated and used the present model for seismic site effectsstudies.
The strategy developed in this paper is based on the extensive workof the authors in this field and it can be generalized to all of the ECPfamily models. It is based on the use of easily measurable soil prop-erties. The model’s parameter identification methodology is developedfor both clays and sands. As the G − γ and D − γ curves are largelyused for the material identification in seismic analyses, we focus ourwork on such results. Thus, the objective of the soil identification is toobtain the elastoplastic model parameters resulting in a given set ofG − γ and D − γ curves measured in a shear test.
paper_I_LMM_vc02.tex; 18/12/2006; 14:31; p.2

Nonlinear numerical method for earthquake site response analysis 3
2. Formulation of the elastoplastic constitutive model
The cyclic CyberQuake model is written for laterally infinite parallel soillayers , where a one-dimensional geometry can be considered. However,the three dimensional kinematics assumptions integrate the completedisplacement field. If x, y and z represent the reference axes in whichthe seismic motion is described, with z perpendicular to the soil layers,the three displacement components will vary only with respect to thez axis if:
u(z) = ux(z) + uy(z) + uz(z)
where ui represents the component of the displacement along i direc-tion.
On the potential shear plane with normal vector n, the displacementcan be presented as :
u(z) = ut(z) + un(z) · n
where ut designates the resultant of the displacements on the planewhich defines the shear direction. Thus, the shear (γ) and the normal(ε) strains are :
γ(z) =∂ut
∂z=
∂ux
∂z+
∂uy
∂z
ε(z) =∂un
∂z
In fact, the simple geometry consideration is usually an inherent fea-ture of simplified methods. The principal step for simplified models is tointroduce important aspects of the soil behaviour, such as strain shear-ing and/or pore-pressure build-up induced by the cyclic loading duringearthquakes. Moreover, the seismic motion in the multilayer system isadequately represented considering a plane plastic shear mechanism.
The saturated soil skeleton is considered as a mixture of solid grainsand the interstitial water. The behaviour of the solid skeleton is derivedassuming the principle of effective stress as proposed by Terzaghi, wherethe total stress tensor (σ) is split in two components: the effective stresstensor (σ′) and the pore pressure (p). Where σ = σ′ − p · I with I theidentity second order tensor. In this paper the mechanics of continuousmedia sign convention is adopted (i.e. compression negative).
This principle is valid as far as the solid grain compressibility is muchsmaller than the compressibility of the solid skeleton. We also assumethat the pore pressure variation does not induce any deformation ofthe grains.
paper_I_LMM_vc02.tex; 18/12/2006; 14:31; p.3

4 Fernando Lopez-Caballero et al.
The effective stress (respectively strain) vector can be decomposedinto normal and tangential components: σ′ (respect. ε) and τ (respect.γ).
Modeling the elastic behaviour In the very small strain range, soilbehaviour is reversible. However, the elastic properties of the soil de-pend on the stress state. Assuming an isotropic elastic behaviour, theeffective stress and strain rates are related as follows:
{
σ′ = E∗(σ′) εe
τ = G(σ′) γe (1)
where E∗ and G are the constrained and shear modules.
Modeling the elastoplastic behaviour The yield function of the con-stitutive model presented here may be considered as a generalizationof the Coulomb Friction law, in which some aspects such as the de-pendency on the state of compactness and the evolving friction mo-bilization, similar to those used in ECP family models (Aubry et al.,1982; Hujeux, 1985; Aubry et al., 1990), are included. It representsa shearing on a plane and incorporates dilatancy-contractance in thedirection normal to that plane. Therefore, the model is a derivationof the 3D model with some improvements. A vectorial formulation ofthe constitutive model permits plastic coupling effects between shear-ing and the plastic volumetric strain to be taken into account. Themodel is written in terms of effective stresses. Fundamental aspects ofsoil behaviour such as evolving plasticity, dilatancy and contractance,softening and hardening and cyclic hysteretic behaviour are included.
Following the incremental elastoplasticity theory, the rate of totalstrain is decomposed into reversible and irreversible parts:
{
ε = εe + εp
γ = γe + γp (2)
where (εp, γp) are normal and shear plastic strains on the surfacenormal to the wave propagation direction. The dot designates deriva-tion with respect to time. Hence, combining (1) and (2) gives:
{
σ′ = E∗( ε − εp)τ = G (γ − γp)
(3)
Both monotonous and cyclic loadings can be defined by a yieldsurface as follows:
f(σ′, τ , εp, r) = ‖τ c‖ + σ′ · F · |rc| (4)
paper_I_LMM_vc02.tex; 18/12/2006; 14:31; p.4

Nonlinear numerical method for earthquake site response analysis 5
where ‖a‖ = (a · a)1/2 and |a| designates the absolute value of a.
rc = r − ro and τ c = τ − σ′Fσ′
oFoτ o. The index o corresponds to the value
of the variable at the latest loading reversal during the cyclic loading.The above formulation is advantageous as it can be applied to cyclicas well as monotonous (primary) loading where τ o and ro will be zero.
Isotropic hardening is taken into account by means of F and r.The function F permits to control the isotropic hardening associatedwith the plastic volumetric strain, whereas r accounts for the isotropichardening generated by plastic shearing. It represents progressive fric-tion mobilization in the soil and reaches its maximum value at perfectplasticity. F can be expressed as follows:
F = 1 − b ln
(
σ′
σc
)
(5)
with σc, the critical effective stress:
σc = σco exp(−β εp) (6)
The parameter b controls the form of the yield surface and variesfrom 0 to 1, passing from a Coulomb type surface to a Cam-Clay one(figure 1). A kinematical hardening is introduced during the loading-unloading cycles through the internal variable r. This latter is relatedto the plastic shear strain as follows:
r(γp) = ro + (rm − ro)
|γp − γpo |
|rm − ro|
Ep+ |γp − γp
o |
nr
(7)
with:
rm =
{
tanφ′ load/reload− tanφ′ unload
where φ′ is the friction angle at the critical state; γp is the plasticshear strain accumulated during the shearing (γp =
∫ t0 ‖γ
p‖dt); γpo is the
plastic shear strain accumulated at the very beginning of the loadinguntil the last loading/reloading(γp
o =∫ t00 ‖γp‖dt) and nr is a numerical
parameter which guarantees a smooth evolution towards perfect plas-ticity (figure 2). Ep is the plastic modulus which governs the evolutionof shear strains.
When the plastic strains grow dramatically in the soil, the functionr reaches its maximal value rm asymptotically:
limγp
→+∞
r = rm or limγp
→+∞
‖τ‖ = −σ′ F |rm| (8)
paper_I_LMM_vc02.tex; 18/12/2006; 14:31; p.5

6 Fernando Lopez-Caballero et al.
Figure 1. Influence of parameter b on the yield surface shape
Plastic volumetric strains associated with plastic shear strains areevaluated using a Roscoe-type dilatancy rule (Schofield and Wroth,1968):
{
εp = λp Ψv
γp = λp Ψd(9)
where λp is the plastic multiplier.
Ψv = −αψ ζ(r)
(
tanψ +‖τ c‖
σ′
)
Ψd = ∂τf =τ c
‖τ c‖
(10)
γp
r
rm
= tan φ
rm
= − tan φ
ro
γpo
Figure 2. Loading/unloading cycle
paper_I_LMM_vc02.tex; 18/12/2006; 14:31; p.6

Nonlinear numerical method for earthquake site response analysis 7
ψ is the characteristic angle, defining the limit between dilatancyand contractance of the material (figure 3). ζ(r) has been introducedto control pore-pressure or volumetric strain evolution. It is zero forvery low strains, equal to unity for large strains and varies from 0to 1 for the intermediate range of strains. The parameter αψ is aconstant parameter which enhances the model’s performances. Set tozero, the plastic contractance or dilatance can be inhibited. In all ourcomputations the unit value has been adopted.
−σ′
‖τ c‖Critical state line
φ
Characteristic state lineψ
Contractance domain
Dilatance domain
1
Figure 3. Critical State and Chacteristic State Lines
ζ(r) =
0 if |r − ro| < rhys elastic domain(
|r − ro| − rhys
rmob − rhys
)2
if rhys < |r − ro| < rmob hysteretic domain
1 if rmob < |r − ro| < 1 mobilized domain(11)
with:
rhys = |rm − ro|
γhys
|rm − ro|
Ep+ γhys
nr
rmob = |rm − ro|
γmob
|rm − ro|
Ep+ γmob
nr
(12)
Plastic coupling Because of the plasticity mechanism, there are twotypes of coupling between different components of the seismic motion.
paper_I_LMM_vc02.tex; 18/12/2006; 14:31; p.7

8 Fernando Lopez-Caballero et al.
The first concerns the two in plane components as the yield functiondepends of the amplitude of the shear stress, implying the interdepen-dence of the plastic strain vectors and thus the shear stress and strainevolution in both directions. The second coupling links the normal andthe in plane movements. Due to equations 9 and 10, the induced incre-ment of normal plastic strain is proportional to the amplitude of theincrement of the shear strain : εp = Ψv‖ γp‖. Moreover, the incrementsof the shear and normal stresses depend on the increment of the plasticshear strain vector in the plane (equation 3). This explains importanceof taking into account all the components of shear strain. To these directcoupling effects, we can add the role of normal strain (normal stress)on the evolution of the yield function which controls the amplitude ofthe shear strains.
In practice, the computations of the seismic soil motion are car-ried out with each component of the input motion separately (i.e.each horizontal or vertical component). The coupling due to plastic-ity prohibits such individualized computations and enforces the needto perform computations with three components of the input motionsimultaneously.
3. Elastoplastic constitutive model parameters
As already mentioned, the parameters of the model concern both theelastic and plastic behaviour of the soil (table I). The model parametersare classified according to their estimation method. From this point ofview, the parameters used in the elastoplastic model are separated intotwo categories: those that can be directly measured either in-situ or inthe laboratory and those which cannot be directly measured.
3.1. Determination of directly measurable parameters
3.1.1. Elastic parameters
The isotropic elasticity assumption imposes the following relation be-tween the shear and compression wave velocities and the Poisson’s ratioν: (υp/υs)
2 = 2(1 − ν)/(1 − 2ν). It shows that only two of the abovethree parameters have to be determined. When shear wave velocitymeasurement is not available, it can be estimated by: υ2
s = Gmax/ρ,where Gmax is the maximum shear modulus measured at small strainsand ρ is soil density.
3.1.1.1. Clays Laboratory test data suggest that the maximum shearmodulus Gmax is a function of the void ratio e, the over-consolidation
paper_I_LMM_vc02.tex; 18/12/2006; 14:31; p.8

Nonlinear numerical method for earthquake site response analysis 9
Table I. Parameter classification according to their estimation method
Rigidity State Behaviour
and hardening domains
Elasticity
Directly measurable υs, υp∗ φ′, ψ γela, γhys
Plasticity σco/σ′, ρ
β
Non-directly measurable Ep, αψ, nr b γmob
∗ In earthquake engineering, shear and compression wave velocities are usually
used. If the mass density of the material is known, the elastic modulus E∗
and G can be estimated.
ratio OCR and the mean effective stress σ′ (Hardin, 1978; Vucetic andDobry, 1991; Kramer, 1996; Kallioglou et al., 1999). Empirical relationscan be used to determine this parameter according to the soil type.Figure 4 shows a comparison between the shear modulus obtained withdifferent relations (Hardin, 1978; Kokusho et al., 1982; Anastasiadisand Pitilakis, 1996; Kallioglou et al., 1999; Santos, 1999) for a normallyconsolidated clay at σ′ = 100kPa as a function of voids ratio e. Forthe overconsolidated clays, an additional multiplying parameter of thetype OCRk can be used. k is a factor depending on the plasticity indexIp, such that for Ip between 0 − 100% k varies from 0 to 0.5 (Hardin,1978).
3.1.1.2. Sands As in clays, the maximum shear modulus Gmax ofsands can be expressed as a function of the void ratio e and the meaneffective stress σ′. After Kohata et al. (1997), the variation of maximummodulus as a function of the confinement pressure obtained for differenttested sands and gravels is very close. Thus, we propose to use thefollowing relationship (Iwasaki et al., 1978) for the sand:
Gmax = 900(2.17 − e)2
1 + eσ′0.4 p0.6
a (13)
3.1.2. Plastic compressibility modulus βThe plastic compressibility modulus β can be expressed in terms of theλ parameter of the Cam-Clay model using the following relationship:
β ≃1 + e
λ(14)
paper_I_LMM_vc02.tex; 18/12/2006; 14:31; p.9

10 Fernando Lopez-Caballero et al.
λ represents the slope of the virgin consolidation line of an isotropiccompression test expressed in the (e − lnσ′) plane. This parameter isrelated to the compression index Cc through: Cc = 2.3λ.
3.1.2.1. Cc and e for Clays For a normally consolidated clay, thefollowing relation exists between the voids ratio e and the verticaleffective stress σ′: e = e0 − Cc log(σ′). Different authors propose acorrelation between Ip and Cc (Biarez and Hicher, 1994; Bardet, 1997).In this paper, we use the correlation given by Biarez and Favre (1972),Cc = 0.009(wL − 13) where wL is the liquidity limit. The strategy forthe determination of e knowing the effective vertical stress is shown in
0 0.5 1 1.5 2 2.5 3 3.5 410
0
101
102
103
Void ratio, e
She
ar m
odul
us, G
max
[MP
a] a
t σ’ v =
100
kP
a
wL = 105 %
wL = 60 %
wL = 70 %
Kokusho et al. (1982)Anastasiadis & Pitilakis (1996)Kallioglou et al. (1999)Hardin (1978)Santos (1999)Liu (1999)
Figure 4. Comparison of different relationships given for the maximum shearmodulus.
Figure 5. The slope and the position of the oedometric compressibility curve fornormally consolidated clays. (Biarez and Favre, 1972).
paper_I_LMM_vc02.tex; 18/12/2006; 14:31; p.10

Nonlinear numerical method for earthquake site response analysis 11
figure 5, where, as it can be seen, e is equal to GSwL/100 for σ′ = 7kPaand GSwp/100 for σ′ = 1MPa, where GS is the soil specific gravity.
3.1.2.2. Cc for Sands Saim (1997) proposes a correlation between Cc
and the minimum and maximum void ratios emin and emax for sands,where the relative density Dr is equal to 0 for σ′
v = 100kPa and 1for σ′
v = 5MPa at critical state. When the void ratio measurement isnot available, it can be estimated by some correlations relating the emin
and emax of sandy materials with respect to their grain size distribution(Biarez and Hicher, 1994).
In another approach, Hicher and Rahma (1994) propose a moregeneral relation (eq. 15) to obtain the β value, by using a large sandysoil database. Thus parameter β is given by the following relationship:
β = 2.3(1 + e)βnorm
Ie(15)
Ie is the consistance index (Ie = emax − emin) and βnorm is given as:
βnorm = log P ′cmax − log P ′cmin
log P ′cmax = −4 log Uc − 7.5 · emin + 4.75 · Ie + 7.1 ± 0.3 (16)
log P ′cmin = −12 log Cz − 4.7 · emax + 9.71 · Ie + 2.2 ± 0.5
Uc is the uniformity coefficient (d60/d10), where di designates thediameter of the grains representing i%, Cz is the coefficient of curvature(d2
30/d60 ·d10). P ′cmax and P ′cmin are the mean effective stress for emin
and emax respectively.
3.1.3. Determination of φ′ and ψFor clays, Biarez and Hicher (1994) give a correlation between thefriction angle φ′ and the Plasticity Index Ip. In this correlation φ′
decreases from 32◦ to 20◦ when Ip varies from 5% to 65% followingthis relationship:
φ′ = 44.5
(
1
Ip
)0.17
(17)
Favre (1980) gives the following relationship for the friction angle ofsands:
φ′ = 31.5◦ + φD + φF + φUc (18)
where φD, φF and φUcare used to account for granulometric features
such as grain size, angularity and grain size distribution respectively.The sum of these coefficient values varies in the range of ±2.5◦.
paper_I_LMM_vc02.tex; 18/12/2006; 14:31; p.11

12 Fernando Lopez-Caballero et al.
As already mentioned, ψ represents the limit between contractingand dilating behaviours in sands, which is known as the “phase trans-
formation state” or “quasi-steady state” (Ishihara et al., 1975; Ishihara,1993). The value of this parameter may be equal or less than φ′. In thecase of clays, ψ = φ′ can be chosen.
3.1.4. Initial state parameters
In the CyberQuake model, the initial state of the soil is given by thecompaction ratio σco/σ′. This parameter represents the position of thecritical state pressure σco with respect to the initial pressure σ′. If weneglect the elastic volumetric strain, σco can be defined as the pressurein the critical state line corresponding to the same void ratio as theinitial pressure (σ′). The σco/σ′ ratio is a function of the initial densityof the soil and the position of the initial void ratio with respect to thecritical state line in the (e − lnσ′) plane.
Thus, in the case of clays, this ratio remains constant for a givenOCR at different initial pressures. Nevertheless, for sands, σco remainsconstant for a given Dr at different initial pressures. This parametercan be estimated by using different factors proposed to characterizeboth the response of clays and sands.
For clays, the compaction ratio can be estimated by the followingrelationship:
σco
σ′=
Su
σ′ tanφ′(19)
where Su is the undrained shear strength (Su = (σ′
1−σ′
3)/2 = τmax).For sands, it can be obtained using the following expression:
σco
σ′= exp
(
−2.3ψBJ
Cc
)
(20)
ψBJ is the “state index” parameter given by Been and Jefferies(1985).
3.2. Determination of non-directly measurable parameters
As the Cam-Clay yield surface represents the behaviour of clays better,while the Mohr-Coulomb is more adapted for sands, the value of b isdetermined with respect to this consideration (i.e. b ≃ 0.1 − 0.2 forsands and b = 1.0 for clays). The parameter nr has been chosen equalto 0.5 for all cases.
paper_I_LMM_vc02.tex; 18/12/2006; 14:31; p.12

Nonlinear numerical method for earthquake site response analysis 13
3.2.1. Behaviour domains
The parameters γela, γhys and γmob, are very important in liquefactionstudies. They enable the decomposition of soil behaviour into pseudo-elastic, hysteretic and mobilized domains. These parameters control thedegradation hysteresis and the water pore-pressure change in undrainedconditions or the volumetric change in drained conditions. γela, whichtakes very small values, defines the elastic domain in which no plasticshear strain occurs. γhys defines the plastic shear strain beyond whichvolumetric effects appear under shearing. This latter effect evolvesaccording to relation 11.
To estimate γhys and γmob, a strain controlled cyclic shear (SCCS)test can be simulated in order to find the volumetric threshold shear
strain γtv (Dobry et al., 1982; Vucetic, 1994). In order to study the influ-ence of these parameters in the model response, three undrained SCCStests are simulated (figure 6) and only the value of γhys is changed.According to this figure, the variation of γhys value modifies the γtv
obtained.
10−2
10−1
100
0
0.1
0.2
0.3
0.4
0.5
0.6
0.7
0.8
0.9
1
Shear strain amplitude, γ [%]
Por
e P
ress
ure
Rat
io, U
* =
∆ U
/σ’ o
Strain−ControlledCyclic TestN =10 cycles
σ’o = 122 kPa
γhyst = 1.10−4
γhyst = 2.10−4
γhyst = 5.10−4
Dobry et al. (1982)
Figure 6. Effect of variation de γhys in the model response of a strain controlledcyclic shear (SCCS) test. Comparison with Dobry et al. (1982) curves.
3.2.2. Plasticity modulus of rigidity Ep
The parameter Ep governs the evolution of the yield surface towardtotal plastic mobilization. It will be determined in order to match theG − γ and D − γ curves for each type of soil. Several authors havesummarized such curves (Kokusho, 1980; Seed et al., 1986; Sun et al.,1988; Vucetic and Dobry, 1991; Ishibashi and Zhang, 1993; Darendeli,
paper_I_LMM_vc02.tex; 18/12/2006; 14:31; p.13

14 Fernando Lopez-Caballero et al.
2001), according to the material type. As it is a conceptual example inthis part of the work, the compiled curves of Vucetic and Dobry (1991)and those of Kokusho (1980) have been used as “measured” curves forclays and sands respectively.
In order to study the influence of several features of soil behaviour onthe Ep parameter, cyclic shear tests at different initial states have beensimulated for both clays and sands. Using a statistical analysis of useddata (Figure 7), we can propose the following relationship to estimatethe Ep value for clays and sands (equation 21 and 22) respectively:
Ep = C1 exp
(
χclGmax
σ′ · OCR
)
(21)
Ep = C2 exp
(
χsanGmax
σco
)
(22)
101
102
103
101
102
103
104
Gmax
/(OCR ⋅ σ’o)
Ep p
aram
eter
Ip = 15 %
Ip = 30 %
Ip = 100 %
Ip = 200 %
Figure 7. Variation of Ep parameter as a function of Gmax, OCR and σ′ for differentIp values (Case of clays).
where C1, χcl and C2, χsan are factors depending on the Ip and Dr
respectively (Table II).Finally, the whole methodology for the determination of elastoplastic
model parameters for clays and sands is summarized in figures 8 and 9.As can be noted in these figures, for a given soil profile, the knowledgeof one state parameter (i.e. OCR for clays and Dr for sands) and oneparameter independent of the soil arrangement (i.e. Liquidity Limitof clays wL and emin and emax for sands) is enough to obtain a setof model parameters, which can probably be refined if complementarydata are available.
paper_I_LMM_vc02.tex; 18/12/2006; 14:31; p.14

Nonlinear numerical method for earthquake site response analysis 15
Soil Behaviour
Ip wL OCR z
Initial State
φ Cc eL, σ′
L σ′
σco
β e Gmax
Epγela,hys,mob b,nr
datacorrelation
interm. parameter
correlation
final parameterfitting
Figure 8. Methodology for elastoplastic model parameter identification of clays
4. Model response for laboratory tests
In order to validate the proposed methodology and the coherence of theobtained set of parameters, we have studied clay and sand behavioursat different initial states (i.e. different values of σ′ and OCR or Dr).The constitutive model parameters are then obtained by simulating themonotonic and cyclic tests.
4.1. Tests for clays
The model parameters were determined as described above and theundrained strain-controlled monotonous and cyclic direct simple shear
Table II. Values of coefficients of relations 21 and 22 to estimate the valuesof Ep parameter.
Clay Sand
Ip(%) C1 χcl Dr(%) C2 χsan
15 57.1 6.414 10−3 10 2256 -1.7 10−3
30 31.0 1.295 10−2 20 1895 -2.1 10−3
100 31.0 2.681 10−2 50 2613 -5.8 10−3
200 11.7 6.800 10−2
paper_I_LMM_vc02.tex; 18/12/2006; 14:31; p.15

16 Fernando Lopez-Caballero et al.
tests were simulated. These tests were made for an Ip = 15% clay atthree initial states and different OCR values (i.e. 1.0, 2.0 et 3.0). Theconfining pressures (σ′) used are 64, 70 and 189kPa. Figure 10 showsthe model prediction for the variation of G/Gmax and the variationof damping ratio (D) with the cyclic shear strain γ for the undrainedstrain-controlled cyclic direct simple shear test. These curves are com-pared with the modulus reduction curve and the damping ratio forIp = 15% clay given by Vucetic and Dobry (1991). The shear modulus(G) obtained by the elastoplastic model is in good accordance withthe given curve, though the model overestimates the damping for highshear strains.
In order to define the different states of the clay (i.e. different OCRvalues), undrained monotonic simple shear tests are simulated. Figure11 shows the results of such tests obtained in the τ−γ plane. In order toverify the validity of the proposed model parameters, we have plottedthe variation of the (τ/σ′) ratio with respect to the shear strain (γ)in figure 12. It shows that the soil behaviour is always contractingwhen OCR=1 and dilating for OCR > 1, where the material exceedsthe critical state line before reaching perfect plasticity. Therefore, foroverconsolidated material, resistance degradation is also modeled. Inaddition, the comparison of the Su values obtained in the numericalsimulation are in perfect coherence with the empirical correlations, as
Soil Behaviour
emaxemin Dr z
Initial State
φ
Cc
eL, σ′
L σ′
σco
β e Gmax
Epγela,hys,mob b,nr
100
101
102
0
0.02
0.04
0.06
0.08
0.1
0.12
0.14
0.16
0.18
0.2
Number of cycles to liquefaction, N
Cyc
lic s
tres
s ra
tio, R
= τ
d/σ’ o
Average curve
σ’o = 575 kPa − D
r = 20%
Simulated
datacorrelation
interm. parameter
correlation
final parameterfitting
Figure 9. Methodology for elastoplastic model parameter identification of sands
paper_I_LMM_vc02.tex; 18/12/2006; 14:31; p.16

Nonlinear numerical method for earthquake site response analysis 17
10−4
10−3
10−2
10−1
100
0
0.1
0.2
0.3
0.4
0.5
0.6
0.7
0.8
0.9
1
Cyclic shear strain, γ [%]
Nor
mal
ized
mod
ulus
, G/G
max
Computed, OCR=1.0 and 5.0Ip=15% Clay (Vucetic & Dobry 1991)
10−4
10−3
10−2
10−1
100
0
5
10
15
20
25
30
35
40
45
50
Cyclic shear strain, γ [%]
Dam
ping
rat
io, D
[%]
Computed, OCR=1.0 and 5.0Ip=15% Clay (Vucetic & Dobry 1991)
a. b.
Figure 10. Comparison between simulated and Vucetic and Dobry (1991) referencecurves for Ip = 15% clay model : a) G/Gmax − γ and b) D − γ.
for example, that given by Jamiolkowski et al. (1985):
Su
σ′= (0.23 ± 0.04) OCR0.8 (23)
0 0.5 1 1.5 2 2.5 3 3.5 40
10
20
30
40
50
60
70
Shear strain amplitude, γ [%]
She
ar s
tres
s, τ
[kP
a]
σ’o = 189 kPa
σ’o = 70 kPa
σ’o = 64 kPa
Ip = 15% Clay
Computed OCR = 1OCR = 2OCR = 3
Figure 11. Simulated variation of shear stress τ with shear strain γ for 3 undrainedsimple monotonic shear tests. Ip = 15% clay model.
where σ′
m is the initial vertical effective stress. In the simulation,Su/σ′ values of 0.34, 0.60 and 0.80 are obtained for OCR of 1.0, 2.0and 3.0 respectively.
paper_I_LMM_vc02.tex; 18/12/2006; 14:31; p.17

18 Fernando Lopez-Caballero et al.
0 0.5 1 1.5 2 2.5 3 3.5 40
0.1
0.2
0.3
0.4
0.5
0.6
0.7
Shear strain amplitude, γ [%]
τ/σ’
Ip = 15% Clay
Computed
tan φ’
OCR = 1 − σ’o = 189 kPa
OCR = 2 − σ’o = 64 kPa
OCR = 3 − σ’o = 70 kPa
Figure 12. Simulated variation of τ/σ′ with shear strain γ for 3 undrained simplemonotonic shear tests. Ip = 15% clay model.
4.2. Tests for sands
In this section, a unique type of sand with different Dr at several initialconfining pressures is studied. The main characteristics of the sand usedare as follows: Cu = 1, 3, Cz = 1.0, emin = 0.58 and emax = 0.98. Oncethe parameters are estimated, undrained cyclic strain-controlled sheartests are simulated to verify the coherence of the parameters.
Figures 13 and 14 show the response obtained by the model withDr = 20% for the monotonic test in the τ − γ and τ − σ′ planes.
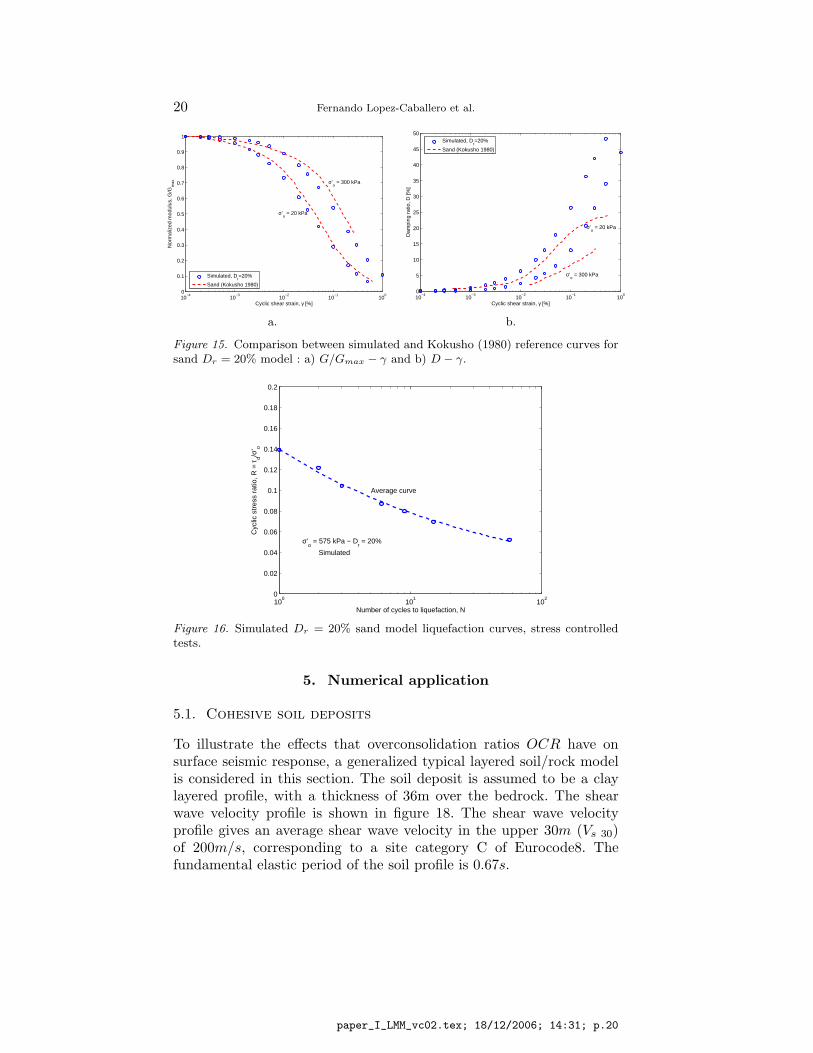
Figure 15 shows the simulated response of a drained cyclic strain-controlled shear test for the sand at Dr = 40% and two σ′ (20 and300kPa). The obtained G/Gmax−γ and D−γ curves are compared tothe reference curves given by Kokusho (1980) for sands at the sameinitial pressure. As can be noticed, the G/Gmax − γ curves matchrelatively well for both σ′ values. Nevertheless, for strains larger than0.01%, the damping ratio D is over-estimated.
In the case of sands, the cyclic tests are related principally to thestudy of liquefaction problems. In order to characterize the liquefactionresistance of a sand with Dr = 20%, undrained cyclic shear tests weresimulated. Both approaches, stress controlled and strain controlled,were used. The first one gives a curve of cyclic stress ratio (R = τd/σ′)as a function of the number of loading cycles to produce liquefaction(N) (Figure 16). The second approach, proposed by Dobry et al. (1982),produces a curve of pore pressure ratio (ru = ∆U/σ′) after 10 cycles as
paper_I_LMM_vc02.tex; 18/12/2006; 14:31; p.18

Nonlinear numerical method for earthquake site response analysis 19
0 1 2 3 4 5 60
10
20
30
40
50
60
70
80
Shear strain amplitude, γ [%]
She
ar s
tres
s, τ
[kP
a]
σ’o = 383 kPa
σ’o = 213 kPa
σ’o = 43 kPa
Dr = 20% Sand
Computed
Figure 13. Simulated variation of shear stress τ with shear strain γ for 3 undrainedsimple monotonic shear tests. Dr = 20% sand model.
0 50 100 150 200 250 300 350 4000
20
40
60
80
100
120
Vertical effective stress, σ’ [kPa]
She
ar s
tres
s, τ
[kP
a]
σ’o = 383 kPaσ’
o = 43 kPa σ’
o = 213 kPa
φ’ = 31°
Dr = 20% Sand
Computed
Figure 14. Simulated variation of shear stress τ with normal stress σ′ for 3 undrainedsimple monotonic shear tests. Dr = 20% sand model.
a function of cyclic strain (Figure 17). According to these figures, themodel responses for both loading paths are coherent for the same initialconditions (i.e. Dr and σ′) and both of them can be used to validatethe model.
paper_I_LMM_vc02.tex; 18/12/2006; 14:31; p.19
20 Fernando Lopez-Caballero et al.
10−4
10−3
10−2
10−1
100
0
0.1
0.2
0.3
0.4
0.5
0.6
0.7
0.8
0.9
1
Cyclic shear strain, γ [%]
Nor
mal
ized
mod
ulus
, G/G
max
σ’o = 20 kPa
σ’o = 300 kPa
Simulated, Dr=20%
Sand (Kokusho 1980)
10−4
10−3
10−2
10−1
100
0
5
10
15
20
25
30
35
40
45
50
Cyclic shear strain, γ [%]
Dam
ping
rat
io, D
[%]
σ’o = 20 kPa
σ’o = 300 kPa
Simulated, Dr=20%
Sand (Kokusho 1980)
a. b.
Figure 15. Comparison between simulated and Kokusho (1980) reference curves forsand Dr = 20% model : a) G/Gmax − γ and b) D − γ.
100
101
102
0
0.02
0.04
0.06
0.08
0.1
0.12
0.14
0.16
0.18
0.2
Number of cycles to liquefaction, N
Cyc
lic s
tres
s ra
tio, R
= τ
d/σ’ o
Average curve
σ’o = 575 kPa − D
r = 20%
Simulated
Figure 16. Simulated Dr = 20% sand model liquefaction curves, stress controlledtests.
5. Numerical application
5.1. Cohesive soil deposits
To illustrate the effects that overconsolidation ratios OCR have onsurface seismic response, a generalized typical layered soil/rock modelis considered in this section. The soil deposit is assumed to be a claylayered profile, with a thickness of 36m over the bedrock. The shearwave velocity profile is shown in figure 18. The shear wave velocityprofile gives an average shear wave velocity in the upper 30m (Vs 30)of 200m/s, corresponding to a site category C of Eurocode8. Thefundamental elastic period of the soil profile is 0.67s.
paper_I_LMM_vc02.tex; 18/12/2006; 14:31; p.20

Nonlinear numerical method for earthquake site response analysis 21
10−2
10−1
100
0
0.1
0.2
0.3
0.4
0.5
0.6
0.7
0.8
0.9
1
Shear strain amplitude, γ [%]
Por
e P
ress
ure
Rat
io, U
* =
∆ U
/σ’ o
Strain−ControlledCyclic TestN =10 cycles
σ’o = 575 kPa − D
r = 20 %
SimulationDobry et al. (1982)
Figure 17. Simulated Dr = 20% sand model liquefaction curves, strain controlledtests.
0 100 200 300 400 500 600−40
−35
−30
−25
−20
−15
−10
−5
0
Vs [m/s]
Dep
th [m
]
Figure 18. Soil profile characterization.
The profile is composed of clays with Ip equal to 15%. The soil profileis considered homogeneous and three different OCR values (i.e. 1.0, 2.0and 3.0) are used. Even if the Vs value used for the three cases is thesame, only the initial state (OCR) is changed in order to illustrate itsinfluence on the seismic response of the profile.
A deformable bedrock with a shear wave velocity of 500m/s is placedat 36m depth.
paper_I_LMM_vc02.tex; 18/12/2006; 14:31; p.21

22 Fernando Lopez-Caballero et al.
The methodology explained in this paper is used to determine thesoil model parameters. In this case, the Darendeli (2001) curves forIp = 15% clay have been used as “measured” curves.
Figure 19 shows the model prediction for the variation of G/Gmax
with the cyclic shear strain γ in undrained strain-controlled cyclic di-rect simple shear tests at two initial confining pressures (σ′
o = 25 and100kPa). These curves are compared with the modulus reduction curvegiven by Darendeli (2001) for Ip = 15% clay.
10−6
10−5
10−4
10−3
10−2
0
0.1
0.2
0.3
0.4
0.5
0.6
0.7
0.8
0.9
1
Shear strain, γ
G/G
max
Darendeli 2001 − Ip=15% − σo = 25−100kPa
Simulation − OCR=2 − σo = 25−100kPa
Figure 19. Comparison between simulated G/Gmax − γ and Darendeli (2001)reference curves for Ip = 15% clay model
The used seismic input motions are the acceleration records of Friuliearthquake - San-Rocco site (Italy-1976) and Superstition Hills earth-quake - Supers. Mountain site (USA-1987). These signals are consistentwith the response spectra of Type A soil (i.e. rock) of Eurocode8.The response of the site profile is computed using only the horizontalcomponent of the input records.
In as far as it concerns the acceleration history obtained in ouranalyses, the effect of the OCR value of the soil profile on the obtainedacceleration at the surface level (PGAsurf ) is studied.
In practice, the most common approach to estimate the PGAsurf
value is to use attenuation relationships such as those given by Idriss(1991) or Dickenson and Seed (1996). These relations take into accountthe influence of the non linearity of soil behaviour on the obtainedPGAsurf value. Figure 20 shows the variation of peak ground ac-celeration at the surface (PGAsurf ) as a function of the maximumacceleration at the outcropping bedrock (amax out). According to thisfigure, the amplification of peak ground acceleration on the ground sur-
paper_I_LMM_vc02.tex; 18/12/2006; 14:31; p.22

Nonlinear numerical method for earthquake site response analysis 23
0 0.1 0.2 0.3 0.4 0.50
0.1
0.2
0.3
0.4
0.5
amax out
[g]
PG
Asu
rf [g
]
Friuli Earthquake
OCR = 1OCR = 2OCR = 3Dickenson & Seed 1996 (C
4 + D + E)
0 0.05 0.1 0.15 0.2 0.25 0.3 0.35 0.40
0.1
0.2
0.3
0.4
0.5
amax out
[g]
PG
Asu
rf [g
]
Supestition Earthquake
OCR = 1OCR = 2OCR = 3Dickenson & Seed 1996 (C
4 + D + E)
a. b.
Figure 20. Relationships between maximum acceleration on bedrock and surfaceobtained in the soil profile for different earthquakes : a) Friuli earthquake and b)Superstition earthquake.
face relative to bedrock appears for amax out value to be less than 0.25gin the case of normally consolidated soil behaviour (i.e. OCR = 1).Furthermore, these responses illustrate that the estimated PGAsurf
values for the model with OCR = 1 are much smaller than thoseobtained for OCR = 2 and 3.
This variation is due to the difference in the “rigid” behaviour ofoverconsolidated soils even if the Vs profiles and G/Gmax − γ curvesare similar.
6. Conclusions
A consistent and coherent methodology to determine an elastoplasticmodel parameters for clayey and sandy soils has been proposed. Forclays, Atterberg limits and an OCR ratio can be used to identify themechanical parameters, while for sands, the relative density or the voidratio is the dominant parameter.
This methodology, which can form the basis for a decision makingprocess, has two aims. First, to give a handy, easy-to-obtain and co-herent set of parameters to use when no experimental data is available.Second, to be used as the starting point for cases where geotechnicalmeasurements are not sufficient.
In the numerical applications, the importance of all model parame-ters and the differences that the errors on their identification can inducein the seismic site response were illustrated.
paper_I_LMM_vc02.tex; 18/12/2006; 14:31; p.23

24 Fernando Lopez-Caballero et al.
In the companion paper, this methodology is generalised to naturalsoil in order to evaluate the seismic response of real sites subjected tonatural acceleration records.
Acknowledgements
A part of this study has been done in the framework of the EuropeanCommunity Contract No ENV-CT97- 0392.
References
Anastasiadis, J. A. and K. D. Pitilakis. Shear modulus Go and damping of typicalGreek soils at low strain amplitudes. Technika Chronika, Scien. J. of TCG,16(3):9–18, 1996.
Aubry, D., J.-C. Hujeux, F. Lassoudire and Y. Meimon. A double memory modelwith multiple mechanisms for cyclic soil behaviour. Proceedings of the Int. Symp.Num. Mod. Geomech, Balkema, 3–13,1982.
Aubry, D., A. Modaressi and H. Modaressi. A constitutive model for cyclic behaviourof interfaces with variable dilatancy. Computers and Geotechnics,9(1/2):47–58,1990.
Bardet, J.-P. Experimental Soil Mechanics. Prentice Hall, Upper Saddle River,NJ,1997.
Been, K. and M. G. Jefferies. A state parameter for sands Geotechnique, 35(2),99–112, 1985.
Biarez, J. and J.-L. Favre. Correlations de parametres en mecanique des sols. EcoleCentrale Paris, Table ronde nationale, 1972.
Biarez, J. and P.-Y. Hicher. Elementary Mechanics of Soil Behaviour, Saturated andRemolded Soils. Balkema, Amsterdam, Netherlands, 1994.
Darendeli, M. B. Development of a new family of normalized modulus reduction andmaterial damping curves. Ph.D. Dissertation, University of Texas at Austin,USA, 2001.
Dickenson, S. E. and R. B. Seed. Non-linear Dynamic Response of Soft and DeepCohesive Soil Deposits. Proceedings of the International Workshop on Site Re-sponse Subjected to Strong Earthquake Motions, Vol. 2. pp. 67–81, Yokosuka,Japan, 1996.
Dobry, R., R. S. Ladd, F. Y. Yokel, R. M. Chung and D. Powell. Prediction ofpore water pressure buildup and liquefaction of sands during earthquakes by thecyclic strain method. National Bureau of Standards, Building Science Series 138,1982.
Favre, J.-L. Milieu continu et milieu discontinu: mesure statistique indirecte desparametres rheologiques et approche probabiliste de la securite. These de docteures sciences, Univ. Pierre et Marie Curie, Paris VI, France, 1980.
Ghaboussi, J. and S. U. Dikmen. Liquefaction analysis of horizontally layered sands.Journal of Geotechnical Engineering Division - ASCE, 104(nr GT3), 341–356,1978.
paper_I_LMM_vc02.tex; 18/12/2006; 14:31; p.24

Nonlinear numerical method for earthquake site response analysis 25
Hardin, B. O. The nature of stress-strain behavior for soils. In ProceedingsASCE Geotechnical Engineering Division. Specially Conference On Earthquakeengineering and Soil Dynamics, Pasadena, CA, Vol. 1, pp. 3–89, 1978.
Hicher, P.-Y. and A. Rahma. Micro-macro correlations for granular media.Application to the modelling of sands.European Journal of Mechanics. A/Solids,13(6), 763-781, 1994.
Hujeux, J.-C. Une loi de comportement pour le chargement cyclique des sols. InV. Davidovici, editor, Genie Parasismique, Presses ENPC, France, pp. 278–302,1985.
Idriss, I. M. Earthquake ground motions at soft soil sites. 2nd International Con-ference on recent Advances in Geotechnical Earthquake Engineering and SoilDynamics, Vol. 3. pp. 2265–2271, St. Louis, Missouri. Eds. Prakash, 1991.
Ishibashi, I. and X. Zhang. Unified dynamic shear moduli and damping ratios ofsand and clay. Soils and Foundations, 33(1), 182–191, 1993.
Ishihara, K. Liquefaction and flow failure during earthquakes. 33rd Rankine lecture.Geotechnique, 43(3), 351–415, 1993.
Ishihara, K., F. Tatsuoka and S. Yasuda. Undrained deformation and liquefactionof sand under cyclic stresses. Soils and Foundations, 15(1), 29–44, 1975.
Iwasaki, T., F. Tatsuoka and Y. Takagi. Shear moduli of sands under cyclic torsionalshear loading. Soils and Foundations 18(1), 39–56, 1978.
Jamiolkowski, M., C. C. Ladd, J. T. Germaine and R. Lancellotta. New develop-ments in field and laboratory testing of soils. In Proceedings 11th InternationalConference On Soil Mechanics and Foundations Engineering, San Francisco, CA,Vol. 1, pp 57–154, 1985.
Kallioglou, P., Th. Tika and K. Pitilakis. Dynamic characteristics of natural cohesivesoils. In Proceedings 2nd International Conference On Earthquake GeotechnicalEngineering, Lisbon, Portugal, 1999.
Kohata, Y., F. Tatsuoka, L. Wang, G. L. Jiang, E. Hoque and T. Kodaka. Modellingthe non-linear deformation properties of stiff geomaterials. Symposium In Print.Geotechnique, 47(3), 563–580, 1997.
Kokusho, T. Cyclic triaxial test of dynamic soil properties for wide strain range.Soils and Foundations, 20(4), 45–60, 1980.
Kokusho, T., Y. Yoshida and Y. Esashi. Dynamic properties of soft clays for widestrain range. Soils and Foundations, 22(4), 1–18, 1982.
Kramer, S. L. Geotechnical Earthquake Engineering. Prentice Hall, Upper SaddleRiver, NJ, 1996.
Mellal, A. Analyse des effets du comportement non lineaire des sols sur lemouvement sismique. These de doctorat, Ecole Centrale Paris, France, 1997.
Modaressi, H. and E. Foerster. CyberQuake. User’s manual, BRGM, France, 2000.Pande, G. N. and S. Pietruszczak. A critical look at constitutive models for soils.
In R. Dungar and J.A. Studer, editors, Geomechanical modelling in engineeringpractice, A.A. Balkema, Rotterdam, The Netherlands, pp. 369–395, 1986.
Prevost, J.-H. and K. Hoeg. Effective stress-strain strength model for soils. Journalof Geotechnical Engineering Division - ASCE, 101(nr GT3), 259–278, 1975.
Saim, R. Des comportements reperes des grains sans colle a un exemple de sol reel.These de doctorat, Ecole Centrale Paris, France, 1997.
Santos, J. A. Caracterizacao de solos atraves de ensaios dinamicos e cıclicos detorcao ; Aplicacao ao estudo do comportamento de estacas sob accoes horizon-tais estaticas e dinamicas. Dissertacao Doutor, Universidade Tecnica de Lisboa,Instituto Superior Tecnico, Portugal, 1999.
paper_I_LMM_vc02.tex; 18/12/2006; 14:31; p.25

26 Fernando Lopez-Caballero et al.
Schofield, A. N. and C. P. Wroth. Critical State Soil Mechanics, McGraw-Hill,London, 1968.
Seed, H. B. and I. M. Idriss. Soil moduli and damping factors for dynamic re-sponse analyses. University of California, Berkeley, CA, Report EERC-70-10,Earthquake Engineering Research Center, 1970.
Seed, H. B., R. T. Wong, I. M. Idriss and K. Tokimatsu. Moduli and damping factorsfor dynamic analyses of cohesionless soils. Journal of Geotechnical Engineering- ASCE, 112(11), 1016–1032, 1986.
Sun, J. I., R. Golesorkhi and H. B. Seed. Dynamic moduli and damping ratios forcohesive soils. University of California, Berkeley, CA, EERC-88-15, 1988.
Vucetic, M. Cyclic threshold shear strains in soils. Journal of GeotechnicalEngineering - ASCE, 120(12), 2208–2228, 1994.
Vucetic, M. and R. Dobry. Effect of soil plasticity on cyclic response. Journal ofGeotechnical Engineering - ASCE, 117(1), 89–107, 1991.
paper_I_LMM_vc02.tex; 18/12/2006; 14:31; p.26