noninvasive in vivo glucose sensing on human … · noninvasive in vivo glucose sensing on human...
TRANSCRIPT
Noninvasive in vivo glucose sensing on human subjects using mid-infrared light
Sabbir Liakat,1,* Kevin A. Bors,1 Laura Xu,1 Callie M. Woods,1 Jessica Doyle,1,2 and Claire F. Gmachl1
1 Department of Electrical Engineering, Princeton University, Princeton, NJ 08544, USA 2 Permanent Address: Hunterdon Regional Central High School, Flemington, NJ 08822, USA
Abstract: Mid-infrared quantum cascade laser spectroscopy is used to noninvasively predict blood glucose concentrations of three healthy human subjects in vivo. We utilize a hollow-core fiber based optical setup for light delivery and collection along with a broadly tunable quantum cascade laser to obtain spectra from human subjects and use standard chemo-metric techniques (namely partial least squares regression) for prediction analysis. Throughout a glucose concentration range of 80-160 mg/dL, we achieve clinically accurate predictions 84% of the time, on average. This work opens a new path to a noninvasive in vivo glucose sensor that would benefit the lives of hundreds of millions of diabetics worldwide.
©2014 Optical Society of America
OCIS codes: (170.1470) Blood or tissue constituent monitoring; (300.6340) Spectroscopy, infrared; (140.5965) Semiconductor lasers, quantum cascade.
References and links 1. G. Danaei, M. M. Finucane, Y. Lu, G. M. Singh, M. J. Cowan, C. J. Paciorek, J. K. Lin, F. Farzadfar, Y. H.
Khang, G. A. Stevens, M. Rao, M. K. Ali, L. M. Riley, C. A. Robinson, and M. Ezzati; Global Burden of Metabolic Risk Factors of Chronic Diseases Collaborating Group (Blood Glucose), “National, regional, and global trends in fasting plasma glucose and diabetes prevalence since 1980: systematic analysis of health examination surveys and epidemiological studies with 370 country-years and 2·7 million participants,” Lancet 378(9785), 31–40 (2011).
2. V. Tuchin, Handbook of Optical Sensing of Glucose in Biological Fluids and Tissues (CRC, 2009). 3. O. S. Khalil, “Non-invasive Glucose Measurement Technologies: An Update from 1999 to the Dawn of the New
Millennium,” Diabetes Technol. Ther. 6(5), 660–697 (2004). 4. S. Liakat, K. A. Bors, T. Y. Huang, A. P. Michel, E. Zanghi, and C. F. Gmachl, “In vitro measurements of
physiological glucose concentrations in biological fluids using mid-infrared light,” Biomed. Opt. Express 4(7), 1083–1090 (2013).
5. T. M. Greve, S. Kamp, and G. B. Jemec, “Disease quantification in dermatology: in vivo near-infrared spectroscopy measures correlate strongly with the clinical assessment of psoriasis severity,” J. Biomed. Opt. 18(3), 037006 (2013).
6. R. P. Smith, S. J. Riesenfeld, A. K. Holloway, Q. Li, K. K. Murphy, N. M. Feliciano, L. Orecchia, N. Oksenberg, K. S. Pollard, and N. Ahituv, “A compact, in vivo screen of all 6-mers reveals drivers of tissue-specific expression and guides synthetic regulatory element design,” Genome Biol. 14(7), R72 (2013).
7. G. Nir, R. S. Sahebjavaher, P. Kozlowski, S. D. Chang, R. Sinkus, S. L. Goldenberg, and S. E. Salcudean, “Model-based registration of ex vivo and in vivo MRI of the prostate using elastography,” IEEE Trans. Med. Imaging 32(6), 1068–1080 (2013).
8. K. Maruo, M. Tsurugi, M. Tamura, and Y. Ozaki, “In vivo noninvasive measurement of blood glucose by near-infrared diffuse-reflectance spectroscopy,” Appl. Spectrosc. 57(10), 1236–1244 (2003).
9. N. C. Dingari, I. Barman, G. P. Singh, J. W. Kang, R. R. Dasari, and M. S. Feld, “Investigation of the specificity of Raman spectroscopy in non-invasive blood glucose measurements,” Anal. Bioanal. Chem. 400(9), 2871–2880 (2011).
10. H. Ullah, B. Davoudi, A. Mariampillai, G. Hussain, M. Ikram, and I. A. Vitkin, “Quantification of glucose levels in flowing blood using M-mode swept source optical coherence tomography,” Laser Phys. 22(4), 797–804 (2012).
11. Q. L. Zhao, J. L. Si, Z. Y. Guo, H. J. Wei, H. Q. Yang, G. Y. Wu, S. S. Xie, X. Y. Li, X. Guo, H. Q. Zhong, and L. Q. Li, “Quantifying glucose permeability and enhanced light penetration in ex vivo human normal and cancerous esophagus tissues with optical coherence tomography,” Laser Phys. Lett. 8(1), 71–77 (2011).
#209086 - $15.00 USD Received 1 Apr 2014; revised 31 May 2014; accepted 16 Jun 2014; published 23 Jun 2014(C) 2014 OSA 1 July 2014 | Vol. 5, No. 7 | DOI:10.1364/BOE.5.002397 | BIOMEDICAL OPTICS EXPRESS 2397
12. K. Maruo, T. Oota, M. Tsurugi, T. Nakagawa, H. Arimoto, M. Tamura, Y. Ozaki, and Y. Yamada, “New Methodology to Obtain a Calibration Model for Noninvasive Near-Infrared Blood Glucose Monitoring,” Appl. Spectrosc. 60(4), 441–449 (2006).
13. M. K. Chowdhury, A. Srivastava, N. Sharma, and S. Sharma, “Challenges and countermeasures in optical noninvasive blood glucose detection,” Int. J. Innovative Res. Sci. Eng. Technol. 2(1), 329–334 (2013).
14. M. A. Pleitez, T. Lieblein, A. Bauer, O. Hertzberg, H. von Lilienfeld-Toal, and W. Mäntele, “In vivo Noninvasive Monitoring of Glucose Concentration in Human Epidermis by Mid-Infrared Pulsed Photoacoustic Spectroscopy,” Anal. Chem. 85(2), 1013–1020 (2013).
15. A. Seddon, “Mid-infrared (IR) – A hot topic: The potential for using mid-IR light for non-invasive early detection of skin cancer in vivo,” Phys. Status Solidi, B Basic Res. 250(5), 1020–1027 (2013).
16. S. Liakat, A. P. Michel, K. A. Bors, and C. Gmachl, “Mid-infrared (λ=8.4-9.9 μm) light scattering from porcine tissue,” Appl. Phys. Lett. 101(9), 093705 (2012).
17. A. P. Michel, S. Liakat, K. Bors, and C. F. Gmachl, “In vivo measurement of mid-infrared light scattering from human skin,” Biomed. Opt. Express 4(4), 520–530 (2013).
18. S. N. Thennadil, J. L. Rennert, B. J. Wenzel, K. H. Hazen, T. L. Ruchti, and M. B. Block, “Comparison of Glucose Concentration in Interstitial Fluid, and Capillary and Venous Blood During Rapid Changes in Blood Glucose Levels,” Diabetes Technol. Ther. 3(3), 357–365 (2001).
19. J. S. Li, W. Chen, and H. Fischer, “Quantum Cascade Laser Spectrometry Techniques: A New Trend in Atmospheric Chemistry,” Appl. Spectrosc. Rev. 48(7), 523–559 (2013).
20. M. E. Lamar, T. J. Kuehl, A. T. Cooney, L. J. Gayle, S. Holleman, and S. R. Allen, “Jelly beans as an alternative to a fifty-gram glucose beverage for gestational diabetes screening,” Am. J. Obstet. Gynecol. 181(5), 1154–1157 (1999).
21. J. Jun, J. Harris, J. Humphrey, and S. Rastegar, “Effect of Thermal Damage and Biaxial Loading on the Optical Properties of a Collagenous Tissue,” Transactions of the ASME, 125, 540-548 (2003).
22. S. de Jong, “SIMPLS: an alternative approach to partial least squares regression,” Chemom. Intell. Lab. Syst. 18(3), 251–263 (1993).
23. W. L. Clarke, D. Cox, L. A. Gonder-Frederick, W. Carter, and S. L. Pohl, “Evaluating clinical accuracy of systems for self-monitoring of blood glucose,” Diabetes Care 10(5), 622–628 (1987).
1. Introduction
Diabetes is a disease that adversely impacts the lives of hundreds of millions of people worldwide [1]. The realization of a clinically accurate noninvasive in vivo glucose sensor would remove the need for them to draw blood multiple times a day, a significant improvement to the quality of life for many diabetics. Prior work towards noninvasive glucose sensing has focused predominantly on employing near-infrared light between 1300 and 1900 nm [2]. However, the lack of sufficient distinction of glucose from other proteins and acids in this wavelength range remains a challenge [3] – a challenge that is only now becoming surmountable with the use of the mid-infrared (mid-IR) spectrum, specifically targeting vibrational glucose absorption features between 8 – 10 μm [4]. While the mid-IR regime presents its own unique challenges for in vivo diagnostics (namely high water absorption), we present evidence of clinically accurate glucose predictions using mid-IR Quantum Cascade (QC) laser spectroscopy of backscattered light collected from the human palm, hence opening up a new path to a noninvasive in vivo glucose sensor.
In vivo sensing of contents within human skin has traditionally been relegated to the near-IR region of the electromagnetic spectrum, due to a combination of the presence of strong absorption features for many relevant molecules within this region [5–7], as well as low water absorption allowing for deeper light penetration into skin. Glucose has been no exception; research on developing optical noninvasive glucose sensors to improve the quality of life for diabetics for decades focused exclusively on the near-IR [2, 8–11]. However, the fundamental obstacle for glucose sensing in the near IR is the overlapping absorption features the glucose molecule shares with proteins and acids found in skin, which result in increased complexity and unreliability for separating the impact of glucose on a given spectrum apart from the effect of the other absorbers in that window [12].
The mid-IR region, often dubbed the “fingerprint” region, features strong vibrational resonances for many molecules, including glucose. Unlike in the near-IR, glucose absorption features in this region are much better distinguished from other competing absorbers [13]. The primary challenge for in vivo applications, including glucose sensing, using mid-IR light
#209086 - $15.00 USD Received 1 Apr 2014; revised 31 May 2014; accepted 16 Jun 2014; published 23 Jun 2014(C) 2014 OSA 1 July 2014 | Vol. 5, No. 7 | DOI:10.1364/BOE.5.002397 | BIOMEDICAL OPTICS EXPRESS 2398

is the limited penetration depth in skin due to high water absorption. Reports of mid-IR in vivo applications are only recent and limited [14,15], mainly due to the fairly recent commercialization of powerful and stable enough mid-IR sources, namely QC lasers.
In 2012, we reported the ability to collect backscattered light from upper regions of the dermis layer in vitro from porcine skin [16] and in vivo from human skin [17] by virtue of the highly random angle-dependent scattering patterns detected when using a sufficiently powerful mid-IR QC laser. Having scattered light from such a depth is important because the dermal interstitial fluid (ISF) is known to have a strong correlation with blood glucose levels [18], and blood vessels are generally too deep to reach with mid-IR light. QC lasers of the requisite stability, power, and tuning range have only been a recent development [19]. Furthermore, we reported clinically accurate detection of glucose in vitro in aqueous and serum solution [4] for physiologically significant glucose concentrations, ranging from 50 to 400 mg/dL, demonstrating the powerful potential of utilizing the vibrational resonances of glucose.
Here, we report a noninvasive in vivo glucose sensor that achieves clinically accurate predictions of physiological glucose concentrations for human subjects. The system employs regression methods on data sets of backscattered mid-IR spectra collected from the human palm via a hollow-core fiber probe, with clinical accuracy defined as a predicted value within 20% of the actual value. Changes in spectral features at glucose absorption wavenumbers corresponding to fluctuations in glucose concentrations are observed. Throughout a hundred iterations of randomly selected calibration and test sets, we obtain consistency in prediction error levels, a testament to the stability of spectral acquisition with a hollow-core mid-IR fiber probe, as well as verification of the robustness of the optical technique. In best-case scenarios, we obtain prediction errors approaching that of commercial electrochemical meters, normally requiring a finger prick and blood sample.
2. Experimental setup, data collection, and processing
In vivo glucose sensing using mid-IR spectra was conducted with three healthy human subjects starting on an empty stomach (glucose levels were typically around 80mg/dL at this time) to obtain spectra for their low levels. The subjects then consumed twenty jellybeans, which caused their glucose levels to first rise for about a half an hour and then decline again. Consumption of jellybeans is a standard method for efficiently increasing glucose concentrations in humans [20]. Spectra were taken at various points during this variation (calibrated with a commercial electrochemical meter) to obtain measurements for stronger glucose concentrations. This process of controlled glucose level manipulation was used over the span of several weeks to build a data set for each individual, containing spectra representing a range of concentrations between low and high points (which varied for different subjects – high points ranged from 120 – 160 mg/dL). A diabetic is identified as an individual whose blood glucose concentration does not decrease to less than 140 mg/dL within two hours of a meal. For each subject, spectra representing at least nine distinguishable concentrations, as measured using a commercial electrochemical (finger prick) glucose meter (One Touch Ultra 2), were included in the data set.
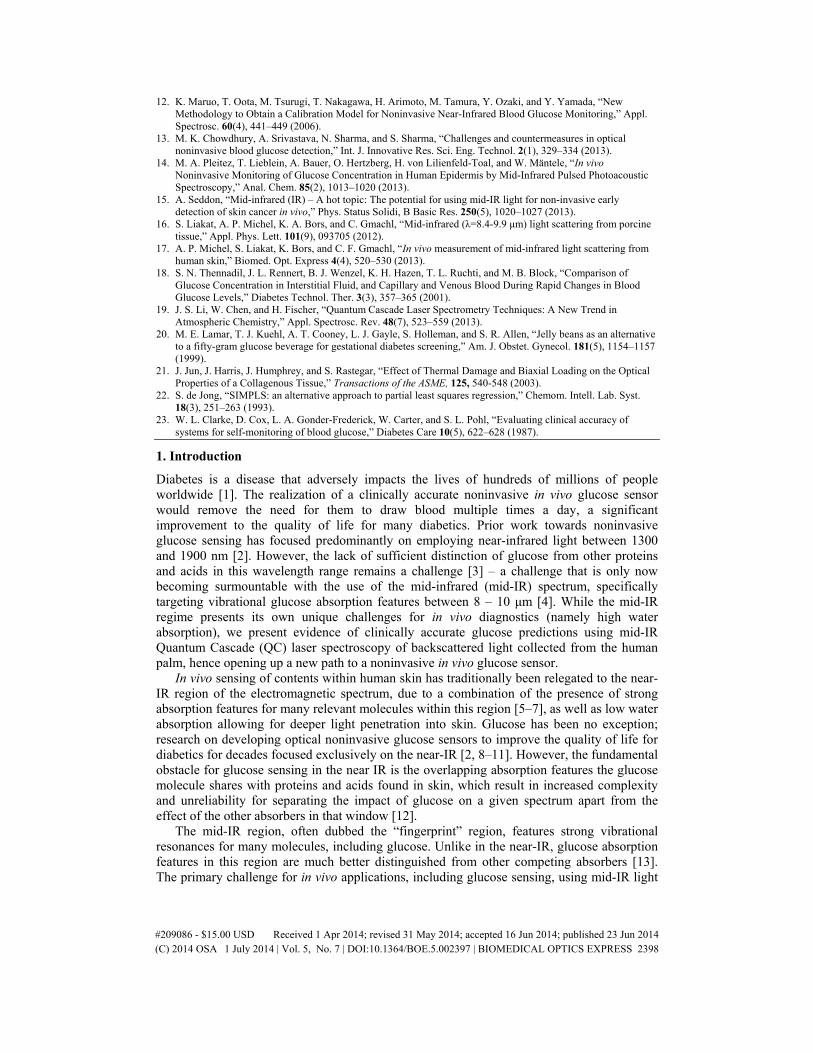
Mid-IR spectra were taken using the setup depicted in Fig. 1: Light from a pulsed Daylight Solutions Inc. external cavity QC laser with a tuning range between 8 – 10 μm was focused into a hollow-core fiber (500 μm diameter, by Opto-Knowledge Systems, Inc.) responsible for delivering light onto a region of the human palm between the thumb and index finger. Laser light incident onto skin was maintained at 55kHz and 1% duty cycle with peak powers of 50 - 125 mW (depending on wavenumber), resulting in average powers that were on the order of the solar radiation and within limits set by ANSI for acceptable radiation intensity on skin. Furthermore, the peak intensity incident onto skin was kept well below
#209086 - $15.00 USD Received 1 Apr 2014; revised 31 May 2014; accepted 16 Jun 2014; published 23 Jun 2014(C) 2014 OSA 1 July 2014 | Vol. 5, No. 7 | DOI:10.1364/BOE.5.002397 | BIOMEDICAL OPTICS EXPRESS 2399
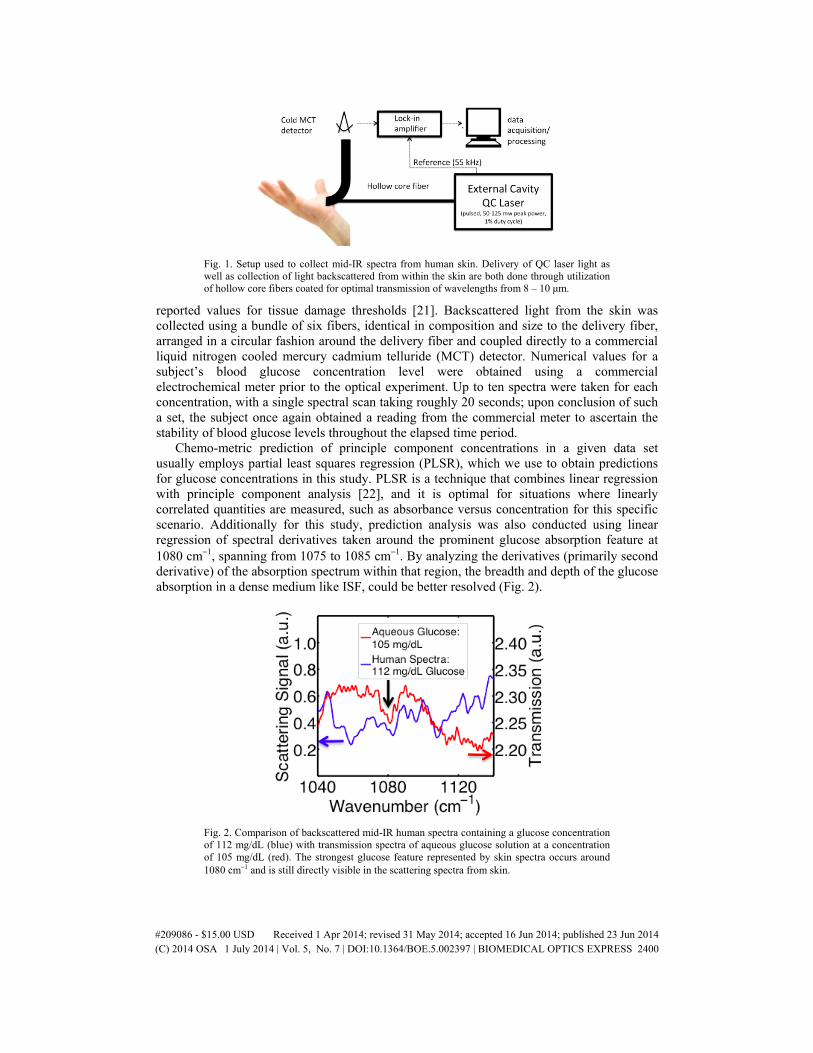
Fig. 1. Setup used to collect mid-IR spectra from human skin. Delivery of QC laser light as well as collection of light backscattered from within the skin are both done through utilization of hollow core fibers coated for optimal transmission of wavelengths from 8 – 10 μm.
reported values for tissue damage thresholds [21]. Backscattered light from the skin was collected using a bundle of six fibers, identical in composition and size to the delivery fiber, arranged in a circular fashion around the delivery fiber and coupled directly to a commercial liquid nitrogen cooled mercury cadmium telluride (MCT) detector. Numerical values for a subject’s blood glucose concentration level were obtained using a commercial electrochemical meter prior to the optical experiment. Up to ten spectra were taken for each concentration, with a single spectral scan taking roughly 20 seconds; upon conclusion of such a set, the subject once again obtained a reading from the commercial meter to ascertain the stability of blood glucose levels throughout the elapsed time period.
Chemo-metric prediction of principle component concentrations in a given data set usually employs partial least squares regression (PLSR), which we use to obtain predictions for glucose concentrations in this study. PLSR is a technique that combines linear regression with principle component analysis [22], and it is optimal for situations where linearly correlated quantities are measured, such as absorbance versus concentration for this specific scenario. Additionally for this study, prediction analysis was also conducted using linear regression of spectral derivatives taken around the prominent glucose absorption feature at 1080 cm−1, spanning from 1075 to 1085 cm−1. By analyzing the derivatives (primarily second derivative) of the absorption spectrum within that region, the breadth and depth of the glucose absorption in a dense medium like ISF, could be better resolved (Fig. 2).
Fig. 2. Comparison of backscattered mid-IR human spectra containing a glucose concentration of 112 mg/dL (blue) with transmission spectra of aqueous glucose solution at a concentration of 105 mg/dL (red). The strongest glucose feature represented by skin spectra occurs around 1080 cm−1 and is still directly visible in the scattering spectra from skin.
#209086 - $15.00 USD Received 1 Apr 2014; revised 31 May 2014; accepted 16 Jun 2014; published 23 Jun 2014(C) 2014 OSA 1 July 2014 | Vol. 5, No. 7 | DOI:10.1364/BOE.5.002397 | BIOMEDICAL OPTICS EXPRESS 2400
Calibration sets contained spectra for four unique concentrations and were chosen as follows. All concentrations measured for a subject were put into a matrix and different calibration sets were created repeatedly through random assignment. PLSR and derivative spectroscopy were performed independently for each random set. While the concentrations for the spectra not used for calibration would be unknown in a real life setting, having each spectra correspond to a concentration measured with a commercial meter allowed for analysis of the accuracy of the values output from regression analysis. The degree of deviation from an ideal one-to-one relationship between predicted values versus their expected values has been used as a standard metric for determining the usefulness of noninvasive glucose sensors.
3. Results and analysis
The standard metric for the determination of acceptable accuracy in a noninvasive glucose sensor has been the Clarke error grid [23]. The grid involves a plot of predicted glucose concentration versus expected (known) concentration, with designated zones representing the degree of harm an erroneous reading would cause for a diabetic. For example, a monitor reading of 100 mg/dL when the actual concentration is 300 mg/dL would be very harmful to a person, as no action would be taken based on the monitor reading, while in reality, the subject would need to take supplemental insulin. Clinical accuracy on the Clarke grid is defined as a prediction within 20% of the expected concentration for concentrations greater than 70 mg/dL. For concentrations under this level, considered the hypoglycemic range, a clinically accurate prediction would be a number that is also in the hypoglycemic range.
The achievement of clinical accuracy in glucose detection using human in vivo mid-IR back-scattered light can be seen in Fig. 3. We display representative Clarke plots from three different (non-diabetic) subjects that participated in this study, using second derivative spectroscopy to predict glucose concentrations from mid-IR spectra. One can determine that the vast majority of predictions obtained, over 70% for any given individual and 84% aggregate, fall within the clinically accurate (green) regime of the Clarke grid, for concentrations as low as 75 mg/dL and as high as 160 mg/dL. Comparison of error metrics such as average percent prediction error, median error, and maximum error throughout the many iterations of randomly chosen calibration sets showed consistency – for both PLSR regression and derivative spectroscopy, average errors between best and worst iterations deviated less than 6%. Average and median errors typically differed from each other by 1-2%, with average error generally being generally higher than the median error. This indicates that a small number of inaccurate predictions were decreasing the average accuracy of a set containing a majority of very accurate predictions (this can be ascertained from Fig. 3 as well). For both PLSR and derivative spectroscopy, worst case average errors hovered around 20%, the hallmark for clinical accuracy, with best case scenarios having average errors as little as 7%.
In this study, second derivative spectroscopy performed slightly more favorably than PLSR (which tended to slightly overshoot predictions), yielding a 4% smaller aggregate average error. Additional error measurements were taken for the expected values themselves; we found the commercial meter to have a 6% variation, on average, for consecutive trials taken with minimal time lapse. Deviations in meter readings were determined to be relatively consistent for both low and high concentrations, which indicates that the reported error did not occur due to measurements during a period of change in the body’s glucose levels. Accounting for a possible 6% error in expected value would work to further increase the average prediction accuracy obtained by both prediction methods.
#209086 - $15.00 USD Received 1 Apr 2014; revised 31 May 2014; accepted 16 Jun 2014; published 23 Jun 2014(C) 2014 OSA 1 July 2014 | Vol. 5, No. 7 | DOI:10.1364/BOE.5.002397 | BIOMEDICAL OPTICS EXPRESS 2401
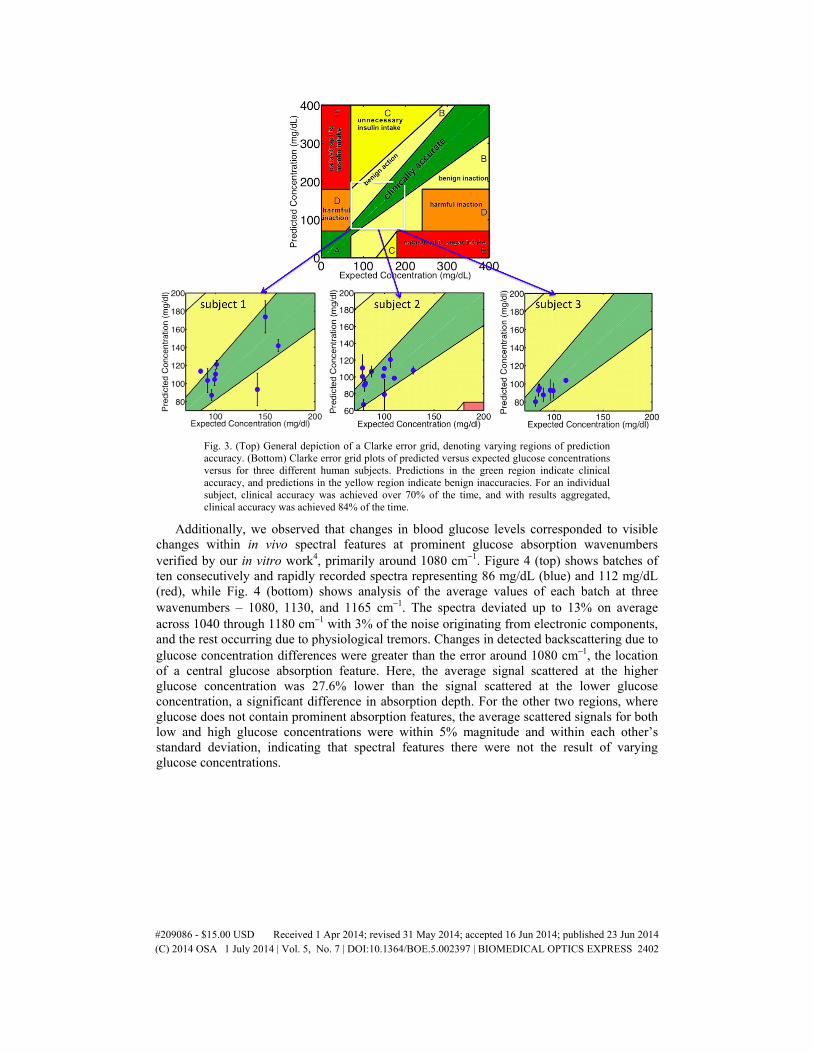
Fig. 3. (Top) General depiction of a Clarke error grid, denoting varying regions of prediction accuracy. (Bottom) Clarke error grid plots of predicted versus expected glucose concentrations versus for three different human subjects. Predictions in the green region indicate clinical accuracy, and predictions in the yellow region indicate benign inaccuracies. For an individual subject, clinical accuracy was achieved over 70% of the time, and with results aggregated, clinical accuracy was achieved 84% of the time.
Additionally, we observed that changes in blood glucose levels corresponded to visible changes within in vivo spectral features at prominent glucose absorption wavenumbers verified by our in vitro work4, primarily around 1080 cm−1. Figure 4 (top) shows batches of ten consecutively and rapidly recorded spectra representing 86 mg/dL (blue) and 112 mg/dL (red), while Fig. 4 (bottom) shows analysis of the average values of each batch at three wavenumbers – 1080, 1130, and 1165 cm−1. The spectra deviated up to 13% on average across 1040 through 1180 cm−1 with 3% of the noise originating from electronic components, and the rest occurring due to physiological tremors. Changes in detected backscattering due to glucose concentration differences were greater than the error around 1080 cm−1, the location of a central glucose absorption feature. Here, the average signal scattered at the higher glucose concentration was 27.6% lower than the signal scattered at the lower glucose concentration, a significant difference in absorption depth. For the other two regions, where glucose does not contain prominent absorption features, the average scattered signals for both low and high glucose concentrations were within 5% magnitude and within each other’s standard deviation, indicating that spectral features there were not the result of varying glucose concentrations.
#209086 - $15.00 USD Received 1 Apr 2014; revised 31 May 2014; accepted 16 Jun 2014; published 23 Jun 2014(C) 2014 OSA 1 July 2014 | Vol. 5, No. 7 | DOI:10.1364/BOE.5.002397 | BIOMEDICAL OPTICS EXPRESS 2402
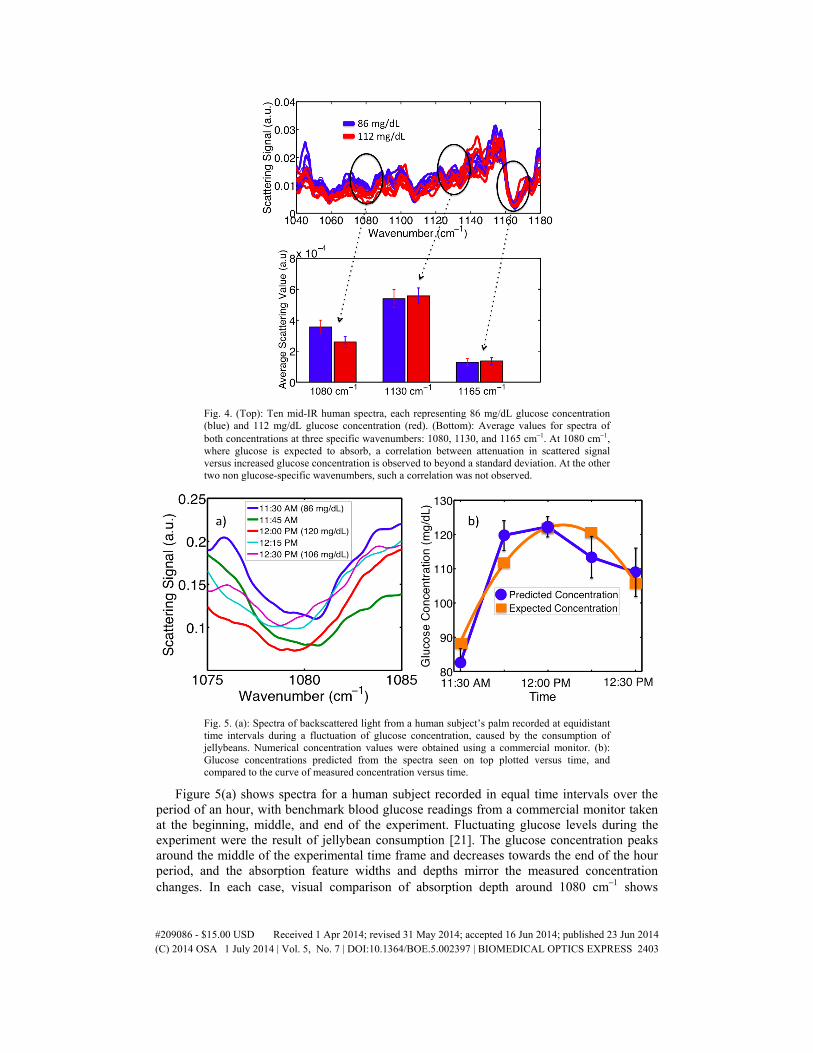
Fig. 4. (Top): Ten mid-IR human spectra, each representing 86 mg/dL glucose concentration (blue) and 112 mg/dL glucose concentration (red). (Bottom): Average values for spectra of both concentrations at three specific wavenumbers: 1080, 1130, and 1165 cm−1. At 1080 cm−1, where glucose is expected to absorb, a correlation between attenuation in scattered signal versus increased glucose concentration is observed to beyond a standard deviation. At the other two non glucose-specific wavenumbers, such a correlation was not observed.
Fig. 5. (a): Spectra of backscattered light from a human subject’s palm recorded at equidistant time intervals during a fluctuation of glucose concentration, caused by the consumption of jellybeans. Numerical concentration values were obtained using a commercial monitor. (b): Glucose concentrations predicted from the spectra seen on top plotted versus time, and compared to the curve of measured concentration versus time.
Figure 5(a) shows spectra for a human subject recorded in equal time intervals over the period of an hour, with benchmark blood glucose readings from a commercial monitor taken at the beginning, middle, and end of the experiment. Fluctuating glucose levels during the experiment were the result of jellybean consumption [21]. The glucose concentration peaks around the middle of the experimental time frame and decreases towards the end of the hour period, and the absorption feature widths and depths mirror the measured concentration changes. In each case, visual comparison of absorption depth around 1080 cm−1 shows
#209086 - $15.00 USD Received 1 Apr 2014; revised 31 May 2014; accepted 16 Jun 2014; published 23 Jun 2014(C) 2014 OSA 1 July 2014 | Vol. 5, No. 7 | DOI:10.1364/BOE.5.002397 | BIOMEDICAL OPTICS EXPRESS 2403
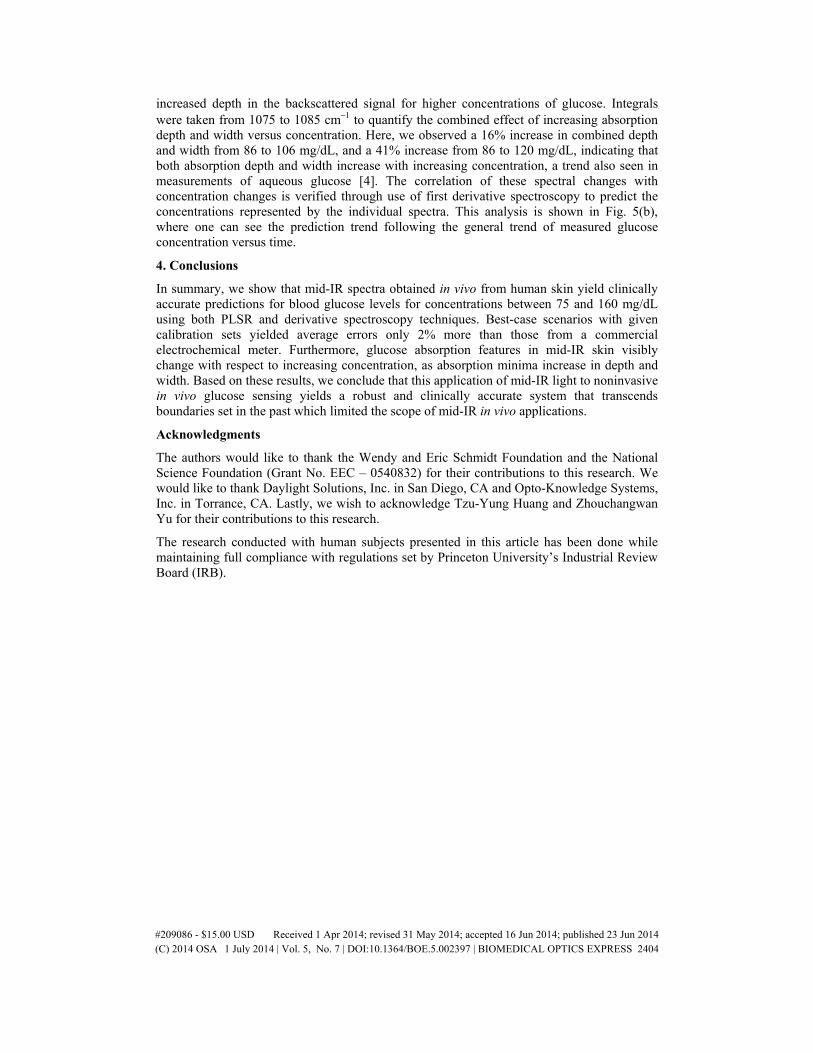
increased depth in the backscattered signal for higher concentrations of glucose. Integrals were taken from 1075 to 1085 cm−1 to quantify the combined effect of increasing absorption depth and width versus concentration. Here, we observed a 16% increase in combined depth and width from 86 to 106 mg/dL, and a 41% increase from 86 to 120 mg/dL, indicating that both absorption depth and width increase with increasing concentration, a trend also seen in measurements of aqueous glucose [4]. The correlation of these spectral changes with concentration changes is verified through use of first derivative spectroscopy to predict the concentrations represented by the individual spectra. This analysis is shown in Fig. 5(b), where one can see the prediction trend following the general trend of measured glucose concentration versus time.
4. Conclusions
In summary, we show that mid-IR spectra obtained in vivo from human skin yield clinically accurate predictions for blood glucose levels for concentrations between 75 and 160 mg/dL using both PLSR and derivative spectroscopy techniques. Best-case scenarios with given calibration sets yielded average errors only 2% more than those from a commercial electrochemical meter. Furthermore, glucose absorption features in mid-IR skin visibly change with respect to increasing concentration, as absorption minima increase in depth and width. Based on these results, we conclude that this application of mid-IR light to noninvasive in vivo glucose sensing yields a robust and clinically accurate system that transcends boundaries set in the past which limited the scope of mid-IR in vivo applications.
Acknowledgments
The authors would like to thank the Wendy and Eric Schmidt Foundation and the National Science Foundation (Grant No. EEC – 0540832) for their contributions to this research. We would like to thank Daylight Solutions, Inc. in San Diego, CA and Opto-Knowledge Systems, Inc. in Torrance, CA. Lastly, we wish to acknowledge Tzu-Yung Huang and Zhouchangwan Yu for their contributions to this research.
The research conducted with human subjects presented in this article has been done while maintaining full compliance with regulations set by Princeton University’s Industrial Review Board (IRB).
#209086 - $15.00 USD Received 1 Apr 2014; revised 31 May 2014; accepted 16 Jun 2014; published 23 Jun 2014(C) 2014 OSA 1 July 2014 | Vol. 5, No. 7 | DOI:10.1364/BOE.5.002397 | BIOMEDICAL OPTICS EXPRESS 2404