noninvasive glucose sensing by transcutaneous raman ... · noninvasive glucose sensing by...
TRANSCRIPT
Noninvasive glucose sensing bytranscutaneous Raman spectroscopy
Wei-Chuan ShihKate L. BechtelMihailo V. Rebec
Downloaded From: https://www.spiedigitallibrary.org/journals/Journal-of-Biomedical-Optics on 26 Jun 2020Terms of Use: https://www.spiedigitallibrary.org/terms-of-use
Noninvasive glucose sensing by transcutaneousRaman spectroscopy
Wei-Chuan Shih,a,b,c,* Kate L. Bechtel,c,† and Mihailo V. Rebecd
aUniversity of Houston, Department of Electrical and Computer Engineering, 4800 Calhoun Road, Houston, Texas 77204, United StatesbUniversity of Houston, Department of Biomedical Engineering, 4800 Calhoun Road, Houston, Texas 77204, United StatescSpectroscopy Laboratory, Massachusetts Institute of Technology, Cambridge, Massachusetts 02139, United StatesdiSense CGM, 27700SW 95th Avenue, Wilsonville, Oregon 97070, United States
Abstract. We present the development of a transcutaneous Raman spectroscopy system and analysis algo-rithm for noninvasive glucose sensing. The instrument and algorithm were tested in a preclinical study in which adogmodel was used. To achieve a robust glucose test system, the blood levels were clamped for periods of up to45 min. Glucose clamping and rise/fall patterns have been achieved by injecting glucose and insulin into the earveins of the dog. Venous blood samples were drawn every 5 min and a plasma glucose concentration wasobtained and used to maintain the clamps, to build the calibration model, and to evaluate the performanceof the system. We evaluated the utility of the simultaneously acquired Raman spectra to be used to determinethe plasma glucose values during the 8-h experiment. We obtained prediction errors in the range of∼1.5 − 2 mM. These were in-line with a best-case theoretical estimate considering the limitations of the sig-nal-to-noise ratio estimates. As expected, the transition regions of the clamp study produced larger predictiveerrors than the stable regions. This is related to the divergence of the interstitial fluid (ISF) and plasma glucosevalues during those periods. Two key contributors to error beside the ISF/plasma difference were photobleach-ing and detector drift. The study demonstrated the potential of Raman spectroscopy in noninvasive applicationsand provides areas where the technology can be improved in future studies. © 2015 Society of Photo-Optical Instrumentation
Engineers (SPIE) [DOI: 10.1117/1.JBO.20.5.051036]
Keywords: Raman spectroscopy; noninvasive glucose sensing; multivariate calibration; partial least squares.
Paper 140708SSR received Oct. 29, 2014; accepted for publication Jan. 19, 2015; published online Feb. 17, 2015.
1 IntroductionApplications of spectroscopy techniques to biological and bio-medical problems have been rapidly advancing in recentyears.1–3 Based on inelastic scattering, Raman spectroscopy, asa type of vibrational spectroscopy, provides extremely richmolecular information about multiple chemical species present ina sample/specimen simultaneously.4–13 The intensity of a Ramansignal bears a linear relationship to the analyte concentrations,therefore, Raman spectroscopy can be used as a quantitative toolin concentration measurements as well.1,4,5,14–17 An ultimate goalin this field is to develop Raman spectroscopy-based techniquesfor biomedical applications through instrumentation,18–22 plas-monic substrates,23–27 devices,28,29 assays,30,31 and techniques.32,33
Raman spectroscopic measurements, like other optical tech-niques, pose minimal danger from exposure to ionizing radia-tion due to the low-energy optical radiation exposure. Oneadditional advantage of the NIR source used in Raman isthat the tissue sampling region is much deeper than those pro-vided by other optical approaches due to the reduced tissuescattering and reduced water and chromophore absorption atthose wavelengths. As a result, NIR Raman spectroscopy satis-fies two critical prerequisites for a truly noninvasive techniqueto transcutaneously monitor clinically important chemicalsin vivo.14,21,34–36 Nevertheless, noninvasive techniques of thiskind will be valuable in a wide variety of clinical settingsand laboratory tests.
We have employed multivariate calibration techniques suchas partial least squares (PLS) and constrained regularization tononinvasive glucose sensing using Raman spectroscopy.1,14,16,17
Glucose is a convenient analyte to study because its concentra-tion can be conveniently altered and monitored in humans andother living animals such as dogs. The dog model provides sev-eral advantages such as a similar physiological glucose responseas humans, no motion artifacts owing to the anesthesia that canbe administered, and the flexibility to perform glucose clampingstudies.
The dog study described in this paper was performed on abeagle anesthetized for ∼8 h, during which its blood glucoseconcentration was clamped at several different levels. Ramanspectra were continuously acquired from the ear and referenceblood glucose measurements were taken using plasma glucoseobtained from venous blood draws. Results from PLS analysesdemonstrate that the calibration model can predict samples thatwere not included in the calibration set. The PLS analysisincluded a leave-one-level-out analysis, and thus representsa step in the direction of a completely prospective analysis.
2 Methods
2.1 Raman System
The Raman system for this study was modified from the previ-ously published version for human volunteers.14 The geometryof the light delivery path was modified to allow the excitation
*Address all correspondence to: Wei-Chuan Shih, E-mail: [email protected]
†Current address: Triple Ring Technologies, Newark, California, United States 1083-3668/2015/$25.00 © 2015 SPIE
Journal of Biomedical Optics 051036-1 May 2015 • Vol. 20(5)
Journal of Biomedical Optics 20(5), 051036 (May 2015)
Downloaded From: https://www.spiedigitallibrary.org/journals/Journal-of-Biomedical-Optics on 26 Jun 2020Terms of Use: https://www.spiedigitallibrary.org/terms-of-use
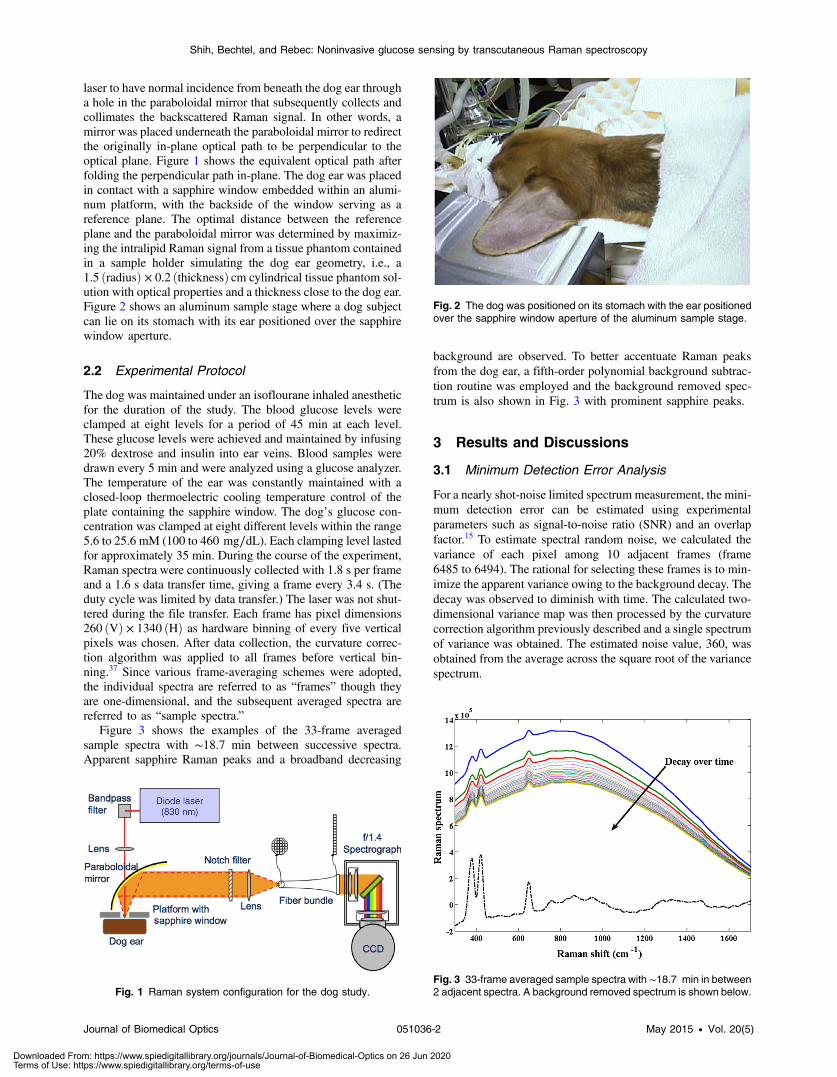
laser to have normal incidence from beneath the dog ear througha hole in the paraboloidal mirror that subsequently collects andcollimates the backscattered Raman signal. In other words, amirror was placed underneath the paraboloidal mirror to redirectthe originally in-plane optical path to be perpendicular to theoptical plane. Figure 1 shows the equivalent optical path afterfolding the perpendicular path in-plane. The dog ear was placedin contact with a sapphire window embedded within an alumi-num platform, with the backside of the window serving as areference plane. The optimal distance between the referenceplane and the paraboloidal mirror was determined by maximiz-ing the intralipid Raman signal from a tissue phantom containedin a sample holder simulating the dog ear geometry, i.e., a1.5 ðradiusÞ × 0.2 ðthicknessÞ cm cylindrical tissue phantom sol-ution with optical properties and a thickness close to the dog ear.Figure 2 shows an aluminum sample stage where a dog subjectcan lie on its stomach with its ear positioned over the sapphirewindow aperture.
2.2 Experimental Protocol
The dog was maintained under an isoflourane inhaled anestheticfor the duration of the study. The blood glucose levels wereclamped at eight levels for a period of 45 min at each level.These glucose levels were achieved and maintained by infusing20% dextrose and insulin into ear veins. Blood samples weredrawn every 5 min and were analyzed using a glucose analyzer.The temperature of the ear was constantly maintained with aclosed-loop thermoelectric cooling temperature control of theplate containing the sapphire window. The dog’s glucose con-centration was clamped at eight different levels within the range5.6 to 25.6 mM (100 to 460 mg∕dL). Each clamping level lastedfor approximately 35 min. During the course of the experiment,Raman spectra were continuously collected with 1.8 s per frameand a 1.6 s data transfer time, giving a frame every 3.4 s. (Theduty cycle was limited by data transfer.) The laser was not shut-tered during the file transfer. Each frame has pixel dimensions260 ðVÞ × 1340 ðHÞ as hardware binning of every five verticalpixels was chosen. After data collection, the curvature correc-tion algorithm was applied to all frames before vertical bin-ning.37 Since various frame-averaging schemes were adopted,the individual spectra are referred to as “frames” though theyare one-dimensional, and the subsequent averaged spectra arereferred to as “sample spectra.”
Figure 3 shows the examples of the 33-frame averagedsample spectra with ∼18.7 min between successive spectra.Apparent sapphire Raman peaks and a broadband decreasing
background are observed. To better accentuate Raman peaksfrom the dog ear, a fifth-order polynomial background subtrac-tion routine was employed and the background removed spec-trum is also shown in Fig. 3 with prominent sapphire peaks.
3 Results and Discussions
3.1 Minimum Detection Error Analysis
For a nearly shot-noise limited spectrum measurement, the mini-mum detection error can be estimated using experimentalparameters such as signal-to-noise ratio (SNR) and an overlapfactor.15 To estimate spectral random noise, we calculated thevariance of each pixel among 10 adjacent frames (frame6485 to 6494). The rational for selecting these frames is to min-imize the apparent variance owing to the background decay. Thedecay was observed to diminish with time. The calculated two-dimensional variance map was then processed by the curvaturecorrection algorithm previously described and a single spectrumof variance was obtained. The estimated noise value, 360, wasobtained from the average across the square root of the variancespectrum.
Fig. 1 Raman system configuration for the dog study.
Fig. 2 The dog was positioned on its stomach with the ear positionedover the sapphire window aperture of the aluminum sample stage.
Fig. 3 33-frame averaged sample spectra with ∼18.7 min in between2 adjacent spectra. A background removed spectrum is shown below.
Journal of Biomedical Optics 051036-2 May 2015 • Vol. 20(5)
Shih, Bechtel, and Rebec: Noninvasive glucose sensing by transcutaneous Raman spectroscopy
Downloaded From: https://www.spiedigitallibrary.org/journals/Journal-of-Biomedical-Optics on 26 Jun 2020Terms of Use: https://www.spiedigitallibrary.org/terms-of-use
The Raman spectrum of glucose was obtained from a 50-mMglucose water solution contained in the dog-ear-like sapphiresample holder. The norm of the glucose signal was calculatedto be ∼56 mM−1 using either a pixel range 240 to 1040 or200 to 1200. The overlap factor for the experiment was estimatedto be ∼1.2 to 1.4 using the nine-component model described ear-lier. Using a previously developed theory, the minimum detectionerror based on these experimental parameters is ∼8.36 to 9 mM(using raw frames).15 If frame averaging is performed,ΔC is 1.46to 1.57 mM and 1.04 to 1.11 mM for 33- and 65- frame averag-ing, respectively. Note that the ΔC formalism considers only ran-dom noise in the predicted spectra, not the calibration spectra northe reference concentration, i.e., an absolutely correct model.
3.2 Preprocessing
Additional preprocessing steps were implemented besides thebackground removal mentioned earlier. Among the 6498frames, we observed that the laser intensity fluctuated at twofixed frequencies, causing fluctuations at the same frequenciesin the collected frames. Fourier filtering was employed to effec-tively remove the slowly varying laser intensity fluctuations.Owing to the high SNR, the charge-coupled device fixed patternnoise was very significant. We first heavily smoothed the samplespectrum using a 101-point Savitzky–Golay filter and then sub-tracted the smoothed spectrum from the original sample spectrato identify the fixed pattern noise. The fixed pattern noise inindividual frames was subsequently removed according to inten-sity levels.
3.3 Partial Least Squares Analysis with CrossValidation
Various datasets were formed for PLS analysis using leave-one-out cross validation with differences in the following aspects:
number of frames averaged; with or without 25-pt Savitzky–Golay smoothing; and spectral range selection.
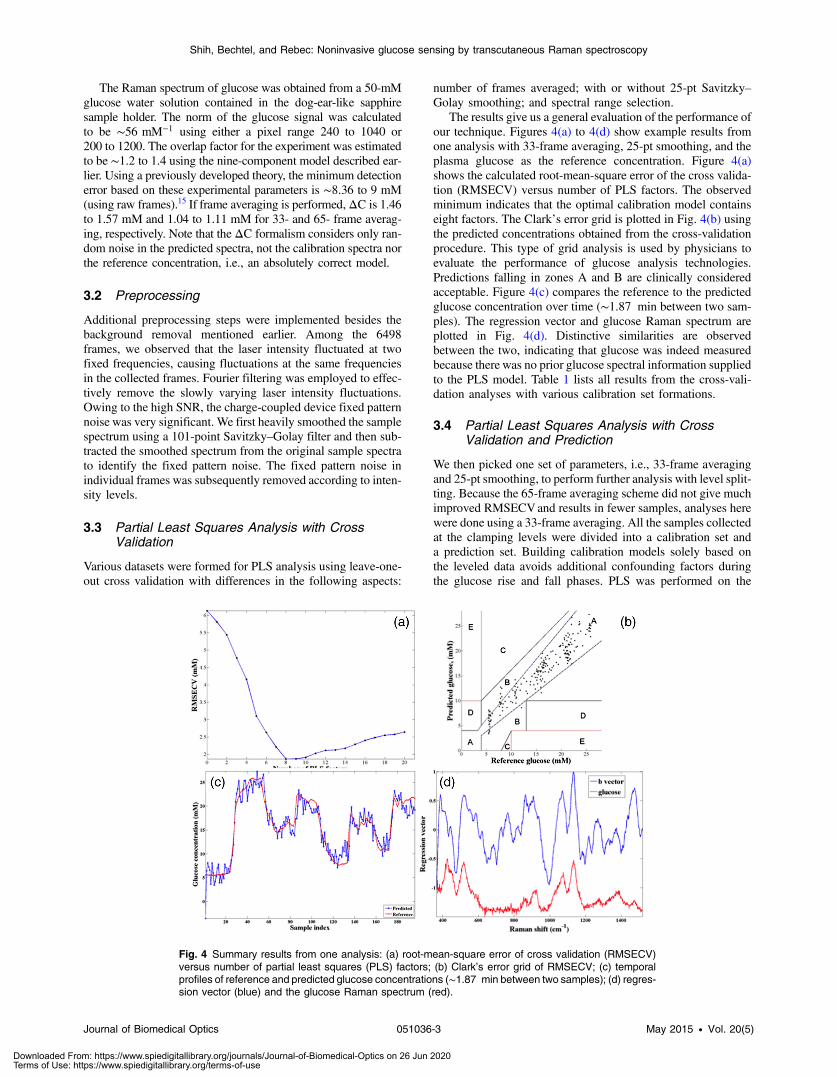
The results give us a general evaluation of the performance ofour technique. Figures 4(a) to 4(d) show example results fromone analysis with 33-frame averaging, 25-pt smoothing, and theplasma glucose as the reference concentration. Figure 4(a)shows the calculated root-mean-square error of the cross valida-tion (RMSECV) versus number of PLS factors. The observedminimum indicates that the optimal calibration model containseight factors. The Clark’s error grid is plotted in Fig. 4(b) usingthe predicted concentrations obtained from the cross-validationprocedure. This type of grid analysis is used by physicians toevaluate the performance of glucose analysis technologies.Predictions falling in zones A and B are clinically consideredacceptable. Figure 4(c) compares the reference to the predictedglucose concentration over time (∼1.87 min between two sam-ples). The regression vector and glucose Raman spectrum areplotted in Fig. 4(d). Distinctive similarities are observedbetween the two, indicating that glucose was indeed measuredbecause there was no prior glucose spectral information suppliedto the PLS model. Table 1 lists all results from the cross-vali-dation analyses with various calibration set formations.
3.4 Partial Least Squares Analysis with CrossValidation and Prediction
We then picked one set of parameters, i.e., 33-frame averagingand 25-pt smoothing, to perform further analysis with level split-ting. Because the 65-frame averaging scheme did not give muchimproved RMSECVand results in fewer samples, analyses herewere done using a 33-frame averaging. All the samples collectedat the clamping levels were divided into a calibration set anda prediction set. Building calibration models solely based onthe leveled data avoids additional confounding factors duringthe glucose rise and fall phases. PLS was performed on the
Fig. 4 Summary results from one analysis: (a) root-mean-square error of cross validation (RMSECV)versus number of partial least squares (PLS) factors; (b) Clark’s error grid of RMSECV; (c) temporalprofiles of reference and predicted glucose concentrations (∼1.87 min between two samples); (d) regres-sion vector (blue) and the glucose Raman spectrum (red).
Journal of Biomedical Optics 051036-3 May 2015 • Vol. 20(5)
Shih, Bechtel, and Rebec: Noninvasive glucose sensing by transcutaneous Raman spectroscopy
Downloaded From: https://www.spiedigitallibrary.org/journals/Journal-of-Biomedical-Optics on 26 Jun 2020Terms of Use: https://www.spiedigitallibrary.org/terms-of-use

calibration set to calculate RMSECV and the b vector, whichwas subsequently used to predict on the prediction set withthe root-mean-square error of prediction (RMSEP). The b vectorwas then used to predict on all samples except the calibrationsamples, excluding the samples during glucose rise and fallphases, to calculate RMSEP1, and including the samples duringglucose rise or fall phases to calculate RMSEP2 and R2. Table 2lists all results from the level-splitting analysis. The higher val-ues observed in RMSEP2 suggest that the divergence betweenISF and plasma glucose is significant during the glucose rise andfall phases, which could not be corrected for using the calibra-tion models based on leveled regions. These RMSEP valuesagree with the minimum detection error estimated earlier.
The next analysis was to form the calibration set with onelevel entirely left out, and then predict on the left-out level(RMSEP1) and all samples not included in the calibration set(RMSEP2). Results are summarized in Table 3. It is observedthat the RMSEP2 for level 1 is much higher than for other levels.This is because fluorescence photobleaching was most
significant during that time and also the instrument and exper-imental subject needed a warm up time.
Finally, two randomized concentration profiles were used todemonstrate that the previous calibration models are indeedpredictive. In the first case, random concentrations in the exper-imental range were paired with measured spectra. In the secondcase, the order of the reference concentration measurements wasrandomly scrambled. As shown in Table 4, result from thesetests suggests RMSEP >7.5 mM with a model that lacks pre-diction capability. Therefore, results from previous calibrationmodels are predictive for glucose concentration.
4 ConclusionsThis paper describes an in vivo survival dog study performed ona beagle anesthetized for ∼8 h, during which its blood glucoseconcentration was clamped at several different levels. A glucoseclamping study allows better disentangling of systematic effectsfrom real glucose changes. Raman spectra were continuouslyacquired from the ear and reference blood glucose measure-ments were taken via venous blood draw. Using only thelevel data, RMSEP on the order of 1.5 to 2 mM (10% of theaverage concentration) was obtained, agreeing with the mini-mum detection error analysis. This RMSEP is higher thanneeded for diabetic patients. However, the average glucoselevel in the dog study (∼15 mM) was significantly higherthan the fasting concentration in human subjects. Since it is criti-cally important to accurately determine glucose concentrationnear hypoglycemia, future experimental designs will include
Table 1 Cross-validation analysis with various preprocessing andparameters.
Preprocessing
Statistics
RMSECV (mM) R2
65f, 365 − 1519 cm−1 2.03 0.89
65f, 25 pt, 365 − 1519 cm−1 1.84 0.91
65f, 25 pt, 297–628 cm−1 2.91 0.77
65f, 25 pt, 297–1703 cm−1 1.56 0.93
65f, 25 pt, 1–1703 cm−1 1.83 0.79
65f, 25 pt, 297 − 1703 cm−1, 5op 1.72 0.92
33f, 365–1519 cm−1 2.06 0.89
33f, 25 pt, 365–1519 cm−1 1.87 0.91
33f, 25 pt, 297–628 cm−1 3.10 0.74
33f, 25 pt, 297–1703 cm−1 1.65 0.93
33f, 25 pt, 1–1703 cm−1 1.67 0.93
33f, 25 pt, 297 − 1703 cm−1 5op 1.76 0.92
Table 2 Level-splitting analysis with various preprocessing andparameters.
Referencewavenumberrange
Statistics
RMSECV(mM)
RMSEP1(mM)
RMSEP2(mM) R2
365−1519 cm−1 1.78�0.18 1.77�0.22 2.19�0.24 0.93�0.01
297–1703 cm−1 1.78�0.18 1.77�0.22 2.19�0.24 0.94�0.01
297–1703 cm−1,5op
1.47�0.14 1.4�0.12 2.06�0.09 0.94�0.01
Table 3 Leave-one-level-out analysis with various preprocessingand parameters.
Preprocessing
Statistics
RMSECV(mM)
RMSEP1(mM)
RMSEP2(mM) R2
Level 1 1.81� 0.17 1.84� 0.29 4.83� 2.55 0.83� 0.08
Level 2 1.9� 0.25 1.88� 0.26 2.66� 0.55 0.92� 0.03
Level 3 1.84� 0.24 1.88� 0.26 2.81� 0.49 0.91� 0.03
Level 4 1.89� 0.19 1.85� 0.23 2.82� 0.54 0.91� 0.03
Level 5 1.83� 0.42 1.76� 0.27 2.73� 0.34 0.90� 0.03
Level 6 1.89� 0.34 1.83� 0.55 2.25� 0.58 0.93� 0.02
Level 7 1.88� 0.14 1.82� 0.26 2.38� 0.27 0.92� 0.02
Level 8 1.63� 0.14 1.63� 0.23 3.08� 0.29 0.87� 0.03
Table 4 Randomized concentration analysis.
Preprocessing
Statistics
RMSECV(mM)
RMSEP1(mM)
RMSEP2(mM) R2
Scheme 1 7.56� 0.78 7.56� 0.5 7.72� 0.4 0.06� 0.07
Scheme 2 7.83� 14 7.94� 0.61 7.72� 0.5 –0.01� 0.07
Journal of Biomedical Optics 051036-4 May 2015 • Vol. 20(5)
Shih, Bechtel, and Rebec: Noninvasive glucose sensing by transcutaneous Raman spectroscopy
Downloaded From: https://www.spiedigitallibrary.org/journals/Journal-of-Biomedical-Optics on 26 Jun 2020Terms of Use: https://www.spiedigitallibrary.org/terms-of-use

lower clamping concentrations. Distinctive similarities wereobserved between the resulting b vector and the glucoseRaman spectrum measured in water, indicating that glucosewas indeed measured. We have identified the photobleachingof tissue autofluorescence to be a key error source from theresults of the leave-level 1-out analysis. A potential strategyfor a mitigating scheme was suggested.38 Results from thisstudy demonstrate the feasibility of detecting glucose in vivousing transcutaneous Raman spectroscopy. In addition, theanalyses and results provide valuable insights for improvingour technique for future studies.
AcknowledgmentsWCS acknowledges funding from the National ScienceFoundation (NSF) CAREER Award (No. CBET-1151154),the National Aeronautics and Space Administration (NASA)Early Career Faculty Grant (No. NNX12AQ44G), Gulf ofMexico Research Initiative (GoMRI-030), and Cullen Collegeof Engineering at the University of Houston. This work was ini-tially performed at the MIT Laser Biomedical Research Centersupported by the NIH National Center for Research Resources,Grant No. P41-RR02594. We thank Professor Michael S. Feld(1940 to 2010) and Dr. Ramachandra R. Dasari for their mentor-ship and guidance.
References1. W. C. Shih, K. L. Bechtel, and M. S. Feld, Handbook Of Optical
Sensing Of Glucose In Biological Fluids And Tissues, CRC Press,New York (2008).
2. V. Tuchin, Tissue Optics: Light Scattering Methods and Instruments forMedical Diagnosis, 2nd ed., SPIE Press Monograph, Bellingham,Washington (2007).
3. M. G. Ghosn, V. V. Tuchin, and K. V. Larin, “Depth-resolved monitor-ing of glucose diffusion in tissues by using optical coherence tomog-raphy,” Opt. Lett. 31(15), 2314–2316 (2006).
4. K. L. Bechtel, W. C. Shih, and M. S. Feld, “Intrinsic Raman spectros-copy for quantitative biological spectroscopy Part II: experimentalapplications,” Opt. Express 16(17), 12737–12745 (2008).
5. W. C. Shih, K. L. Bechtel, and M. S. Feld, “Intrinsic Raman spectros-copy for quantitative biological spectroscopy Part I: theory and simu-lations,” Opt. Express 16(17), 12726–12736 (2008).
6. J. Zeng et al., “Analysis of ethyl and methyl centralite vibrational spectrafor mapping organic gunshot residues,” Analyst 139(17), 4270–4278(2014).
7. G. J. Puppels et al., “Studying single living cells and chromosomes byconfocal Raman microspectroscopy,” Nature 347(6290), 301–303(1990).
8. A. Mahadevan-Jansen et al., “Near-infrared Raman spectroscopy forin vitro detection of cervical precancers,” Photochem. Photobiol.68(1), 123–132 (1998).
9. A. J. Berger et al., “Multicomponent blood analysis by near-infraredRaman spectroscopy,” Appl. Opt. 38(13), 2916–2926 (1999).
10. K. Maquelin et al., “Raman spectroscopic method for identification ofclinically relevant microorganisms growing on solid culture medium,”Anal. Chem. 72(1), 12–19 (2000).
11. H. Ding et al., “Development of Raman spectral markers to assess meta-static bone in breast cancer,” J. Biomed. Opt. 19(11), 111606 (2014).
12. N. Sudheendran et al., “Line-scan Raman microscopy complementsoptical coherence tomography for tumor boundary detection,” LaserPhys. Lett. 11(10), 105602 (2014).
13. Y. Li et al., “Micro-Raman spectroscopy study of cancerous and normalnasopharyngeal tissues,” J. Biomed. Opt. 18(2), 027003 (2013).
14. A. M. K. Enejder et al., “Raman spectroscopy for noninvasive glucosemeasurements,” J. Biomed. Opt. 10(3), 031114 (2005).
15. O. R. Scepanovic et al., “Determination of uncertainty in parametersextracted from single spectroscopic measurements,” J. Biomed. Opt.12(6), 064012 (2007).
16. W. C. Shih, K. L. Bechtel, and M. S. Feld, “Constrained regularization:hybrid method for multivariate calibration,” Anal. Chem. 79(1), 234–239 (2007).
17. W.-C. Shih, K. Bechtel, and M. Feld, In Vivo Glucose Measurements,John Wiley & Sons, Inc. (2009).
18. J. Qi and W.-C. Shih, “Parallel Raman microspectroscopy using pro-grammable multi-point illumination,” Opt. Lett. 37(8), 1289–1291(2012).
19. J. Qi, J. Li, and W.-C. Shih, “High-speed hyperspectral Raman imagingfor label-free compositional microanalysis,” Biomed. Opt. Express4(11), 2376–2382 (2013).
20. J. Qi and W. C. Shih, “Performance of line-scan Raman microscopy(LSRM) for high-throughput chemical imaging of cell population,”Appl. Opt. 53(13), 2881–2885 (2014).
21. Z. W. Huang et al., “Rapid near-infrared Raman spectroscopy systemfor real-time in vivo skin measurements,” Opt. Lett. 26(22), 1782–1784(2001).
22. M. S. Bergholt, W. Zheng, and Z. Huang, “Development of a multiplex-ing fingerprint and high wavenumber Raman spectroscopy techniquefor real-time in vivo tissue Raman measurements at endoscopy,”J. Biomed. Opt. 18(3), 030502 (2013).
23. M. M. P. Arnob et al., “Laser rapid thermal annealing enables tunableplasmonics in nanoporous gold nanoparticles,” Nanoscale 6(21),12470–12475 (2014).
24. F. Zhao et al., “Monolithic NPG nanoparticles with large surface area,tunable plasmonics, and high-density internal hot-spots,” Nanoscale6(8199–8207 (2014).
25. J. Zneg et al., “Internal and external morphology-dependent plasmonicresonance in monolithic nanoporous gold nanoparticles,” RSC Adv.4(36682–36688 (2014).
26. J. Qi et al., “Surface-enhanced Raman spectroscopy with monolithicnanoporous gold disk substrates,” Nanoscale 5(10), 4105–4109 (2013).
27. H. Wang et al., “Quantitative analysis of creatinine in urine by metalizednanostructured parylene,” J. Biomed. Opt. 15(2), 027004 (2010).
28. M. Li et al., “Microfluidic surface-enhanced Raman scattering sensorwith monolithically integrated nanoporous gold disk arrays for rapidand label-free biomolecular detection,” J. Biomed. Opt. 19(11), 111611(2014).
29. K. W. Kho et al., “Polymer-based microfluidics with surface-enhancedRaman-spectroscopy-active periodic metal nanostructures for biofluidanalysis,” J. Biomed. Opt. 13(5), 054026 (2008).
30. J. Qi et al., “Label-free, in situ SERS monitoring of individualDNA hybridization in microfluidics,” Nanoscale 6(15), 8521–8526(2014).
31. P. Z. McVeigh et al., “Widefield quantitative multiplex surface enhancedRaman scattering imaging in vivo,” J. Biomed. Opt. 18(4), 046011(2013).
32. M. Li et al., “Stamping surface-enhanced Raman spectroscopy forlabel-free, multiplexed, molecular sensing and imaging,” J. Biomed.Opt. 19(5), 050501 (2014).
33. S. M. Stranahan and K. A. Willets, “Super-resolution optical imaging ofsingle-molecule SERS hot spots,” Nano Lett. 10(9), 3777–3784 (2010).
34. J. L. Lambert et al., “Measurement of aqueous glucose in a model ante-rior chamber using Raman spectroscopy,” J. Raman Spectrosc. 33(7),524–529 (2002).
35. P. J. Caspers, G. W. Lucassen, and G. J. Puppels, “Combined in vivoconfocal Raman spectroscopy and confocal microscopy of human skin,”Biophys. J. 85(1), 572–580 (2003).
36. C. A. Lieber et al., “Raman microspectroscopy for skin cancer detectionin vitro,” J. Biomed. Opt. 13(2), 024013 (2008).
37. J. Qi, K. L. Bechtel, and W.-C. Shih, “Automated image curvatureassessment and correction for high-throughput Raman spectroscopyand microscopy,” Biomed. Spectrosc. Imaging 3(4), 359–368 (2014).
38. H. Wang et al., “Improving skin Raman spectral quality by fluorescencephotobleaching,” Photodiagn. Photodyn. Ther. 9(4), 299–302 (2012).
Biographies of the authors are not available.
Journal of Biomedical Optics 051036-5 May 2015 • Vol. 20(5)
Shih, Bechtel, and Rebec: Noninvasive glucose sensing by transcutaneous Raman spectroscopy
Downloaded From: https://www.spiedigitallibrary.org/journals/Journal-of-Biomedical-Optics on 26 Jun 2020Terms of Use: https://www.spiedigitallibrary.org/terms-of-use