nonelectrolyte diffusion across lipid bilayer systems · distilled water, and then all the...
TRANSCRIPT
Nonelectrolyte Diffusion across Lipid Bilayer Systems
MARK P O Z N A N S K Y , SIU T O N G , PERRIN C. W H I T E , J . M. MIL- GRAM, and A. K. S O L O M O N
From the Biophysical Laboratory, Harvard Medical School, Boston, Massachusetts 02115
A B S T R A C T The permeability coefficients of a homologous series of amides from formamide through valeramide have been measured in spherical bilayers prepared by the method described by Jung. They do not depend directly on the water:ether partition coefficient which increases regularly with chain length. Instead there is a minimum at acetamide. This has been ascribed to the effect of steric hindrance on diffusion within the bilayer which increases with solute molar volume. This factor is of the same magnitude, though opposite in sign to the effect of lipid solubility, thus accounting for the minimum. The resistance to passage across the interface has been compared to the resistance to diffusion within the membrane. As the solute chain length increases the interface resistance becomes more important, until for valeramide it comprises about 90% of the total resistance. Interface resistance is also important in urea permeation, causing urea to permeate much more slowly than an amide of comparable size, after allowance is made for the difference in the water:ether partition coefficient. Amide permeation coefficients have been com- pared with relative liposome permeation data measured by the rate of liposome swelling. The ratios of the two measures of permeation vary between 3 and 16 for the homologous amides~ The apparent enthaipy of liposome permeation has been measured and found to be in the neighborhood of 12 kcal mo1-1 essentially independent of chain length. Comparison of the bilayer permeability coefficients with those of red cells shows that red cell permeation by the lipophilic solutes resembles that of the bilayers, whereas permeation by the hydrophilic solutes differs significantly.
Nonelectrolyte diffusion across the red cell membrane provides informat ion about membrane physical characteristics (1), which has been interpreted in the light of comparisons with model lipid bilayer systems such as liposomes (2). The multilamellar structure of the liposomes makes it difficult to obtain absolute permeability coefficients f rom the initial rate of swelling, the usual measure of liposome permeat ion. However, absolute permeability coefficients can be ob- tained f rom measurements o f diffusion across bilayers. T h o u g h Andreoli et al. (3) repor t that the permeability coefficients of small nonelectrolytes are generally too small to measure across planar bilayers, such measurements have been made by Vreeman (4), Gallucci et al. (5, 6), Lippe et al. (7, 8), and J u n g (9). We have used spherical lipid bilayers, p repared by the method of J u n g (9), to obtain permeability coefficients across single spherical bilayers for a homologous series of monoamides and urea. These permeability coefficients are qualitatively,
T H E J O U R N A L o r G E N E R A L P H Y S I O L O G Y - V O L U M E 67, 1976 • p a g e s 4 5 - 6 6 4 5
on April 19, 2017
Dow
nloaded from
Published January 1, 1976

46 THE JOURNAL OF GENERAL PHYSIOLOGY ' VOLUME 67 " 1976
t h o u g h no t quant i t a t ive ly , re la ted to the relat ive pe rmeab i l i t y of l iposomes to these same amides , which we have also m e a s u r e d by the rate of swell ing.
T h e r e are t h ree i m p o r t a n t factors tha t g o v e r n none l ec t ro ly t e pe rmeab i l i ty : the rate cons t an t for e n t r a n c e in to the m e m b r a n e f r o m the a que ous e n v i r o n - m e n t , the d i f fu s ion coeff ic ient wi th in the m e m b r a n e , a n d the pa r t i t i on coeffi- cient . T h e p r e sen t resul ts i l lus t ra te the role of each process in none l ec t ro ly t e t r a n s p o r t across an egg lec i th in bi layer .
METHODS AND M A T E R I A L S
Bilayer Membranes
Spherical bilayer membranes were prepared according to the techniques of J u n g (9) by using a micrometer-driven microsyringe to blow thin lipid bubbles at the end of a glass capillary or polyethylene tube. All experiments used egg lecithin purified either by the method of silicic acid chromatography (10) or alumina chromatography (11). The lecithin was dissolved at a concentration of 2-3 g% in 5:3 chloroform:tetradecane (reagent grade, Eastman-Kodak, Rochester, N. Y.). Membranes were formed in a temperature-jacketed 2.5-ml cell at 25°C, except where otherwise specified. The solutions on either side of the membrane were identical, containing in mM: 125 NaCl, 5 KCI, 1 CaC12, 1 MgCI2, 2 TES (N-tris[hydroxymethyl]methyl-2-aminoethane sulfonic acid) at pH 7.4. The buffer also contained 20 mM of the test solute. The bubbles were blown to a diameter of about 3 mm and the thinning time ranged from 20-60 min. The solution was stirred with a magnetic bar at ~200 rpm dur ing and after the thinning process. It was important that the density of the membrane-forming solution remain constant to avoid too rapid thinning. If the solution becomes too dense, a solvent lens may form, tearing the membrane.
Permeability measurements were made in the following manner . After th inning had occurred, 20 h of ~4C radioactively labeled test solute (~2/xCi) was added to the external solution. The labeled compounds were obtained from New England Nuclear (Boston, Mass.) except for [~4C]formamide obtained from Mallinckrodt Chemical Works (St. Louis, Mo.) and [~4C]valeramide obtained from International Chemical and Nuclear Corp. (Irvine, Calif.). After a given time period (2-10 min), the bubble was gently retracted into the capillary using the micrometer syringe. The capillary was rinsed in distilled water, and then all the radioactivity in the capillary tube was ejected into a solution of liquid scintillation counting medium (Bray's solution). The sample was counted in a Nuclear Chicago (Des Plaines, Ill.) model 724 liquid scintillation counter. A sample of the external solution was also counted and the permeability coefficient was calculated using the simple Fick equation and computing the area, A, of the truncated sphere from the standard 1 formulaA = 2 7rrh in which r is the radius in centimeters and h the truncated height in centimeters. Areas ranged from 0.064 to 0.315 cm 2 with an average of 0.168 cm 2.
Alternatively, permeability coefficients could be obtained using .lung's technique of preloading the spheres with label and measuring the efflux of label into the external medium. Because of label efflux dur ing the th inning process the Jung technique pro- duced a higher initial radioactivity in the external medium and thus caused larger errors.
i It was confusing to us at first sight, and has also puzzled one referee that the formula for the area of a truncated sphere is the same as that for a cylinder with open ends. However the validity of the equation for the truncated sphere can readily be shown and it is given in the 45th edition of the Handbook of Chemistry and Physics, The Chemical Rubber Company, Cleveland, Ohio, 1964, A- 168.
on April 19, 2017
Dow
nloaded from
Published January 1, 1976

POZNANSKY ET AL. Nonelectrolyte Diffusion across Lipid Bilayer Systems 47
The electrical resistance of several bilayers were measured and found to be between 1.5 x 10⁷ and 2.0 x 10⁸ f~cm 2 which is higher than the value of 1 x l0 s D, cm 2 given by Miyamoto and Thompson (12) for egg lecithin planar bilayers made with chloroform, methanol, and tetradecane. Once the membrane had thinned, the resistance remained relatively stable for the durat ion of the experiment .
Liposome Permeability Measurements
Liposomes were p repared according to the technique of Bangham et al. (13) by making a "hand-shaken" dispersion from ei ther a mixture of pure egg lecithin p repared as for the spherical bilayers (96%) and phosphatidic acid (4%), or from a total lipid extract from red blood cells according to the method of Bruckdorfer et al. (14). The liposomes were p repared in 50 mM KCi with a total lipid concentration of 10 raM.
Permeation was measured by the method of Cohen and Bangham (15). 0.2 ml of the lipid dispersion was rapidly mixed with 2.5 ml of a 150 mM solution of the test solute. All solutions were preincubated at the desired temperature , and the optical density of the suspension was measured in a water-jacketed glass cuvette at 450 nm in a Perkin-Elmer 402 spectrophotometer (Norwalk, Conn.). The time required for mixing was about 3 s and changes in optical density were observed from 5 to 120 s. According to the Cohen and Bangham (15) technique, the liposomes first shrink and then swell; the relative permeabil- ity is measured by de termining the initial rate of the swelling phase from the changes in optical density. This technique was checked by measuring the swelling rate of the liposomes in isotonic solutions of the various test solutes according to the method of de Gier et al. (2) and virtually identical relative permeabili ty results were obtained. Controls were per formed on each set of l iposomes to determine that the liposomes were osmoti- cally active, stable, and that the volume changes could be ascribed only to the test solute.
When the effect of phloret in on liposome permeabili ty was to be studied, 2.5 x 10 -4 M phloret in (Fluka, A. G., Buchs, Switzerland) was added to the lipid dispersion and incubated at room tempera ture for at least 30 rain before measur ing the relative permea- bility.
R E S U L T S ANt) D I S C U S S × O N
Thickness of Unstirred Layer
I n o r d e r to d e t e r m i n e the th ickness o f the u n s t i r r e d l ayer , we m e a s u r e d the d i f f u s i o n o f t r i t i a t ed w a t e r across t he s p h e r i c a l b i l a ye r a n d c o m p a r e d this p e r m e a b i l i t y coe f f i c i en t wi th t he h y d r a u l i c c o n d u c t i v i t y o f the m e m b r a n e u n d e r an osmot i c p r e s s u r e g r a d i e n t . Cass a n d F i n k e l s t e i n (16) have shown tha t in the l im i t i ng case o f z e ro u n s t i r r e d l aye r , these two coef f i c ien t s a r e equa l fo r a m i x e d l ip id p l a n a r b i l aye r , a n d this c onc lu s ion has b e e n c o n f i r m e d by Ever i t t et a l . (17) fo r a n e g g p h o s p h a t i d y l cho l i ne a n d cho l e s t e ro l p l a n a r b i l aye r . W e have u sed the m e t h o d o f Cass a n d F i n k e l s t e i n (16) to m e a s u r e t he h y d r a u l i c c o n d u c t i v i t y o f o u r s p h e r i c a l b i l aye r u n d e r a suc rose osmot ic p r e s s u r e g r a d i e n t o f 200--400 m o s M . T r a c e a m o u n t s o f p h e n o l r e d were a d d e d to t he b a t h i n g m e d i u m to m a k e the m e m b r a n e vis ible in t he m i c r o s c o p e . I n five e x p e r i m e n t s , c a r r i e d ou t at 24°C, we o b t a i n e d a va lue o f 1.3 -+ 0.5 × 10 - a c m s -1 fo r t h e h y d r a u l i c conduc t i v i t y o f o u r m e m b r a n e s . Th i s a g r e e s r e a s o n a b l y with the va lues o f 0.78 × 10 -3 c m s -1 g iven by Cass a n d F i n k e l s t e i n a n d 1.9 × 10 -a cm s -~ g iven by H a n a i a n d H a y d o n (18) fo r t h e i r m e m b r a n e s .
on April 19, 2017
Dow
nloaded from
Published January 1, 1976

48 T H E J O U R N A L O F G E N E R A L P H Y S I O L O G Y • V O L U M E 67 • 1976
T h e permeabi l i ty coefficient was measured in two exper iments at 24°C by add ing T H O (New England Nuclear) to the outside bu f fe r and making measure- ments as described for amide bilayer pe rmea t ion , except that samples were taken at 1.5 and 3 rain. T h e average value obtained, 0.69 × 10 -3 cm s -1 (0.76 × 10 -z and 0.62 x 10 -3 cm s -l) agrees reasonably with the values o f 0.62 × 10 -3 to 1.06 × 10 -a cm s -1 given by Cass and Finkelstein for T H O diffusion in their system. T h e ratio of two permeabi l i ty coefficients, (hydraulic conduc t iv i ty /THO permeabi l i ty coefficient) which is 1.9, may be used to estimate the thickness of the uns t i r red layer, assuming that the value of the hydraulic conductivity is a measure of the " t rue" permeabi l i ty coefficient as discussed, for example , by Cass and Finkelstein.
In o rde r to de t e rmine the magn i tude of the unst i r red layer correct ion for spherical bilayers, we have used the equat ion der ived by Milgram which is given in the Appendix . T h e t rue permeabi l i ty coefficient, P a , t r u e , is given by
1/Pd,tru~ 1/Pa,obs--( t , /D)(1 - ~ ) - ( t 2 / D ) ( 1 + ~ ) , (1)
in which the subscript obs means observed, t~,e are the thicknesses o f the unst i r red layer on the outside and the inside of the spherical bilayer, respec- tively, a n d r is the radius o f the sphere . In the limit, i f t l = t~, Eq. 1 reduces to the planar solution
1/P d,true = 1/P d,obs -- 2tl/D. (2)
Using Eq. 2 and taking the T H O permeabil i ty coefficient as Pd,obs, we can calculate that the total uns t i r red layer thickness is 177 txm for the sum of the layers on both sides of the m e m b r a n e at 24°C.
In o rde r to use Eq. 1, we need to estimate the thickness of the uns t i r red layer on the outside of the spherical bilayer. Everitt et al. (17) give data for unst i r red layer thickness for planar bilayers. In the absence of st irr ing on ei ther side of the planar bilayer, the average thickness of the uns t i r red layer was 250 ~m. With the most vigorous st irr ing it could be reduced to 33 ~m. These au thors provide evidence (with Everitt and H a y d o n [19]) that the thickness of the uns t i r red layer is control led by natural convection. Ginzburg and Katchalsky (20) have con- cluded that, even with the most vigorous stirring, the uns t i r red layer cannot be b rough t below a "limiting value" of 25 t~m, in a much more robust system with cel lophane m e m b r a n e s . I f we take 35 /xm as an est imate of the uns t i r red layer thickness on the outside of the spherical bilayer u n d e r our st irr ing condit ions, Eq. 1 leads to a value of 128 t~m for the uns t i r red layer thickness on the inside of the m e m b r a n e . Hence the correct ion for the spherical geomet ry is relatively un impor t an t , since the sum of both layer thicknesses is 163/xm, relatively close to the total o f 177 ~ m for p lanar geomet ry . In view of the assumpt ions involved in est imating the thickness of the outer unst i r red layer, and the simplicity of Eq. 2, we have used Eq. 2 and a total thickness of 177/xm to correct our data for the unst i r red layer. 2 T h e correct ion is most impor t an t for the most pe rmeab le
2 In the course of discussion after the manuscript was submitted, Finkelstein (private communica- tion) suggested that measurement of the unstirred layer by butanol permeation as described by Holz
on April 19, 2017
Dow
nloaded from
Published January 1, 1976

POZNANSKY ET AL. Nonelectrolyte Diffusion across Lipid Bilayer Systems 49
solute, valeramide, and in this case, the ratio o f the t rue permeabili ty coefficient to the observed one is 1.34.
Comparison of Permeation across Spherical Bilayers with Planar Bilayer Data
T h e permeabili ty coefficients for a homologous series of monoamides and urea across egg lecithin spherical bilayers are given in Table I. O u r values agree very well with those obta ined by others for the permeabili ty coefficient of urea. Vreeman (4) obtained a value of 0.42 × 10 -5 cm s - t for Pa.urea at 20°C and Gallucci et al. (5) give 0.37 × 10 -5 cm s -t for Pd.u~a at 28°C. Both agree reasonably with ou r f igure of 0.41 × 10 -5 cm s -1 at 25°C.
However , our exper imenta l data for the permeat ion coefficients o f fo rmam- ide and acetamide are not in agreement with those of Gallucci et al. (5); the d isagreement increases with lipid solubility. For fo rmamide , Gallucci et al. give Pa = 16 × 10 -5 cm s -1, about twice as large as ou r value; for acetamide, their value is 14 × 10 -5 cm s -1 about six times greater than our value. These disagree- ments are unexpec ted in view of the good agreement for u rea and water permeat ion . In a subsequent section of this paper , evidence is presented that urea permeat ion depends significantly on the rate constant for t ransfer f rom the aqueous solution to the membrane , so that the di f ference in the permea- bility coefficients o f the somewhat more lipophilic amides may reside in the lipid proper t ies of the membrane .
T h e two exper imenta l systems differ in several significant aspects, particularly in the solvent system f rom which the bilayers were made; Gallucci et al. used decane and we used 5:3 ch loroform: te t radecane . Fettiplace et al. (23) have measured the thickness and composit ion of the hydrocarbon por t ion o f black lipid membranes made f rom egg phosphat idyl choline dispersed in various solvents. When membranes are made f rom decane dispersions, the thickness of the hydrocarbon region is 48 • and the volume fraction o f the phosphat idyl choline hydrocarbon chains is 0.69. For similar membranes made f rom tetradec- ane dispersions, the hydrocarbon thickness is 37/~ and the volume fraction is 0.86. It seems quite likely that membrane composit ion and thickness are both impor tan t de terminants of the permeat ion process. For example , Toyoshima and T h o m p s o n (24) have measured C1 exchange flux in membranes of diphytan- oylphosphat idyl choline p r epa red f rom a decane solution and fo u n d them to be some two orders of magni tude smaller than C1 exchange fluxes r epor t ed earlier by Pagano and T h o m p s o n (25) in egg phosphat idyl choline membranes pre-
and Finkelstein (43) would provide an independent estimate of the thickness of the unst irred layer and give additional evidence about the general validity of our experimental procedure. In view of the disagreement of our results with those of GaUucci et al. (5) it appeared desirable to make this additional check. Consequently the permeability coefficient to butanol was measured in three additional experiments , two on egg phosphatidyl choline bilayers and one on a dioleoyl lecithin bilayer which may be more stable than the unmodified lecithin ones. The permeability coefficient for dioleoyl lecithin was 5.0 × 10 -4 cm s -~ at 21°C and the two with egg lecithin were 5.6 × 10 -4 and 6.1 × 10 -4 cm s -1 at 25°C. These values may be compared with the value of 5.9 × 10 -4 cm s -1 at 25°C obtained by Holz and Finkelstein which corresponds to an unstirred layer thickness of 170 /zm in their experiments . The average value of the unstirred layer thickness f rom the butanol data in our egg lecithin experiments was calculated f rom Eq. 2 (assuming (llPa,tru~) "~ 2 t~lD) and found to be 171 p,m, in excellent agreement with the value of 177 tzm which we have used in the manuscript .
on April 19, 2017
Dow
nloaded from
Published January 1, 1976

50 T H E J O U R N A L OF G E N E R A L P H Y S I O L O G Y • V O L U M E 6 7 • 1 9 7 6
" F A B L E I
AMIDE PERMEABILITY COEFFICIENTS FOR SPHERICAL BILAYERS
Permeability coefficient**
Solute T Partition coefficient,§ ketl~,r Pa × I on ~ × 10~s
C ° cm s i raol dyn -I ~-i
Formamide 25 7.8-+0.5 (6) 3.1 0.0014 Acetamide 25 2.4-+0.4 (5) 0.95 0.0025 Propionamide 25 6.1 ±0.6 (3) 2.5 0.013 Valeramide 25 II 18.3 -+ 1.1 (4) 7.4 0.23
Urea 30 0.49-+0.03 (3) 0.19 Urea 25 0.41 -+0.02 (3) 0.17 0.00047 Urea 20 0.23-+0.04 (5) 0.i0
* Mean ± SE; number of experiments in parenthesis co = Pa/RT. .~ The results obtained in preliminary experiments by one of us (P. C. W.) in which the radioactivity was initially placed inside the bubble and the time-course of efflux was measured as discussed in the text, are forPa in cm s-I: acetamide, 3.4 ± 0.7 × 10⁻⁵; propionamide, 3.0 ± 1 × 10-'~; and urea, 0.30 -+ 0.05 × 10 -5. These are not corrected for unstirred layer thickness, since the correction is less than 3% for a permeability coefficient of 2.5 × 10 -5 cm s -I. § The values for kettter have been taken from Collander (21) except for valeramide. Collander gives ket~.r for isovaleramide of 0.17 and we have increased this by a factor of 1.35 which Lange et al. (22) determined as the ratio of partition coefficients of valeramide to isovaleramide in several bulk solvents as well as in egg lecithin vesicular particles. [I Two of these experiments were carried out at 24°C.
p a r e d f r o m a c h l o r o f o r m - m e t h a n o l - t e t r a d e c a n e solvent system. T h e electrical res is tance of the T o y o s h i m a a n d T h o m p s o n bi layers was a b o u t 109 f~cm*, as c o m p a r e d with 3 x 10⁵ f~cm ~ given by P a g a n o a n d T h o m p s o n . T h e m e a n electrical res is tance o f o u r spher ica l bi layers was a bou t 108 l~cm 2. Gallucci et al. do no t specify the electr ical res is tance o f the i r m e m b r a n e s , b u t r e f e r to a p a p e r by L~iuger et al. (26) who give a r a n g e o f resis tances o f 10 n to 10 s f~cm 2 for the i r m e m b r a n e s . Since the lower l imit is m o r e t h a n an o r d e r o f m a g n i t u d e lower t h a n o u r lowest m e a s u r e d value o f 1.5 × 10 r O c m 2, it is possible that the resis tances o f the m e m b r a n e s used by Gallucci et al. were less t h a n ours .
T h e r e may also be d i f f e rences in the c o n t r i b u t i o n of p e r m e a t i o n t h r o u g h the torus which n o r m a l l y compr i ses a b o u t 1-2% of the m e m b r a n e area of the spher ical bi layers a n d is n e v e r g rea t e r t h a n 6%. L~iuger et al. give a f igure of abou t 10% for the i r p l a n a r m e m b r a n e s . T h e r e is also a d i f f e r ence in solute c o n c e n t r a t i o n since o u r e x p e r i m e n t s were ca r r i ed ou t with a 20 mM a m i d e c o n c e n t r a t i o n , a n d we es t imate f r o m the Gallucci et al. da ta that their c o n c e n t r a - t ions were p robab ly an o r d e r o f m a g n i t u d e lower. Th i s d i f f e r ence may be of s ignif icance in view o f So lomon ' s (27) sugges t ion that a mi de d i m e r i z a t i o n may play a role in l ipid bi layer p e r m e a t i o n .
A possible systematic e r r o r in o u r m e a s u r e m e n t s shou ld also be c o n s i d e r e d . In the m e a s u r e m e n t s r e p o r t e d in T a b l e I, we m e a s u r e d the f lux in to the spher ica l bubble . O n l y one sample cou ld be t aken in each e x p e r i m e n t since the d i scharge of the sample des t royed the bubb le . O u r calcula t ions were m a d e u s i n g the s imple d i f fu s ion e q u a t i o n a n d neg l ec t i ng backfhtx . I f the radioact ivi ty in the
on April 19, 2017
Dow
nloaded from
Published January 1, 1976
POZNANSKY ET AL. Nonelectrolyte Diffusion across Lipid Bilayer Systems 51
bubble at the t ime the e x p e r i m e n t was te rmina ted was significant, this p rocedu re would lead to an underes t ima te of the flux, because backflux had been ne- glected. It is clear that the radioactivity was dissolved in a vo lume larger than that of the spherical bubble alone and must have pene t ra ted some distance up the tube which suppor t ed the bubble due to some combinat ion of st irr ing and convection. I t was not possible to de te rmine the total vo lume in which the solute was dispersed and we relied instead on measu remen t s o f the uns t i r red layer to de te rmine the contr ibut ion of mixing within the spherical bubble. T H O is the most pe rmeab le of the solutes we have studied and the fact that its permeabi l i ty coefficient agrees reasonably with that o f Cass and Finkelstein (16) suppor t s the validity o f ou r p rocedure .
T h e r e are two other lines o f evidence that should be taken into account. Valeramide is the most pe rmeab le of the amides we have studied and two series of exper imen t s were made on it. In the first series at 25°C, sampl ing times were 5.5 and 7 min and the permeabi l i ty coefficients (uncorrected for unst i r red layer) were 12.8 × 10 -5 and 14.1 × 10 -5 cm s -1. In the second series, at 24°C, the sampl ing times were 2 and 3 min and the permeabi l i ty coefficients were 15.7 × 10 -5 and 12.1 × 10 -5 cm s -1, so there does not seem to be a consistent source of e r ro r in the va le ramide data due to sampl ing t ime problems.
As far as the o ther solutes are concerned , one of us (P. C. W.) carr ied out a pre l iminary set o f expe r imen t s in which pe rmea t ion was measu red in the opposi te direction, the radioactivity being placed initially in the bubble with samples taken f rom the external med ium. In this way it was possible to take several samples and de t e rmine that the flux was l inear with time. Since radioac- tivity escapes f rom the bubble du r ing the th inning per iod , there was a high initial background and we concluded that the me thod used for Table I was preferable . However , we have presented these pre l iminary data in the second footnote to Table I to show how well the two methods agree. T h e ag reemen t is not unreasonable , consider ing the large s tandard er rors o f the mean and there is no systematic progress ion in d i f fe rence which increases ei ther with lipid solubil- ity or with permeabi l i ty coefficient.
Rate-Governing Steps for Permeation across Spherical Bilayers
At first sight it seems s t range that the permeabi l i ty coefficients shown in Fig. 1 do not increase un i formly with chain length in accordance with Over ton ' s rule since the water :e ther part i t ion coefficients, kether, increase with chain length, as shown in Table I. Instead there is a m in imum at acetamide, f o r m a m i d e permeat - ing three times faster than ace tamide despite its lower value of kether. Over ton ' s rule implicitly assumed that the sole r a t e -de te rmin ing step is part i t ion, but Table I shows that this cannot be the case, at least for the smallest solute, f o rmamide . T h e presence of a m i n i m u m means that there must be at least two control l ing processes govern ing lipid bilayer permeat ion . These can be identif ied as parti- tion between ba th ing solution and bilayer, and diffusion th rough the bilayer, as il lustrated in Fig. 2. T h e bo t tom figure shows that In kether increases linearly with the addit ion of each methy lene g roup . In the top f igure ln(Palk~th~r), which is a measure of diffusion th rough the bilayer, is seen to decrease linearly with increased solute molar volume.
on April 19, 2017
Dow
nloaded from
Published January 1, 1976

52
o
T~ T c
E v 3
7t xV
xF
x A
2'o 4'o ~'o 8'o i&o 3
V s (cm m0(I)
T H E J O U R N A L OF G E N E R A L P H Y S I O L O G Y • V O L U M E 6 7 • 1 9 7 6
(
-2
c
-6
2'o
-2
.,=~ -4
-6
4'o 6'o 8~ l~o 1' t t ¢ F A P V
Vs (cm3 rooF')
0// Number of Corbons
F I G U R E 1 FIGURE 2
FIGURE 1. Permeability coefficient for spherical egg lecithin bilayer as a function of solute molar volume. The symbols are: F, formamide, A, acetamide, P, propion- amide, and V, valeramide. FIGURE 2. (Top) Dependence of In ( P a / k e t h e r ) o n solute molar volume. (Bottom) Dependence of In k~m~r for the linear alkane monoamides on total number of carbons in chain.
The relation between these two processes can be i l luminated by the fo l lowing equat ion o f Zwolinski et al. (28),
Pra = A'e-~, /m , (3)
in which Pm is the permeabil i ty coeff ic ient within the bilayer in cm s-I; A' = (Kk2/8) (kT/h); AG$ is the free energy o f activation for di f fus ion in the bilayer; k is Bol tzmann's constant , h, Planck's constant , and R, the gas constant; T is absolute temperature , k is the d i f fus ion j u m p distance, and 8 is the m e m b r a n e thickness; K is the partition coeff ic ient between bathing solut ion and the m e m b r a n e . Since K is not , in general , k n o w n whereas Kemer has been measured for the solutes we have used, the fo l lowing transform is useful . By introducing A = A' ketheJK, P, , can be expressed as
Pm = A e - ~ : / m (4)
in which AGm* is def ined as
on April 19, 2017
Dow
nloaded from
Published January 1, 1976

POZNANSKY ET AL. Nonelectrolyte Diffusion across Lipid Bilayer Systems 53
AGm* = A G $ - R T In (A'/A). (5)
In the subsequent t rea tment the variations between members of the homologous series of monoamides will be considered to be reflected only in AGm*, which is equivalent to assuming that the ratio ofketheflK is the same for all members o f the series. The validity o f such a relationship for koct~no~lK has been demons t ra ted by Roth and Seeman (29) who showed that the water:octanol parti t ion coefficient of the straight chain monohydr ic alcohols was linearly related to the buf fe r : r ed cell membrane parti t ion coefficient, koetano I w a s uniformly five times greater than kred eel~ membrane for alcohols f rom pentanol th rough decanol. Diamond and Katz (30) have found a similar relationship between parti t ion coefficients o f dimyris- toyl lecithin liposomes and isobutanoi. The nature of the relationship depends upon the solvent, and the propert ies of isobutanol as a solvent are very much closer to dimyristoyl lecithin than those of e ther . However dimyristoyl lecithin has a sharp phase transition at 25°C, whereas egg phosphatidyl choline has a broad phase transition centered about - 10°C so that the propert ies o f these two phosphatides as solvents may well differ substantially.
The next question is how to relate Pm to the measured permeabili ty coefficient Pd which includes the terms for enter ing and leaving the bilayer in addit ion to Pm. The Zwolinski et al. equat ion has been used by Galey et al. (31) in the form
IlP d = 2MD ~ + 8/[Dmkether(Klkether) ], (6)
in which D is the diffusion coefficient: acros.s the interface, D ~ , within the membrane , Dm. T h e linearity of this equation, as Zwolinski et al. point out, depends upon the variations in D ~ being small as one progresses th rough a homologous series of solutes. Eq. 6 illustrates clearly the major terms governing solute permeat ion th rough a membrane treated as a homogeneous barrier . 2MD,m is the resistance of the interface to solute crossing. D~m])~ 2 is k~m, the rate constant for crossing the interface and enter ing the membrane . K, the steady-state parti t ion coefficient is a ratio o f two rate constants, k~m[kms, in which km8 is the rate constant for leaving the membrane and re tu rn ing to the bathing medium. K is included in (S/D,,J() which is also related to the rate constant for permeat ion within the membrane , since Dm/X 2 = kin. Hence permeat ion is control led by two rates (kin and ksm) and one distribution coefficient (K = ksm/kms). Galey et al. (31) have shown that Eq. 6 is l inear with k~tner for the permeat ion of the higher lipophilic members of the series (propionamide, butyramide , and valeramide) across human red cell membranes at 25°C (see Fig. 3). These authors have pointed out that a linear relation is also observed for permeat ion of the same solutes across Chara membranes , as well as for the analogous members of the monocarboxylic acid series across human red cell membranes .
T h e r e is no such linear relationship for spherical bilayers as shown in the uppe r line in Fig. 3 in which the data f rom Table I are plotted according to Eq. 6. The nonlineari ty can be at t r ibuted in part to the assumption in Eq. 6 that diffusion within the membran e can be approx imated by a single value of Dm i ndependen t of solute size. This is not the case even for diffusion in bulk water since the diffusion coefficients o f these same solutes in water decreases as their
on April 19, 2017
Dow
nloaded from
Published January 1, 1976

5 4 T H E J O U R N A L O F G E N E R A L P H Y S I O L O G Y • V O L U M E 67 • 1 9 7 6
4.C ~ x
5.C
'2 'S ~¢
TCL~ x - -
I.C / ~ i Cell / / /
,~6o 260 360 V B P kether-I A
FIGURE 3. Inverse permeability coefficient (Pa -1) as a function of the inverse partition coefficient (k~,,r) for monoamide permeation of spherical lipid bilayers (upper) and lipophilic monoamide permeation of human red cells at 25°C (lower). The additional symbol is B, butyramide.
volume increases. T h e d i f ference between the red cell results and the present ones may be also related to the inclusion of the shorter chain nonlipophilic amides in the present data, since the shorter the chain, the greater the fractional increase in volume per methylene added.
Nonetheless, Fig. 3 illustrates that the y intercept of Pa -1 has a positive value much greater than that for the red cell membrane though the slopes are similar. As the parti t ion coefficients increase, the relative importance of passage across the interface increases until, for valeramide, it is very nearly the rate-controll ing step. This is a consequence of the fact that the concentra t ion of solute within the bilayer increases with ketner; the increased concentra t ion gradient causes diffu- sion within the membrane to go much faster. Hence, the overall rate, Pa,
becomes increasingly dependen t upon the interface step. The following relation (31) replaces the permeabili ty terms in Eq. 6 with
relative membrane resistances
Ra = Rs~ + Rm, (7)
in which R is the resistance to permeat ion (=p- l ) ; the subscript d refers to the resistance of the entire system, sm to the interface, and m to the resistance within the membrane . T h e values o f Rm/Ra given in Table II have been computed f rom Eq. 7 and Fig. 3 using an extrapola ted value of 0.49 × 10⁴ s cm-; for Rsm. AGm*
on April 19, 2017
Dow
nloaded from
Published January 1, 1976
POZNANSK¥ ET AL. Nonelec tro ly te D i f f u s i o n across L i p i d B i layer Systems 55
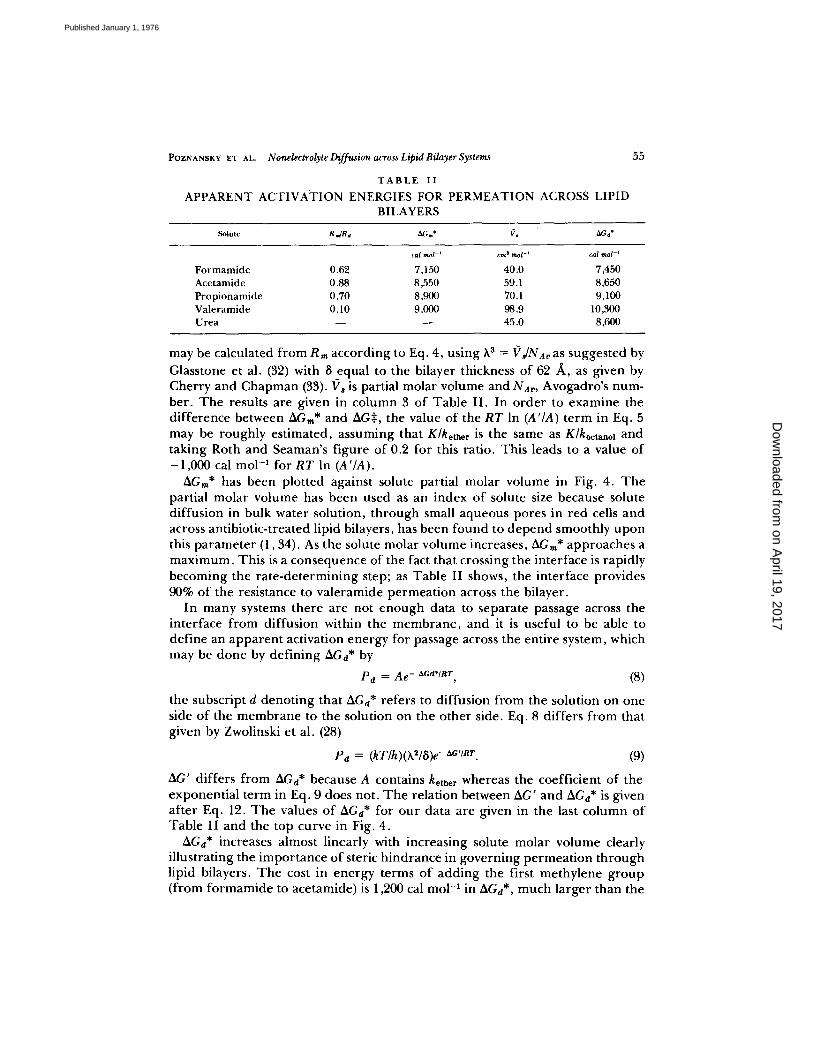
T A B L E II
APPARENT ACTIVA'TION ENERGIES FOR PERMEATION ACROSS LIPID BILAYERS
Solute R=IRd ~Gm* f', ~G n*
¢al raol -~ cm s tool -~ cal raol -t
F o r m a m i d e 0.62 7,150 40.0 7,450 Acetamide 0.88 8,550 59.1 8,650 P rop ionamide 0.70 8,900 70,1 9,100 Valeramide 0.10 9,000 98.9 10,300 Urea - - - - 45.0 8,600
may be calculated from Rm according to Eq. 4, using h 3 = ~'rJNAv as suggested by Glasstone et al. (32) with 8 equal to the bilayer thickness of 62 /~, as given by Cherry and Chapman (33). ~?s is partial molar volume and NA~, Avogadro's num- ber. The results are given in column 3 of Table II. In order to examine the difference between AGm* and AG:~, the value of the RT In (A'/A) term in Eq. 5 may be roughly estimated, assuming that K / k e t h e r is the same as K/koctanol and taking Roth and Seaman's figure of 0.2 for this ratio. This leads to a value of -1,000 cal mo1-1 for RT In (A'/A).
AGra* has been plotted against solute partial molar volume in Fig. 4. The partial molar volume has been used as an index of solute size because solute diffusion in bulk water solution, through small aqueous pores in red cells and across antibiotic-treated lipid bilayers, has been found to depend smoothly upon this parameter (1,34). As the solute molar volume increases, AGm* approaches a maximum. This is a consequence of the fact that crossing the interface is rapidly becoming the rate-determining step; as Table II shows, the interface provides 90% of the resistance to valeramide permeation across the bilayer.
In many systems there are not enough data to separate passage across the interface from diffusion within the membrane, and it is useful to be able to define an apparent activation energy for passage across the entire system, which may be done by defining AGd* by
P d = A e - aGa*/nr , (8)
the subscript d denoting that AGa* refers to diffusion from the solution on one side of the membrane to the solution on the other side. Eq. 8 differs from that given by Zwolinski et al. (28)
Pd= (kT/h)(h2/8) e-aG'mr (9)
AG' differs from AGa* because A contains kether whereas the coefficient of the exponential term in Eq. 9 does not. The relation between AG' and AGd* is given after Eq. 12. The values of AGa* for our data are given in the last column of Table II and the top curve in Fig. 4.
AGd* increases almost linearly with increasing solute molar volume clearly illustrating the importance of steric hindrance in governing permeation through lipid bilayers. The cost in energy terms of adding the first methylene group (from formamide to acetamide) is 1,200 cal mol -~ in AGd*, much larger than the
on April 19, 2017
Dow
nloaded from
Published January 1, 1976

56 T H E J O U R N A L OF G E N E R A L P H Y S I O L O G Y ' V O L U M E 67 • 1 9 7 6
o E
ZIG~ .-
/ /
o /
/ / / /
/o x
E
/ /
, . 9 / red cell
21C) 40 60 gO 160 2'0 4b 6'0 8b 100
~?s (crn3 rnOl-I ) ?s (cms rn°l-I) F I G U R E 4 F I G U R E 5
FIGURE 4. Apparent activation energies for spherical bilayer permeation, AGm* and AGa*, as a function of solute molar volume, l?s. FIGURE 5. AGa* for spherical lipid bilayers (upper curve) compared with AGa* for red cell membrane (lower curve) as a function of solute molar volume. The errors for the lower curve are less than -+0.07 kcal mol -~ for each of the solutes.
average 550 cal mo1-1 for the succeeding methylene groups which p roduce a progressively smaller p ropor t iona l increase in solute volume.
Similarly successive methy lene groups increase the water :e ther part i t ion coeffi- cient o f the m o n o a m i d e . Each succeeding methylene g roup decreases AG ° for part i t ion, by 790 cal mol -~ (computed f r o m the data o f Col lander [21] using AG ° = - RT In K). Seeman et al. (35) have measu red the part i t ion o f monohydr ic alcohols into the red cell m e m b r a n e and have found a decrease o f 695 cal mol -~ per methylene g roup . As indicated in Fig. 2 changes in AG ° are o f the same o rde r o f magni tude , though opposi te in sign to the increments in AGa*, thus account ing for the m i n i m u m in the permeabi l i ty coefficient in the m o n o a m i d e series.
Table I I gives the value o f AGa* for u rea as 8,600 cal mol - t . On the assumpt ion that the ratio, kether/K, for u rea is the same as that for the monoamides , the u p p e r curve in Fig. 4 can be used to separa te steric h indrance to urea pe rmea t ion f rom o ther h indrances , arising principally f rom hyd rogen -bond ing effects. T h e value of AGa* for a m o n o a m i d e of molar volume 45.0 cm 3 mol -l , that o f urea , is 700 cal mo1-1 less than AGa* for urea. This d i f ference probably measures the addit ional h indrance of fered by the hyd rogen bond ing of one amide g roup , essentially the energet ic cost o f t ravers ing the two highly o r d e r e d polar interfaces on ei ther side of the lipid bilayer.
T h e contr ibut ion o f the part i t ion coefficient to pe rmea t ion is virtually ex- c luded f r o m AGa* since kethe r is specifically included in the coefficient A in Eq. 8. AGa* represents the a p p a r e n t activation ene rgy for a l u m p e d set o f rate proc- esses. T h o u g h they are d i f fe ren t pa rame te r s , it is instructive to c o m p a r e differ- ences in AGa* with di f ferences in equi l ibr ium distribution r ep resen ted by AG ° for part i t ion. AG ° for water :e ther part i t ion for urea is -4 ,500 cal mo1-1, some 600 cal mo1-1 less than the comparab le AG ° f o r f o r m a m i d e part i t ion (--3,900 cal
on April 19, 2017
Dow
nloaded from
Published January 1, 1976

POZNANSKY ET AL. Nonelectrolyte Diffusion across Lipid Bilayer Systems 57
mol-1). In other words, if we lump all the nonsteric restraints for the permeation of a single amide group into a single difference in the apparent activation en- ergy, this difference (700 cal mo1-1) is about the same as the difference in energy required to extract that same amide group from an aqueous environment and place it in a nonpolar solvent such as ether (600 cal mol-1).
Studies on Liposomes
Cohen and Bangham (15) used the rate of liposome swelling to measure the relative permeability coefficients of monoamides in liposomes which contained cholesterol. Although they found that the relative permeability of formamide was greater than that of acetamide, the importance of this finding was obscured by the general conclusion they reached that permeation across liposomes was generally in accord with Overton's rule. Our results with spherical bilayers indicate that the process is significantly more complex.
There are many uncertainties in using the liposome swelling rates to measure relative permeabilities, primarily as a result of the muhilayered nature of this preparation. It is difficult to establish the role that diffusion in the aqueous region between the layers plays in determining the overall swelling rate. This theoretical difficulty is balanced by the experimental ease in making liposome swelling measurements and we have also used this technique primarily to study the temperature dependence of amide permeation. Our results for egg lecithin liposomes (96% egg lecithin, 4% phosphatidic acid) and also for liposomes made from extracts of total red cell lipids are given in Table III. Column 2 shows that the apparent ratio of permeation (formamide/acetamide) determined from ini- tial rates of swelling in the egg lecithin liposomes preparation is 1.3, in fair agreement with the formamide/acetamide ratio calculated from the Cohen and Bangham graph (15) of 1.5, but very much less than the 3.3 ratio of Pa's is the spherical bilayer. Thus the results obtained with the two systems, though qualita- tively similar, are quantitatively different. This is illustrated in the fourth column of Table III which shows that the ratios of permeabilities determined by the two methods are quite variable.
Lelievre and Rich (36) have computed the permeability coefficients from determinations of the reflection coefficient in liposomes of lecithin with 3.6% phosphatidic acid. They also found that acetamide, as well as propionamide, permeated more slowly than formamide. Their formamide/acetamide ratio is 1.8, greater than the ratios either of Cohen and Bangham (15) and ourselves.
The apparent enthalpy of permeation of red cell lipid liposomes, AH', has been determined by plotting In (relative swelling rate/T) against T -I for urea, glycerol, and the homologous amides. The slope of this line is (-AH'/R) and the resultant values for AH' are given in column 5 of Table IIIi AH' for urea in red cell lipid liposomes is 12.1 kcal mol -x which agrees reasonably with the figure of 14.3 kcal mol -a we have obtained in spherical bilayers from the data in Table I. In view of this agreement, we have considered the figures in Table III to be reasonable indices of the apparent activation enthalpies for lipid bilayer permea- tion. Our value of AH' for glycerol is 18 kcal mol -a in agreement with the figure of 18 kcal mol -~ given by de Gier et al. (2) for liposomes prepared from egg
on April 19, 2017
Dow
nloaded from
Published January 1, 1976

58 T H E JOURNAL OF GENERAL PHYSIOLOGY • VOLUME 6 7 • 1 9 7 6
T A B L E I I I
RELATIVE PERMEABILITY OF LIPOSOMES
Solute
Relative swelling rates [Pa × l0 s (lecithin bi- layer)/swelling rate Apparent activation
Egg lecithin lipo- enthalpy:~ somes (15°C) * Red cell lipid [iposomes (15°(;) (lecithin liposome)]
kcal tool -~
Formamide 1.0 1.00-+0.01 (3) 7.8 11.9 Acetamide 0.78 0.94+-0.01 (4) 3.1 12.7 Propionamide 0.82 1.05-+0.02 (3) 7.4 10.2 Butyramide 0.94 1.25-+0.02 (3) 12.7 n-Valeramide 1.15 1.51 -+0.02 (3) 15.9 10.7
Urea 12.1 Glycerol 18.0
* Obtained in duplicate experiments. The average difference between duplicates was 2%. :~ For red cell liposomes.
lecithin containing 30 mol % o f cholesterol. Table I I I shows that ~ r / , is insensitive to chain length. A similar observat ion
was made by de Gier et al. (2) for l iposome pe rmea t ion by a lkane diols. T h e y found ~r_/, to be essentially i ndependen t o f chain length f r o m ethane- l ,2-diol t h rough pentane-1,5-diol . An explanat ion for the i ndependence of ~T_/, o f chain length can be found by writ ing Eq. 8 in the following fo rm
(P a/T) = kether( h 2k/Sh )e - aGel*/Rr, (10)
and consider ing the t e m p e r a t u r e dependence of keth~r. Different ia t ing Eq. 10 with l /T , we obtain
d(ln Pd/T) d(ln k~th~r) AHa* AH' . . . . , ( 1 1 )
d(1/T) d(l /T) R R
since ASd* is cons idered to be i n d e p e n d e n t o f t empe ra tu r e . For part i t ion, AG ° = - R T In keth~r, SO
d(ln kether) ~ o . . . . , ( 1 2 )
d(1/T) R
and
/2kI-/ ' ~--- ~ d _ / o _~_ / ~ g ' / d * . (13)
A similar relation holds for AGd* and ASd*. T h e fact that AH' is i n d e p e n d e n t of chain length may probably be ascribed to
the balance between the decrease of AH ° with chain length, and the concomitant increase of AHd*. T a n f o r d (37) repor ts that AH ° for t ransfer of e thane f rom water to pure liquid hydroca rbon is 2.5 kcal mo1-1 and that AH ° decreases by 800 cal mol -I for p r o p a n e and ano the r 900 cal mo1-1 for butane . D iamond and Katz (30) have measu red the change of AH ° per methylene g roup for the part i t ion of two pairs o f solutes f rom water to dimyristoyl lecithin l iposomes and find that
on April 19, 2017
Dow
nloaded from
Published January 1, 1976

POZNANSKV ET AL Nonelectrolyte Diffusion across Lipid Bilayer Systems 59
M-/° decreases by 1.6 kcal mo1-1 going f rom methanol to e thanol and an addi- tional 1.25 kcal mo1-1 going f r o m ethanol to n -p ropano l . Table I I I shows that AGa* increases by 1.2 kcal mo1-1 going f rom f o r m a m i d e to ace tamide and an average of 600 cal mol -a for each addit ional methylene g r o u p f r o m acetamide to valeramide. Since M/a* = AGa* + T,SSa*, M-Ia* will increase with AGa* as long as ~Sa* is e i ther positive or zero. &S ° for part i t ion between water and pu re liquid hydroca rbon increases by 1 eu per methylene g r o u p between e thane and butane (36). Since larger molecules require larger holes to diffuse into, we would also expect ~Sa* to increase with chain length. As a consequence, M/a* would be expected to increase with the increase in AGa* and thus, to compensa te for the decrease of M4 °. Hence , those t he rmodynamic pa ramete r s of the pe rmea t ion process that have so far been measured a p p e a r to fit in a self-consistent f rame- work.
Comparison with Red Cell Permeation
Sha'afi et al. (1) have measu red the permeabi l i ty coefficients o f the h u m a n red cell for the same homologous series of amides and have found a m i n i m u m at p rop ionamide . T h e y also in te rp re ted the m i n i m u m as evidence of two separate rate-control l ing processes which were identified as pe rmea t ion in two separate pathways, one hydrophi l ic and the o ther lipophilic. We have observed a mini- m u m in lipid bilayer pe rmea t ion , at acetamide ra ther than p rop ionamide , and have also in te rp re ted the m i n i m u m in te rms o f two rate-control l ing processes, one part i t ion into the m e m b r a n e , and the o ther diffusion across it. T h e question that this raises is whether the demons t ra t ion of the latter mechanism in bilayers casts doub t on the conclusions previously advanced for red cells.
T h e most convincing evidence that this is not the case is given in Tab le IV which shows the effect o f phlore t in on l iposome permea t ion . When phlore t in at a concentra t ion of 2.5 × 10 -4 M is added to e i ther egg lecithin or red cell lipid l iposomes, the relative rate of swelling is increased by about 75% for both hydrophil ic and lipophilic amides and by more than a factor of 2 for urea . Cass et al. (38) have also observed that phloret in doubles the permeabi l i ty o f lecithin-
T A B L E I V
EFFECT OF PHLORETIN ON AMIDE PERMEATION IN LIPOSOMES AND RED CELLS
Solute
Relative swelling rate phloretin-treated&ontrol Relative permeability coef- ficient phloretin-
Egg lecithin liposomes Red cell lipid liposomes treated/control, Red cells (15°C) (10~C) (20°C)
Formamide 1.8 1.8 0.55 Acetamide 1.9 1.7 0.80 Propionamide 1.6 Butyramide 1.1 n-Valeramide 1.7 1.8
Urea 2.5* 0.34
* Average of two values, one at 16°C (2.3) and one at 12°C (2.7).
on April 19, 2017
Dow
nloaded from
Published January 1, 1976

60 T H E J O U R N A L O F G E N E R A L P H Y S I O L O G Y " V O L U M E 67 • 1976
cholesterol bilayers to acetamide. In the case of the red cell, however, Owen and Solomon (39) have shown that phloret in at 2.5 × ]0 -4 M inhibits the passage of the hydrophil ic solutes whereas it stimulates the permeat ion of the lipophilic solutes, the degree of stimulation being propor t ional to k e t n e r . These latter results were conf i rmed by Owen et al. (40) for phloret in concentrat ions above 10 -4 M, who found phloret in to inhibit the permeat ion of fo rmamide , acetamide, and urea whereas it increased the flux of propionamide , and many o ther lipophilic solutes. Thus , with respect to the effect of phloret in, the permeat ion process of lipid bilayers has propert ies similar to the lipophilic path in red cell membranes .
Fur ther insight into the dif ference between red cell membranes and lipid bilayer can be obtained by the use of AGa*, which increases linearly with 178 in the lipid bilayer (Fig. 4). In o ther words, af ter making allowance for the parti t ion coefficient, the lipid bilayer discriminates among the monoamides strictly accord- ing to size. This is not the case for the red cell membrane . AGa* has been computed for the permeat ion of monoamides across the human red cell mem- brane using the data of Sha'afi et al. (1) and Eq. 8. T h e values are plotted in Fig. 5 together with comparable data f rom Fig. 4. In lipid bilayers AGa* depends linearly on molar volume as we have seen, whereas in the red cell the depend- ence of AGd* on molar volume, is biphasic. This shows that the explanat ion we have given to account for the minimum in lipid bilayer permeat ion does not suffice to explain the red cell case. AGn* depends more sharply on l?s for the two smaller solutes in the red cell than it does in lipid bilayers because these solutes enter the red cell th rough an aqueous pathway. For such solutes the size of the aqueous channel discriminates effectively among solutes according to size, the smaller the molecule, the more impor tant the aqueous pathway. It is interest ing that the larger lipophilic solutes also permeate the red cell membrane faster than lipid bilayers. This may be at t r ibuted in part to differences in crossing the interface. Fig. 3 shows that, R~m, the resistance for crossing the interface, is about l0 times greater for spherical bilayers than for h u m an urea cells.
It is also instructive to compare urea permeat ion across lipid bilayers and red cells. Urea permeates bilayers very much more slowly than does fo rmamide so that the ratio Pd,urea/Pd,formamide is 0.053 (from Table I). As has already been stated, this d i f ference can be accounted for: in part by differences in keth~r, in part by steric factors, and in part by h indrance to urea diffusion th rough the polar regions on ei ther face of the lipid bilayer as a result of hyd rogen bond formation. By contrast , Sha'afi et al. (1) have found Pd,urea/Pd,formamide t o be 0.83 in h u m a n red cells, 14 times larger than the f igure for the lipid bilayer. T h e r e is an even more striking d i f ference when urea permeat ion is compared with that of water. Urea permeates lipid bilayers much more slowly than water, the ratio Pa,urea/Pa,n2o being 0.0031, more than an o rde r o f magni tude smaller than the 0.11 ratio for Pa.u~a/Pa.H2O in h u m a n red cells (1). To obtain the lipid bilayer ratio, we have used the hydraulic conductivity of the lipid bilayers, ra ther than the T H O permeabili ty coefficient in o rder to correct for the unst i r red layer as already discussed.
It has been suggested (41,42) that carrier mechanisms may be involved in the t ranspor t of urea across the red cell membrane . However , the red cell data fit
on April 19, 2017
Dow
nloaded from
Published January 1, 1976

POZNANSKY ET AL. Nonelectrolyte Diffusion across Lipid Bilayer Systems 61
quantitatively to expectat ions for passive diffusion th rough nar row aqueous channels. Urea diffusion depends upon molar vo lume in exactly the same way as o ther hydrophil ic solutes such as ethylene glycol and acetamide. Such nar row channels have been induced in lipid bilayers (3,43) by the action of the antibiot- ics, nystatin, and amphote r ic in B. Holz and Finkelstein (43) have shown that the ratio Pa,,,rea/Pa,water is 0.11 in amphote r ic in B-treated p lanar bilayers, in r emarka - ble a g r e e m e n t with the 0.11 rat io for h u m a n red cell m e m b r a n e s . F u r t h e r m o r e , on the basig of i n d e p e n d e n t evidence, de Krui j f f and Demel (44) have p roposed that amphoter ic in B and cholesterol are complexed in lipid bilayers to f o r m an aqueous pore of 4-A radius in good a g r e e m e n t with the 4.3--4.5-A radius p roposed for the equivalent pore in h u m a n red cells (45). This suggests that if there is a carr ier mechanism for urea t ranspor t in h u m a n red cells, its p roper t ies should be similar to those of an amphote r ic in B pore . Thus the passage of urea across h u m a n red cell m e m b r a n e s differs strikingly f rom diffusion across an unmodi f i ed lipid bilayer, but is consistent with passage th rough small aqueous channels.
A P P E N D I X
U n s t i r r e d L a y e r C o r r e c t i o n s f o r T h i n S p h e r i c a l M e m b r a n e s
j . M . M I L G R A M
The problem considered here is the steady-state diffusion of a substance through a composite spherical shell made up of a membrane and unstirred layers on both sides of the membrane. Fig. 6 shows the geometry of the system. The concentration of the diffusing substance is called C. C satisfies the spherically symmetric Laplace equation
1 d ( r 2 d._~_r)=0 ' ( l a ) r 2 d r \
The solution to this equation in any homogeneous domain is:
c = a + b. (2a) r
Thus, in region 1,
and in region 2,
C = A _ + B, (3 a) r
C = G + H. (4a) t
A , B , G , and H are constants to be determined from the boundary and continuity condi- tions. The boundary conditions are: at r = R in region 1,
C = C , , I = A - + B, (5a) R
and
on April 19, 2017
Dow
nloaded from
Published January 1, 1976

62 THE JOURNAL OF GENERAL PHYSIOLOGY' VOLUME 67. 1976
~,v co (UnStJrred Io~e~ %-
~St i r red FIGURE 6. Geomet ry for a spherical vesicle with uns t i r red layers inside and out- side. D1 and D= are di f fus ion coefficients , C1 and C= are concent ra t ions at the edges of the uns t i r red layers fur thes t f rom the m e m b r a n e and C,,, and C,~, are concentra- tions at the m e m b r a n e .
at r = R in reg ion 2
and
d_C_C = _ A , (6 a) dr R 2
C =-Cm, :G-- + H , (7a) R
dC G
dr R 2 (8 a)
a t r = R + t l
and a t r = R - t 2
A C = C 1 - + B, (9a)
R +/1
C = C 2 - G + H. (10a) R - t2
T h e flow rate o f the d i f fus ing substance is called Q and is given by Fick's Law as:
Q = _4rrRZ D --,de (11 a) dr
where D is the di f fus ion coeff icient . T h e continuity condi t ion at the m e m b r a n e is that the flow rates on each side must be equal . Thus ,
on April 19, 2017
Dow
nloaded from
Published January 1, 1976

POZNANSKY ET AL. Nonelectrolyte Diffusion across Lipid Bilayer Systems 63
Q = 47rR2D 1 ( - a -~--~) =4"/rR2D2 ( - ~ 2 ) , (12a)
where D~ and D2 are the diffusion coefficients in region 1 and region 2, respectively. The definition of the membrane permeability coefficient, Pa,tru~ is:
Pa.true = Q (13 a) 47fR2(Cm, -- Crux )
However, in an experiment Cml and Cm2 are not measured, but instead, C1 and C2, the concentrations just outside the unstirred layers, are known. The apparent permeability coefficient for the system of unstirred layers and membrane is called Pa.obs and is defined by:
Pa,obs = Q (14 a) 4~R2(C2 - C0
The purpose of this appendix is to give the relationship between Pa.true and Pa,obs. From Eqs. 13 a and 14 a,
__ l. . .~ = 1 Gin, - Cra, (15 a) Pd,true Pd.obs C2 -- C1
It is necessary to determine Cm, - Cm, in terms of C2 - C~. From Eqs. 5 a and 7 a,
G - A C m , - C m , - - - + H - B . (16a) R
A , B , G , and H can be determined from Eqs. 9 a, 10 a, 12 a, and 14 a as:
A = R Po(Cz - Cl) , Dl
B = Cl -- R2 Pd.obs(C2 - CO
D1 (R + tl)
G = R2 Pd,obs(C2 -- C1), D2
R 2 Pa,obs(C2 -- CI) H = C2 - - - D 2 (R - t2)
Using Eqs. 17 through 20 in Eq. 16 then gives
f -
- c m , = ( c2 - c 1 ) I1 - Pd,obs [ Then from Eqs. 15 and21,
1 1
(17 a)
(18a)
(19a)
(20 a)
D2t, Q - ~ ) +D,t2 (1 + ~ ) 1 (21a)
J D2tl (1 - ~ ) + D l t 2 (1 + ~ )
Pd,true Pd,obs DID2 (1+ ~) (l - t~) (22 a)
on April 19, 2017
Dow
nloaded from
Published January 1, 1976

64 THE JOURNAL OF GENERAL PHYSIOLOGY ' VOLUME 67 ' 1976
Eq. 22 is exact for the problem solved here. A simpler approximate result is obtained by expanding Eq. 22 in powers oftl/R and t2/R and retaining terms up to o rder t JR and t2/R only.
1 1 t l ( l _ _ t , ) tz ( ~ ) Pa,tru~ Pa,,,.~ D~ ~ - ~ 1 + . (23 a)
This stud~' has been supported in part by National Institutes of Health grants 2 ROI GM15692-06 and 5 T01 GM00782-15.
Received for publication 2 June 1975.
BIBLIOGRAPHY
1. SHA'AVl, R. I. , C. M. GAI~v-BoBo, and A. K. SOLOMON. 1971. Permeability of red cell membranes to small hydrophil ic and lipophilic solutes. J. Gen. Physiol. 58:238.
2. DE GIER, J . , J. G. MANDrRSLOOT, J. V. HUPKES, R. N. McELHANEY, and W. P. VAN BEEK. 1971. On the mechanism of non-electrolyte permeat ion through lipid bilay- ers and through biomembranes. Biochim. Biophys. Acta. 233:610.
3. ANDREOLI, T. E., V. W. DENNIS, and A. M. WHGL. 1969. The effect of amphoter ic in B on the water and nonelectrolyte permeabili ty of thin lipid membranes. J. Gen. Physiol. 53:133.
4. VREEMAN, H. E. 1966. Permeability of thin phospholipid films. III . Koninkl. Ned. Acad. Wet Series B. 69:564.
5. GALLUCCI, E . , S. MICELLI, and C. LIPPE. 1971. Non-electrolyte permeabili ty across thin lipid membranes. Arch. Int. Physiol. Biochim. 79:881.
6. GALLtJCCi, E., S. MICrLLI, and C. LIPPE. 1971. Nonelectrolyte permeabili ty across lipid bilayer membranes. First European Biophysical Congress, Baden. 3:181 (Abstr.).
7. LlePr, C. 1969. Urea and thiourea permeabilit ies of phospholipid and cholesterol bilayer membranes . J . Mol. Biol. 39:660.
8. Lxeer, C., E. GALLUCCI, and C. STORELLt. 1971. Permeabilities of ethylene glycol and glycerol through lipid bilayer membranes and some epithelia. Arch. Int. Physiol. Biochim. 79:315.
9. JUNG, C. Y. 1971. Permeability of bimolecular membranes made from lipid extracts of human red cell ghosts to sugars . J . Membr. Biol. 5:200.
10. RousER, G., G. KRITCHEVSKY, D. HrLLER, and E. LIrBER. 1963. Lipid composition of beef brain, beef liver, and the sea anemone: two approaches to quantitative fractionation of complex lipid mixtures. J. Am. Oil Chem. Soc. 40:425.
11. SINGLETON, W. S., M. S. GRAY, M. L. BROWN, and J. L. WH1TE. 1965. Chromato- graphically homogeneous lecithin from egg phospholipids. J . Am. Oil Chem. Soc. 42:53.
12. MIYAMOTO, V. K. , and T. E. THOMPSON. 1067. Some electrical propert ies of lipid bilayer membranes. J . Colloid Interface Sci. 25:16.
13. BANGHAM, A. D . , J. DE GIER, and G. E. GREVILLE. 1967. Osmotic propert ies and wa- ter permeabili ty of phosphol ipid liquid crystals. Chem. Phys. Lipids. 1:225.
14. BRUCKDORrER, K. R., R. A. DEMEL, J. DE GIER, and L. L. M. VAN DErNEN. 1969. The effect of partial replacements of membrane cholesterol by other steroids on the osmotic fragility and glycerol permeabili ty of erythrocytes. Biochim. Biophys. Acta. 183:334.
on April 19, 2017
Dow
nloaded from
Published January 1, 1976

POZNANSKY ET AL. Nonelectrolyte Diffusion across Lipid Bilayer Systems 65
15. COHEN, B. E., and A. D. BANCHAM. 1972. Diffusion of small non-electrolytes across liposome membranes. Nature (Lond.). 236:173.
16. CASS, A., and A. F1NKELSTEIN. 1967. Water permeabili ty of thin lipid membranes . J . Gen. Physiol. 50:1765.
17. EVERITT, C. T. , W. R. REDWOOD, and D. A. HAVDON. 1969. Problem of boundary layers in the exchange diffusion of water across bimolecular lipid membranes. J . Theor. Biol. 22:20.
18. HANAI, T. , and D. A. HAYDON. 1966. The permeabili ty to water of bimolecular lipid membranes . J . Theor. Biol. 11:370.
19. EVERIT'V, C. T. , and D. A. HAYDON. 1969. Influence of diffusion layers dur ing osmotic flow across bimolecular lipid membranes . J . Theor. Biol. 22:9.
20. GINZBURC, B. Z., and A. KATCHALSKY. 1963. The frictional coefficients of the flows of non-electrolytes through artificial membranes . J . Gen. Physiol. 47:403.
21. COLLANDER, R. 1949. Die vertei lung organischer verbindungen zwischen iither und wasser. Acta Chemica Scand. 3:717.
22. LANCE, Y., C. M. GARY-BoBo, and A. K. SOLOMON. 1974. Nonelectrolyte diffusion through lecithin-water lamellar phases and red cell membranes. Biochim. Biophys. Acta. 339:347.
23. FE'rTXPLACr, R., D. M. ANDREWS, and D. A. HAYDON. 1971. The thickness, com- position and structure of some lipid bilayers and natural membranes. J. Membr. Biol. 5:277-296.
24. TOYOSHIMA, Y., and T. E. THOMPSON. 1975. Chloride flux in bilayer membranes: the electrically silent chloride flux in semispherical bilayers. Biochemist~. 14:1518.
25. PAGANO, R., and T. E. THOMeSON. 1967. Spherical lipid bilayer membranes. Biochim. Biophys. Acta. 144:666.
26. L)~UGER, P., W. LESSLAUER, E. MARTI, and J. RICHTER. 1967. Electrical propert ies of bimolecular phosphol ipid membranes. Biochim. Biophys. Acta. 135:20.
27. SOLOMON, A. K. 1975. Thermodynamic aspects of nonelectrolyte permeat ion of lipid bilayers. Proceedings of Vatican Study Week. In press.
28. ZWOLINSKI, B. J . , H. EYRING, and C, E. REESE. 1949. Diffusion and membrane permeabi l i ty .J . Phys. Colloid Chem. 53:1426.
29. Ro'rH, S., and P. SEEMAN. 1972. The membrane concentrations of neutral and positive anesthetics (alcohols, chlorpromazine, morphine) fit the Meyer-Overton rule of anesthesia; negative narcotics do not. Biochim. Biophys. Acta. 255:207.
30. DIAMOND, J. M., and Y. KATZ. 1974. Interpreta t ion of nonelectrolyte partit ion coefficients between dimyristoyl lecithin and water. J. Membr. Biol. 17:1"21.
31. GALEV, W. R., J. D. OWEN, and A. K. SOLOMON. 1973. Tempera tu re dependence of nonelectrolyte permeat ion across red cell membranes. J . Gen. Physiol. 61:727.
32. GLASS'rONE, S., K. J. LAIDLER, and H. EYRING. 1941. The Theory of Rate Processes. McGraw Hill Book Company, New York. Chap. IX:477.
33. CHERRY, R. J. , and D. CHAPMAN. 1969. Optical propert ies of black lecithin f i lms.J . Mol. Biol. 40:19.
34. SOLOMON, A. K., and C. M. GARY-BoBo. 1972. Aqueous pores in lipid bilayers and red cell membranes. Biochim. Biophys. Acta. 225:1019.
35. SErMAN, P., S. ROTH, and H. SCHNEIDER. 1971. The membrane concentrations of alcohol anesthetics. Biochim. Biophys. Acta. 225:171.
36. LELIEVRE, J., and G. T. RICH. 1973. The permeabili ty of lipid membranes to non-
on April 19, 2017
Dow
nloaded from
Published January 1, 1976

6 6 THE JOURNAL OF GENERAL PHYSIOLOGY " VOLUME 6 7 • 1 9 7 6
electrolytes. Biochim. Biophys. Acta. 298:15. 37. TANVORO, C. 1973. The Hydrophobic Effect: Formation of Micelles and Biological
Membranes. John Wiley and Sons, New York. Chap. 4. 38. CASS, A., O. S. ANDERSEN, I. KATZ, and A. FINKELSTEIN. 1973. Phloretin's action on
cation and anion permeability of modified lipid bilayers. Biophys. Soc. Annu. Meet. Abstr. 13:108a.
39. OWEN, J. D., and A. K. SOLOMON. 1972. Control of nonelectrolyte, permeability in red cells. Biochim. Biophys. Acta. 290:414.
40. OWEN, J. D., M. STEGGALL, and E. M. ERRING. 1974. The effect of phloretin on red cell nonelectrolyte permeability.J. Membr. Biol. 19:79.
41. MACEY, R. I., and R. E. L. FARMER. 1970. Inhibition of water and solute permeability in human red cells. Biochim. Biophys. Acta. 211:104.
42. WIETH, J.-O., J. FUNDER, R. B. GUNN, and J. BRAHM. 1974. Comparative Biochemis- try and Physiology of Transport . L. Bolis, K. Bloch, S. E. Luria, and F. Lynen, editors. North Holland Publishing Co., Amsterdam, 317.
43. HOLZ, R., and A. FINKELSTEIN. 1970. The water and nonelectrolyte permeability induced in thin lipid membranes by the polyene antibiotics nystatin and amphoteri- cin B.J . Gen. Physiol. 56:125.
44. DE KRUIJVF, B., and R. A. DEMEL. 1974. Polyene antibiotic-sterol interactions in membranes of Acholeplasma laidlawii cells and lecithin liposomes. III . Molecular structure of the polyene antibiotic-cholesterol complexes. Biochim. Biophys. Acta. 339:57.
4 5 . S O L O M O N , A. K. 1968. Characterization of biological membranes by equivalent pores. J. Gen. Physiol. 51:335s.
on April 19, 2017
Dow
nloaded from
Published January 1, 1976