nonaqueous media for separation of nonionic organic compounds by capillary electrophoresis
TRANSCRIPT
Nonaqueous media for separation of nonionicorganic compounds by capillary electrophoresisFor the separation of neutral compounds by micellar electrokinetic chromatography,separations are usually carried out in predominantly aqueous solution in order topreserve the charged micelle necessary for the separation. We now show thatpolycyclic aromatic hydrocarbon (PAH) compounds can be separated efficiently bycapillary electrophoresis in pure methanol or in aqueous-organic mixtures containing ahigh percentage of methanol. Sodium tetradecyl sulfate was the preferred surfactant.The effects of pH, solvent composition, surfactant structure, and surfactant concen-tration on the separations were studied. Reproducible migration times and linearcalibration plots were obtained.
Keywords: Anionic surfactant / Capillary electrophoresis / Polycyclic aromatic hydrocarbonseparation / Solvophobic interaction EL 3228
Jie LiJames S. Fritz
Department of Chemistryand Ames Laboratory,Iowa State University,Ames, IA, USA
1 Introduction
Since its inception, capillary electrophoresis (CE) hasdeveloped into a powerful technique for the separation ofa wide variety of neutral compounds as well as inorganicand organic ions [1±7]. Most CE applications have beencarried out in aqueous buffers because water is easy tohandle and dissolves most chemicals used in CE.Extensive knowledge about chemistry in aqueous phasesis available. However, the attainable diversity in thebackground electrolyte (BGE) properties in water islimited and is largely determined by the physicochemicalparameters of water. Organic solvents have differentphysical and chemical characteristics from water and fromeach other. Therefore, when a nonaqueous medium issubstituted for water, all important properties of CEseparations, such as resolution, selectivity, efficiencyand analysis time, can be greatly influenced.
CE applications in nonaqueous media have been gainingpopularity over the last several years. For example,nonaqueous media have been successfully applied forchiral separations [8] and drug purity tests [9, 10]. Valkó etal. [11] concisely reviewed CE in nonaqueous media. Theimportant properties of organic solvents and their poten-tial in CE were discussed. Several commonly usednonaqueous solvents include acetonitrile [12, 13], meth-
anol [14±17], formamide [18±21], N-methylformamide[22], and N,N-dimethylformamide [23]. Compared withaqueous media, nonaqueous solvents offer wider rangesof dielectric constant, polarity, viscosity, and acid/basechemistry. Besides, currents are generally lower innonaqueous media than they are in aqueous buffers ofthe same ionic strength [18]. An additional advantage ofCE in nonaqueous media is the better compatibility withmass spectrometry, as shown by several reports in thisarea [24±28]. CE systems using solvent mixtures havealso been employed to alter the selectivity [9, 14, 21].
Virtually all CE separations in nonaqueous solvents havebeen concerned with ions or ionizable compounds wheretheir intrinsic charges could be used for separation.Separation of neutral analytes is possible only when theanalytes are associated with a charged surfactant or otheradditive in solution or in a micellar pseudo-phase. A highfraction of an organic solvent in the BGE has tacitly beenassumed to prevent the interaction between surfactantand analytes necessary for separation of neutral analytes.However, Walbroehl and Jorgenson [29] were able toseparate six neutral organic compounds in aqueous-organic solutions containing 50% or more of acetonitrileby the addition of a tetrahexylammonium salt to the BGE.They attributed the separation to association in solutionbetween the analytes and the charged additive. Morerecently, Shi and Fritz [3, 7] and Ding and Fritz [1, 6] haveused various charged additives to separate neutralanalytes in solutions containing up to 40% acetonitrile.Polymerized surfactants have also been employed forseparation of neutral organic compounds [30].
The present study shows that neutral organic compoundscan be separated successfully in aqueous-organic sol-utions containing 70±100% methanol. An anionic surfac-tant was added to the BGE to form charged association
Correspondence: Dr. James S. Fritz, 332 Wilhelm Hall, AmesLaboratory, Iowa State University, Ames, IA 50011, USAE-mail: [email protected]: +515-294-3578
Abbreviations: BGE, background electrolyte; NACE, nonaqu-eous capillary electrophoresis; PAH, polycyclic aromatic hydro-carbon; SHS, sodium hexadecyl sulfate; STS, sodium tetradecylsulfate
� WILEY-VCH Verlag GmbH, 69451 Weinheim, 1999 0173-0835/99/0101-0084 $17.50+.50/0
84 Electrophoresis 1999, 20, 84±91

complexes with the analytes through solvophobic inter-actions. The effects of several parameters on theseparations were studied, including the type and concen-tration of surfactant, the percentage of methanol in theBGE, and the apparent pH.
2 Materials and methods
2.1 Chemicals
All chemicals were of the highest grade available. Organicsolvents, phosphoric acid (85%), hydrochloric acid (HCl),acetic acid, ammonium acetate and sodium dodecylsulfate (SDS) were purchased from Fisher Scientific (FairLawn, NJ, USA). Sodium n-tetradecyl sulfate (STS) andsodium n-hexadecyl sulfate (SHS) were obtained fromLancaster Synthesis (Windham, NH, USA). Deionizedwater (18.2 MW) was made with a Barnstead Nanopure IIsystem (Syron Barnstead, Boston, MA, USA). BGEs wereprepared by mixing desired buffer species and surfactantin pure methanol or solvent mixture, and the solutionswere filtered through a 0.45 mm syringe filter (Costor,Cambridge, MA, USA) when necessary. The apparent pHof the electrolytes was measured with a Corning 440 pHmeter (Corning, NY, USA). The standards of polycyclicaromatic hydrocarbon (PAH) compounds were purchasedfrom Aldrich (Milwaukee, WI, USA). Acidic and basicdrugs were purchased from Sigma (St. Louis, MO, USA).All stock solutions were made in acetonitrile at concen-trations of 1000±2000 ppm. Before injection, samplesolutions were diluted with 5% BGEs in methanol. Safetywas an important factor because many organic substan-ces with different toxicities were involved in this work.Throughout the work, safety gloves and protectiveclothing were used, and all solutions were preparedunder the hood.
2.2 Instrumentation
A Waters Quanta 4000 capillary electrophoresis system(Millipore Waters, Milford, MA, USA) was employedthroughout this work. Uncoated fused-silica capillarieswere 45 cm � 50 mm, and the length from injection end tothe detector was 37 cm. Unless specified, a voltage of±20 kV was applied for all experiments, and the currentgenerated was kept below 30 mA. Direct UV detection wasperformed at 254 nm unless indicated. Electrophero-grams were collected at the speed of 15 points/s andplotted by Chromperfect data acquisition system (JusticeInnovations, Mountain View, CA, USA). Each newcapillary was conditioned with 0.1 M sodium hydroxideand deionized water for 10 min each. When changing theelectrolytes, capillaries were rinsed with deionized waterfor 10 min, followed by methanol rinsing for 1 min. Before
each sample injection, capillaries were rinsed with therunning electrolyte for 1.5 min. Due to solvent evapo-ration, electrolyte reservoirs were frequently replenishedbetween runs.
3 Results and discussion
Several organic solvents, including methanol, acetonitrileand isopropyl alcohol, were tried initially as the separationmedium. These solvents were chosen because of theirpurity, ready availability, and relatively minor toxicity.Methanol was found to better dissolve the buffer andsurfactants than the other two, so it was employed as theseparation solvent for all of this work.
3.1 Selection of the BGE
In methanol and in aqueous-methanol solvent mixturescontaining a high proportion of methanol, the pH ofcommon buffers is apt to be significantly different frompredominantly aqueous solutions. The pH measured bystandard electrodes in these largely organic solutions isoften referred to as ªapparent pHº (pH*). The effect ofapparent pH on the migration and separation of peryleneand anthracene was studied initially using SDS as theadditive and methanol as the solvent. With 10 mM
ammonium acetate as the buffer, the apparent pH of theBGE was about 8.0. At this apparent pH the electro-osmotic mobility should be reasonably high. In this case, acounter EOF occurred: EOF toward the cathode, and theanalytes moved to the anode by assuming negativecharges through the association with SDS. Since EOFwas relatively high at pH* ~ 8.0, the migration time wasquite long, about 30 min for perylene and 32 min foranthracene. Addition of some acetic acid in the BGEresulted in lower pH* and somewhat shorter migrationtimes, but the improvement was slight. This observationled us to take another approach. By using acidicconditions, EOF would be reduced or eliminated, andthe analysis could be much faster. Hydrochloric acid (HCl)and phosphoric acid (H3PO4) at 10 mM were each tried forthis purpose. The BGE containing HCl had a pH* ~ 1.0,and the one containing H3PO4 had a pH* ~ 2.8. Asexpected, the migration times were significantly shorterwith both HCl and H3PO4. Comparing HCl with H3PO4,HCl gave faster analysis (16.6 min vs. 17.3 min forperylene, 17.7 min vs.18.5 min for anthracene), butH3PO4 produced lower current because of its lowerconductance. Therefore, H3PO4 was selected over HClas the preferred buffer.
The concentration effect of H3PO4 in the BGE was alsostudied. As H3PO4 content was changed from 10 mM to50 mM, there was a slow but steady increase in migration
Electrophoresis 1999, 20, 84±91 NACE of nonionic organic compounds 85
CE
and
CE
C
86 J. Li and J. S. Fritz Electrophoresis 1999, 20, 84±91
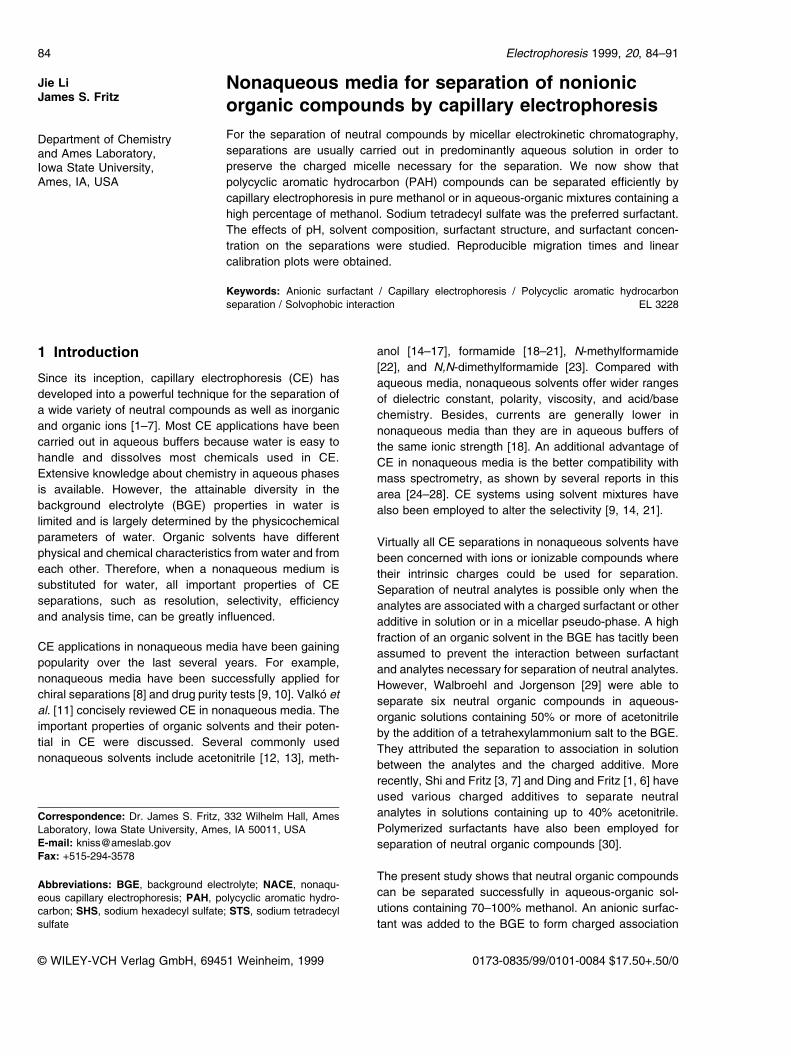
Figure 1. Separation of five PAH com-pounds. Electrolyte: 10 mM H3PO4 and50 mM SDS in methanol; sampleinject ion: ±2 kV, 15 s. Peaks:1, benzo[a]perylene; 2, perylene;3, pyrene; 4, anthracene; 5, benzophe-none.
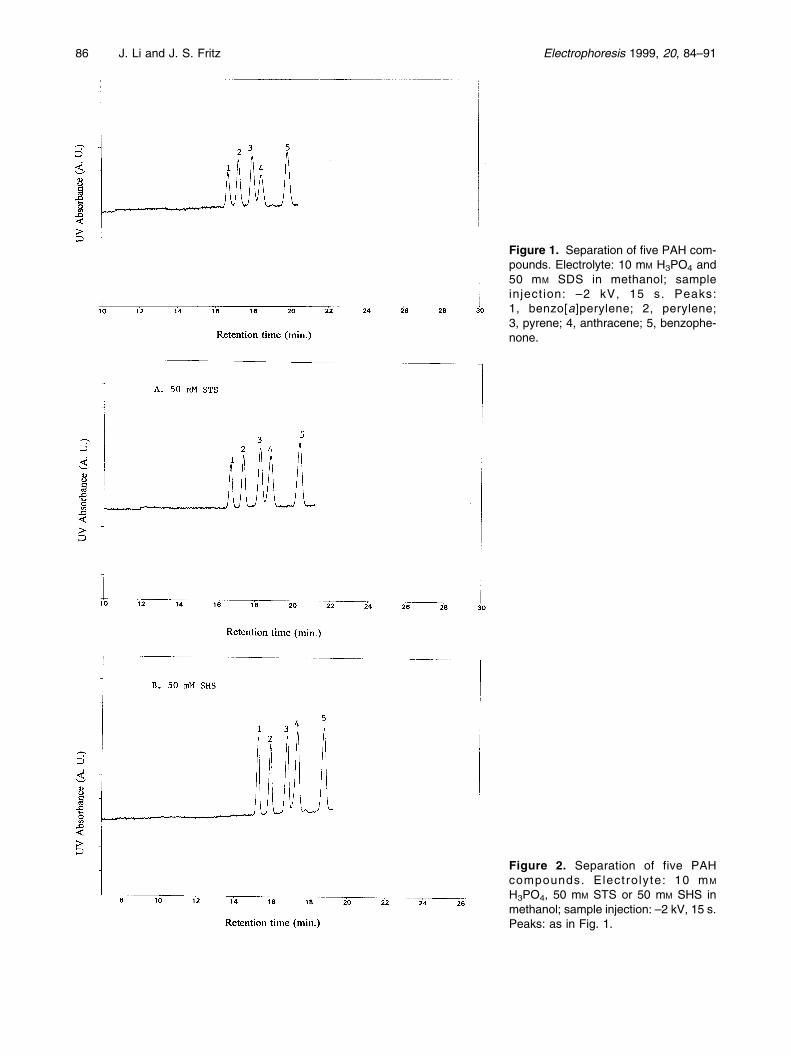
Figure 2. Separation of five PAHcompounds. Electrolyte: 10 mM
H3PO4, 50 mM STS or 50 mM SHS inmethanol; sample injection: ±2 kV, 15 s.Peaks: as in Fig. 1.
times for all the test compounds although the resolutiondid not change much. This increase was thought to be theresult of the increased ionic strength as more H3PO4 wasincluded in the BGE. Similar reports have been publishedabout the influence of ionic strength on the migrationbehaviour of the analytes in nonaqueous capillaryelectrophoresis (NACE) [8]. A separation of five PAHcompounds is shown in Fig. 1 using 10 mM H3PO4 and50 mM SDS in methanol.
3.2 Types and concentration of anionicsurfactant
In order to separate the neutral compounds by CE, ionicadditives which can put charges onto the analytes throughvarious interactions must be included in the BGE. Thiswork employed long-chain anionic surfactants in theNACE running buffers. Surfactants with different chainlengths, including SDS, STS and SHS, were compared.Figure 2 shows the separations of five PAH compoundswith 50 mM of STS and SHS in methanol. Compared withFig. 1, it is evident that the resolution was better withlonger-chain surfactants. Longer surfactants have stron-ger solvophobic interactions with the analytes, and this isbeneficial for their separations.
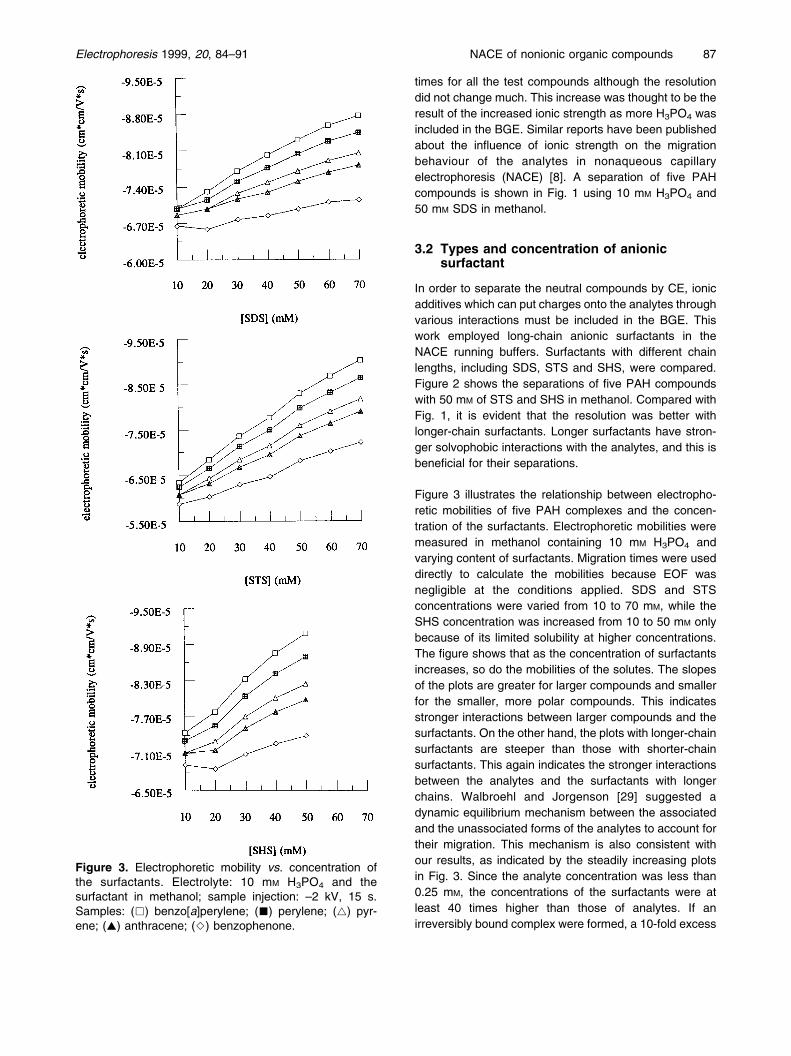
Figure 3 illustrates the relationship between electropho-retic mobilities of five PAH complexes and the concen-tration of the surfactants. Electrophoretic mobilities weremeasured in methanol containing 10 mM H3PO4 andvarying content of surfactants. Migration times were useddirectly to calculate the mobilities because EOF wasnegligible at the conditions applied. SDS and STSconcentrations were varied from 10 to 70 mM, while theSHS concentration was increased from 10 to 50 mM onlybecause of its limited solubility at higher concentrations.The figure shows that as the concentration of surfactantsincreases, so do the mobilities of the solutes. The slopesof the plots are greater for larger compounds and smallerfor the smaller, more polar compounds. This indicatesstronger interactions between larger compounds and thesurfactants. On the other hand, the plots with longer-chainsurfactants are steeper than those with shorter-chainsurfactants. This again indicates the stronger interactionsbetween the analytes and the surfactants with longerchains. Walbroehl and Jorgenson [29] suggested adynamic equilibrium mechanism between the associatedand the unassociated forms of the analytes to account fortheir migration. This mechanism is also consistent withour results, as indicated by the steadily increasing plotsin Fig. 3. Since the analyte concentration was less than0.25 mM, the concentrations of the surfactants were atleast 40 times higher than those of analytes. If anirreversibly bound complex were formed, a 10-fold excess
Electrophoresis 1999, 20, 84±91 NACE of nonionic organic compounds 87
Figure 3. Electrophoretic mobility vs. concentration ofthe surfactants. Electrolyte: 10 mM H3PO4 and thesurfactant in methanol; sample injection: ±2 kV, 15 s.Samples: (&) benzo[a]perylene; (&) perylene; (~) pyr-ene; (~) anthracene; (^) benzophenone.
of surfactants would be enough to completely bind theanalytes, and further increases in surfactant concentra-tions would not lead to a large increase in electrophoreticmobilities.
Another anionic surfactant, sodium dioctyl sulfosuccinate(DOSS), was also tested for this study. DOSS has beenused successfully for separations of nonionic compoundsin aqueous buffers containing up to 40% acetonitrile(ACN) [31]. However, it did not work for our system with100% methanol as the medium. Presumably, its branchedstructure could not provide strong enough interactionswith the analytes in methanol for the analytes to come out
within a reasonable time. In other words, the surfactantadditives with linear long chains were the most effective inseparating nonionic compounds in organic solvents.Considering both the solubility and efficiency, STS wasthe best additive tested.
3.3 Solvent mixtures
The separation window (i.e., the difference in migrationtimes between the first and last analytes) was quite smallin pure methanol for the analytes tested. The low boilingpoint of pure methanol made it necessary to keep thecurrent low to avoid evaporation of methanol throughheating. Consequently, 90/10 v/v mixtures of methanol-formamide, methanol-acetonitrile and methanol-H2Owere tried with the same five PAH compounds as sampleanalytes, and 70 mM STS and 10 mM H3PO4 in the BGE.The methanol-formamide mixture gave a much widerseparation window, but the separation took much longer(~ 38 min for benzophenone) and the efficiency was poor.With methanol-acetonitrile, the separation showed littleimprovement in the elution window and resolution, andthe efficiency was even worse. The mixture of methanol-H2O provided a wider window and better resolutionwithout prolonging the separation. Figure 4 shows theseparation of nine PAH compounds in 90/10 v/v meth-anol-H2O. Compared with separation in pure methanol,where several compounds comigrated with each other(3 and 4, 5 and 6) or were only partially resolved (6 and 7),baseline separation was obtained in this mixed solventsystem.
In order to study the effect of water, the methanol contentin the BGE was varied from 100% to 70%. Lower
88 J. Li and J. S. Fritz Electrophoresis 1999, 20, 84±91
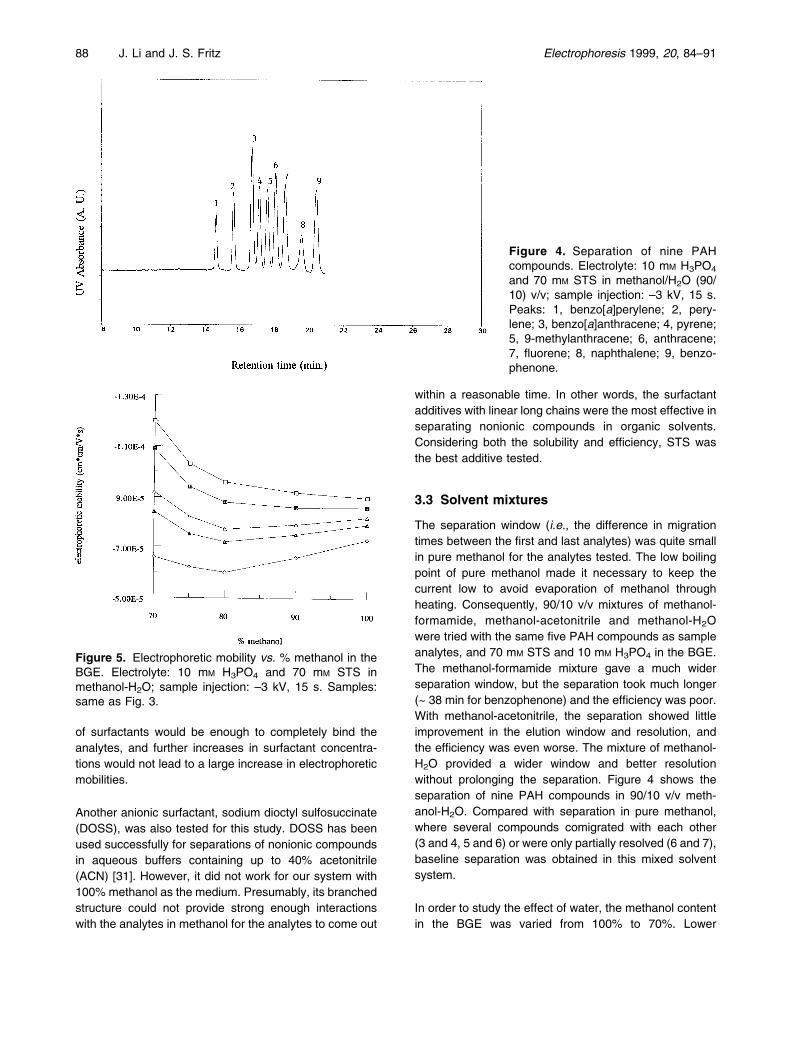
Figure 4. Separation of nine PAHcompounds. Electrolyte: 10 mM H3PO4
and 70 mM STS in methanol/H2O (90/10) v/v; sample injection: ±3 kV, 15 s.Peaks: 1, benzo[a]perylene; 2, pery-lene; 3, benzo[a]anthracene; 4, pyrene;5, 9-methylanthracene; 6, anthracene;7, fluorene; 8, naphthalene; 9, benzo-phenone.
Figure 5. Electrophoretic mobility vs. % methanol in theBGE. Electrolyte: 10 mM H3PO4 and 70 mM STS inmethanol-H2O; sample injection: ±3 kV, 15 s. Samples:same as Fig. 3.

concentrations of methanol were not used because of lowsolubility of STS in the BGE. Figure 5 demonstrates thechange of electrophoretic mobilities with the percentageof methanol. As in Fig. 3, electrophoretic mobilities werecalculated from migration time without considering EOFbecause it was too small. The curved graph of electro-phoretic mobilities in Fig. 5 was considered to be thecombined results of two factors: (i) solvophobic interac-tions between the analytes and the surfactant additive;and (ii) the variation of viscosity (h) and dielectric constant(e) as the percentage of methanol was changed. Theeffect of methanol content on h and e in binary water-methanol mixtures has been well studied in the literature[11]. It was found that e and h became smaller as themethanol concentration in water was increased from 70%to 100%; however, the ratio of e/h grew larger within thesame range. Since electrophoretic mobility is directlyproportional to e/h, it should increase at higher concen-trations of methanol. On the other hand, the solvophobicinteractions become weaker at higher concentration ofmethanol ; the electrophoretic mobility of an analyte dueto complex formation will therefore be smaller. Between70% and 80% methanol, solvophobic interaction waslikely the predominant factor; electrophoretic mobilitiestherefore decreased. Above 80% methanol, a risingmobility trend was observed due to the greater e/h ratio.Benzo[a]perylene and perylene showed a slight decline inmobility because of their relatively strong interactions withSTS. Figure 5 also indicates a wider separation windowand better separation at lower methanol content, asillustrated by Fig. 6 for the separation of nine PAHcompounds in a 75/25 v/v methanol-H2O mixture.
3.4 Separation scope and validation of themethod
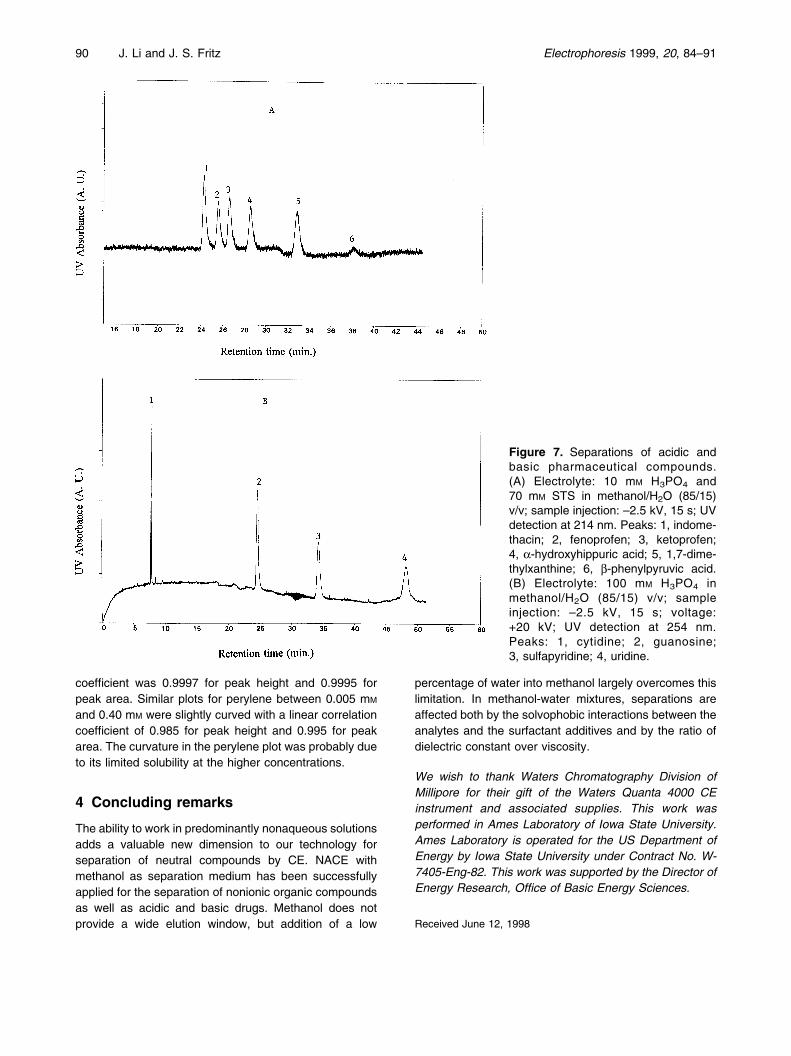
The high proportion of methanol in the solutions used hasa strong tendency to weaken the interactions between theanalytes and the surfactant. The success of the separa-tions reported is likely due to the ability of the hydrophobicand fairly bulky test compounds to resist the effect of highmethanol content. To test this hypothesis several morepolar compounds (acidic and basic pharmaceutical com-pounds) were tested. Figure 7A shows the separation ofsix drugs that would be neutral at the acidic apparent pHused. Although the separation was complete, the migra-tion times were quite long. This is caused by weakerassociation of the relatively polar drugs with STS. Figure7B shows the electropherogram for four basic drugs witha positive power supply and no surfactant present. Thisseparation is due to the intrinsic positive charges on theprotonated analytes. However, these compounds are veryweak bases and thus may be incompletely protonated.
Tests for reproducibility of migration times and linearity ofcalibration plots were performed with perylene andbenzophenone as sample analytes. The BGE contained50 mM SDS and 10 mM H3PO4 in methanol; samples wereinjected hydrostatically. Replenishing the BGE betweenruns, the results from eight consecutive runs showedgood reproducibility for the migration times. The RSD forperylene and benzophenone was 0.55% and 0.73%,respectively. Plots of peak height and peak area as afunction of analyte concentration were linear for benzo-phenone between 0.005 mM and 0.60 mM. The correlation
Electrophoresis 1999, 20, 84±91 NACE of nonionic organic compounds 89
Figure 6. Separation of nine PAHcompounds. Electrolyte: 10 mM H3PO4
and 70 mM STS in methanol/H2O(75/25) v/v; sample injection: ±3 kV,15 s. Peaks: as in Fig. 4.
coefficient was 0.9997 for peak height and 0.9995 forpeak area. Similar plots for perylene between 0.005 mM
and 0.40 mM were slightly curved with a linear correlationcoefficient of 0.985 for peak height and 0.995 for peakarea. The curvature in the perylene plot was probably dueto its limited solubility at the higher concentrations.
4 Concluding remarks
The ability to work in predominantly nonaqueous solutionsadds a valuable new dimension to our technology forseparation of neutral compounds by CE. NACE withmethanol as separation medium has been successfullyapplied for the separation of nonionic organic compoundsas well as acidic and basic drugs. Methanol does notprovide a wide elution window, but addition of a low
percentage of water into methanol largely overcomes thislimitation. In methanol-water mixtures, separations areaffected both by the solvophobic interactions between theanalytes and the surfactant additives and by the ratio ofdielectric constant over viscosity.
We wish to thank Waters Chromatography Division ofMillipore for their gift of the Waters Quanta 4000 CEinstrument and associated supplies. This work wasperformed in Ames Laboratory of Iowa State University.Ames Laboratory is operated for the US Department ofEnergy by Iowa State University under Contract No. W-7405-Eng-82. This work was supported by the Director ofEnergy Research, Office of Basic Energy Sciences.
Received June 12, 1998
90 J. Li and J. S. Fritz Electrophoresis 1999, 20, 84±91
Figure 7. Separations of acidic andbasic pharmaceutical compounds.(A) Electrolyte: 10 mM H3PO4 and70 mM STS in methanol/H2O (85/15)v/v; sample injection: ±2.5 kV, 15 s; UVdetection at 214 nm. Peaks: 1, indome-thacin; 2, fenoprofen; 3, ketoprofen;4, a-hydroxyhippuric acid; 5, 1,7-dime-thylxanthine; 6, b-phenylpyruvic acid.(B) Electrolyte: 100 mM H3PO4 inmethanol/H2O (85/15) v/v; sampleinjection: ±2.5 kV, 15 s; voltage:+20 kV; UV detection at 254 nm.Peaks: 1, cytidine; 2, guanosine;3, sulfapyridine; 4, uridine.
5 References
[1] Ding, W., Fritz, J. S., Anal. Chem. 1997, 69, 1593±1597.
[2] Esaka, Y., Tanaka, K., Uno, B., Goto, M., Kano, K., Anal.Chem. 1997, 69, 1332±1338.
[3] Shi, Y., Fritz, J. S., J. Chromatogr. A 1994, 671, 429±435.
[4] Ahuja, E. S., Preston, B. P., Foley, J. P., J. Chromatogr. B1994, 657, 271±284.
[5] Jones, W. R., Jandick, P. J., J. Chromatogr. 1992, 607,385±393.
[6] Ding, W., Fritz, J. S., Anal. Chem. 1998, 70, 1859±1865.
[7] Shi, Y., Fritz, J. S., J. High Res. Chromatogr. 1994, 17,713±718.
[8] Wang, F., Khaledi, M. G., Anal. Chem. 1996, 68, 3460±3467.
[9] Bjùrnsdottir, I., Hansen, S. H., J. Chromatogr. A 1995, 711,313±322.
[10] Tjùrnelund, J., Hansen, S. H., J. Chromatogr. A 1996, 737,291±300.
[11] Valkó, I. E., SirØn, H., Riekkola, M.-L., LC´GC 1997, 15,560±567.
[12] Walbroehl, Y., Jorgenson, J. W., J. Chromatogr. 1984, 315,135±143.
[13] Hansen, S. H., Tjùrnelund, J. Bjùrnsdottir, I., Trends Anal.Chem. 1996, 15, 175±180.
[14] Salimi-Moosavi, H., Cassidy, R. M., Anal. Chem. 1996, 68,293±299.
[15] Chiari, M., Kenndler, E., J. Chromatogr. A 1995, 716,303±309.
[16] Stalcup, A. M., Gham, K. H., J. Microcol. Sep. 1996, 8,145±150.
[17] Okada, T., J. Chromatogr. A 1995, 695, 309±317.
[18] Sahota, R. S., Khaledi, M. G., Anal. Chem. 1994, 66,1141±1146.
[19] Valkó, I. E., SirØn, H., Riekkola, M.-L., Chromato-graphia 1996, 43, 242±246.
[20] Valkó, I. E., SirØn, H., Riekkola, M.-L., J. Chromatogr. A1996, 737, 263±272.
[21] Leung, G. N. W., Tang, H. P. O., Tso, T. S. C., Wan, T. S.M., J. Chromatogr. A 1996, 738, 141±154.
[22] Jansson, M., Roeraade, J., Chromatographia 1995, 40,163±169.
[23] Salimi-Moosavi, H., Cassidy, R. M., Anal. Chem. 1995, 67,1067±1073.
[24] Tomlinson, A. J., Benson, L. M., Gorrod, J. W., Naylor, S.,J. Chromatogr. B 1994, 657, 373±381.
[25] Naylor, S., Tomlinson, A. J., Benson, L. M., Gorrod, J. W.,Eur. J. Drug Metab. Pharmacokinet. 1994, 19, 235±240.
[26] Lu, W., Poon, G. K., Carmichael, P. L., Cole, R. B., Anal.Chem. 1996, 68, 668±674.
[27] Tomlinson, A. J., Benson, L. M., Naylor, S., LC´GC, 1994,12, 122±130.
[28] Tomlinson, A. J., Benson, L. M., Naylor, S., J. High Res.Chromatogr. 1994, 17, 175±177.
[29] Walbroehl, Y., Jorgenson, J. W., Anal. Chem. 1986, 58,479±481.
[30] Shamsi, S. A., Akbay, C., Warner, I. M., Anal. Chem. 1998,70, 3078±3083.
[31] Shi, Y., Fritz, J. S., Anal. Chem. 1995, 67, 3023±3027.
Electrophoresis 1999, 20, 84±91 NACE of nonionic organic compounds 91