non-sedated abr evaluation - infant hearing 5/sokolov1 session 5... · • parental report of...
TRANSCRIPT
Non-sedated ABR evaluation
Yuri Sokolov, Isaac Kurtz, Olena Sokolova, Aaron Steinman, Cameron Mahon
Vivosonic Inc., Toronto, Canada
EHDI Conference, New Orleans, LA, 25-26, 2008
2
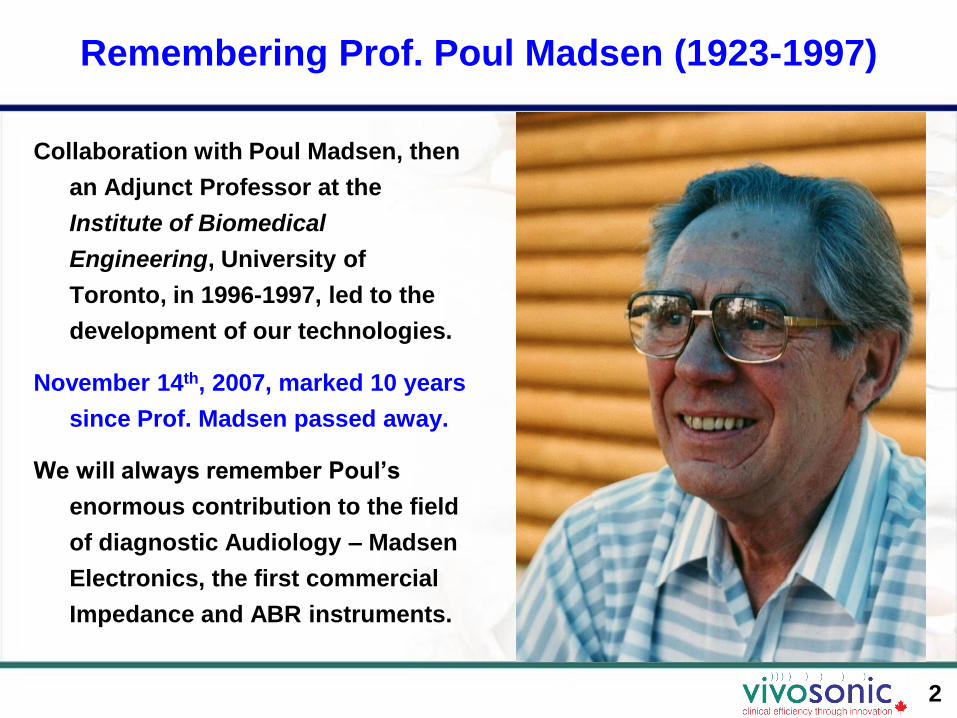
Remembering Prof. Poul Madsen (1923-1997)
Collaboration with Poul Madsen, then
an Adjunct Professor at the
Institute of Biomedical
Engineering, University of
Toronto, in 1996-1997, led to the
development of our technologies.
November 14th, 2007, marked 10 years
since Prof. Madsen passed away.
We will always remember Poul’s
enormous contribution to the field
of diagnostic Audiology – Madsen
Electronics, the first commercial
Impedance and ABR instruments.
3
Presentation outline
• Year 2007 JCIH Position Statement endorsement of ABR in audiological evaluation of infants
• The problem of noises in ABR: Physiological Artifacts and Extraneous noises in ABR
• Recording technologies reducing artifacts and noises in ABR
• Statistical techniques helping clinicians obtain ABR results
• Sufficiency criteria
• Conclusions
• Questions and answers
4
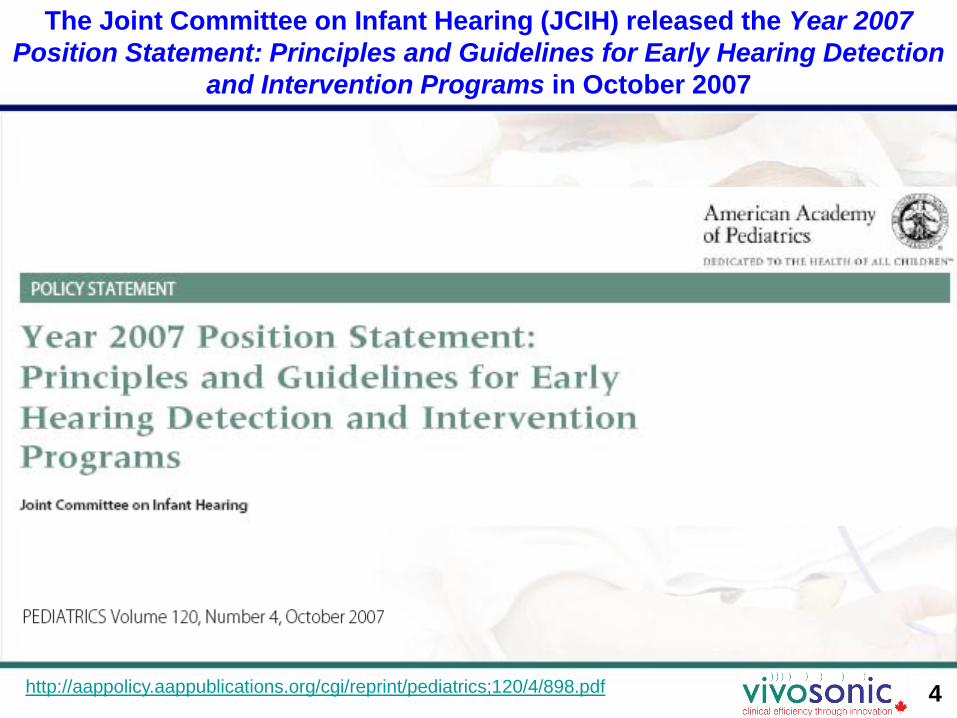
The Joint Committee on Infant Hearing (JCIH) released the Year 2007
Position Statement: Principles and Guidelines for Early Hearing Detection
and Intervention Programs in October 2007
http://aappolicy.aappublications.org/cgi/reprint/pediatrics;120/4/898.pdf
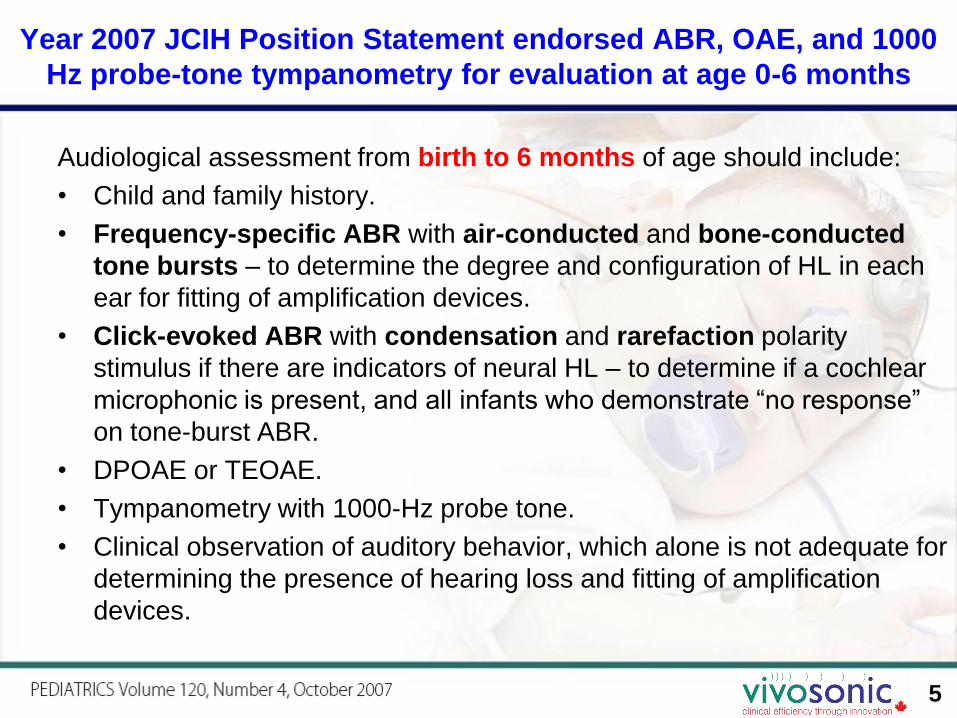
Audiological assessment from birth to 6 months of age should include:
• Child and family history.
• Frequency-specific ABR with air-conducted and bone-conducted
tone bursts – to determine the degree and configuration of HL in each
ear for fitting of amplification devices.
• Click-evoked ABR with condensation and rarefaction polarity
stimulus if there are indicators of neural HL – to determine if a cochlear
microphonic is present, and all infants who demonstrate “no response”
on tone-burst ABR.
• DPOAE or TEOAE.
• Tympanometry with 1000-Hz probe tone.
• Clinical observation of auditory behavior, which alone is not adequate for
determining the presence of hearing loss and fitting of amplification
devices.
5
Year 2007 JCIH Position Statement endorsed ABR, OAE, and 1000
Hz probe-tone tympanometry for evaluation at age 0-6 months
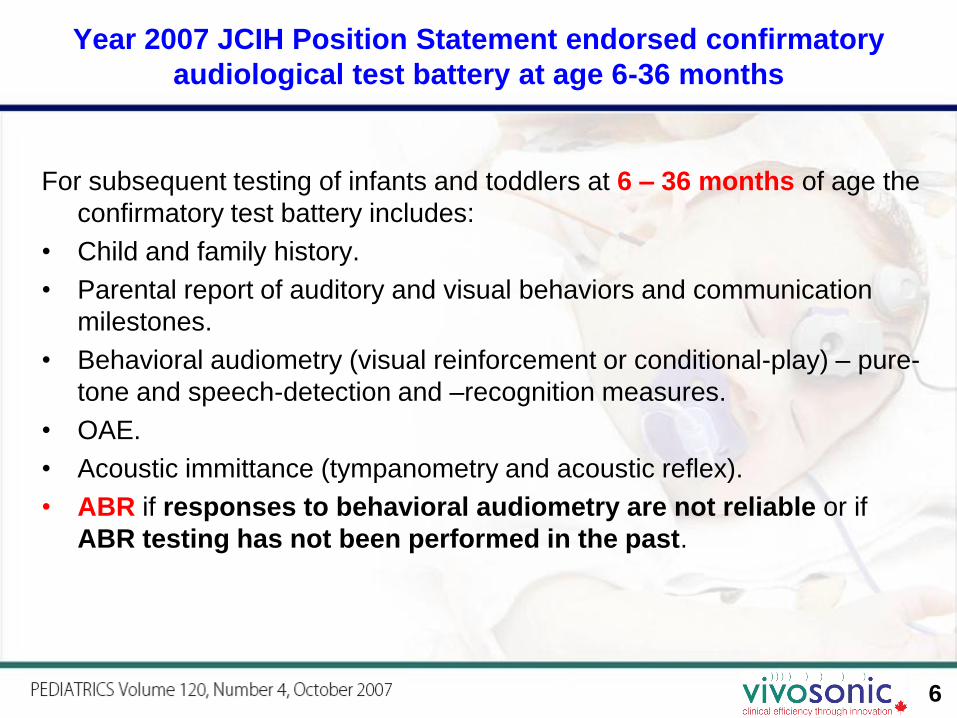
For subsequent testing of infants and toddlers at 6 – 36 months of age the
confirmatory test battery includes:
• Child and family history.
• Parental report of auditory and visual behaviors and communication
milestones.
• Behavioral audiometry (visual reinforcement or conditional-play) – pure-
tone and speech-detection and –recognition measures.
• OAE.
• Acoustic immittance (tympanometry and acoustic reflex).
• ABR if responses to behavioral audiometry are not reliable or if
ABR testing has not been performed in the past.
6
Year 2007 JCIH Position Statement endorsed confirmatory
audiological test battery at age 6-36 months

Auditory Evoked
Potentials (AEPs)
Any electrical potential
that is produced by the
auditory system and that
can be recorded in vivo,
mostly from the scalp.
Auditory Brainstem
Response (ABR)
Generated by the Auditory
Nerve (Cranial Nerve VIII)
and ascending auditory
pathways of the
brainstem.
ABR originates from the Auditory Neural System
Auditory cortex

ABR is the earliest and smallest Auditory Evoked Potential
CNVIII and
Brainstem
Cortical

9
Diagnostic use of ABR requires clear wave morphology at
higher stimulus levels (80-90 dB nHL)
• Response is generated by Acoustic Nerve and Brainstem nuclei
• Characteristic wave morphology with known generators
• Stimulus: Click 80-90 dB nHL
• ABR is a composite of synchronous responses of a large number of neurons
• Elicited by the stimulus onset, unlike pure tones (PT), hence, PT & ABR may disagree (as in Auditory Neuropathy)
• Diagnostic value:• Latencies of Waves I, III, V
• I-III, III-V, I-V intervals
• V/I amplitude ratio
• Has established level-specific latency norms for Waves I, III, and V – for various age groups, from newborns through adults
0 10
I III
V
I-III III-V
I-V
Multiple publications by J. Hall III, L. Hood, D. Stapells, and others.
II
IV
III’
V’
V/I
amplitude
ratio
I’
0.5
Latency, msA
mplit
ude, µ
V
NOTE:
Microvolt (µV) – one millionth of a Volt
Millisecond (ms) – one thousandth of a second
Latency – time after stimulus onset

10
Hearing threshold estimation with ABR is based on finding the
lowest stimulus level at which a RESPONSE is detectable
• Established relationships between ABR and pure-tone (PT) thresholds
• Well researched, established and recommended protocols
• Frequency-specific
• Stimuli are tone bursts rather than click stimuli: typically 500, 1000, 2000, 4000 Hz(needed for HA fitting)
• Levels vary to find the threshold
• Looking for Response threshold
• Approx 10-20 dB higher than pure-tone HL and 10-15 higher than click HL
• Technically similar to screening click-ABR, but stimulus levels vary
• Detect thresholds up to 80-90 dB HL
• Applications
– infant post-screening assessment
– non-cooperative or difficult-to communicate patients: malingerers, language barrier
0 10 ms
Multiple publications by Jay Hall III, Yvonne Sininger, David Stapells, and others.
CLINICAL NOTE:
In retro-cochlear pathology, Wave V may be
absent and thus cannot be used for threshold
estimation. Therefore, frequency-specific
threshold estimation based on Wave V latency is
meaningful only if Wave V is present in diagnostic
click ABR
11
0 10 ms
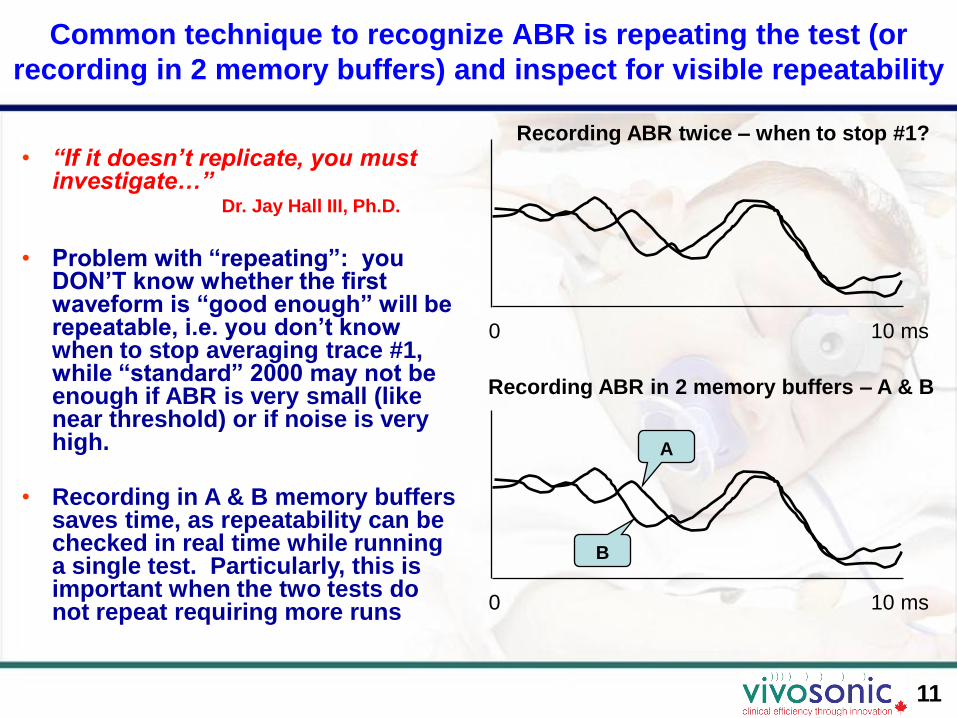
• “If it doesn’t replicate, you must investigate…”
Dr. Jay Hall III, Ph.D.
• Problem with “repeating”: you DON’T know whether the first waveform is “good enough” will be repeatable, i.e. you don’t know when to stop averaging trace #1, while “standard” 2000 may not be enough if ABR is very small (like near threshold) or if noise is very high.
• Recording in A & B memory buffers saves time, as repeatability can be checked in real time while running a single test. Particularly, this is important when the two tests do not repeat requiring more runs
Common technique to recognize ABR is repeating the test (or
recording in 2 memory buffers) and inspect for visible repeatability
0 10 ms
Recording ABR twice – when to stop #1?
Recording ABR in 2 memory buffers – A & B
A
B
12
Clinicians experience significant frustrations with ABR
ABR is often difficult to administer for many clinicians, particularly in harsh clinical environments such as NICU, hospital floor, doctor’s office, and Operating Room (OR):
• Noise is reported by 84 % of U.S. clinics as their FRUSTRATION # 1*)
• Noise artifacts lead to unclear results and long test times – up to 90-120 min, typically 45-60 min per test
• Long test time results in low patient throughput and difficulty of intra-operative monitoring
• Abrading the skin, to reduce impedance, increases the risk of infection **)
• The above factors result in higher risks of misdiagnosis, infection, and operating costs, and reduce diagnostic value of ABR, particularly in medium and small clinics and private practices that do not have shielded rooms and sedation facilities
*) Tannenbaum (2005). **) Ferree et al. (2001)
13
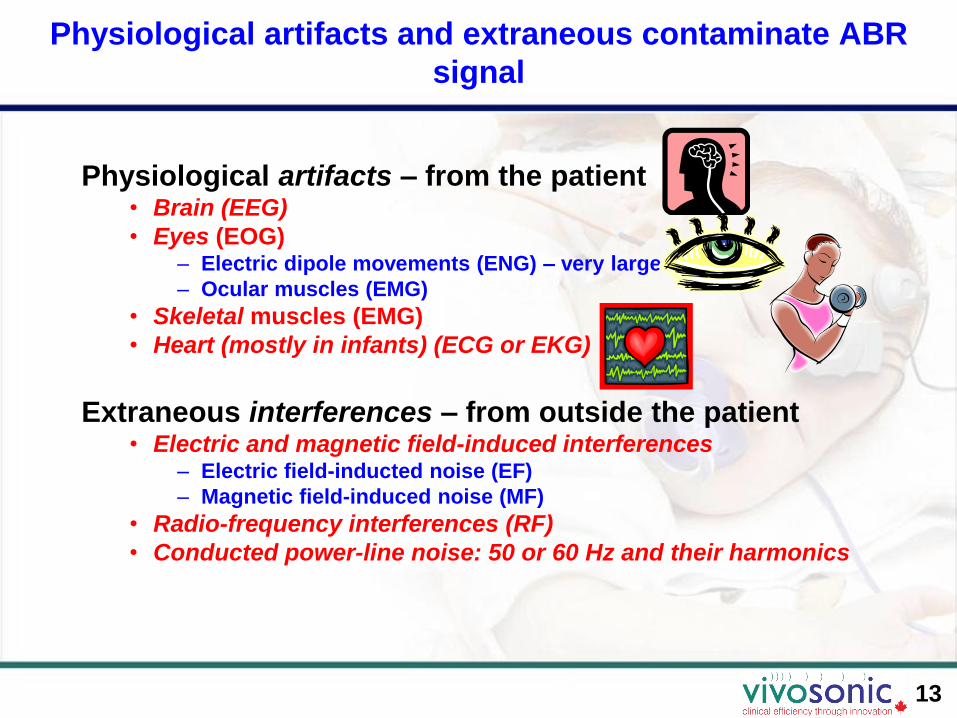
Physiological artifacts and extraneous contaminate ABR
signal
Physiological artifacts – from the patient• Brain (EEG)
• Eyes (EOG)– Electric dipole movements (ENG) – very large
– Ocular muscles (EMG)
• Skeletal muscles (EMG)
• Heart (mostly in infants) (ECG or EKG)
Extraneous interferences – from outside the patient• Electric and magnetic field-induced interferences
– Electric field-inducted noise (EF)
– Magnetic field-induced noise (MF)
• Radio-frequency interferences (RF)
• Conducted power-line noise: 50 or 60 Hz and their harmonics

14
PHYSIOLOGICAL ARTIFACTS
are coming from the patient, independent from the
environment, and thus cannot be “shielded”
15
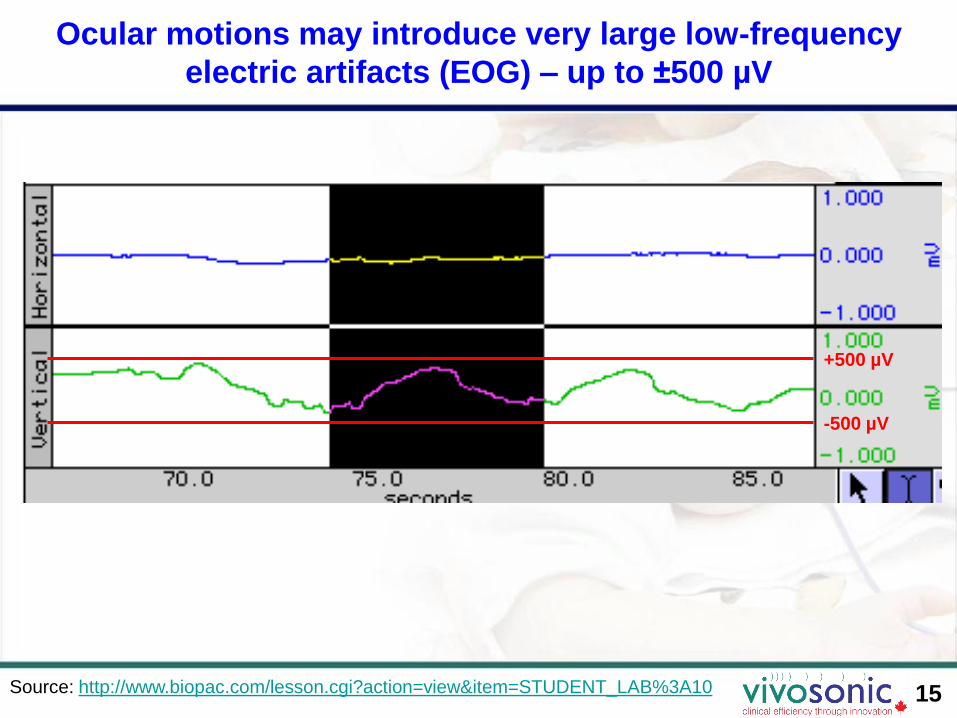
Ocular motions may introduce very large low-frequency
electric artifacts (EOG) – up to ±500 µV
Source: http://www.biopac.com/lesson.cgi?action=view&item=STUDENT_LAB%3A10
+500 µV
-500 µV
16
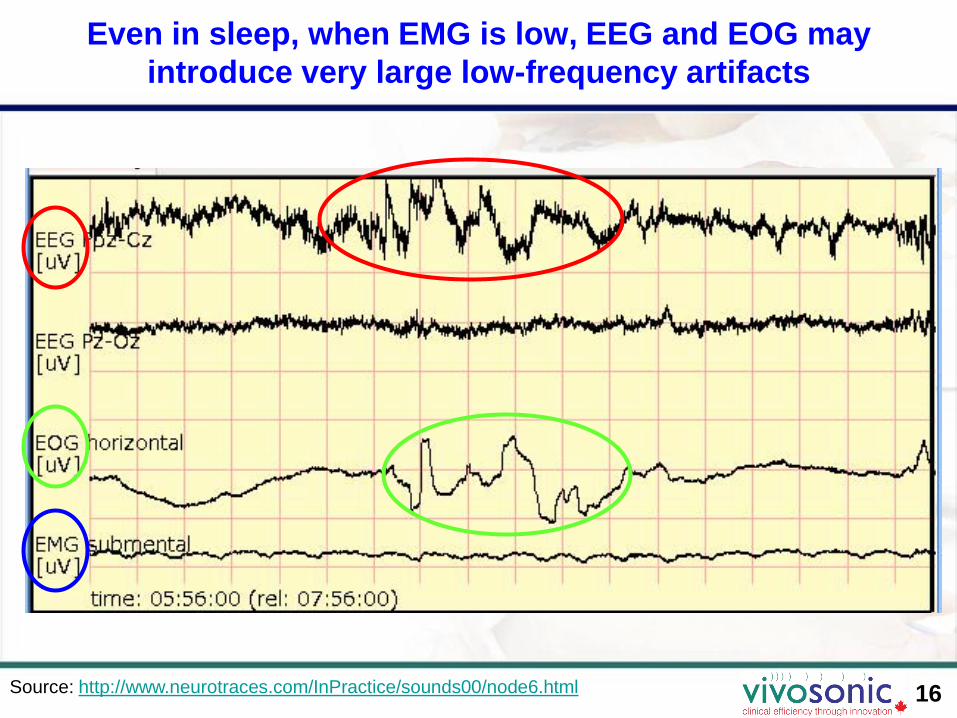
Even in sleep, when EMG is low, EEG and EOG may
introduce very large low-frequency artifacts
Source: http://www.neurotraces.com/InPractice/sounds00/node6.html
17
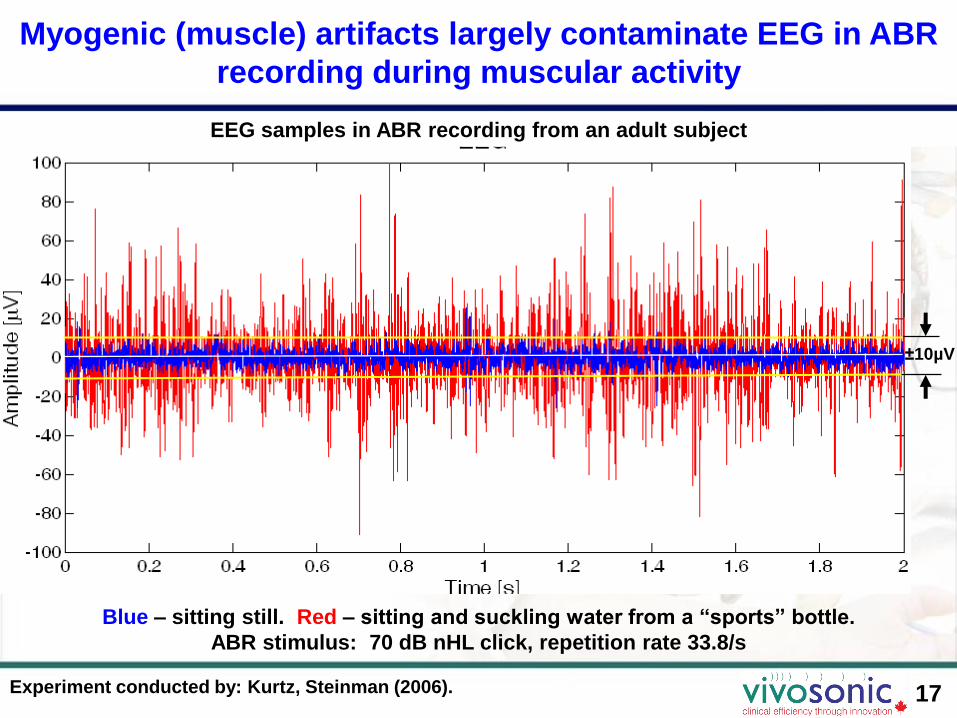
±10µV
Blue – sitting still. Red – sitting and suckling water from a “sports” bottle.
ABR stimulus: 70 dB nHL click, repetition rate 33.8/s
EEG samples in ABR recording from an adult subject
Myogenic (muscle) artifacts largely contaminate EEG in ABR
recording during muscular activity
Experiment conducted by: Kurtz, Steinman (2006).

18
Conventional ABR recordings often do not allow high
accuracy of peak latencies even in normal-hearing subjects
Source of image: Gorga et al. (2006)
Example of tone-burst and click-ABR from a normal-hearing subject
19
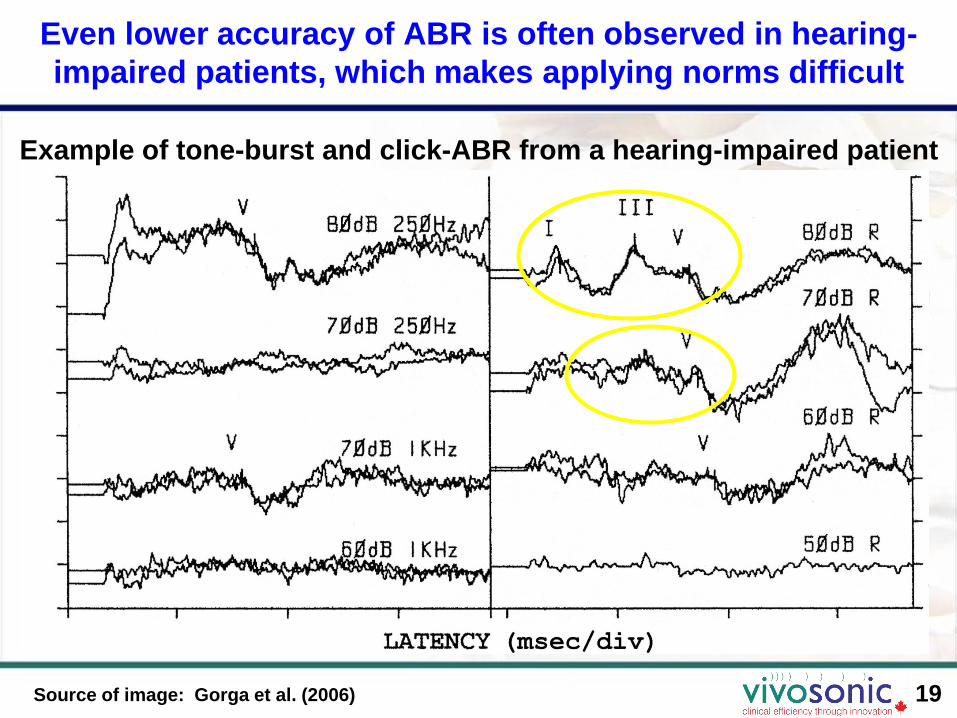
Even lower accuracy of ABR is often observed in hearing-
impaired patients, which makes applying norms difficult
Source of image: Gorga et al. (2006)
Example of tone-burst and click-ABR from a hearing-impaired patient
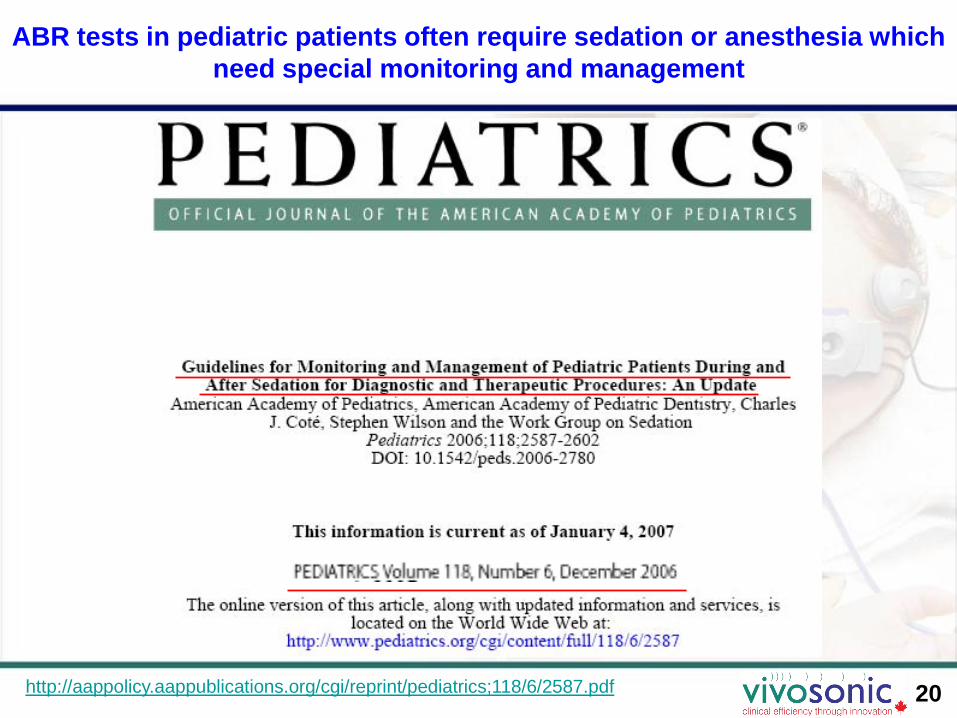
ABR tests in pediatric patients often require sedation or anesthesia which
need special monitoring and management
20http://aappolicy.aappublications.org/cgi/reprint/pediatrics;118/6/2587.pdf
21
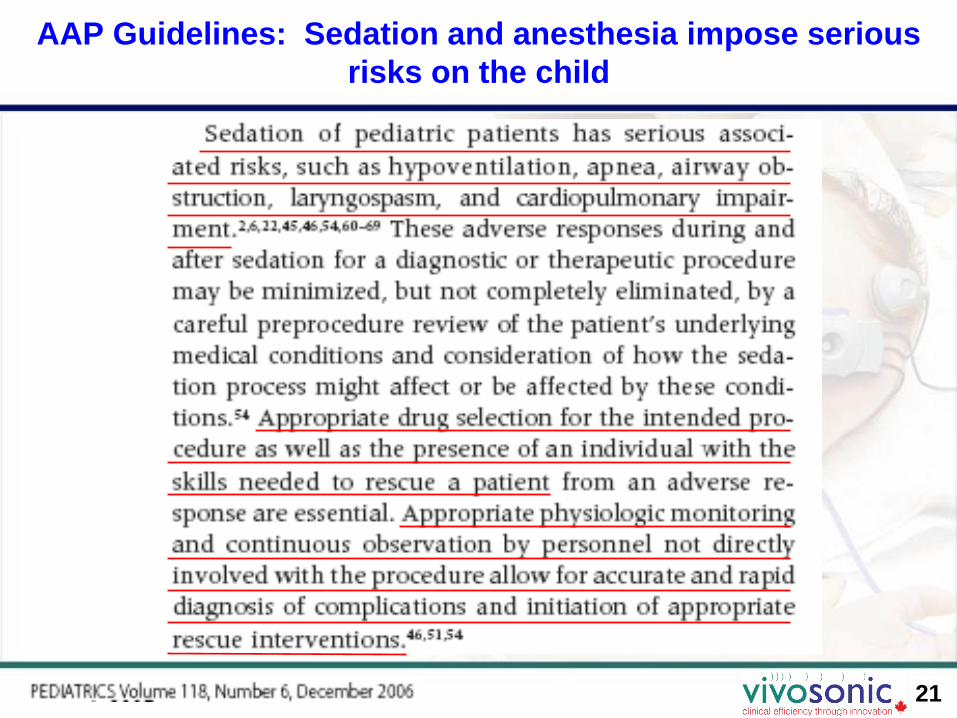
AAP Guidelines: Sedation and anesthesia impose serious
risks on the child

22
NEW ABR TECHNIQUES:
Recording in non-sedated
patient in any clinical
environment
23
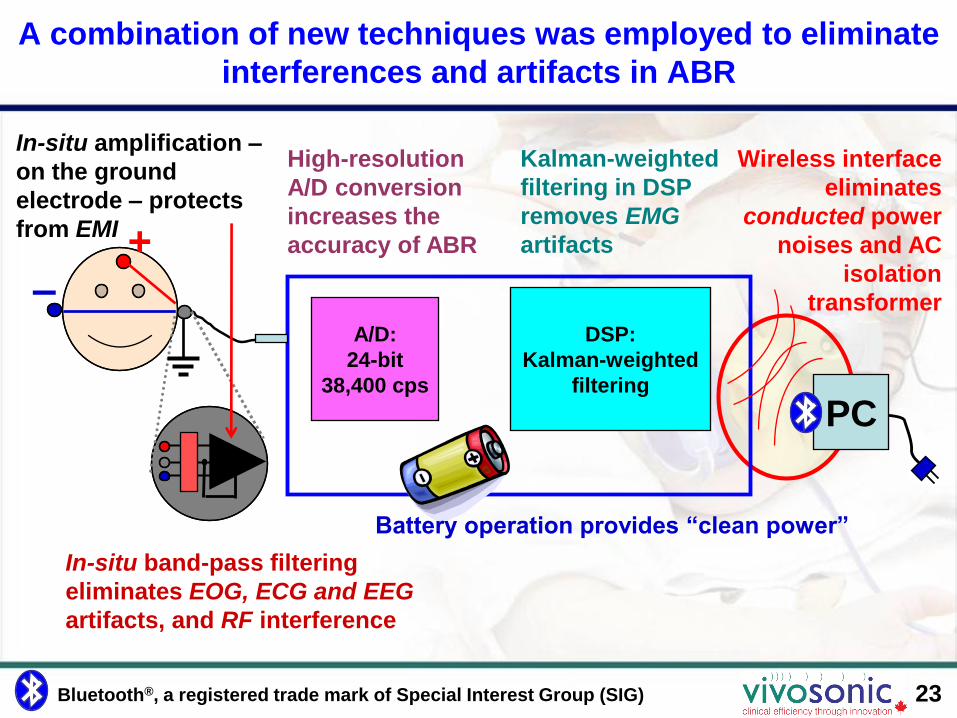
A combination of new techniques was employed to eliminate
interferences and artifacts in ABR
A/D:
24-bit
38,400 cps
DSP:
Kalman-weighted
filtering
PC
High-resolution
A/D conversion
increases the
accuracy of ABR+–
In-situ amplification –
on the ground
electrode – protects
from EMI
Wireless interface
eliminates
conducted power
noises and AC
isolation
transformer
In-situ band-pass filtering
eliminates EOG, ECG and EEG
artifacts, and RF interference
Kalman-weighted
filtering in DSP
removes EMG
artifacts
Battery operation provides “clean power”
Bluetooth®, a registered trade mark of Special Interest Group (SIG)

24
In-situ amplification mostly eliminates electric (EF) and
largely reduces magnetic (MF) field-induced noises
A/D DSP
EMI
EP
In-situ, electrode-mounted pre-amplifier, the Amplitrode™, eliminates the ground
lead, with the other leads very short and shielded.
This significantly reduces electric and magnetic field-induced interferences and
enables a clearer EP signal at the amplifier output.
25
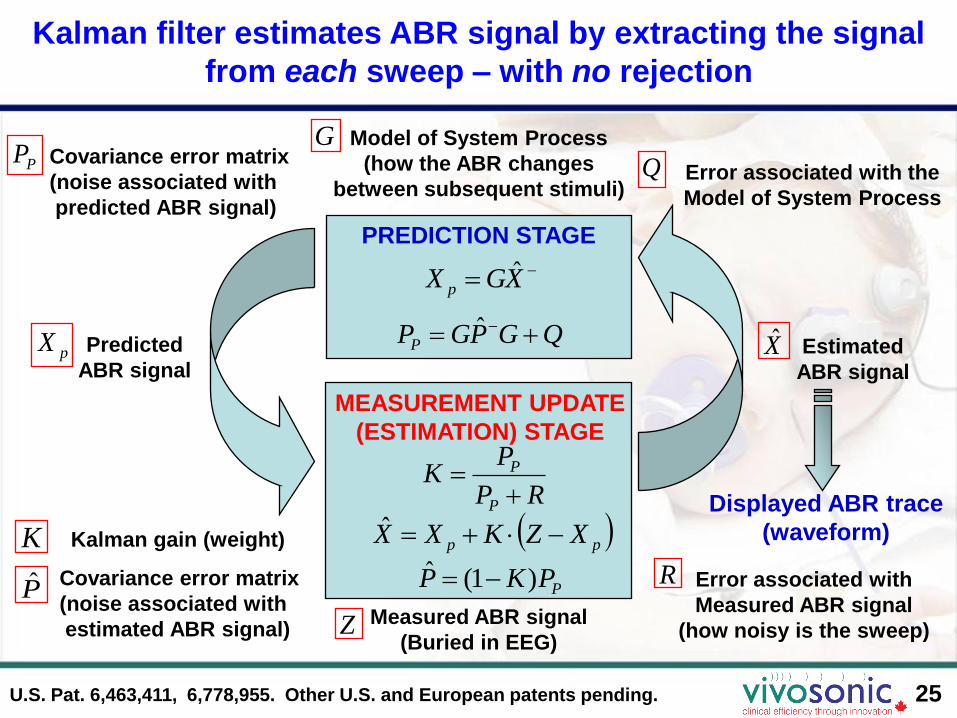
Model of System Process
(how the ABR changes
between subsequent stimuli)Error associated with the
Model of System Process
Predicted
ABR signal
Displayed ABR trace
(waveform)
Measured ABR signal
(Buried in EEG)
Error associated with
Measured ABR signal
(how noisy is the sweep)
PREDICTION STAGE
Estimated
ABR signal
MEASUREMENT UPDATE
(ESTIMATION) STAGE
pp XZKXX ˆ
XGX pˆ
RP
PK
P
P
PPKP )1(ˆ
QGPGPP ˆpX X̂
Kalman gain (weight)
P̂Covariance error matrix
(noise associated with
estimated ABR signal)
PP Covariance error matrix
(noise associated with
predicted ABR signal)
K
R
GQ
Z
Kalman filter estimates ABR signal by extracting the signal
from each sweep – with no rejection
U.S. Pat. 6,463,411, 6,778,955. Other U.S. and European patents pending.
26
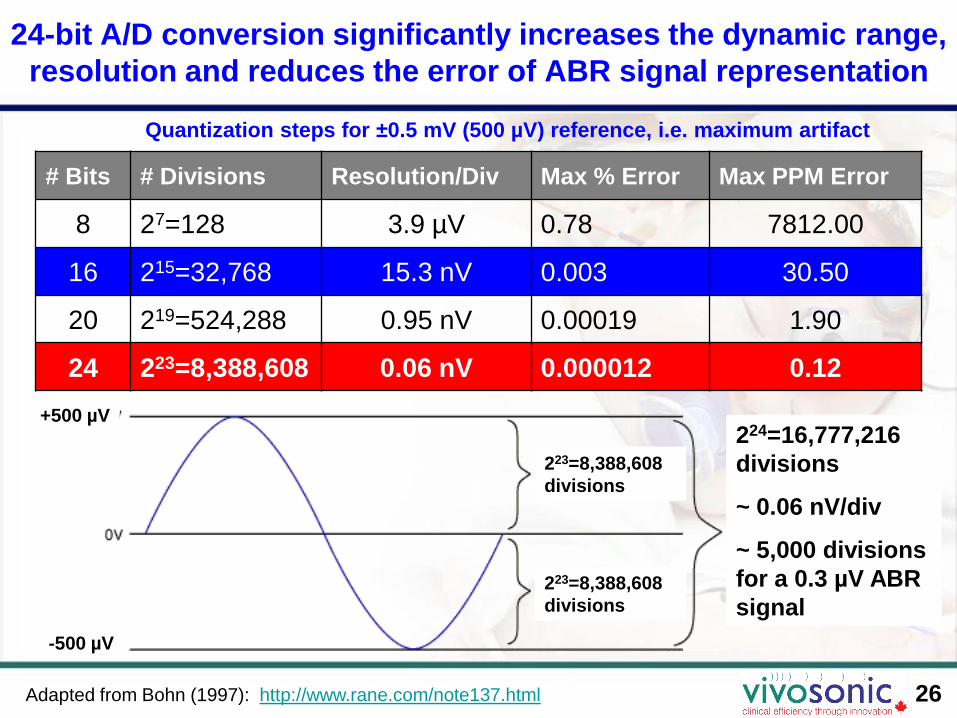
24-bit A/D conversion significantly increases the dynamic range,
resolution and reduces the error of ABR signal representation
# Bits # Divisions Resolution/Div Max % Error Max PPM Error
8 27=128 3.9 µV 0.78 7812.00
16 215=32,768 15.3 nV 0.003 30.50
20 219=524,288 0.95 nV 0.00019 1.90
24 223=8,388,608 0.06 nV 0.000012 0.12
Adapted from Bohn (1997): http://www.rane.com/note137.html
Quantization steps for ±0.5 mV (500 µV) reference, i.e. maximum artifact
223=8,388,608
divisions
223=8,388,608
divisions
224=16,777,216
divisions
~ 0.06 nV/div
~ 5,000 divisions
for a 0.3 µV ABR
signal
+500 µV
-500 µV
27
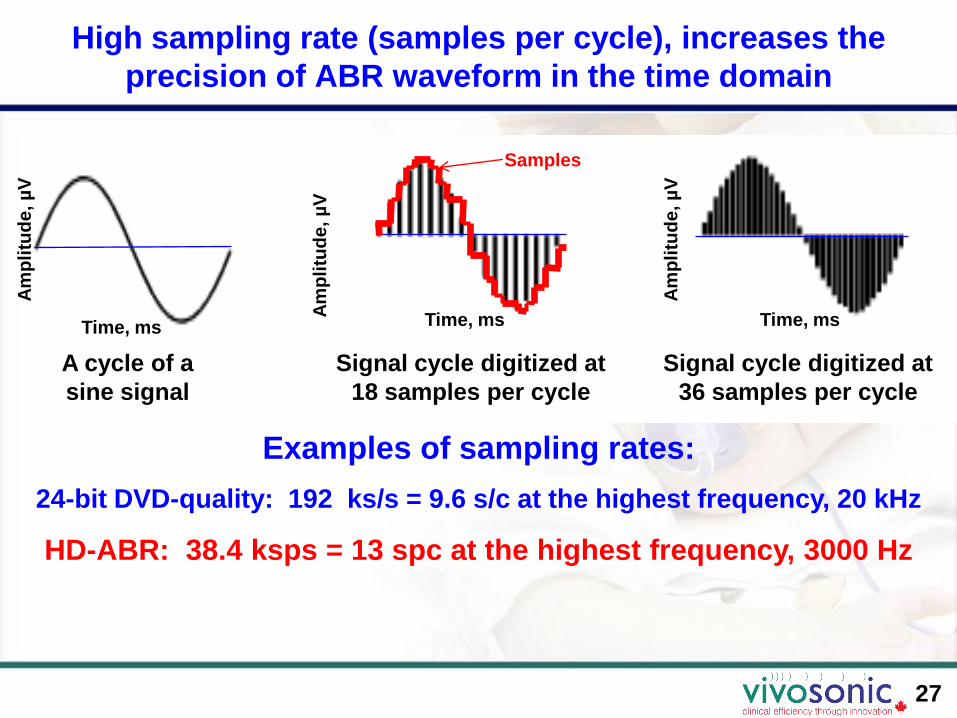
High sampling rate (samples per cycle), increases the
precision of ABR waveform in the time domain
Examples of sampling rates:
24-bit DVD-quality: 192 ks/s = 9.6 s/c at the highest frequency, 20 kHz
HD-ABR: 38.4 ksps = 13 spc at the highest frequency, 3000 Hz
A cycle of a
sine signal
Signal cycle digitized at
18 samples per cycle
Signal cycle digitized at
36 samples per cycle
Time, ms Time, ms Time, ms
Samples
Am
pli
tud
e, µ
V
Am
pli
tud
e, µ
V
Am
pli
tud
e, µ
V

High A/D resolution and sampling rate result in high ABR
resolution – High-Definition ABR™
28
Image illustrating
conventional ABR
resolution with 16-bit A/D
and low sampling rate
25 pixels
Image illustrating
Integrity™ ABR
resolution with 24-bit AD
and high sampling rate
10,000 pixels
High-definition ABR is illustrated by an example of visual image
resolution*)
*) Source: http://en.wikipedia.org/wiki/Image_resolution
1 4 25 100 pixels 400 2,500 10,000
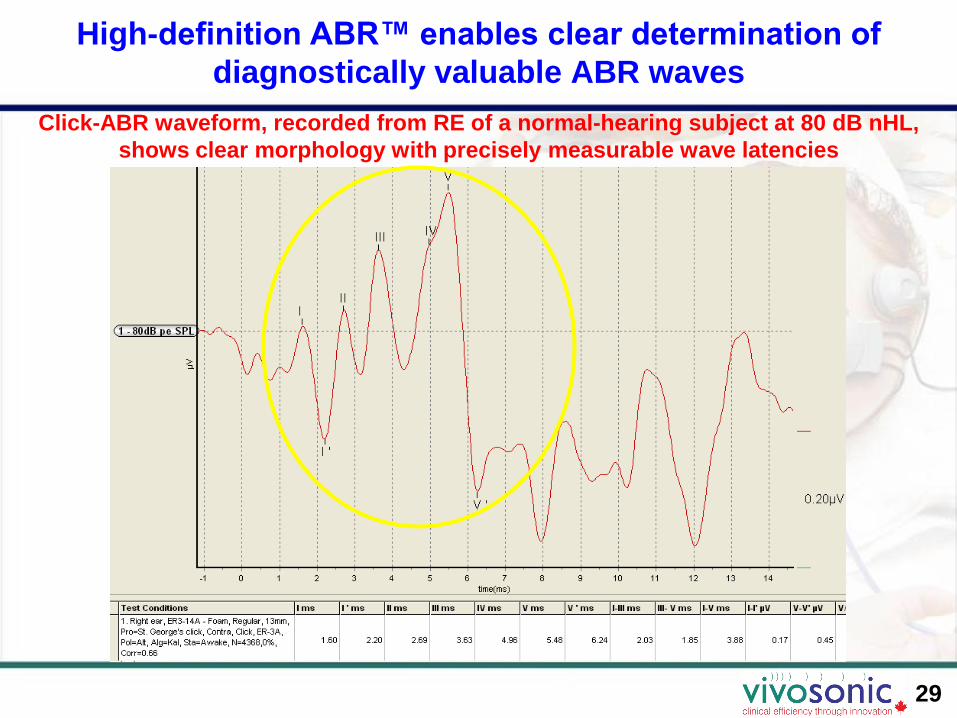
High-definition ABR™ enables clear determination of
diagnostically valuable ABR waves
29
Click-ABR waveform, recorded from RE of a normal-hearing subject at 80 dB nHL,
shows clear morphology with precisely measurable wave latencies
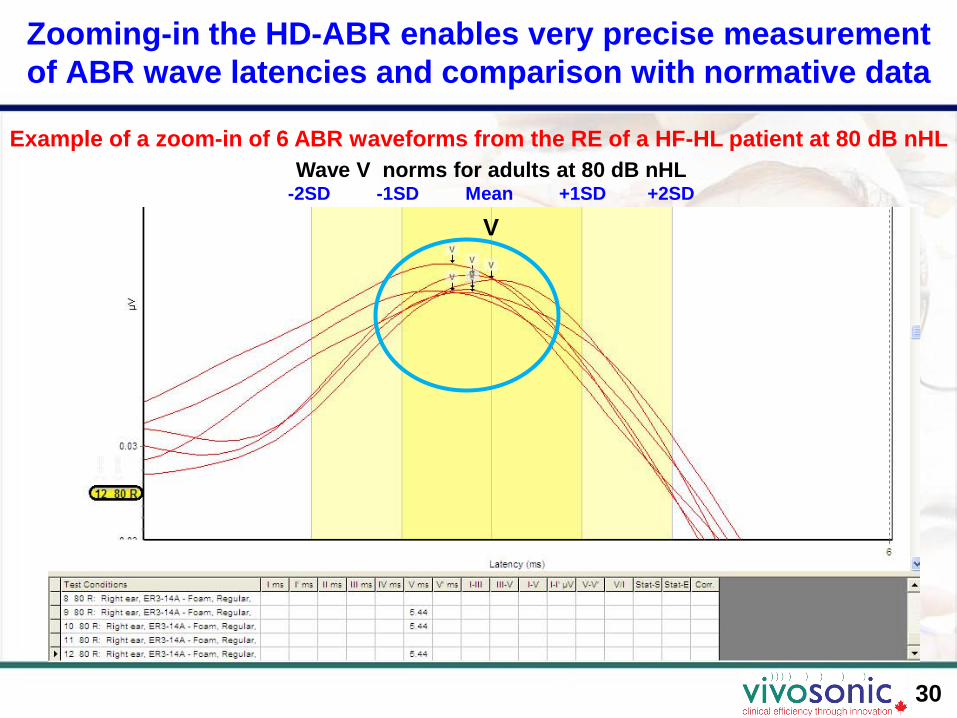
Zooming-in the HD-ABR enables very precise measurement
of ABR wave latencies and comparison with normative data
30
Example of a zoom-in of 6 ABR waveforms from the RE of a HF-HL patient at 80 dB nHL
Wave V norms for adults at 80 dB nHL-2SD -1SD Mean +1SD +2SD
V
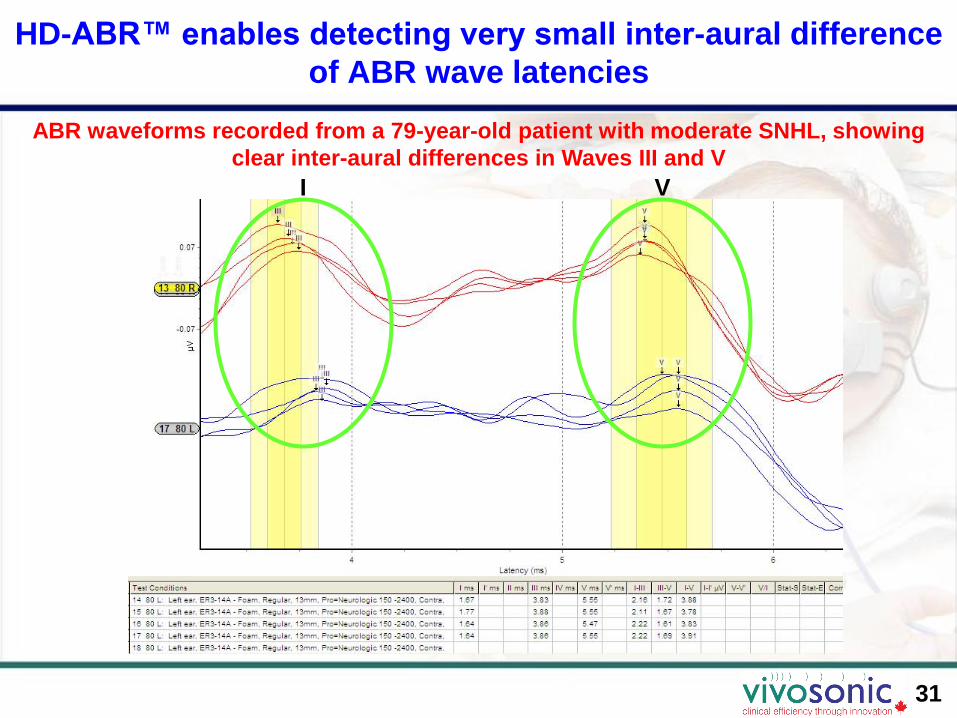
HD-ABR™ enables detecting very small inter-aural difference
of ABR wave latencies
31
ABR waveforms recorded from a 79-year-old patient with moderate SNHL, showing
clear inter-aural differences in Waves III and V
I V

HD-ABR™ enables precise measurement of V/I amplitude
ratio, which may indicate auditory maturation or abnormality
32
ABRs from RE of a 3.5-year-old, non-
sedated male patient with Cerebral Palsy
70, 80, 85 dB nHL
(shown are norms for 80 dB nHL)
ABRs from LE of a 5-week-old, 8-week-
premature, non-sedated, female NICU infant
80 and 90 dB nHL
(shown are norms for 80 dB nHL)
In both cases, V/I ratio is measured precisely, and is significantly < 1.0
V/I > 1.0 is characteristic for normal ABR.
II
V
V

33
Tone-burst HD-ABR allows precise frequency-specific
threshold estimation, to 5-10 dB above subjective threshold
The user runs a test until A-B “flattens out” to below 0.03-0.05 µV.
“Running” CC value is continuously updated, and CC > 0.75 indicates the response
SE label
“Running”
CC
A-B traces at all
stimulus levels
match the 0 dB
nHL (no
stimulus) trace,
i.e. EEG noise
Example of 500 Hz tone-burst ABR from LE of a normal-hearing 34-year-old adult,
clearly identifiable to 10 dB nHL
34
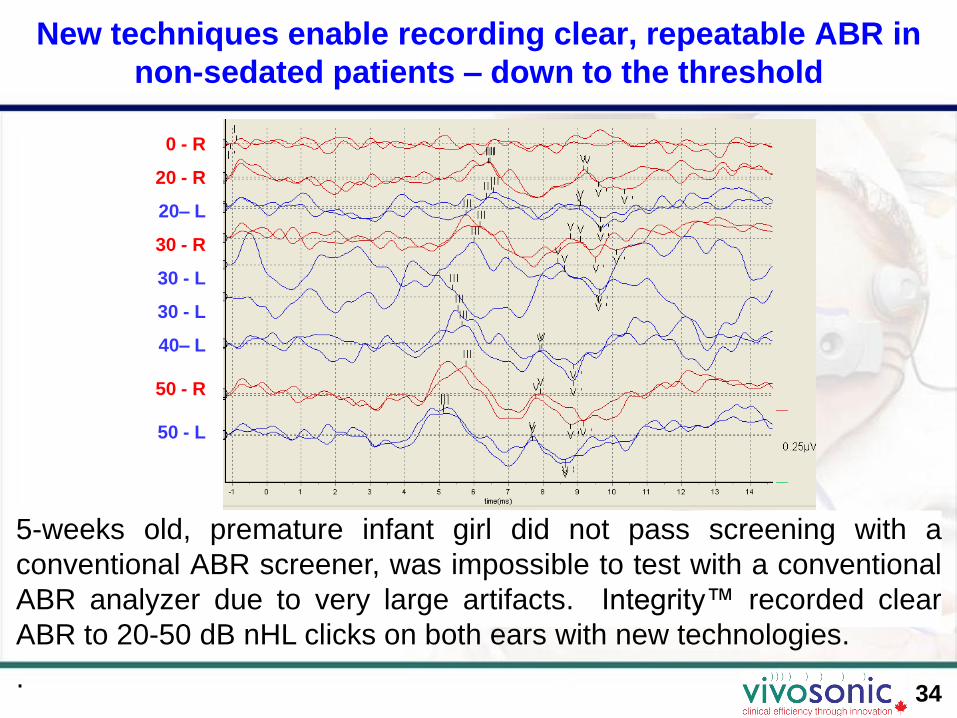
New techniques enable recording clear, repeatable ABR in
non-sedated patients – down to the threshold
5-weeks old, premature infant girl did not pass screening with a
conventional ABR screener, was impossible to test with a conventional
ABR analyzer due to very large artifacts. Integrity™ recorded clear
ABR to 20-50 dB nHL clicks on both ears with new technologies.
.
0 - R
20 - R
20– L
30 - R
30 - L
30 - L
40– L
50 - R
50 - L

35
New techniques enable recording clear ABR in
electromagnetically harsh conditions
Non-sedated, premature 10-week-old infant girl, in a large hospital
NICU, suckling on her pacifier. Conventional ABR results unattainable.
Integrity™ allowed recording clear ABR to 35-90 dB nHL clicks.

36
New statistical techniques help identifying physiological
responses in the waveforms
A (even sweeps) & B (odd sweeps) buffers show response repeatability within each
test run – instead of repeating each test – and saves test time.
A-B (the difference between A and B) shows EEG noise floor – helps identify theresponse.
Correlation coefficient (CC) between user-defined Statistics Start (SS) and StatisticsEnd (SE) labels – helps detecting response.
A and B traces
overlaid
A and B traces
overlaid
A-B trace
(residual EEG
noise)
SS label
SE label
CC
37
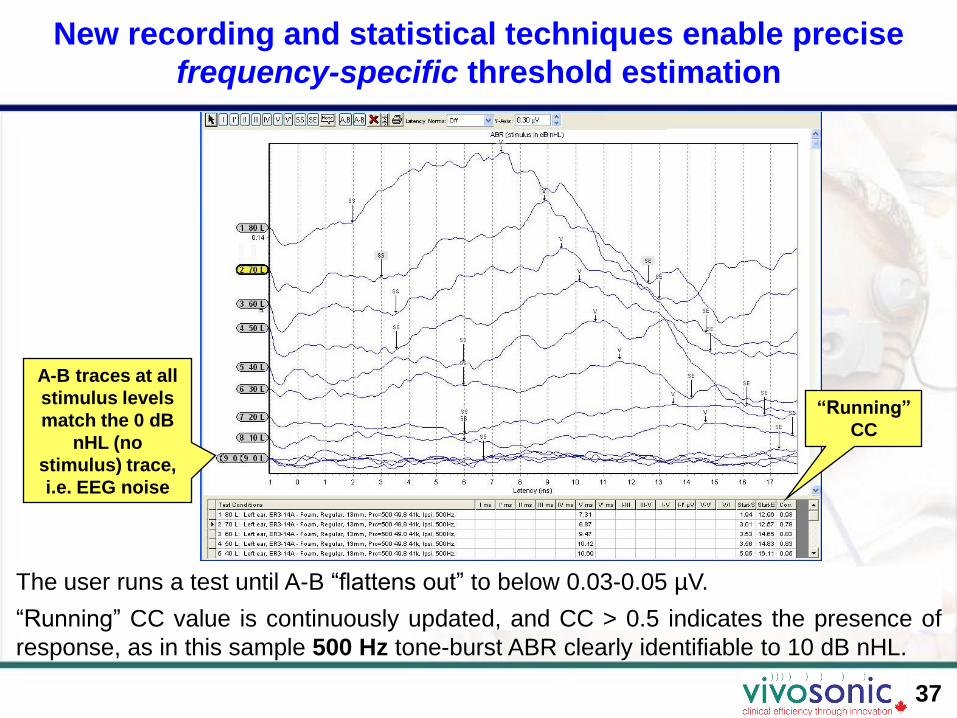
New recording and statistical techniques enable precise
frequency-specific threshold estimation
The user runs a test until A-B “flattens out” to below 0.03-0.05 µV.
“Running” CC value is continuously updated, and CC > 0.5 indicates the presence of
response, as in this sample 500 Hz tone-burst ABR clearly identifiable to 10 dB nHL.
SS label
SE label
“Running”
CC
A-B traces at all
stimulus levels
match the 0 dB
nHL (no
stimulus) trace,
i.e. EEG noise

38
New statistical techniques provide the clinician with good
stop criteria to obtain meaningful results
The clinician can stop the test based on the following
Integrity™ criteria:
• A and B traces are visually repeatable
• A-B trace, which represents the residual noise, is visually
flatter than the A+B (total average) trace
• Correlation Coefficient in the latency range of interest is larger
than 0.5 (50%), which indicates a non-random response, preferably
larger than 0.75 (75%)

39
Alternating-Split stimulus automatically administers Condensation (A)
and Rarefaction (B) polarity clicks for CM identification in neural HL
Right Ear of a 4-year-old boy with Auditory Neuropathy/Auditory Dys-synchrony. Left Ear
with Cochlear Implant (CI). Candidate for a second CI for the Right Ear. 90 dB nHL
click: A – Con, B – Rar, A+B – Neural, A-B – Non-neural (Cochlear Microphonic, CM)
A-B: Non-neural
(CM)
Alt Split (A+B):
Neural response
B (Rar): Neural
response & CM
A (Con): Neural
response (non-
inverted) & CM
(inverted)
Multiple publications by J. Hall III, L. Hood, D. Stapells, and others.
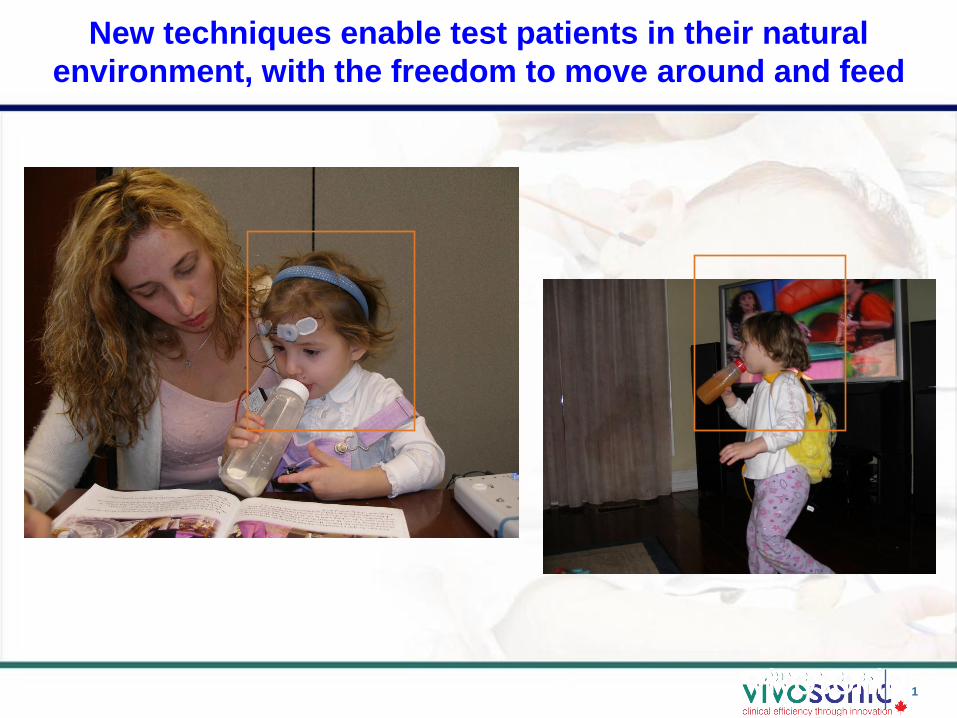
New techniques enable test patients in their natural
environment, with the freedom to move around and feed
1

41
Testing newborns and infants is very patient- and parent-
friendly in comforting hands of the parent or care-giver
When testing newborns and infants, VivoLink™ is placed in the crib or a car seat, or
held by the caregiver. The caregiver can comfort the child during the test, while the
child can be bottle-feeding or even breast-feeding.
42
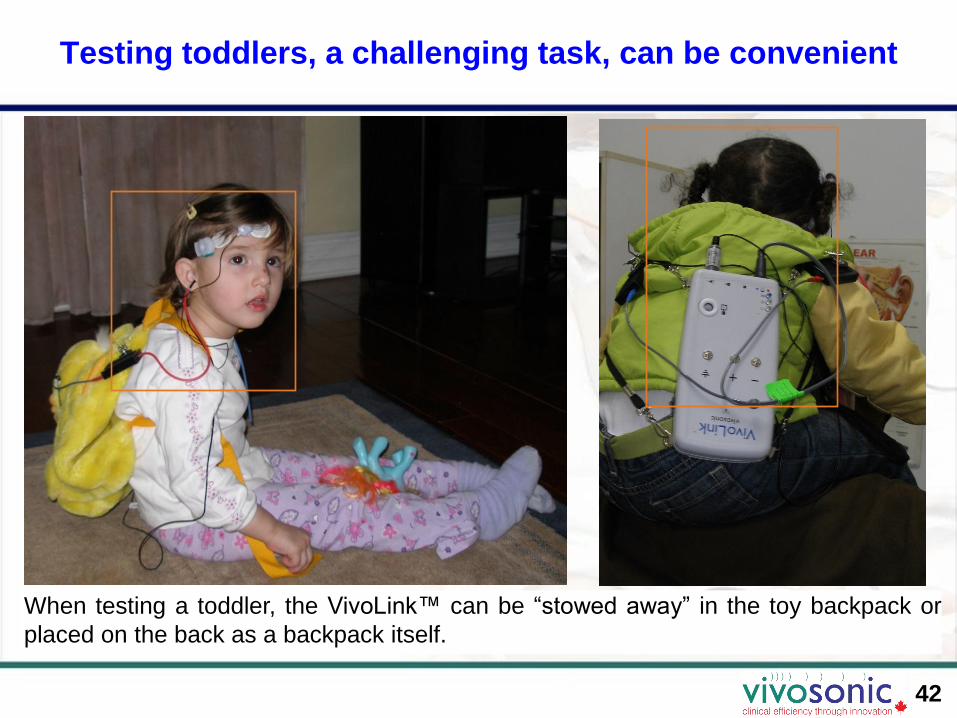
Testing toddlers, a challenging task, can be convenient
When testing a toddler, the VivoLink™ can be “stowed away” in the toy backpack or
placed on the back as a backpack itself.
43
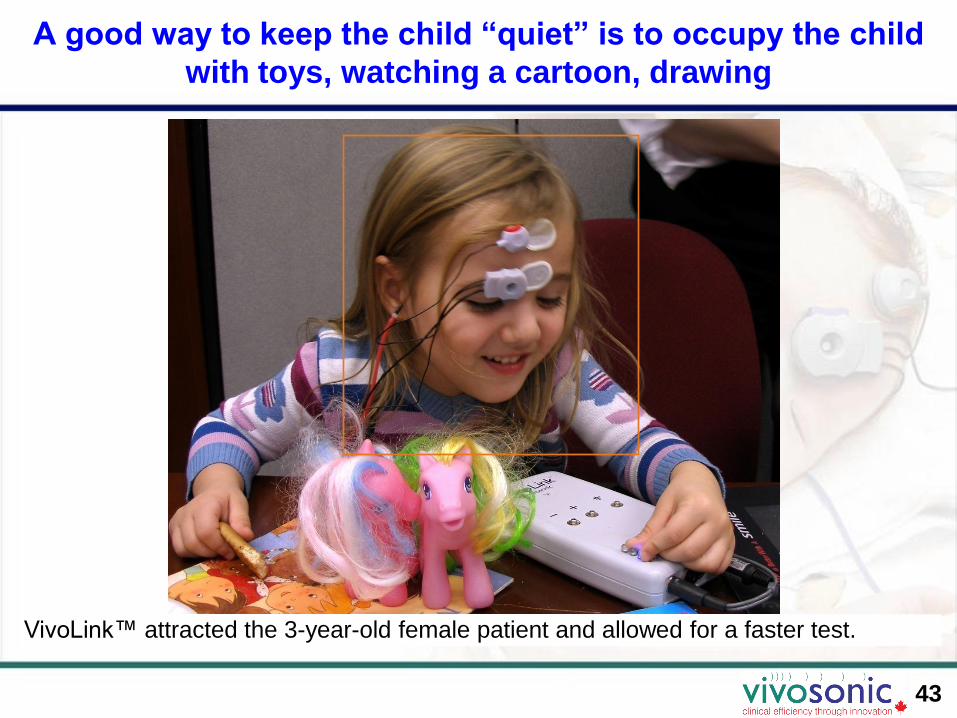
A good way to keep the child “quiet” is to occupy the child
with toys, watching a cartoon, drawing
VivoLink™ attracted the 3-year-old female patient and allowed for a faster test.

44
Sometimes finding a position where the child feels safe
works better than sedation
A 2-year-old girl was given 5 cc of Chloral Hydrate, then another 2 cc – with no
sedative effect. She found a safe escape on the father’s shoulders where she was
successfully ABR-tested (at a private Otolaryngology clinic in Cairo, Egypt).
45
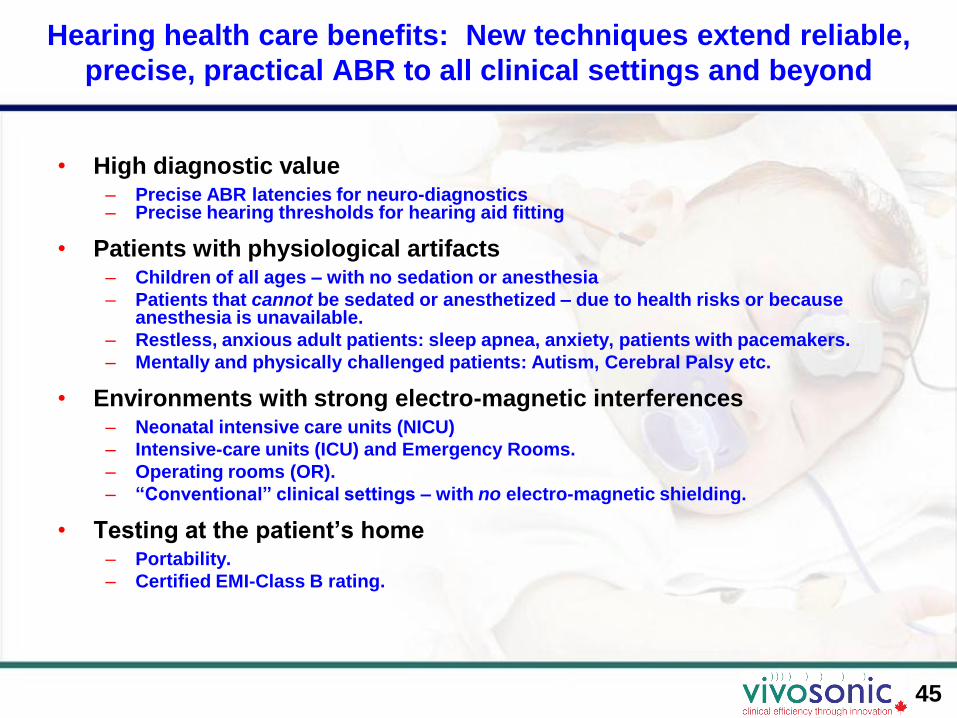
Hearing health care benefits: New techniques extend reliable,
precise, practical ABR to all clinical settings and beyond
• High diagnostic value– Precise ABR latencies for neuro-diagnostics– Precise hearing thresholds for hearing aid fitting
• Patients with physiological artifacts– Children of all ages – with no sedation or anesthesia
– Patients that cannot be sedated or anesthetized – due to health risks or because anesthesia is unavailable.
– Restless, anxious adult patients: sleep apnea, anxiety, patients with pacemakers.
– Mentally and physically challenged patients: Autism, Cerebral Palsy etc.
• Environments with strong electro-magnetic interferences– Neonatal intensive care units (NICU)
– Intensive-care units (ICU) and Emergency Rooms.
– Operating rooms (OR).
– “Conventional” clinical settings – with no electro-magnetic shielding.
• Testing at the patient’s home– Portability.
– Certified EMI-Class B rating.
46
Conclusions
• New techniques enable practical ABR evluation in non-sedated patients.
• New techniques enable practical ABR in electro-magnetically harsh environments – with no shielded rooms (“Faraday cages”).
• New techniques enable high-definition (high accuracy) ABR.
• New techniques help identifying Cochlear Microphonic.
• New techniques help in all typical pediatric settings:– Private clinics: No need to refer out, no “lost to follow up”, timely evaluation
and intervention – locally
– Hospitals: Higher quality patient care, less risk to the patients
– Universities: New research capabilities and student projects
• New techniques help effectively and efficiently implement the Year 2007 JCIH Position Statement on early hearing detection and intervention.

47
Thank youfor your interest
Best wishesfrom