non-invasive characterization of stationary phases in capillary flow systems using scanning...
TRANSCRIPT

Trends Trends in Analytical Chemistry, Vol. 29, No. 8, 2010
Non-invasive characterizationof stationary phases in capillaryflow systems using scanningcapacitively coupled contactlessconductivity detection (sC4D)Damian Connolly, Patrick Floris, Pavel N. Nesterenko, Brett Paull
Capacitively coupled contactless conductivity detection (C4D) has gained interest recently as an elegant new detection method
for capillary electrophoresis and, to a lesser extent, liquid chromatography. However, in recent years, the versatility of this non-
invasive detection system for research in materials and separation science has been demonstrated through non-traditional
applications, mostly using scanning mode (sC4D). This involves the precise measurement of local differences in the conductive
response of stationary phases housed within capillary columns. sC4D permits physical and chemical interrogation of stationary
phases in capillary columns and microfluidic chips, with potential use in liquid and gas chromatography, capillary-zone elect-
rophoresis or electrochromatography. sC4D also allows evaluation of chemically-modified surfaces to optimize procedures,
coverage and chemical or biochemical activity. This review critically summarizes these developments and highlights the potential
for widespread application of sC4D, beyond that of simple on-capillary detection.
ª 2010 Elsevier Ltd. All rights reserved.
Keywords: Capillary column; Capillary electrophoresis; Capillary-flow reactor; Liquid chromatography; Microfluidic chip; Monolithic material;
Non-invasive analysis; Scanning coupled contactless conductivity detection; Stationary phase; Surface modification
Damian Connolly,
Patrick Floris, Brett Paull*
Irish Separation Science
Cluster, National Centre for
Sensor Research, Dublin City
University, Glasnevin,
Dublin 9, Ireland
Pavel N. Nesterenko
Australian Centre for
Research on Separation
Science, University of
Tasmania, Hobart,
Tasmania 7001, Australia
*Corresponding author.
E-mail: [email protected]
870
1. Introduction
Over a relatively short period, capacitivelycoupled contactless conductivity detection(C4D) has gained sufficient attentionand application within separation scienceto be regarded an established detectiontechnique for capillary-based separationmethods, including microfluidic chip-based systems. As an alternative to stan-dard conductivity detection, the methodwas first demonstrated for capillary elec-trophoresis applications, followed morerecently by applications in ion chroma-tography (IC), reversed-phase liquid chro-matography (RP-LC) and microfluidics.This relatively rapid increase in applica-tions resulted primarily from the com-mercial availability of the detector, whichis available from several instrumentmanufacturers [e.g., Innovative Sensor
0165-9936/$ - see front matter ª 2010 Elsev
Technologies GmbH (Innsbruck, Austria)and eDAQ Pty. Ltd. (NSW, Australia)]. Adetailed discussion of standard C4D appli-cation and theory is beyond the scope ofthis review, but some excellent, informa-tive reviews on the subject have alreadybeen produced [1–5].
One significant aspect of C4D thatimparts an element of versatility to thistechnique is that detection is indeed‘‘contactless’’ (i.e. the conducting speciesin the fluidic system is not in direct contactwith the cell electrodes). Instead, thesignal is capacitively coupled through thewalls of insulating tubing, which is passedthrough the bore of two ring electrodesplaced a fixed distance apart within thecell. Typically, the cell is fixed in positionupon the capillary column for all separa-tions performed, usually close to the end ofthe capillary {e.g., in capillary zone
ier Ltd. All rights reserved. doi:10.1016/j.trac.2010.04.007

Trends in Analytical Chemistry, Vol. 29, No. 8, 2010 Trends
electrophoresis (CZE) or capillary electrochromatogra-phy (CEC), or directly off-column in capillary IC andRP-LC [6,7]}. However, as the detector position is notphysically fixed, and the construction of the detector cellallows free movement along the capillary (or indeedmicrofluidic channel), there have been several reportsthat examined the advantages of moving the detectorcell to any desired position along the capillary column,both in between and during chromatographic and elec-trophoretic runs, in both CZE [8] and capillary IC [9].
This positional flexibility, afforded by the detection cellin C4D, inevitably led to researchers investigating thepotential advantages, and the information to be gained,from monitoring the detector response whilst moving thedetector along the length of a capillary column, in‘‘scanning mode’’. In scanning C4D (sC4D), a capillary(generally housing a chromatographic coating or sup-port) is threaded through the detector cell, which is thenphysically scanned along the length of the capillary,either continuously or step-wise at mm increments(often while the capillary is filled with water or a low-conducting electrolyte), while the conductive response isrecorded. A subsequent plot of detector response versusdetector position along the capillary displays the exactaxial distribution of the sum of physical and chemicalelements influencing the measured conductivity signalalong the length of the capillary or chromatographicbed. This new technique therefore provides a great dealof data on the nature of the physical and chemicalenvironment within the capillary column in a com-pletely non-invasive manner, and this data can be col-lected at any time before, during or after the applicationfor which the capillary column was fabricated. In thisway, it is possible to gain a much more fundamentalunderstanding of the system to hand.
The scope of possible applications of the sC4D is basedupon the measured response being related to conduc-tivity changes emanating from the media housed withinthe narrow capillary or micro-channels (the maximumoutside diameter (OD) of which, to date, has been<1.5 mm) and to the processes causing these changes.In general terms, any changes in the number of chargedgroups, in both liquid and solid phase, occurring withinthe detection cell of a constant volume can be monitored.Importantly, the uniformity of the cross-sectional profileof the housing [i.e. capillary/channel wall OD andinternal diameter (ID)] governs the accuracy of thecorresponding measurements and the robustness ofthe scanning system, so, where such uniformity exists,the measured changes in the analytical response can becaused by only changes in the physical properties of thehoused media or chemical reactions.
This review critically highlights the applications thathave already been demonstrated using sC4D, focusing onnew possibilities and information that such an approachgenerates, particularly in the area of separation science,
but equally perhaps in the wider field of materialsscience.
2. Physical profiling
The first practical application of sC4D can be traced backto 2004, when two of the authors of this review(Nesterenko and Paull) accurately identified the locationof tiny cracks in a capillary silica monolith column(Chromolith Caprod 150 mm long, 0.1 mm ID and0.365 mm OD) by moving a C4D detection cell alongsuspicious spots of the capillary. The correct identifica-tion was visually confirmed later by optical microscopy.This first simple experiment immediately initiated dis-cussion on many new possible applications of C4D, and anumber of these have indeed since been demonstrated.
2.1. Evaluation of packing homogeneity in capillarycolumnsThe packing of stationary phase into capillary columns,and the generation of efficient and reproducible chro-matographic separations remains a significant chal-lenge. Many parameters can dramatically affect the finalaxial homogeneity of packing density along the columnlength (e.g., stability of slurry composition duringpacking, tubing characteristics, and packing rate).Unfortunately, subsequent chromatographic evaluationof the column (with a conventional fixed-positiondetector) can only ever be representative of the columnas a whole, so it fails to identify potential physical causesof band broadening and their specific location within thecolumn. An obvious example of this would be unde-tected isolated regions of relatively low packing densityor the presence of a particle-size gradient along thelength of the column.
However, recently Connolly et al. [10] demonstratedutilization of sC4D in an attempt to address this problem,showing non-invasive profiling of the axial homogeneityof packing density. The researchers applied sC4D, with aspatial resolution of 1 mm, to the entire length of100-lm ID fused capillary columns, packed with ion-exchange resin (with porous polymer monoliths asretaining frits), whilst constantly recording the conduc-tive response. Connolly et al. used photo-graftingmethods to position the retaining frits, so that voidregions could be deliberately incorporated into thecolumns to validate the prescribed approach. Subsequentevaluation of the measured sC4D profiles (Fig. 1)demonstrated clearly how column frits, minor packingvoids and the packed bed itself could be precisely mappedalong the column length.
The total signal in sC4D depends on many factors,each related to the fractional composition, density andproperties of the media comprising the entire detectionvolume. As expected, a key contributing factor in the
http://www.elsevier.com/locate/trac 871
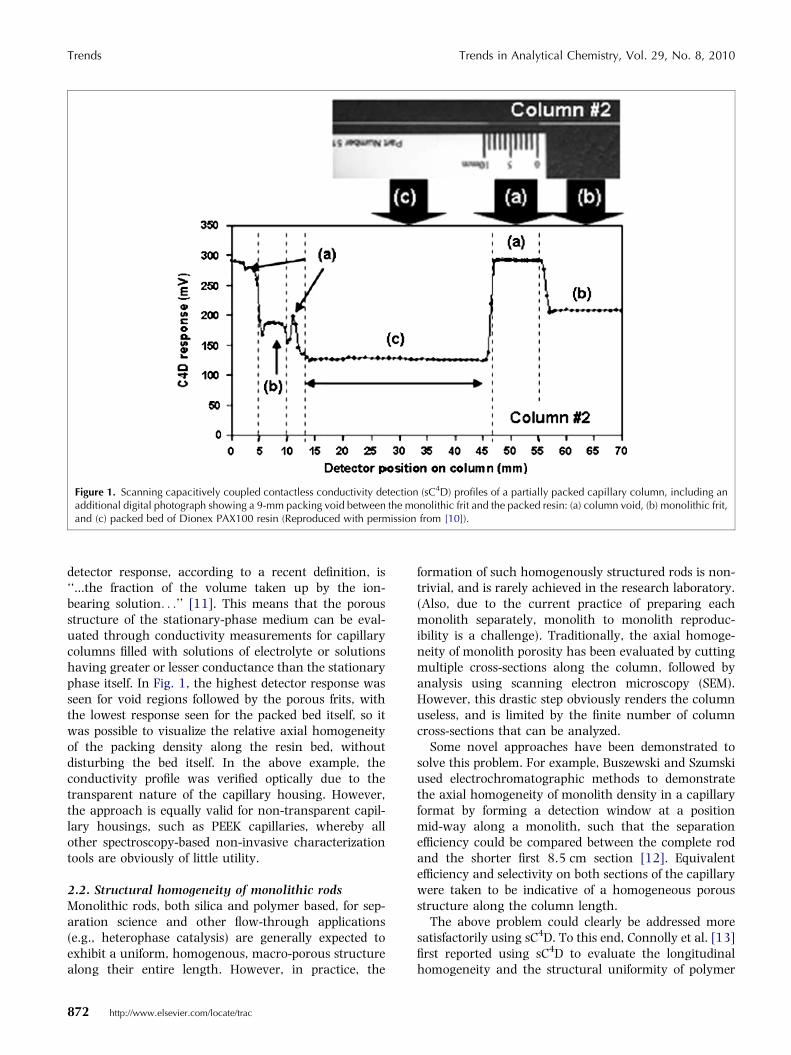
Figure 1. Scanning capacitively coupled contactless conductivity detection (sC4D) profiles of a partially packed capillary column, including anadditional digital photograph showing a 9-mm packing void between the monolithic frit and the packed resin: (a) column void, (b) monolithic frit,and (c) packed bed of Dionex PAX100 resin (Reproduced with permission from [10]).
Trends Trends in Analytical Chemistry, Vol. 29, No. 8, 2010
detector response, according to a recent definition, is‘‘...the fraction of the volume taken up by the ion-bearing solution. . .’’ [11]. This means that the porousstructure of the stationary-phase medium can be eval-uated through conductivity measurements for capillarycolumns filled with solutions of electrolyte or solutionshaving greater or lesser conductance than the stationaryphase itself. In Fig. 1, the highest detector response wasseen for void regions followed by the porous frits, withthe lowest response seen for the packed bed itself, so itwas possible to visualize the relative axial homogeneityof the packing density along the resin bed, withoutdisturbing the bed itself. In the above example, theconductivity profile was verified optically due to thetransparent nature of the capillary housing. However,the approach is equally valid for non-transparent capil-lary housings, such as PEEK capillaries, whereby allother spectroscopy-based non-invasive characterizationtools are obviously of little utility.
2.2. Structural homogeneity of monolithic rodsMonolithic rods, both silica and polymer based, for sep-aration science and other flow-through applications(e.g., heterophase catalysis) are generally expected toexhibit a uniform, homogenous, macro-porous structurealong their entire length. However, in practice, the
872 http://www.elsevier.com/locate/trac
formation of such homogenously structured rods is non-trivial, and is rarely achieved in the research laboratory.(Also, due to the current practice of preparing eachmonolith separately, monolith to monolith reproduc-ibility is a challenge). Traditionally, the axial homoge-neity of monolith porosity has been evaluated by cuttingmultiple cross-sections along the column, followed byanalysis using scanning electron microscopy (SEM).However, this drastic step obviously renders the columnuseless, and is limited by the finite number of columncross-sections that can be analyzed.
Some novel approaches have been demonstrated tosolve this problem. For example, Buszewski and Szumskiused electrochromatographic methods to demonstratethe axial homogeneity of monolith density in a capillaryformat by forming a detection window at a positionmid-way along a monolith, such that the separationefficiency could be compared between the complete rodand the shorter first 8.5 cm section [12]. Equivalentefficiency and selectivity on both sections of the capillarywere taken to be indicative of a homogeneous porousstructure along the column length.
The above problem could clearly be addressed moresatisfactorily using sC4D. To this end, Connolly et al. [13]first reported using sC4D to evaluate the longitudinalhomogeneity and the structural uniformity of polymer

Trends in Analytical Chemistry, Vol. 29, No. 8, 2010 Trends
monoliths. To demonstrate the principle, a capillarymonolith was prepared to include discrete regions inwhich the monolith was not fully formed. SubsequentsC4D measurements yielded a conductivity profile inwhich these void regions resulted in a significant in-crease in conductive response relative to the otherwisehomogeneous porous structure along the columnlength.
Obviously, in this case, the demonstration monolithrepresented a ‘‘worst case’’ scenario, in which a cata-strophic failure in monolith density was engineered.However, this non-invasive quality-control techniqueclearly demonstrated potential, in particular to visualizemore subtle differences in monolith porosity along thecolumn length. Realizing this potential, Mai et al. [11]recently reported using sC4D to compare the structuralhomogeneity of home-made and commercial C18 func-tionalized silica monoliths. Using a 20-mM acetic acidelectrolyte, they demonstrated that the amplitude of theC4D signal was proportional to the monolith porosityand that the home-made monolith was measurablymore porous (�85%) than the commercial monolith(�76%) along its entire length (see Fig. 2). In addition,the variation in signal amplitude along the columnlength was used to evaluate the relative axial homoge-neity of porosity, again with the commercial monolithexhibiting a much flatter and more consistent conduc-tivity profile.
In addition to the above structural information thatsC4D profiles provide, there is also significant potential forsC4D data to be correlated directly with the ultimate sepa-ration performance. In this regard, the results obtainedby Mai et al. are very interesting. The commercialcolumn exhibited significantly longer analyte retention,presumably since it had a higher density (as indicated bypreliminary sC4D evaluation) and thus a greater surfacearea, leading to a greater C18 carbon loading.
Also, Hilder et al. [14] recently presented data thatillustrates that sC4D evaluation of polymer monoliths
Figure 2. Comparison of the axial homogeneity of monolith density for: (n)mercial C18 functionalized silica monolith; and, (d) open-tubular capillary
can be directly correlated with subsequent separationperformance, in this instance applying the monolithcolumns characterized to IC separations. As expected,large deviations in conductive response along thecolumn length (due to inconsistencies in the macro-porous structure of the monolith) led to poor chroma-tography compared to monoliths that had exhibitedrelatively flat, homogeneous conductivity profiles.
2.3. Optimization of new approaches to monolithfabricationRecently, Abele et al. [15] reported using a singleultraviolet light-emitting diode (UV-LED) as an alterna-tive, inexpensive light source for photo-initiated fabri-cation of polymer monoliths.
Walsh et al. [16] have since improved upon thisstrategy by using an LED array that permitted longersections of monolith to be produced in a single irradia-tion cycle. The axial homogeneity of monolith porosity/density was then evaluated using sC4D methods. The useof photo-initiated polymerization potentially suffers fromany non-uniformity of the applied light intensity, which,for a small point source (or in this case an array of smallpoint sources), could drastically affect the resultingmonolithic structure. Fig. 3 shows some of the resultsfrom the work of Walsh et al., showing that the appli-cation of applied UV light had a significant effect uponmonolithic structure and column-to-column reproduc-ibility. In this case, the monolith porosity was not con-stant along its length, but, instead, undulated with aregular pattern due to the distance between adjacentLEDs in the array. Rotation of the capillary duringphotopolymerization ensured a more equal axial andlongitudinal distribution of incident UV energy, reflectedin an sC4D profile with less variation in signal amplitudealong the column length. Clearly, here the application ofsC4D led directly to an improved approach to fabrication,which otherwise may not have been developed soreadily.
an in-house produced C18-functionalised silica monolith; (m) a com-(Reproduced with permission from [11]).
http://www.elsevier.com/locate/trac 873
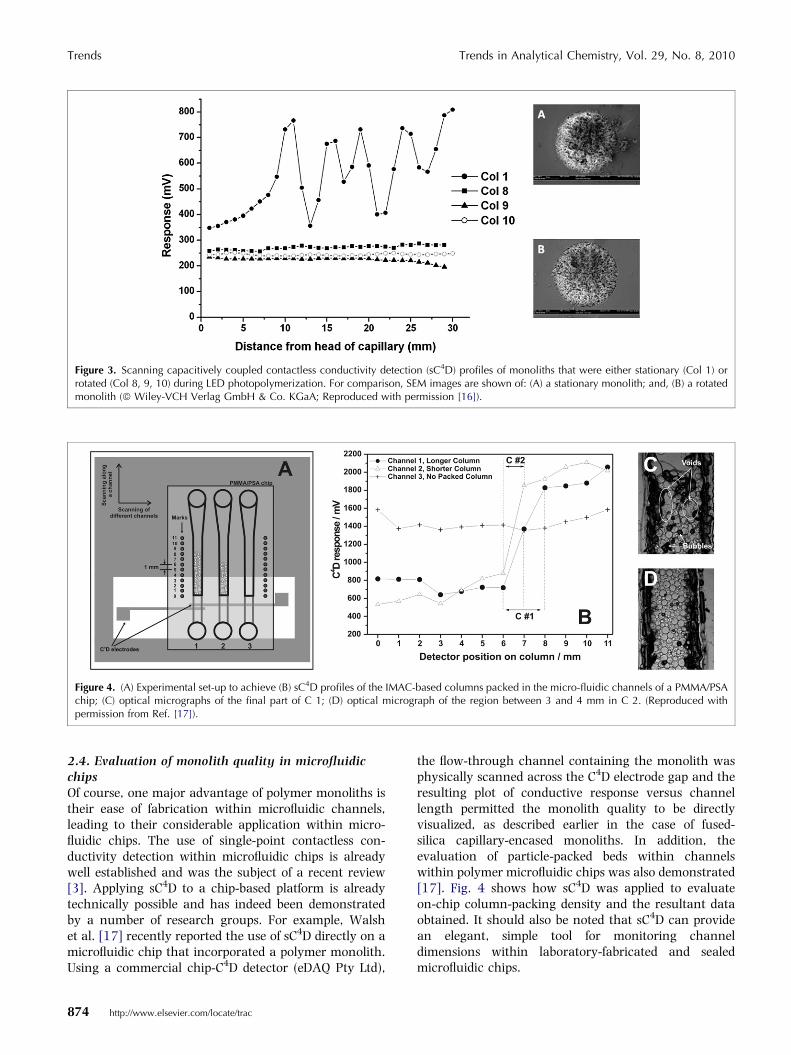
Figure 3. Scanning capacitively coupled contactless conductivity detection (sC4D) profiles of monoliths that were either stationary (Col 1) orrotated (Col 8, 9, 10) during LED photopolymerization. For comparison, SEM images are shown of: (A) a stationary monolith; and, (B) a rotatedmonolith (ª Wiley-VCH Verlag GmbH & Co. KGaA; Reproduced with permission [16]).
Figure 4. (A) Experimental set-up to achieve (B) sC4D profiles of the IMAC-based columns packed in the micro-fluidic channels of a PMMA/PSAchip; (C) optical micrographs of the final part of C 1; (D) optical micrograph of the region between 3 and 4 mm in C 2. (Reproduced withpermission from Ref. [17]).
Trends Trends in Analytical Chemistry, Vol. 29, No. 8, 2010
2.4. Evaluation of monolith quality in microfluidicchipsOf course, one major advantage of polymer monoliths istheir ease of fabrication within microfluidic channels,leading to their considerable application within micro-fluidic chips. The use of single-point contactless con-ductivity detection within microfluidic chips is alreadywell established and was the subject of a recent review[3]. Applying sC4D to a chip-based platform is alreadytechnically possible and has indeed been demonstratedby a number of research groups. For example, Walshet al. [17] recently reported the use of sC4D directly on amicrofluidic chip that incorporated a polymer monolith.Using a commercial chip-C4D detector (eDAQ Pty Ltd),
874 http://www.elsevier.com/locate/trac
the flow-through channel containing the monolith wasphysically scanned across the C4D electrode gap and theresulting plot of conductive response versus channellength permitted the monolith quality to be directlyvisualized, as described earlier in the case of fused-silica capillary-encased monoliths. In addition, theevaluation of particle-packed beds within channelswithin polymer microfluidic chips was also demonstrated[17]. Fig. 4 shows how sC4D was applied to evaluateon-chip column-packing density and the resultant dataobtained. It should also be noted that sC4D can providean elegant, simple tool for monitoring channeldimensions within laboratory-fabricated and sealedmicrofluidic chips.
Trends in Analytical Chemistry, Vol. 29, No. 8, 2010 Trends
3. Chemical characterization
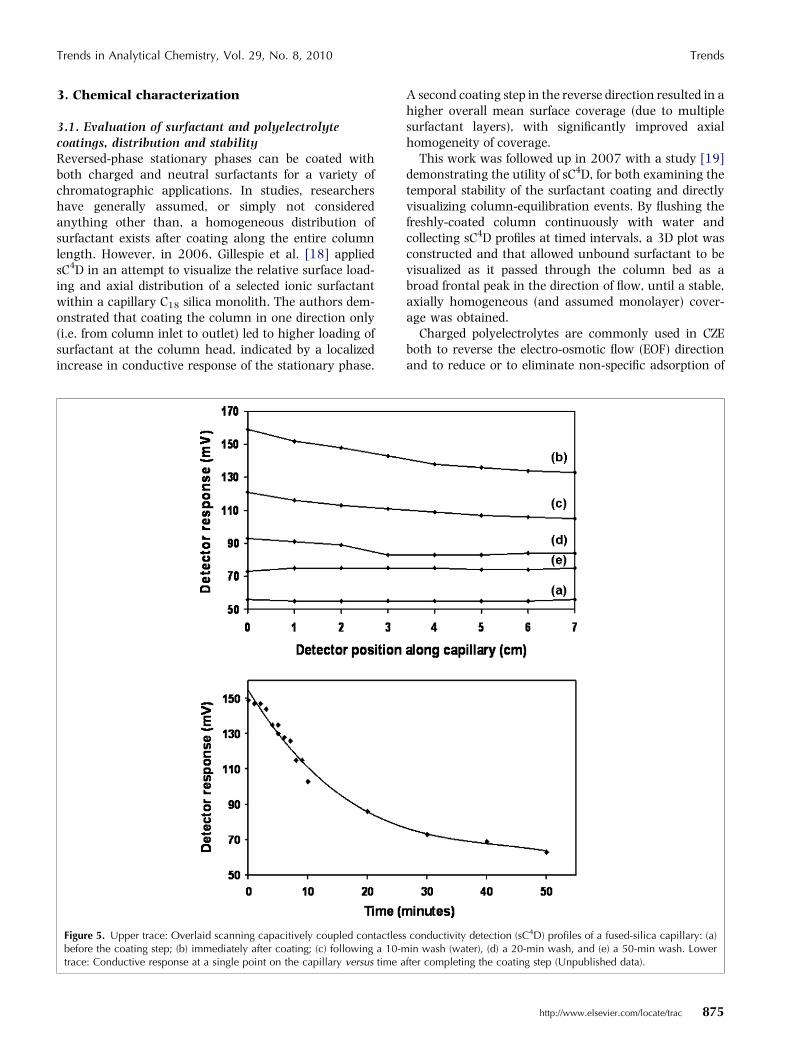
3.1. Evaluation of surfactant and polyelectrolytecoatings, distribution and stabilityReversed-phase stationary phases can be coated withboth charged and neutral surfactants for a variety ofchromatographic applications. In studies, researchershave generally assumed, or simply not consideredanything other than, a homogeneous distribution ofsurfactant exists after coating along the entire columnlength. However, in 2006, Gillespie et al. [18] appliedsC4D in an attempt to visualize the relative surface load-ing and axial distribution of a selected ionic surfactantwithin a capillary C18 silica monolith. The authors dem-onstrated that coating the column in one direction only(i.e. from column inlet to outlet) led to higher loading ofsurfactant at the column head, indicated by a localizedincrease in conductive response of the stationary phase.
Figure 5. Upper trace: Overlaid scanning capacitively coupled contactlessbefore the coating step; (b) immediately after coating; (c) following a 10-mtrace: Conductive response at a single point on the capillary versus time a
A second coating step in the reverse direction resulted in ahigher overall mean surface coverage (due to multiplesurfactant layers), with significantly improved axialhomogeneity of coverage.
This work was followed up in 2007 with a study [19]demonstrating the utility of sC4D, for both examining thetemporal stability of the surfactant coating and directlyvisualizing column-equilibration events. By flushing thefreshly-coated column continuously with water andcollecting sC4D profiles at timed intervals, a 3D plot wasconstructed and that allowed unbound surfactant to bevisualized as it passed through the column bed as abroad frontal peak in the direction of flow, until a stable,axially homogeneous (and assumed monolayer) cover-age was obtained.
Charged polyelectrolytes are commonly used in CZEboth to reverse the electro-osmotic flow (EOF) directionand to reduce or to eliminate non-specific adsorption of
conductivity detection (sC4D) profiles of a fused-silica capillary: (a)in wash (water), (d) a 20-min wash, and (e) a 50-min wash. Lower
fter completing the coating step (Unpublished data).
http://www.elsevier.com/locate/trac 875
Trends Trends in Analytical Chemistry, Vol. 29, No. 8, 2010
proteins to the capillary surface during bio-separations[20–22]. For example, a cationic polyelectrolyte such aspoly(diallyldimethylammonium) chloride (PDADMAC)can be adsorbed onto the capillary wall via electrostaticinteractions with negatively charged silanol groups. Ananionic polyelectrolyte such as poly(sodium 4-styrene-sulfonate) (PSS) can then be adsorbed onto the under-lying cationic layer, and thus multiple layers can be builtup by repeating the procedure prior to the separationstep.
When used in CZE, the successful establishment of apolyelectrolyte multilayer and its subsequent stability aretypically evaluated by measuring EOF magnitude andrepeatability [23,24]. However, sC4D can also find a rolein providing greater understanding of this technique.Using a capillary-coating procedure described by Nehmeet al. [23], a 50 lm i.d. fused silica capillary was flushedalternately with buffered solutions of 0.2% w/v PDAD-MAC and 0.2% w/v PSS, with 1.5 M NaCl present ineach coating solution. Five layers were deposited, fol-lowed immediately by sC4D evaluation while flushingthe capillary with water. Fig. 5 shows the resultant sC4Ddata for this experiment, with consecutive scans of themodified capillary following periods of washing withwater. As shown, the average conductive response at thecapillary wall increased significantly relative to theunmodified capillary, followed by a decrease in responseover time. The lower trace in Fig. 5 shows that the rateof decrease of conductive response slows significantlyafter the first 10 min. It was established that the thick-ness of the polyelectrolyte multilayer was significantlyenhanced by the presence of salt during the coating step[23,25] due to the coiled configuration of the polyelec-trolyte chains. Schlenoff et al. demonstrated that thethickness of 5 layers of PDADMAC/PSS on a siliconwafer increases from �0.8 nm to �10 nm when 1 MNaCl is present during coating [25], which, in relation tothe work here, suggests that sC4D measurements canprovide detailed information on wall coatings of thick-ness well below 10 nm. Indeed, this observation wasrecently supported by Dasgupta et al., who investigated asimilar application of a home-built, low-cost, capaci-tance-measurement device in scanning mode to studythe distribution of ionic liquid coatings within capillarygas chromatography columns [26]. Dasgupta et al. dis-cussed the capacity of the technique for detecting polarcoatings of thickness of just a few nm, and demonstratedsome exciting potential applications of this approach inthe development of gas sensors [27].
3.2. Evaluation of functionalized surfaces3.2.1. Photo-grafted monoliths. Photo-initiated graftingof functional monomers (hydrophobic, hydrophilic, ion-exchange, chelating) onto preformed polymer monolithsallows the macroporous structure and the surfacechemistry of the monolith to be controlled independently
876 http://www.elsevier.com/locate/trac
in two separate steps, as described in detail elsewhere[28–30]. Where photomasks are used during the photo-grafting step, the monomer selected can be immobilizedat any desired location along the monolithic substratewith mm spatial accuracy. These techniques permitfabrication of polymer monoliths with two or moreseparate spatially-resolved chemistries, which was ele-gantly demonstrated by Logan et al., who photo-patterned three separate enzymes side by side forspatially-separated multi-enzymatic reactions on a singlemonolith [31].
It is usually desirable for the boundary between graf-ted and ungrafted regions of the monolith to be sharpand at right angles to the column axis. Methods used toconfirm the spatial accuracy of grafting typically involvefluorescence microscopy when a fluorescently-labeledprotein [28] or a fluorescent dye [29] is immobilized,although obviously this method is not applicable to thevast array of small molecules or biomolecules that do notfluoresce naturally. Connolly et al. [13] addressed thisissue, demonstrating the use of sC4D to evaluate photo-grafting methods, in terms of spatial accuracy. Bygrafting two separate 10-mm zones of 2-acrylamido-2-methyl-1-propanesulfonic acid (AMPS) onto an other-wise non-conducting monolith, the relative sharpness ofthe boundary between modified and unmodified regionsof the monolith could be readily visualized. The resultingsC4D profile showed that the conductive response firstincreased sharply and then decreased equally rapidly asthe moving cell was passed across the leading and tailingedges of the grafted zones. The work demonstratedclearly how any modifications to a stationary phase or asurface, which result in a localized difference in con-ductive response (i.e. for any functionality carryingstrong or weak acidic or basic groups) can be readilydefined. In this work, the detector was scanned at 1-mmintervals, but the spatial resolution of this scanningtechnique can be significantly enhanced by attachingthe conductivity cell onto a motorized arm so that scanspeeds can be independently controlled, as describedrecently by Hilder et al. [14].
In the above study [13], both zones of the monolithtargeted for photo-grafting were converted to ionexchangers by virtue of the sulfonic-acid group of graftedAMPS. In this case, the dose of UV energy was the samefor each zone, so variation of the total dose of energy ineach respective zone would be an effective means ofcontrolling ion-exchange capacity, and sC4D methodsshould readily permit direct semi-quantitative evaluationof the resulting capacity. This was indeed demonstratedin a follow-up study by Gillespie et al. [32]. By graftingthree separate zones of a monolith with AMPS usingincrementally higher doses of UV energy, the relativeconductive response in each zone could be directly cor-related to the surface density of grafted sulfonate groupsand thus to ion-exchange capacity. As illustrated in

Figure 6. Scanning capacitively coupled contactless conductivity detection (sC4D) profile of a monolith grafted with three separate zones ofAMPS with (1) 1 J/cm2, (2) 3 J/cm2, and (3) 5 J/cm2 of UV energy during the grafting step. A scan of an unmodified monolith is overlaid for com-parative purposes (Reproduced with permission from [32]).
Figure 7. (i) Scanning capacitively coupled contactless conductivity detection (sC4D) profiles of a monolith grafted with: (a) 6% SPM, (b) 4%SPM, and (c) 2% SPM overlaid, with (d) a blank ungrafted monolith. (ii) Corresponding chromatographic evaluation of each monolith (a–c)for the ion-exchange separation of: (1) potassium, (2) magnesium, (3) calcium, and (4) barium. Column dimensions: 100 lm · 120 mm, Eluent:0.5 mM copper sulfate, Flow rate: 1 lL/min, Injection volume: 50 nL, Detection: indirect UV at 210 nm (Unpublished data).
Trends in Analytical Chemistry, Vol. 29, No. 8, 2010 Trends
http://www.elsevier.com/locate/trac 877

Trends Trends in Analytical Chemistry, Vol. 29, No. 8, 2010
Fig. 6, the average height of each grafted zone increasedfrom one zone to the next and began to level off after5 J/cm2 of grafting energy was applied (Zone 3). Thisapparent deviation from linearity was also observed anddiscussed in detail by Rohr et al. [29] and Eeltink et al.[33], who applied the alternative approach of using EOFmeasurements to measure the relative graft density onpolymer monoliths.
In the above study, the repeatability of the scanningprocedure itself was evaluated by acquiring three repeatscans of the monolith shown in Fig. 6 and plotting eachcollected data point as the average of the three replicates.The variation in detector response between each repli-cate scanning event was found to be 0.7% along theunmodified region of the monolith, and 1.4% and 2.4%at the top of Zone 2 and Zone 3, respectively.
Besides the non-invasive characterization of ion-exchange monoliths obtained by photo-grafting tech-niques, Gillespie et al. [32] also demonstrated thatsC4D can be used as an effective means of measuring the
Figure 8. Scanning capacitively coupled contactless conductivity detectiolongitudinally increasing the AMPS co-monomer concentration (upper tracWiley-VCH Verlag GmbH & Co. KGaA; Reproduced with permission [38]
878 http://www.elsevier.com/locate/trac
ion-exchange capacity of co-polymerized monoliths in asemi-quantitative manner. The researchers preparedthree copolymer monoliths comprising 0%, 0.5% and 2%AMPS, respectively, in capillary formats. As expected,sC4D profiles of each column revealed that the averageconductive response of the stationary phase increasedwith increasing concentration of AMPS in the startingpolymerization mixture. Measurement of the chromato-graphic breakthrough of calcium was used to cross-validate the results obtained by sC4D. The capacity ofthe 0.5% and 2.0% AMPS monoliths were calculatedat 0.93 nM sulfonate and 2.3 nM sulfonate respec-tively, representing a difference in capacity by a factorof 2.47. Direct comparison between the averagemeasured conductive response of each stationary phaserevealed that both columns differed by a factor of 2.45,demonstrating that both methods were in very closeagreement.
In a related series of experiments, the monolithic ion-exchange capacity of a series of cation-exchange
n (sC4D) profiles of monolithic stationary-phase gradients formed bye) or increasing the amount of photo-grafted AMPS (lower trace) (ª).

Figure 9. Comparison of a visible image with the scanning capacitively coupled contactless conductivity detection (sC4D) profile for a monolithwith three zones of immobilized GFP. The figure illustrates: (A) the fluorescent zones of GFP overlaid and aligned with (B) the zones of increasedC4D response (ª Wiley-VCH Verlag GmbH & Co. KGaA; Reproduced with permission [13]).
Trends in Analytical Chemistry, Vol. 29, No. 8, 2010 Trends
functionalized monoliths was determined using sC4Dand subsequently evaluated chromatographically for atest solution of a number of inorganic cations. ThreeBuMA-co-EDMA monoliths were grafted with 3-sulfo-propylmethacrylate (SPM) using different concentrationsof SPM during the grafting step (2%, 4% and 6% SPM).Immediately after the monoliths were modified byphoto-grafting and adequately washed, sC4D profileswere collected and overlaid, as shown in Fig. 7. Asexpected, the conductive response increased for eachstationary phase as the level of sulfonation increased,simultaneously demonstrating that, for each column,the modification procedure produced a very uniformcoverage of grafted sulfonate groups along their entirelength. The subsequent separation of selected metalswith a copper-sulfate eluent revealed the expected in-crease in retention factors as the level of sulfonation (andthus ion-exchange capacity) increased.
Clearly then, sC4D represents an additional tool fordetermining or comparing the ion-exchange capacity ofcapillary columns, in place of other options (e.g., EOFmeasurements [29] or adsorption/elution studies [34]),with the additional benefit of permitting the axial
homogeneity of surface charge along the column lengthto be readily visualized.
With the above capability in mind, it is interesting tonote how recently several reports in the literature haveemerged detailing the fabrication of monolithic station-ary phases that incorporate a gradient of bondedfunctional group concentration. These gradient phaseshave been reported to facilitate both significant reduc-tions in run-time and improvements in separation effi-ciency, due to on-column chromatographic zonefocusing when used with isocratic eluents.
For fabrication of such stationary phases, severalmethods have been investigated and vary in complexity,yielding reversed-phase gradients [35], immobilized pHgradients [36] and ion-exchange gradients [37]. In allcases, the authors relied upon chromatographic evalu-ation to estimate information about the shape and thereproducibility of the functionality gradient, but withoutthe means to visualize the exact gradient profile directlyon-column, which would be particularly useful whencomplex adjustments to gradient shape are attempted, asdescribed by Maruska et al. [35]. Pucci et al. [37] cameclosest to achieving this goal by (destructively) cutting
http://www.elsevier.com/locate/trac 879

Trends Trends in Analytical Chemistry, Vol. 29, No. 8, 2010
the column into cross-sections and semi-quantitativelydemonstrating an increasing sulfur concentration perunit length (for an AMPS ion-exchange gradient) usingelectron-probe microscopy.
Currivan et al. [38] recently reported using sC4D tostudy stationary-phase gradient production, prior tochromatographic application. Using a fabrication protocolbased upon that of Maruska et al. [35], they preparedmonolithic columns that incorporated a gradient of
Figure 10. (A) Scanning capacitively coupled contactless conductivity detbilized iminodiacetic acid; (B) on-column titration over a pH range of 3 tovalues of the immobilized iminodiacetic acid ligand. (ª Wiley-VCH Verla
880 http://www.elsevier.com/locate/trac
AMPS (for ion exchange) or immobilized iminodiaceticacid (for immobilized metal affinity chromatography).Subsequent sC4D profiles (e.g., Fig. 8) revealed the gra-dients in precise detail, allowing direct comparisons to bemade between columns of different slope, and allowingcolumn reproducibility to be evaluated. The method wasfurther applied to characterize photo-grafted gradients,formed by precise control of the UV-energy dosage perunit length during gradient formation.
ection (sC4D) profile of monolith modified with two zones of immo-10; and, (C) first derivative of on-column titration data showing pKa
g GmbH & Co. KGaA; Reproduced with permission [47]).

Trends in Analytical Chemistry, Vol. 29, No. 8, 2010 Trends
3.2.2. Immobilized proteins. Several reviews [39–41]have appeared in the literature describing the covalentattachment of bio-recognition molecules (e.g., enzymes,lectins or antibodies) to monolithic supports in capillaryformats. In some cases, one or more proteins are immo-bilized at specific locations along the length of a capillarymonolith using photo-grafting and photo-maskingmethods, resulting in a continuous polymer monolithwith multiple adjacent chemistries (e.g., multi-enzymereactions [31] and pre-concentration/enzymatic diges-tion [42]).
Several reports have appeared describing the use offluorescence microscopy for visualization of immobilizedgreen-fluorescent protein (GFP) [31] or fluorescentlylabeled proteins [28,42,43]. Unfortunately, the majorityof proteins do not fluoresce and labeling with a fluores-cent tag can adversely affect their activity. However, theuse of sC4D for direct on-column visualization of discretezones of GFP covalently immobilized upon a polymer
Figure 11. (A) Overlaid scanning capacitively coupled contactless condumonolith (i) before and (ii) after metal removal with EDTA; and, (B) overlaid(i) before and (ii) after metal removal with EDTA compared with (iii) a bla
monolith has already been demonstrated [13]. Of course,the approach is valid for all proteins, not simply fluo-rescent species. However, the use of GFP in this instanceallowed visual validation of the sC4D method, as shownin Fig. 9, where the sC4D data are compared with avisible image of the isolated fluorescent zones.
Preventing unwanted non-specific binding of proteinto all but a specific region of a monolith has beenreported by Stachowiak et al. [28]. Polymer chains ofpoly(ethylene glycol) methacrylate (PEGMA) were graf-ted onto a butyl methacrylate monolith in an attemptto convert the initially hydrophobic surface to one thatis essentially hydrophilic. Significant reductions inunwanted protein binding (by up to 98%) were observed,again using fluorescein-labeled BSA and fluorescencemicroscopy for detection. Connolly et al. [44] demon-strated the simpler approach of using sC4D to verify thesuccessful reduction of protein binding by comparingstationary phase conductivity for an unmodified and
ctivity detection (sC4D) profiles of a 1-methylimidazole/palladiumsC4D profiles of a 5-amino-1,10-phenanthroline/palladium monolithnk, unmodified monolith (Unpublished data).
http://www.elsevier.com/locate/trac 881

Trends Trends in Analytical Chemistry, Vol. 29, No. 8, 2010
PEGMA-modified monolith after passage of a proteinsolution through the monolith in both instances.
The visualization of protein-solute interactions usingsC4D was recently reported by O�Shea [45]. ImmobilizedSiaP protein in two distinct functionalized zones within amonolithic column was studied as a potential analyticaltool for preconcentration of sialic acid and its sensitivedetection. An increase in conductivity signified that thesystem was indeed capable of capture of free sialic acidvia the immobilized protein. The recorded response wasproportional to sialic-acid concentration over the limitedconcentration range studied, indicating that a poten-tially accurate method to measure concentrations of freesugar could be further developed.
3.3. Profiling on-column chemical equilibriaStrong anion-exchange or cation-exchange resins areknown to be fully ionized across the pH range typicallyused in IC, so the sC4D profile for a capillary columnpacked with such a resin should exhibit no axial differ-ence in conductivity (assuming the column is physicallywell packed, see Section 2.1). Alternatively, a weak ion-exchange resin (e.g., a carboxylated cation exchanger)exhibits a buffering capacity from the exchangeablehydronium ions. The conversion from protonated todeprotonated form, and vice versa, occurring within thecolumn itself, will of course impact the measuredconductivity. Connolly et al. [10] demonstrated thiscapability by collecting sC4D profiles at fixed time inter-vals, and constructing a 3D surface plot that allowed theslow equilibration of a weak acid phase in water to bevisualized over a 30-h period. This stationary phasebuffering manifested itself as a gradual decrease in resinconductivity moving from the head of the column to thetail during the timeframe of the experiment.
The above approach could be used to determine ion-exchange capacity, but there is also considerable interestin determining more specific properties of weak acidfunctionalized phases (e.g., the pKa of the weak acidfunctionality after its immobilization). Gillespie et al.demonstrated how sC4D could be used to obtain suchdata for an aminophenylboronic acid-functionalizedpolymer monolith [46] and aminocarboxylate-modifiedphases (iminodiacetic acid or N-(2-acetamido) iminodi-acetic acid) [47]. The method involved the measurementof the conductive response for spatially isolated zones ofthe above functionalities, upon a monolithic column,across a selected pH range.
By plotting conductive response versus increasing pH(after subtraction of the background-signal contributionfrom the buffer), an on-column titration curve could bevisualized. Fig. 10 shows this data for an iminodiaceticacid-functionalized phase. The pKa values for each ligandwere found to differ significantly (by up to 2.7 pH units)after immobilization on the monolithic support relativeto the pKa values in solution. This shift in pKa was
882 http://www.elsevier.com/locate/trac
attributed to changes in the electron density on theionizable functional group, due to localized hydrogenbonding and surface-induced effects. These studiesshowed that there is potential for on-column sC4Dtitrations to be extended further to measure any changesin the isoelectric point of larger biomolecules (e.g.,proteins) after immobilization on monolithic supports.The study also demonstrated direct visualization ofon-column complexation events for a selection oftransition-metal ions by measuring changes in theconductive response for the stationary-phase zones thatincorporated an immobilized chelating ligand.
3.4. Miscellaneous applications3.4.1. Micro-reactors. The use of flow-through micro-reactors for catalysis/organic synthesis has receivedincreasing attention due to the benefits of rapid heat andmass transfer, reduction of unwanted side reactions andreduced solvent consumption, and there are excellentreviews on the subject [48–50]. Recently, polymermonoliths in capillary formats were functionalizedwith 5-amino-1,10-phenanthroline or 1-methylimidaz-ole, and subsequently loaded with palladium (asPdCl2(NCMe)2) to facilitate both Pd-catalyzed Suzuki–Miyaura and Sonogashira reactions in a flow-throughsystem [51,52]. The efficiency and the long-term sta-bility of the monolith-based catalytic reactor is a func-tion of the capillary dimensions, the initial loading ofPdCl2(NCMe)2 on the monolith and the extent of metalleaching, which was reported by Gomann et al. as being�4% [52]. The use of sC4D methods for the non-invasivecharacterization of these same monolithic micro-reactors, in terms of metal loading and the homogeneityof metal-complex distribution along the length of thecapillary, shows considerable promise. Two monolithicmicro-reactors, the first being a monolith modifiedwith 1-methylimidazole and loaded with the palladiumcomplex (monolith A), and the second being a monolithmodified with 5-amino-1,10-phenanthroline and loadedwith the palladium complex (monolith B), were evalu-ated using sC4D following equilibration in water. Themetal-catalyst monoliths were subsequently flushed with10 mM EDTA (pH 8.0) for 3 h prior to the collection of asecond sC4D profile in water. Fig. 11 shows the resultantmicro-reactor profiles.
For both palladium-loaded monoliths, the coverage ofpalladium was not axially homogeneous. For monolithA, the surface density of the palladium catalyst increasedalmost linearly along the monolith length. This gradientprofile is clearly a function of catalyst distribution ratherthan other factors (e.g., poor axial homogeneity ofmonolith density), since a comparatively straight sC4Dprofile (with a lower signal amplitude, as expected) wasobtained after removal of the palladium catalyst with theEDTA wash. Similarly, the distribution of catalyst alongmonolith B was erratic, with higher coverage at both

Trends in Analytical Chemistry, Vol. 29, No. 8, 2010 Trends
extremes of the column. Again, the conductive responsedecreased after the EDTA wash to a value which isremarkably similar to that of an unmodified (blank)monolith of identical porosity (monolith C). Thepercentage of metal stripped from the surface was cal-culated as 89% relative to the blank column. Although arather preliminary study, this brief application showssignificant potential for optimization and evaluation ofcapillary monolithic micro-reactors in terms of:(a) characterization of axial distribution of immobilized
catalyst;(b) semi-quantitative determination of catalyst leach-
ing; and,(c) repeated regeneration of the same monolithic sup-
port with the same or alternative metal complexes.
4. Summary
C4D has gained acceptance as a simple, elegant, non-invasive detection method for both capillary andmicrofluidic chip-based chromatographic, electropho-retic and flow-analysis systems. However, as this reviewdemonstrates, the technique has significant potential asmuch more than a single point detector. From ourreview of the literature, it is clear that the technique hascertainly demonstrated particular utility in fabricationand characterization of capillary monoliths, but we hopethat the applications discussed within this review maytrigger researchers working in the area of capillary andchip-based chromatography and electrophoresis, andwithin the wider field of materials science, to considergreater use of this new technique. Both information richand simple, sC4D is certainly a very useful additionalanalytical tool to all such researchers.
AcknowledgementsThe authors would like to acknowledge ScienceFoundation Ireland (Grant Number 08/SRC/B1412) forresearch funding under the Strategic Research Clusterprogramme.
References[1] P. Kuban, P.C. Hauser, Electrophoresis 30 (2009) 176.
[2] V. Solınova, V. Kasicka, J. Sep. Sci. 29 (2006) 1743.
[3] M. Pumera, Talanta 74 (2007) 358.
[4] F.M. Matysik, Microchim. Acta 160 (2008) 1.
[5] P. Kuban, P.C. Hauser, Anal. Chim. Acta 607 (2008) 15.
[6] P. Kuban, E.M. Abad-Villar, P.C. Hauser, J. Chromatogr., A 1107
(2006) 159.
[7] P. Kuban, M.A. Muri, P.C. Hauser, Analyst (Cambridge, UK) 129
(2004) 82.
[8] M. Macka, J. Hutchinson, A. Zemann, Z. Shusheng, P.R. Haddad,
Electrophoresis 24 (2003) 2144.
[9] C. O�Riordain, E. Gillespie, D. Connolly, P.N. Nesterenko, B. Paull,
J. Chromatogr., A 1142 (2007) 185.
[10] D. Connolly, L.P. Barron, E. Gillespie, B. Paull, Chromatographia
70 (2009) 915.
[11] T.D. Mai, H.V. Pham, P.C. Hauser, Anal. Chim. Acta 653 (2009)
228.
[12] B. Buszewski, M. Szumski, Chromatographia 60 (2004) S261.
[13] D. Connolly, V. O�Shea, P. Clark, B. O�Connor, B. Paull, J. Sep. Sci.
30 (2007) 3060.
[14] E.F. Hilder, D. Schaller, C.J. Evenhuis, P.N. Nesterenko, P.R.
Haddad, Scanning contactless conductivity measurements for
quality assessment of monolithic columns, in: Proc. Int. Ion
Chromatogr. Symp., Dublin, Ireland, 2009, p. 51.
[15] S. Abele, F.Q. Nie, F. Foret, B. Paull, M. Macka, Analyst
(Cambridge, UK) 133 (2008) 864.
[16] Z. Walsh, P.A. Levkin, V. Jain, B. Paull, F. Svec, M. Macka, J. Sep.
Sci. 33 (2010) 61.
[17] Z. Walsh, M. Vasquez, F. Benito-Lopez, B. Paull, M. Macka, F.
Svec, D. Diamond, Lab. Chip (2010), accepted for publication,
doi:10.1039/c003584j.
[18] E. Gillespie, M. Macka, D. Connolly, B. Paull, Analyst (Cambridge,
UK) 131 (2006) 886.
[19] E. Gillespie, D. Connolly, M. Macka, P.N. Nesterenko, B. Paull,
Analyst (Cambridge, UK) 132 (2007) 1238.
[20] H. Katayama, Y. Ishihama, N. Asakawa, Anal. Chem. 70 (1998)
2254.
[21] H. Katayama, Y. Ishihama, N. Asakawa, Anal. Chem. 70 (1998)
5272.
[22] T. Graul, J. Schlenoff, Anal. Chem. 71 (1999) 4007.
[23] R. Nehme, C. Perrin, H. Cottet, M.D. Blanchin, H. Fabre,
Electrophoresis 30 (2009) 1888.
[24] R. Nehme, C. Perrin, H. Cottet, M.D. Blanchin, H. Fabre,
Electrophoresis 29 (2008) 3013.
[25] J.B. Schlenoff, S.T. Dubas, Macromolecules 34 (2001) 592.
[26] M. Takeuchi, Q. Li, B. Yang, P.K. Dasgupta, V.E. Wilde, Talanta
76 (2008) 617.
[27] P.K. Dasgupta, S. Ohira, Y. Bingcheng, M. Santosh, T. Kang, C.
Yongjing, K. Aleena, Capillary detection methods and mysteries in
conductivity measurement, in: Proc. Int. Ion Chromatogr. Symp.,
Dublin, Ireland, 2009, p. 49.
[28] T.B. Stachowiak, F. Svec, J.M.J. Frechet, Chem. Mater. 18 (2006)
5950.
[29] T. Rohr, E.F. Hilder, J.J. Donovan, F. Svec, J.M.J. Frechet,
Macromolecules 36 (2003) 1677.
[30] B. Ranby, W.T. Yang, O. Tretinnikov, Nucl. Instrum. Methods
Phys. Res., Sect. B 151 (1999) 301.
[31] T.C. Logan, D.S. Clark, T.B. Stachowiak, F. Svec, J.M.J. Frechet,
Anal. Chem. 79 (2007) 6592.
[32] E. Gillespie, D. Connolly, B. Paull, Analyst (Cambridge, UK) 134
(2009) 1314.
[33] S. Eeltink, E.F. Hilder, L. Geiser, F. Svec, J.M.J. Frechet, G.P.
Rozing, P.J. Schoenmakers, W.T. Kok, J. Sep. Sci. 30 (2007) 407.
[34] P. Zakaria, J.P. Hutchinson, N. Avdalovic, Y. Liu, P.R. Haddad,
Anal. Chem. 77 (2005) 417.
[35] A. Maruska, A. Rocco, O. Kornysova, S. Fanali, J. Biochem.
Biophys. Methods 70 (2007) 47.
[36] C. Yang, G.J. Zhu, L.H. Zhang, W.B. Zhang, Y.K. Zhang,
Electrophoresis 25 (2004) 1729.
[37] V. Pucci, M.A. Raggi, F. Svec, J.M.J. Frechet, J. Sep. Sci. 27 (2004)
779.
[38] S. Currivan, D. Connolly, E. Gillespie, B. Paull, J. Sep. Sci. 33 (2010) 1.
[39] J. Krenkova, F. Svec, J. Sep. Sci. 32 (2009) 706.
[40] J. Ma, L. Zhang, Z. Liang, W. Zhang, Y. Zhang, J. Sep. Sci. 30
(2007) 3050.
[41] F. Svec, Electrophoresis 27 (2006) 947.
[42] D.S. Peterson, T. Rohr, F. Svec, J.M.J. Frechet, Anal. Chem. 75
(2003) 5328.
[43] J. Krenkova, N.A. Lacher, F. Svec, Anal. Chem. 81 (2009) 2004.
http://www.elsevier.com/locate/trac 883

Trends Trends in Analytical Chemistry, Vol. 29, No. 8, 2010
[44] D. Connolly, E. Gillespie, M. Macka, B. Paull, Non-invasive
conductivity based techniques for the characterization of station-
ary phase chemistry and biochemistry on polymer monoliths, in:
Proc. 3rd Monolith Summer School and Symposium, Portoroz,
Slovenia, 2008, p. 24.
[45] V. O�Shea, The detection by conductivity of the effect of protein
tagging on immobilization within monolith columns and devel-
opment of a novel free sialic acid detector, PhD Thesis, Dublin City
University, Ireland, 2009.
[46] E. Gillespie, D. Connolly, P.N. Nesterenko, B. Paull, Analyst
(Cambridge, UK) 133 (2008) 874.
884 http://www.elsevier.com/locate/trac
[47] E. Gillespie, D. Connolly, P.N. Nesterenko, B. Paull, J. Sep. Sci. 32
(2009) 2659.
[48] B.P. Mason, K.E. Price, J.L. Steinbacher, A.R. Bogdan, D.T.
McQuade, Chem. Rev. 107 (2007) 2300.
[49] P. Watts, S.J. Haswell, Chem. Soc. Rev. 34 (2005) 235.
[50] S.J. Haswell, P. Watts, Green Chem. 5 (2003) 240.
[51] K.F. Bolton, A.J. Canty, J.A. Deverell, R.M. Guijt, E.F. Hilder, T.
Rodemann, J.A. Smith, Tetrahedron Lett. 47 (2006) 9321.
[52] A. Gomann, J.A. Deverell, K.F. Munting, R.C. Jones, T. Rodemann,
A.J. Canty, J.A. Smith, R.M. Guijt, Tetrahedron 65 (2009)
1450.