non-fuel uses of coals and synthesis of chemicals … archive/files/merge/vol-40... · non-fuel...
TRANSCRIPT

NON-FUEL USES OF COALS AND SYNTHESIS OF CHEMICALS AND MATERIALS
Chunshan SONG and Harold H. SCHOBERT
Fuel Science Program, 209 Academic Projects Building, The Pennsylvania State University, University Park, Pennsylvania 16802
.: Keywords: Non-fuel use, Coal, Chemicals, Materials
i ABSTRACT I‘
This paper provides an account of ow analysis of future needs for non-fuel uses of fossil fuels, particularly coal, and a discussion of possible routes for developing chemicals and materials. An overview of energy supply and demand in the world and the existing non-fuel uses of fossil fuels in the U.S. will be given first The amount of energy used for non-fuel purpose is small compared with the amount of energy consumed by end users. Nevertheless, the non-fuel uses of fossil fuels may become more important in the future. The demonstrated coal reserves in the world are enough for consumption of over 220 years at the 1992 level, while the oil reserves are only about 40 times of the worlds consumption level in 1992. Coal may become more important both as energy source and as the source of chemical feedstocks as we move into the 21st century. However, traditional non-fuel uses of coals (coke ovens and the coal tars) are diminishing rapidly. We will discuss the possible new processes for making both bulk and specialty chemicals and polymers and carbon materials from coals and liquids from coal liquefaction. Specific examples will be provided from work in progress in our laboratory, including conversion of coals and coal liquids to specialty chemicals, polymer materials, activated carbons, graphitic carbons, and electrode materials.
WORLD AND U.S. SUPPLY AND DEMAND O F FOSSIL FUELS
Table 1 summarizes energy supul~ and demand in the world and in the US., and the U.S. primary energy input into the elecmc utifinek The energy statistics data in this paper were derived from several recent DOEYEIA reD0tt.s lEIA AER. 1993: AEO. 1994: EO. 1994 IPSO. 1994 MER. 1997: ~ ~ , . . ~~~~ , .. . _. QCR, 19941. Fossil firel; are h e dominant sources-of en&gies’for m’odern societies as well as chemicals and synthetic organic materials.
Currently the world consumes 66.9 miUion barrels of oils per day (mbpd) and 24.34 billion barrels per year (136.3 quadrillion Btu/year). According to the most recent report, the estimated crude oil reserves in the world are 999.1 billion barrels, with 66.3% in the Middle East region but only about 2.4% in the U.S. The world is consuming petroleum at a very fast speed. The sum of all the petroleum reserves in w,orld is only 41 times the consumption in 1992.
As of 1992, the sum of all the known natural gas reserves in the world is 4375.8 trillion cubic feet, with about 40% in the former Soviet Union and only 3.8% in the U.S. The world total consumption in 1992 reached 74.7 trillion cubic feet, which is equivalent to 74.3 quadrillion Btu. The known reserves in the world are about 59 times the consumption level in 1992.
The worldwide coal consumption in 1992 is 5001 million short tons (4535.9 million metric tons), which is equivalent to 88.9 quadrillion Btu. The world coal rese.rves are 1145.3 billion short tons (1038.5 billion metric tons), with about 23.1% in the U.S. The world coal reserves are over 225 times the consumption level in 1992. In particular, coal is the mast abundant fossil hydrocarbon resource in the US., and the U.S. coal reserves (265.2 billion short tons) are about 300 times the current domestic annual consumption. Coal is expected to become more important in the future both as energy some and as the source of chemical feedstocks.
OVERVIEW OF NON-FUEL USES OF FOSSIL FUELS
Table 2 shows the amount of fossil hydrocarbon resources used for non-fuel purposes. Non- fuel use of fossil fuels in the US. is small compared with the amount of energy consumed as fuels by end users. As shown in Table 2, the non-fuel use of fossil resources is overwhehingly the use of petroleum products, primarily petrochemical feedstocks, asphalt and road oil, petroleum coke, and liquefied petroleum gases. Non-fuel use of coal is dominated by the coal carbonization to make metallurgical coke. The non-fuel use of natural gas includes making synthesis gas, olefins, and carbon blacks. In 1992, the 5.84 quadrillion Btu consumed for non-fuel uses of fossil fuels (including coals for coke production) represented 7.1% of total energy consumption in the U.S. (82.42 quadrillion BU). Non-fuel use of petroleum is 13.2% of petroleum consumed in the U.S.
Figure 1 shows the profile of the U.S. coal production by type over the period 1960-1992. Currently US. coal industry employs about 120 thousand miners, and produces about 1 billion short tons (about 900 million metric tons) of coals
Status of U.S. Coal Production and Utilization.
249

m u d y [NCA, 19931. About 90% of the coals are consumed domestically. About 10% of coals mined in the U.S. are exported, and they are bituminous coals, including about 43 and 60 million short tons of steam coals and metallurgical coals, respectively PICA 19931.
As shown Table 3, elecmc utilities are the dominant consumers of coals. In fact, their consumption grew from 177 to 780 million tons during 1960-1992 [Song, Schobert, Scarod, 19941. The percentage distribution of the domestic consumption in 1992 is as follows: 87.2% by utilities, 8.4% by indusaies, 3.8% by coke plants, and 0.6% by residential and commercial users. Coal accounted for about 80 8 of all the fossil fuels consumed at electric utilities in 1992.
Existing non-fuel uses of coals include (1) high temperam carbonization of bituminous coal to m&,metallurgical coke; (2) gasification of cod to make synthesis gases and other chemicals; (3) use. of coal m manufacturing other materials such as activated carbons, carbon molecular sieves (CMS) and producth of phosphoric acid; (4) the use of coal tars from carbonization (and gasification) for making aromatic chenlals; and (5 ) the use of coal tar pitch for making carbon fiks m6 activakd carbon fibers, and other related prcducts.
Non-fuel uses of coals have also been described under the Section 1304 of the National Energy Policy Act of 1992: The Secretary of Energy shall plan and carry out a program of research, development, demonstration, and commercial application with respect to technologies for the non-fuel use of coal, including (1) production of coke and other carbon products derived from coal; (2) production of coalderived, carbon-based chemical intermediates that are precursors of value-added chemicals and polymers; (3) production of chemical feedstocks via coal treatment processes.
It is expected that coal liquefaction could become a viable option sometime in the next century, for producing liquid transportation fuels as well as chemical feedstccks. Despite enormous strides in coal liquefaction research and development, coalderived liquid fuels are still not economically competitive with petroleum. However, the economic analysis of the viability of coal liquefaction may well produce a different result if some coalderived liquids, particularly aromatic and phenolic compounds, can be used for making value-added chemicals and polymer materials. Just as crude oils are also used for making petrochemicals, the liquids from coal liquefaction are expected to provide the needed organic chemicals, albeit in smaller amounts compared to their use as fuels.
The importance of promoting non-fuel uses of coal in conjunction with coal liquefaction in the future is also apparent from the following facts. In 1970 the daily petroleum production and consumption in the U.S. were 9.64 and 14.70 million barrels, respectively. However, the U.S. petroleum production decreased to 6.84 million barreldday in 1993, whereas the consumption increased to 17.03 million barrels/day. The worldwide petroleum consumption also rose from 46.81 million barrels/day in 1970 to 66.93 million barreldday in 1993, which is a 43% increase in 22 years, Currently, the US. petroleum consumption is about 24.6% of the worlds total consumption, but U.S.'s petroleum reserves are only about 2.4% of the worlds total reserves. The remaining crude oils in the existing reserves are getting heavier. For example, the average API gravity of crudes refined in the. U.S. decreased from 33.8 to 31.8 during the 10 years between 1980 and 1990; related to this increase in density (decrease in API gravity) is a constant rise in the sulfur content of the crude oils, from 0.88 wt% in 1980 to 1.11 wt% in 1990 [Swain, 19911. With the continuing decline in the resource and in the quality of crude oils, the processing of coalderived oils in existing petroleum refmeries may become economically viable sometime in the 21st century.
Liquids from coal liquefaction may be used as feedstocks for making organic chemicals and various carbon materials, in addition to their use for producing transportation fuels. Relative to heavy oils, the problems associated with refining coal-derived liquids are their higher contents of aromatics, particularly polycyclic aromatics, and higher contents of nitrogen- and oxygen-containing compounds. Sulfur removal does not seem to be such a technical problem, since it is thought that hydrodesulfurization is easier, chemically, than hydrodenitrogenation. In the context of the prcduction of chemicals and specialty materials, however, the high contents of aromatics, phenolics, and nitrogen compounds may provide a practical application of the folk adage, "If life hands you a lemon, make lemonade." If the "lemon" is the problem of dealing with the oxygen and nitrogen compounds prior to conventional refining for fuel use, the "lemonade" may be the use of these. compounds and their derivatives for making value-added chemicals and monomers for aromatic polymer materials.
Non-fuel Uses of Coals.
Energy Policy Act of 1992.
Non-fuel Use through Coal Liquefaction.
SYNTHESIS OF CHEMICALS AND POLYMERS FROM COALS
Before 1945 about.75% of all the organic chemicals in the world were based on coal-derived liquids, but with the advent of vast petroleum resources in the world during the 1940s. crude oil gradually became dominant chemical feedstocks by 1960. Currently petroleum and natural gas account for more than 90% of the major industrial organic chemicals [Speight, 1991; Sheldon, 19831. These resources are the primary sources of the seven basic organic chemical building blocks: ethylene, propylene, butadiene, benzene, toluene, the xylenes, and methanol. However, coal tars remain an important source of aromatic chemicals. The annual consumption of aromatic chemicals worldwide is about 25 Mt for benzene, toluene, and xylenes; and 5 Mt for naphthalene and three- and four-ring compounds IMurakami, 1987; Collin, 19851. Coal tar accounts for about 1545% of the BTX production and 95% of the larger aromatics.
250

The last two decades have witnessed enonnous developments in various organic and carbon- based materials [Song and Schoben, 19931, and it is certain that the late 1990s and the 21st century will see significant further growth of these materials. Examples include engineering plastics, liquid crystalline polymers, high-temperature heat-resistant polymers, polymef membra!Ies. graphitic carbon materials, carbon fibers, and activated carbon fibers. Many of the s m g matends for monomers of the aromatic polymer materials are not readily available from pemkum.
Scheme I shows some important aromatic polymer materials [Song and Schobert, 19931. Scheme H gives the structures of some important liquid crystalline polymers [Song and Schobert, 19931. Due to the recent development of many aromatic polymer materials, there is a great demand for aromatic monomers. Since the U.S. production of coal tar, which is an important source for 1- to 4-ring chemicals (particularly 2- to 4-ring aromatics), has declined significantly in the past decade, there is a need for developing an alternative source of aromatic chemicals in the future. With the rapidly increasing engineering applications of aromatic compounds for polymer materials, the demands for many aromatics of one to four rings have increased in the recent past, and this trend is expected to continue into the 2lst century. Thus an excellent opportunity exists to explore the potentials of developing value-added chemicals and specialty materials from coals and the liquids obtained from coal liquefaction.
As we have discussed in detail elsewhere [Song and Schobert, 19931, research on deriving coal- based chemicals from coal liquids can be viewed as an extension of coal liquefaction research. Development of value-added chemical products could both increase the economic viability of coal liquefaction and make coal liquids more competitive with pemleum because coal liquids contain many compounds not found in petroleum [Song et al., 1991,1992; Lai et al., 1992; Zhou et al., 1992; SaiN and Song, 19941. In analogous fashion, the economic viability of processing heavy residual materials could also be strengthened if approaches were developed for their conversion into value-added chemical feedstocks as well as transportation fuels.
f 1 . \
I
We suggest that two broad approaches can be taken for coal conversion into value-added chemicals. The fmt can be viewed as the indirect approach, analogous to the so-called "indirect" coal-to- chemical conversion [Schoben, 19841. The essence of the indirect approach would be the conversion of coals to liquids. Once the liquids were obtained, they would be subjected to appropriate separation or conversion operations to produce the chemical products of interest However, separation of coal liquids into individual compounds is time consuming and expensive. An analogy from coal processing is the concept of combining short-contact-time liquefaction with catalytic dealkylation to produce aromatic hydrocarbon monomers [Song et al., 1989; Hirota et al., 19891. The simplified aromatic compounds will then be used for making value-added products. The alternative. much bolder and of much higher risk, is the direct approach. In this approach a reagent would be introduced to the coals to cleave only a certain well-defined set of bonds and carefully cut out the molecular structures of interest. The highly selective removal of these srmctures could lead to monomers or precursors to the monomers for some of the high-performance polymer materials. An analogy proposed for direct production of chemicals from coal would be the use of selective oxidation to generate high yields of benzene carboxylic acids from low-rank coals [Song and Schobert, 19931.
On-going Research on Catalytic Synthesis of Chemicals in This Laboratory
In this section, specific examples will be. provided from work in progress in our laboratory, including conversion of aromatic compounds in coal liquids to value-added chemicals, specialty chemicals, and monomers for polymer materials. We are exploring the catalysts, reactions, and processes for developing value-added chemicals and materials from coal-derived, carbon-based compounds.
a r e studying coal liquefaction in conjunction with the production of aromatic chemicals. Analysis of various coalderived oils indicates that there are many 1- to 4-ring aromatic and polar compounds in coal-derived liquids that can be converted into valuable chemicals [Lai et al., 1992; Song and Schoben, 1993; Burgess et al., 1993; Huang et al., 1994; S a i N and Song, 1994; Song and Saini, 1994; Lai and Song, 19951. For example, phenol, naphthalene, and phenanthrene are rich in coal liquids from primary liquefaction of some coals. Phenol is one of the top twenty organic chemicals [CEN, 19941 and is commercially synthesized through multi-step process (benzene isopropylation, oxidation of isopropyl benzene, separation of phenol). However, phenol is rich in the oils from coal liquefaction, particularly when the liquefaction is promoted by dispersed catalysts and water [Song and Saini, 1994; Saini and Song, 19941. Phenol can be separated directly from the coal liquids, and it can be used as or converted into monomer for many aromatic polymers and engineering plastics, including those shown in Scheme I. Naphthalene and its derivatives are rich in the oils from some bituminous coals. Naphthalene and 2- alkylnapthalene are important aromatic chemicals. It should be noted that the use of aromatic compounds, that are in coal liquids and heavy oils, for making value-added chemicals requires the starting material to be reasonably pure. Our recent catalytic studies include the shape-selective conversion of two- to three-ring aromatic compounds (naphthalene, phenanthrene, and their derivatives) into value-added chemicals, as described below.
This catalytic reaction can produce 2,6-dialkyl substituted naphthalene (2.6-DAN). 2.6-DAN is needed now as the feedstock of monomer for making the advanced polyester materials such as polyethylene naphthalate (PEN, Scheme I), polybutylene naphthalate (PBN, Scheme I), and liquid crystalline polymers (LCP, Scheme 11). By using some shape-selective catalysts, we have achieved selective alkylation of naphthalene, with over 65% selectivity to 2.6-DAN by using isopropanol [Song and Kirby, 1993, 19941 or propylene as the alkylating agent [Schmitz and Song, 19941. We also found some simple and effective methods for
Production of Phenol and Aromatics from Coals via Liquefaction. We
Shape-selective Alkylation of Naphthalene.
251
\

enhancing the selectivity, which are not available in the prior arts [Schmitz and Song, 1YY4, unpublished data].
Ring-shift Isomerization of Phenanthrene Derivatives. This reaction leads to anthracene derivatives, particularly sym-octahydroanthracene (sym-OHAn). We have found that some catalysts selectively promotes the transformation of sym-octahydrophenantne into sym-OHAn, which we call ring-shift isomerization [Song and Moffan, 1993,19941. Some catalysts can afford over 90% selectivity with high conversion [Lai and Song, 1994, unpublished datal. This work could provide a cheap mute to making anthracene and its derivatives, which are valuable chemicals in demand, Rom phenanthrene, which is rich in coal tar from coal carbonization, pyrolysis, and liquefaction. Examples of the possible applications of sym-OHAn may include the manufacturing of anthracene (which is in demand for making dyestuffs), anthraquinone (which is an effective pulping agent), and pyromellitic dianhydride (which is the monomer for making polyimides such as Du Pont’s Kapton).
Conformational Isomerization of cis-Decalin to trans-Deca!ia. The commercial decalin solvents axe almost equimolar m i x c m sf cis&alin and uans-decalin. In an earber work using dec~. r . as a solvent, we found accidentally that cis-decalin isomerize into trans-decalin at low temperatures (250°C) over some catalysts [Song and Moffatt, 1993, 19941, which would otherwise requires a high temperature such as 450°C [Song et al., 19921. This work is a continuation of our earlier observation that transdecalin has substantially higher thermal stability at high temperatures [Song et al., 19921. Our recent experimental results indicate that it is possible to achieve over 90% conversion with 95% selectivity with some catalysts at low temperatures such as 200°C [Lai and Song, 1994, unpublished]. Possible application of this work is the manufacture of high-temperature heat-transfer
used both as heat sinks and as fuels that are required for high-Mach aircraft [Schobert et al., 19941.
Shape-selective Naphthalene Hydrogenation. Complete hydrogenation of naphthalene in convential process produce miXNres of cis- and transdecalin, and. In recent studies on naphthalene hydrogenation, we have found that certain catalysts selectively promote the formation of cis-decalin or transdecalin [Song and Grainne, 1993, unpublished data; Schmitz and Song, 1994, unpublished data]. Now we can selectively produce cisdecalin, with over 80% selectivity at 100% conversion [Schmitz and Song, 1994, unpublished data]. cis-Decalin may have potential industrial application as the starting material for making sebacic acid, which can be used for manufacturing Nylon 6.10 and softeners.
.J
1 I
I
fluids. Another application lies in the production of advanced thermally stable jet fuels, which can be
t
PRODUCTION OF CARBON MATERIALS FROM COALS
Carbon materials represent an important market for non-fuel applications of coal and coal- derived pitch materials. We have discussed the possibilities of developing various coal-based carbon materials recently [Song and Schobert, 19931 based on the materials listed in several reviews by Walker [1986,1990] and by Marsh [1989,1991]:
Metallurgical cokes Molecular sieving carbons (MSC) Pitch-based carbon fibers Mesocabon microbeads (MCMB) Mesophase-based carbon fibers Carhn fiber reinforced plastic Carbon whiskers or filament Graphite and graphite-based materials Diamond-like films
Activated carbons Activated carbon fibers Carbon elecucdes Carbon blacks Intercalation Materials Elastic Carbons Composite materials Fullerenes or “bucky-balls” ,
Carbon-based Materials Made Directly from Coals. Currently the production of metallurgical coke is the largest non-fuel use of coals, primarily bituminous coals. It is estimated that about 500 million tonnes (metric tons) of coke are produced annually in the world [Mochida and Sakanishi, 19931. China is one of the largest producers and consumers of coals and coke. In 1992, China produced 1204 million short tons of coals [EIA EO, 19941. About 10% of coals mined in China ae used for making metallurgical coke [Guo, 19941.
Figure 2 shows the profile of the U.S. metallurgical coal consumption and coke production over the period 1950-1992. Coal consumption by the U.S. coke industry (and some other indusnial sectors) uended downward-since early 1970s. The reasons have been discussed in our previous review [Song and Schobert, 19931. In 1993, the metallurgical coal consumption and coke production in the U.S. were 31.3 and 23.2 million short tons, respectively. The annual demand for coke in the U.S. is expected to funher decrease to 18.7 million short tons by 2002 [Gilbert, 19931. The decrease in coke production also means a decline in coal tar production, which could lead to the shortage of both aromatic chemicals, particularly 2- to 4-ring chemicals, and the pitch feedstocks for making carbon fibers and other needed carbon materials. This also gives rise to the need for developing alternate coal-based feedstocks for making various aromatic chemicals and carbon materials.
Activated carbons are used mainly as adsorbents for liquid-phase and gas-phase applications. In 1992, the world total annual production of activated carbons from various feedstocks was estimated
252

to be about 450,000 tonnes; among which 70,000 tonnes were produced in China, with about 30,000 tonneS made from coal and 40,OOO tonnes from the other feedstocks [Gao, 19941. The amount of coals used worldwide for producing activated carbons are estimated to be 200,000 tonnes/year [Golden, 19921. Significant growth potential exists for this application, primarily for environmental protection, e.g., purification of water and air. Jagtoyen and Derbyshire have carried out a series of studies on the production of activated carbons from bituminous coals by chemical activation [Jagtoyen et al., 1992, 19931. The liquid phase applications include water purification, decolorizing, food processing, and gold recovery, etc.; the gas phase applications cover air purification, gas treatment, and solvent recovery. More information on activated carbons may be found in a recent review by Derbyshire and co-workers [Derbyshire et al., 19941.
The amount of coals used worldwide for producing molecular sieving carbons are estimated to be 3,OOO tonnesJyear [Golden, 19921. The application of molecular sieving carbons (MSC) for gas separation by pressure-swing adsorption (PSA) is now commercially viable. For example, MSC is used for air separation by Air Products and Chemicals Inc. It is expected that more companies will be engaged in producing MSC in the 1990’s and into the next century.
The other industrial non-fuel uses of coals are included in those by industries and rnanUfaCNI%Ig plants, especially those who make chemicals, cement, paper, ceramics, and various metal products. Table 4 shows the U.S. coal consumption at manufacturing plants in 1992 by standard indusmal classification (SIC) code [EIA QCR, 19941. Use of coal for gasification can be parrly classified as non- fuel use when the products are used as chemical feedstocks. Gasification is currently used for making synthesis gas (CO + Hz) and for producing H2 for various hydrogenation and hydroprocessing in pewchemical and petroleum retining industries. The use of coal for gasificationis included in Table 4 at the manufacturing plant with SIC code 29.
The details of the non-fuel uses at manufacturing plants are not available. However, direct coal injection into blast furnace is already in indusuial practice. This use may have been included in SIC Code 33 in Table 4. There are some other interesting uses [Bonskowski, 19941. Some lignite can be used as additive in drilling mud (drilling for oil and gas) as a lubricant and sealant. Young [1993] reviewed some other non-fuel applications of coais, particularly low-rank coals. They are 1) form coke fiom non-coking coals for use as a reductant in the metallurgical indusuies; 2) agricultural use of low- rank coals for production of coal-based fertilizers, soil conditioners, and humic acids; 3) special adsorbent carbons for storage of gases such as methane; and 4) production of carbon black and carbon support for making catalysts.
The heavy fractions of coal tars, widely called coal tar pitches, are the raw materials for making carbon fibers and other carbon materials such as mesocarbon microbeads [Matsumura. 1989; Song and Schobert, 1993; Derbyshire et al., 19941.
The liquids and semi-liquids derived from coal extraction and liquefaction can also be used for making various carbon-based materials such as carbon fibers and graphitic materials. Kimber et al. [1981] and Zondlo et al. [1993] reponed on the production of graphitic materials from carbonization of coal extracts. Kimbex and Gray [19761 also noted that there are potential advantages in using coal-based coke for making carbon elecmdes. Fei et al. [1994] reported on the production and properties of carbon fibers from coalderived liquids as well as shale oils. Some lignite in California is used in an extraction process to make Montan wax, which may be used in shoe polishes, elastics, and elecmcal insulating [Bonskowski, 19941.
Carbon-based Materials Made from Coal-derived Liquids.
On-going Research on Production of Carbon Materials from Coal and Coal Liquids in This Laboratory
In the following section, specific examples will be provided from work in progress on carbon materials in our laboratory, including conversion of coal and pitch materials into various carbon materials.
Our interest in the possibility of converting anthracite into graphite was stimulated by two considerations: anthracites already conrain well over 90% carbon, with aromaticities of essentially 1; and while anthracite currently sells in the range of $80 per ton, the best quality graphite materials sell for about $80 per pound. Our initial research was motivated by two hypotheses. First, the alignment of the large ammatic sheets presumed to exist in anthracite into the ideal graphitic suucture could be facilitated by removing any residual heteroatom or aliphatic carbon atoms that might serve as covalent m s s l i i “locking” the aromatic sheets into disordered SUUCNT~S. This, it was hypothesized, could be accomplished by reaction of anthracite with powerful hydrogen donors, such as 9,lOdihydrophenanthrene or 1,2,3,4-tetrahydro-fluoranthene prior to graphitization. Second, this process would be facilitated further if the spent donor (e.g., phenanthrene arising from 9,lO-dihydrophenanthrene) was itself a graphitizable material and could therefore provide sites around which the graphitic structure could grow.
We have investigated the reactions Of several Pennsylvania anthracites with hydrogen donors [Atria et al., 1993,1994; Atria, 19951. Cocarbonization of anthracite with a hydrogen donor, followed by high-temperature graphitization, produces a material having crystalline d-spacings in the range 0.3357-0.3361 run, values which are quite close to the ideal value for graphite, 0.3354 nm. However, the crystalline height, b, of the best materials are in the range 54.7-58.8 nm, about half the value
Conversion of anthracite into graphite.
253

(104.0 nm) observed in commercial graphite. As part of this work we have obtained unequivocal evidence that hydrogenation of anthracite does occur by direct reaction with hydmgen donors.
To further improve the quality of the graphitic product, we have begun an investigation of the catalytic graphitization of anthracites [Zeng et al., 1995al. In this work, six Pennsylvania anthracites bein evaluated as feedstocks. The catalysts currently under investigation are La2O3, CezO3, and Gdz8-j. mixed with anthracites in amounts up to 5%. A second aim of this present project is to reduce substantially the temperature of graphitization. We are investigating graphitization tempratures as low as 1800°C, whereas in our earlier work much of the graphitization was done at 2900 C. A very large reduction in graphitization temperature nanslates to a significant energy saving in the graphitization process.
Conversion of Coals into Activated Carbons. At present, the main thmst of c i i work is again devoted to Pennsylvania anL!xi*s. A sinal coliateraj effort is underway on activation of Turkish low-rank coals, in conjunction with various agriculturaJ products indigenous to Turkey.
Steam and air activation have been investigated for production of carbons from anthracites [Gergova et al., 1993% 1993bl. The highest BET surface area obtained was 720 mz/g [Gergova et al., 1993bl. The panicle size of the anthracite is a critical paramem, the best carbon (in terms of apparent surface area) was obtained from anthracite of <1 mm particle size. Subsequent work [Gergova et al., 19951 has used an environmental scanning elecaon microscope (ESFM) to observe development of a porous structure in real time, even though the ESEM operates at 2 Torr, whereas normally activation is done at atmospheric pressure. In this work we also investigated air treatment of the anthracite (e.g., 3 h at 30OOC) prior to steam activation. The activated anthracites produced in the latter study have a microporous structure with a significant fraction of the pores having molecular dimensions. This suggests that molecular sieve materials could be produced from Pennsylvania anthracites.
Related Studies on Anthracites. Anthracite has long been an "orphan" in coal science research. Only a tiny fraction of the coal literature is devoted to reports of work on anthracites; in consequence, little fundamental information is available on anthracite properties and structure. Recently we have begun a collaborative effort with Carbone-Lorraine North America to investigate the basic physical properties of anthracites [Zeng et al.. 1995bl. Major physical properties, including density, mechanical strength, hardness, coefficient of thermal expansion, and micmstructure, are being measured and correlated with chemical properties such as proximate and ultimate analyses, porosity, apparent surface area, and aromaticity. The aim is to evaluate further the potentialities of using anthracites as raw materials for the production of various carbon products.
Very limited testing of the elecmcal properties of Pennsylvania anthracites has shown that they are not substantially below mesocarbon microbeads in some properties affecting use in lithium batteries or other dry cells [Zeng, 19941. We infer, from this encouraging preliminary work, that limited, but controlled, srmctural modification of anthracites could make them amactive candidates for electrodes in batteries.
CONCLUDING REMARKS
Despite the relatively small amount of their non-fuel use. research into efficient use of the valuable hydrocarbon resources such as coal for non-fuel applications is becoming imponant.
We must always bear in mind that coal is an important source of hydrocarbons. There are many ways of using the hydrocarbon resources. Burning is only one of them. Expansion of the non-fuel uses is desirable, because coal will also become more important as source of both energy and chemical feedstocks in the next century. From the viewpoints of the resource conservation and effective utilization, many of the components in coals as well as in petroleum should be converted to. or used as value-added chemicals, polymers, and carbon materials.
George A. Olah, the 1994 Nobel Prize winner, pointed out recently [I9911 that "oil and gas resources under the most optimistic scenarios won't last much longer than through the next century. Coal reserves are more abundant, but are also limited. ... I suggest we should worry much more about our limited and diminishing fossil resources." James L. Adams indicated in his recent book [1991] that "oil and coal used as fuel have allowed us to work wonders, but they are too valuable as complex hydrocarbons that can be converted into all som of the forms (such as plastics) to be so rapidly burned in automobiles, power plants, and furnaces."
ACKNOWLEDGMENTS
Various portions of our research were supported through funding or donations of special samples from the U.S. Department of Energy, Pittsburgh Energy Technology Center, Pennsylvania Energy Development Authority, Air Products and Chemicals Inc., PQ Co, and Duracell Co. Helpful discussions with Professor H. Marsh of Southern Illinois University, Dr. T. Golden of Air Products and Chemicals Inc., Dr. G.M. Kimber of British Coal Co., Dr. K.C. Krupinski of Aristech Chemical Co.. Dr. R. F. Bonskowski of DOJYEIA, Dr. J. Broadhead of Duracell Worldwide Technology Center, and Drs. F. Rusinko, S. h e r , S. Zeng, W.-C. Lai, and A. Schmitz of PSU are gratefully achowledged.
254

,
REFERENCES
Adam, J. L. Flvine Buttresses. Entrouy. and 0-Rings. The World of an Engineer. Harvarc _ - University prkss; 1991, p.241.
erauhite from anthracite. Procedines 21st Biennial Conference on Carbon, uu. 342-343.1993.
- Atria, J. S.M. Zeng, H.H. Schobert, and F. Rusinko, Jr. A novel approach to the production of
Atria,-J.k., S. Zeng, F. Rusinko, Jr., b d H.H. Schobert. Novel approach id the production of graphite from anthracite. Am. Chem. Soc. Div. Fuel Chem. Prepr., 1994.39.884888.
Atria, J.V. Production of anthracite from graphite, M.S. Thesis, The Pennsylvania State University, University Park, PA, 1995.
Bonskowski, R. F. Energy Information Administration, U.S. DOE. personal communication November 9,1994.
Burgess, C. E., K. Wenzel, C. Song, P. G. Hatcher, and H. H. Schobert. Structural Correlation 01 Coal Liquefaction Oils with Flash Pyrolysis Products. Roc. 7th Internat. Conf. Coal Sci., Banff Canada SeDt. 12-17. 1993. Vol. I, ~~.311-314.
CEN Collin, G. Erdol und Kohle - Erdgas Petrochem. 1985.38 (11). 489-496
Chem. Eng. News, July 4, 1994 - - Derbvshire. F. J.. M. Jaetoven. Y. 0. Fei. and G. Kimber. Am. Chem. Soc. Div. Fuel Chem I-. ~. ~ -1 ~ ~
F‘repr., 1994,.39 (l), c3-‘120. ~- ’
Energy Informatlon Admmistration (EIA). Annual Energy Review (AER) 1992, U.S. DOE, Report No. DOE/EIA-0384(92), June 1993.
EIA AEO Annual Energy Outlook 1994, DOEEIA-0383(94), January 1994. EIA IEO International Energy Outlook (IEQ), DOE,EIA-0484(94), July 1994. EL4 IPSR International Petroleum Statistics Report (IPSR), DOE/EIA-0520(94/04), April 1994. EIA MER Monthly Energy Review (MER), DOwEIA-0035(93/08), August 1993. EL4 QCR Quarterly Coal Report (QCR), July-September 1993, DOE/EIA-O121(93/3Q), February
EIA QC;94, Quarterly Coal Report (QCR), January-March 1994, DOE/EIA-O121(94/lQ), August
Fei, Y.Q., F. Derbyshire, M. Jagtoyen, and I. Mochida. Advantages of Producing Carbon Fibers and
Gao, S . Activated Carbon Industry in China Tanso (Japanese), 1994, No. 163, 145-149. Gergova, K., S. Eser, and H.H. Schobert. Pyrolysis/activation of anthracite for production of activated
carbons, Proceedings, 21st Biennial Conference on Carbon, pp. 412413,1993. Gergova, K., S. Eser, and H.H. Schobert Preparation and characterization of activated carbons from
anthracite. Energy and Fuels, 1993,7,661-668. Gergova, K., S . Eser, H.H. Schobert, M. Klimkiewicz, and P.W. Brown. Environmental scanning
electron microscopy of producing activated carbons from anthracite using one-step pyrolysis/activation. Fuel, 1995, in press.
Gilbert, B.R. Co-production of Iron and Methanol. Proc. 10th Ann. Internat. Pittsburgh Coal Conf., University of Pittsburgh, Pittsburgh, Sept. 20-24, pp.410-415, 1993.
Golden, T.C. Air Products Co., personal communication, April 24,1992. Guo, S . Present State and Overview of Coal Utilization Technology in China Energy & Resources
(Japanese), 1994, 15 (2). 161-165. Hirota, T., M. Nomura, and C. Song. A Method for Manufacture of Aromatic Chemicals from
Coals. Japan Patent, 1-279990 (Assigned to Osaka Gas Company, Japan), November 10, 1989 (in Japanese).
Huang, L., C. Song, and H. H. Schobert. Liquefaction of Low-Rank Coals as a Potential Source of Specialty Chemicals. Am. Chem. Scc. Div. Fuel Chem. Prepr., 1994,39 (2). 591-595.
Jagtoyen, M., M. Thwaites, J. Stencel, B. McEnaney, and F. Derbyshire. Adsorbent Carbon Synthesis from Coals by Phosphoric Acid Activation. Carbon, 1992.30 (7), 1089-1096.
Jagtoyen, J. Groppo, and F. Derbyshire. Activated Carbons from Bituminous Coals by Reaction with H3P04: The Influence of Coal Cleanning. Fuel Process. Technol., 1993.34.85-96,
Kimber, G. M., and M. D. Gray. Comparison of Evolution of Heteroatoms from Coal and Petroleum Based Electrode Cokes. Am. Chem. SOC. Sym. Ser., 1976,21,445-450.
Kimber, G. M., A. Brown, and J. N. kirk. Arc-steel Electrodes from Coal via Solvent Extraction. High Temp. -High Press., 1981, 13, 133-137.
Lai, W.-C., C. Song, H. H. Schobert., and R. Arumugam. Pyrolytic Degradation of Coal- and Petroleum-Derived Aviation Jet Fuels and Middle Distillates. Am. Chem. Soc. Div. Fuel Chem. Prepr., 1992.37 (4). 1671-1680.
Lai W.-C. and C. Song, 1994, unpublished data, The Pennsylvania State University, Lai, W.-C. and C.’Song. Temperature-Programmed Retention Indices for GC and GC-MS Analysis 01
Coal- and Petroleum-derived Liquid Fuels. Fuel, to bepublished, 1995. - Marsh, H. 1991. “New and Traditional Carbon Materials from Petroleum and Coal Sources”. Papel
presented at Information Transfer Session, Cooperative Program in Coal Research, November 18-19, Pennsylvania State University, University Park, PA.
Marsh, H. (Ed.), 1989. “Introduction to Carbon Science”, Butterworths, London, 321 pp. Matsumura, Y. Current Status and Rospectives of Coal Pitch-Based Carbon Fibers. Kagaku Keizai
Matsumura, Y. Expanding Applications of Pitch-Based Carbon Materials. JlXI (Jappanese), 1989b,
Mochida, I. and K. Sakanishi. Tasks and Scopes of Coal Science. J. Japan Inst. Energy (Japanese),
Murakami, H. Nenryo Kyokai-Shi (Jappanese), 1987.66 (6). 448-458. NCA Facts about Coal. National Coal Association, July 1993.
1994.
Activated Carbon Fibers from Shale Oils. Proc. of 1993 Eastern Oil Shale Sym., May 1994.
(Jappanese), 1989a, No.9, 33-41
37 (No.9). 223-226.
1993, 72 (S), 312-320.
255

Olah, G. A. Nonrenewable Fossil Fuels. Chem. Eng. News, February 11,1991. Saini, A. K., and C. Song. Two-Dimensional HPLC and GC-MS of Oils from Catalytic Coal
Schmidt, E., and C. Song Model Hydrocracking Reactions over Monometallic and Bimetallic
Schmitz, A., and C. Song. Shape-Selective Isopropylation of Naphthalene over Dealuminated
Schmitz and Song, 1994, unpublished data, The Pennsylvania State University. Schobert, H.H., 1984. In: W.R. Kube, E.A. Sondreal, and C.D. Rao (Eds.), Technology and
Schoben, H.H., S. Eser, C. Song, P. G. Hatcher, P. M. Walsh, and M. M. Coleman. Advanced Thermally Stable Jet Fuels. Technical Report, U.S. Department of Energy, DE-FG22- 92-2104-TPR-8, Ju!y 1994.96 pp.
Sheldon, R.A. Chemicals from Synthesis Gas. Reidel Pub. Co., Boston, 1983 Song, C., K. Hanaoka, and M. Nomura. Short-Contact-Time Pyrolytic Liquefaction of Wandoan
Subbituminous Coal and Catalytic Upgrading of SCT-SRC. Fuel, 1989.68 (3). 287-292. Song, C. and H. H. Schoben. Specialty Chemicals and Advanced Materials from Coals: Researct
Needs and Opportunities. Am. Chem. Soc. Div. Fuel Chem. Prepr., 1992,37 (2). 524-532. Song, C. and S. Krby. Shape-Selective Alkylation of Naphthalene over Molecular Sieve Catalysts.
Am. Chem. Soc. Div. Petrol. Chem. Prepr., 1993, 38 (4). 784-787. Song, C. and K. Moffatt. Zeolite-Catalyzed Ring-Shift and Conformational Isomerization Reactions
of Polycyclic Hydrocarbons. Am. Chem. Soc. Div. Petrol. Chem. Prepr., 1993, 38 (4), 779- 783.
Song, C. and H. H. Schobert. OppOnUnitieS for Developing Specialty Chemicals and Advancec Materials from Coals. Fuel Processing Technol., 1993, 34 (Z), 157-196.
Song, C. and H. H. Schobert. Aromatic Polymer Precursors from Coals: A New Direction in Coal Chemistry. Proc. loth Ann. Intemat. Pittsburgh Coal Conf., University of Pittsburgh, Pittsburgh Sept 20-24, pp.384-389, 1993.
Song, C. and S. Kirby. Shape-Selective Alkylation of Naphthalene with Isopropanol over Mordenite Catalysts. Microporous Materials, Elsevier, 1994,2 (5) . 467-476.
Song, C. and K. Moffatt. Zeolite-Catalyzed Ring-Shift Isomerization of sym-Octahydrophenantne and Conformational Isomerization of cis-DecahvdronaDhthalene. Microoorous Materials.
Liquefaction. Am. Chem. Soc. Div. Fuel Chem. Prepr., 1994,39 (3), 796-800.
Dispersed Catalysts. Am. Chem. Soc. Div. Fuel Chem. Prepr., 1994.39 (3). 733-737.
Mordenite. Am. Chem. Soc. Div. Fuel Chem. Prep., 1994.39 (4). 986-991.
Utilization of Low-rank Coals. US. Dept of Energy Report WE/ME1%/84-13; pp. 83-103.
- - Elsevier, 1994,2 (9,459-466.
Song, C., H.H. Schoben, and A.W. Scaroni. Current Status of U.S. Coal Utilization Technologies and Pros~ects. Enerev & Resources (JaDanese). 1994. 15 (2). 142-153.
Song, C., and A. K. Saini.-- Using Water ha' Dispekd MoSiCatalyst for Coal Conversion into Fuels and Chemicals. Am. Chem. Soc. Div. Fuel Chem. Prepr., 1994.39 (4), 1103-1107.
Speight, J.G. (Ed.), Fuel Science and Technology Handbook. Marcel Dekker: New York, 1990.1 193 PP.
Speight, J.G., The Chemistry and Technology of Petroleum. Marcel Dekker: New York, 1991, Chapter 21 (Petrochemicals), p.717.
Swain, E.J. U.S. Crude Slate Gets Heavier, Higher in Sulfur. Oil Gas J., 1991, September issue,
Walker, P.L., Jr. 1986. Review Article: Coal Derived Carbons. Carbon, 24 (4): 379-386. Walker, P.L., Jr. 1990. Carbon: An Old but New Material Revisited. Carbon, 28: 261-279. Young, B.C. Meeting the Value-Added Challenge with Coal Briquetting and Pelleting. Proc. 10th
Ann. Intemat. Pittsburgh Coal Conf., University of Pittsburgh, Pittsburgh, Sept. 20-24, pp.402- 407, 1993.
Zeng, S . Unpublished data, The Pennsylvania State University, University Park, PA, 1994. Zeng, S., F. Rusinko, Jr., H.H. Schoben, D.P. Struble, and W.A. Nystrom. Graphitization of
anthracites with the addition of rare earth compounds. Proceedings, 22d Biennial Conference on Carbon, (submitted, 1995).
Zeng, S., F. Rusinko, Jr., H.H. Schobert, D.P. Struble, and W.A. Nystrom. Investigation of the physical properties of Pennsylvania anthracites. Proceedings, 22d Biennial Conference on Carbon, (submitted, 1995).
Zhou, P.-Z., Marano, J.J. and Winschel, R.A., 1992. Prep. Pap.-Am. Chem. Soc., Div. Fuel Chem.,
Zondlo, J.W., P.G. Stansberry, and A.H. Stiller. Pitch and Coke Production via Solvent Extraction of Coal. Proc. 10th Ann. Intemat. Pittsburgh Coal Conf., University of Pittsburgh, Pittsburgh, Sept. 20-24, pp.379-383, 1993.
59-61.
37 (4), 1847-1854.
256

Scheme I. Structures of Some Important Aromatic Plastics Materials
n
Polyethylene Terephthalate (PW /Damn, Mylar
Polyethylene Naphulalate (PEN) I Teijin, Amoco
Polybqtylene Terephthalate (PBT) / Valox. Celanex
Polybutylene Naphthalate PBN) /Teijin's PBN Resin
hlYC&OMte (w)
Polyphenylene Oxide (PPO)
P o i y s u l f ~ (ps)
Polyphenylene Ether Ether Ketone (PEEK)
Polyarylate (PAR)
Scheme II. Structures of Some Important Liquid Crystalline Polymers (LCPs)
251

Table 1. World and U.S. Energy Supply and Demand
Year T o t a l Petroleum N.Gas Coal Nuclear Hydropower Other ~~
World Total Energy Consumption / Quadrillion Bm Btu)
1992 347.5 136.3 74.3 88.9 21.5 22.3 4.4
U.S. Energy Consumption / Quadrillion Btu
1992 82.42 33.51 20.34 18.89 6.65. 2.81 0.22
US. Energy Productlon / Qurdri!!ion B:u
1992 66.93 15.22 20.67 21.68 6.65 2.81 0.22
U S . Energy Input a t Electric Utllltles I Quadrillion Btu
1992 29.56 0.95 2.83 16.19 6.65 2.76 0.19
Note: According to DOE EIA. 1 quadrillion BN b equivalent to 45 million shon tons of coal. 170 million bamls of crude oil. and 1 trillion cubic feet of dry natural gas.
Table 2. Non-fuel Use of Fossil Fuels in the US. in 1992
Coal Petroleum N. Gas Cote Oihcr Pctro- Asphall Liquefied Lubricant Pctroleum Special Wax, Chemical
chemical and Road Petrolcum Cote naphtha elc. fscdrtoeti fccdrtostr Oil Gases
Phydrd Unlt I million rhm tons fa Coal; million bmclr for oil; billion cubic feet for natural gas
32.37 1.8 202 166 386 5 4 4 2 1 9 27 611
Energ, Unll / Quadrillion Btu Bru)
0.73 0.05 1.14 1.10 1.35 0.33 0.25 0.10 0.16 0.63
- Lignite
w
t 100-
0 1 1 9 6 0 1 9 7 0 1 9 8 0 . 1 9 9 0 2 0 0 0 2 0 1 0
Year
Figure 1. Production of coal by type in the U.S. during 1960-1992 (1 short ton = 0.907 metric ton).
. I
258

f c
i \
120 - 100-
80-
60-
40-
20-
Table 3. US. Coal Production and Consumption
Coal Supply and Demand I million short tons Year Production Consumption Export Import Others and
IOSSCS
1992 997.545 892.421 102.516 3.803 9.407
Coal Consumptlon by Sectors I million short tons
Year Electric Utilities Coke Plants Other Industrial Residential and Total consum Commercial
1992 779.860 32.366 74.042 6.153 892.421
- CoalConsumed
Note: 1 shon ton = 907.184 kg = 2000 pounds = 0.907 mcmc ton
\ - CokeRoduced
ProJec t lon
0 4 . I . I . I . I . r . I I 1 9 4 5 1 9 5 5 1 9 6 5 1 9 7 5 1 9 8 5 1 9 9 5 2 0 0 5
Year
Figure 2. U.S. metallurgical coke production during 1949-1992
Table 4. U.S. Coal Consumption at Manufacturing Plants by Standard Industrial Classification Code (Thousand Short Tons)
SIC code Jan-March Apr-June July-Sept Oct-Dcc U.S. 1993 1993 1993 1993 T o t a l
20 21 22 24 25 26 28 29 30 32 33 34 35 36 xx
Food and kindred products Tobacco products Textile mill products Lumber and wood products Furninuc and fixtuns Pap1 and allied products Chemicals. allicd products Petroleum and coal products’ Rubber. mix. plastics products Stone. clay. glasa producu Rimmy metal indusmcs’ Fabricated mcUl producls Machincry. except clectric Electric. elecmnic quipmcnt
(SIC 23. 27. 31, 37. 38. 39) Other manufacturing industries
2264 184 370 2 7 35
3302 3490 1760 7 8
2781 1623 113 180 8 9 w
1568 156 313 2 9 1 8
2918 3079 1832
6 7 3170 1833 5 9 8 4 5 9 W
1491 1 5 4 258 2 3 1 6
2946 3044 1695 5 6
3329 1 7 0 0
3 3 4 8 2 9 w
2419 1 5 4 334 3 0 3 2
3270 3338 I963 6 4
3478 1872
8 0 121 6 8 w
7802 648 1275 109 101
12436 12951 7250 265
12758 7028 285 433 245
W
U.S. Total 17175 15705 15268 17931 66079 1) Includes coal gasification projects. 2) Excludii coke planls. W Withheld by DOE to avoid disclosw of individual company data.
259

PROCESSING, STRUCTURE AND PROPERTIES OF PITCH-BASED CARBON-CARBON COMPOSITES
S. P. Appleyard, B. Rand and C. E. Ahearn School of Materials, University of Leeds,
Leeds, LS2 9JT, U.K.
Keywords: Carbon-carbon composite, pitch, fibre-matrix interface
INTRODUCTION The potential of carbon-carbon (CC) composites as materials for high temperature applications was recognised at a very early stage, leading to their development in the 1960's as materials for thermal protectior. dnring space vehicle re-entry. By the early 19?o's, two basic approaches to the formation of the carbon matrix were established, namely through chemical vapour deposition from a hydrocarbon gas (CVD) (1) and through carbonisation of a carbon-bearing resin or pitch (2). Fundamentally, little has changed since those early years with respect to these basic methods of CC composite fabrication. Further developments have, however, involved the introduction of multidirectional fibre architectures in order to reduce the mechanical anisotropy present in unidirectionally and bidirectionally reinforced composites caused by poor mechanical properties in the unreinforced directions. The strategic importance of several aerospace applications of CC composites, including military rocket nozzles and nose cones, the NASA space shuttle nose cone and leading edge protection surfaces, aircraft brake discs and gas diverter fins, ensured their continued development during the 1970's and 1980's.
The technique of liquid impregnation is now a major procedure for the densification of CC composites (3). Despite nearly 30 years of development, however, the utilisation of fibre strength in densified CC composites is still only around 65 % (3). There is, therefore, a need for a comprehensive understanding of the factors giving rise to this lost potential so that improvements in properties may be achieved. Furthermore, new applications of CC composites are currently emerging which exploit some of the thermal characteristics of the composite structure as manifest in the graphite crystal structure. There is thus a need to further understand the ways in which the composite microstructure may be controlled during the fabrication process. This paper reviews the principal microstructural features of interest in CC composites produced with pitch precursors to the carbon matrix and illustrates the influence of fibre-matrix interactions on the microstructure and properties.
MICROSTRUCTURE OF CC COMPOSITES The microstructures of CC composites may be very complex, involving various degrees of crystallinity and texture on differing scales of magnitude, and several types of interfaces, pores and microcracks, conceivably all in the same specimen (4). Both fibre and matrix undergo significant microstructural changes during fabrication; the fibre and matrix may interact, thus producing unique microstructural features that cannot be obtained by identical processing of the separate constituents (5).
The orientation of the outer turbostratic sheath of carbon fibres has been observed to increase on graphitisation compared with that of a fibre graphitised independently of a composite (6). This increased alignment is thought to arise from an interfacial stress effect. Fibres may thus undergo a substantial increase in modulus of elasticity during thermal processing of a CC composite (7). Such stresses, caused by strong fibre-matrix coupling and matrix shrinkage during carbonisation of the composite, have also been claimed to damage the fibre (8).
Although the overall texture of CC composites is dominated by the structure and architecture of the fibre reinforcement, the existence of preferred orientation (texture) in the microstructure of the matrix is significant. Texture in the matrix is established primarily from two sources, namely the chemistry of the organic matrix precursor and fibre-matrix interfacial effects. Matrix carbons derived from pitches tend to be structurally anisotropic, a product of the development of layers during the growth and coalescence of mesophase spheres in the initial stages of pyrolysis. If unhindered and mechanically undisturbed, the coalesced mesophase produces a coarse microstructure (9). Plastic deformation during this stage, due to externally applied stresses or the formation of gaseous by-products of pyrolysis, may disrupt long range ordering of the mesophase resulting in a finer microstructure. Similar effects are caused either by the application of pressure during carbonisation or by
260
\
4 chemical moss-linking of the structure (10, 11). Controlled alteration of the matrix microstructure may be achieved by the blending of various fractions of pitches (12). !
\ Texture has been observed to initiate in previously structurally isotropic mkitrices on heat treatment to graphitising temperatures (13). This effect has been ascribed to a concentration of stress developing along the fibre-matrix interface, arising from the combined actions of matrix densification (volume shrinkage) and thermal expansion mismatch between the fibre and the matrix. A second form of fibrematrix interfacial effect, characteristic of structurally anisotropic matrices, involves the development of carbon atoms arranged in planar layers oriented parallel to the fibre surface (14). A full understanding of this effect has not been reached. The "matrix sheath" may result from fluid flow rather than from wetting (Is), though forces acting on the disc-like molecules by the surface do produce a
\
\ strong anchoring effect, as detected by the resistance to orientation induced by a magnetic field (16). Disruption of the sheath can be produced by the application of
structure of graphite, the ability to control the texture of the matrix is clearly
pressure during carbonisation and the effects of chemical cross-linking of the structure (10, 11). Given the potential anisotropy in properties conferred by the
important in order to allow complete control over the properties of the composite. Graphitisation of anisotropic matrix carbons causes further structural
changes to occur. These changes include 'fold-sharpening" and 'polygonisation". The former appearing to constitute the first point at which the process of graphitisation becomes microscopically evident (17); shrinkage cracking tends to break a sheet or fold into segments at fairly regular intervals, and these segments sharpen to decreasing radii of curvature. Polygonisation is evidenced by the formation of mosaic block type structures, and. has the effect of relaxing the compressive stresses generated by the tendency to shear the layers into graphitic registry (17).
Few studies have been reported concerning the characterisation of porosity in CC composites. Jortner (18) distingtiishes between "pores" and "cracks". Pores
by incomplete filling by the matrix (perhaps due to poor wetting of the fibres, or incomplete compaction of prepregs resulting in dry zones within the composite) and
while a matrix precursor is still liquid or plastic (18). Cracks, comprising "shrinkage", "cooldown" and Yhermal stress heating" cracks, arise from stresses due to structural rearrangements during heat treatment or thermomechanical effects.
The geometry of the fibre architecture and nature of fabrication of CC composites generate a number of interfaces present on both the umini-mechanical" and =micro-mechanical" scales (18). Interfaces that occur on the mini-mechanical scale include fibre tow-fibre tow, bundle-bundle, bundle-matrix and layer-layer interfaces. On the micro-mechanical scale exist fibre-matrix and matrix-matrix interfaces (18). The strength of the fibre-matrix interface is critical to the behaviour of CC composites under mechanical loading. A good fibre-matrix coupling is required to maximise energy transfer from the matrix to the fibre, though it must not be so strong as to cause brittle failure of the composite (19). Matrix-matrix interfaces also have importance as they may limit the ability of the matrix to distribute the load equally between fibre-matrix units or to redistribute the load around individual unit failures (20). In pitch-based carbon matrix composites, the structure of the interfacial zone is monopolised by the presence of matrix sheath, described above. This sheath may actually be a source of debonding of the interface due to the actions of fold-sharpening and polygonisation during graphitisation (11).
The exact nature of Bonding" at the interfaces in CC composites, and hence what controls the bond strength, is not fully understood. Various types of interaction across the interface may exist, including strong and weak chemical bonds, mechanical interlocking and friction (4). Full characterisation and control of interfaces remains one of the most elusive aspects of the technology of CC composites.
EXPERIMENTAL Model unidirectional CC composites comprising continuous PAN-based fibres and petroleum pitch-based matrices were fabricated by wet-winding and moulding in a heated press, followed by heat treatment. Several types of PAN fibre were used. These included a surface treated standard modulus fibre (SMS) and an untreat&d high modulus fibre (HMU). Two main temperatures were chosen for the routine
\
I, . L \ I i
1 primarily arise from processing problems. Examples of these include pores formed
by the entrapment of gases produced during solvent removal, curing or pyrolysis I
261

heat treatment of composites. These were a "carbonisation" temperature of 900 "C and a "graphitisation" temperature of 2250 "C. The porous composites so formed were densified by means of pitch-melt impregnation. Composites were studied by optical and scanning electron microscopy and X-ray diffraction. Various propehes were studied including electrical resistivity and mechanical behaviour.
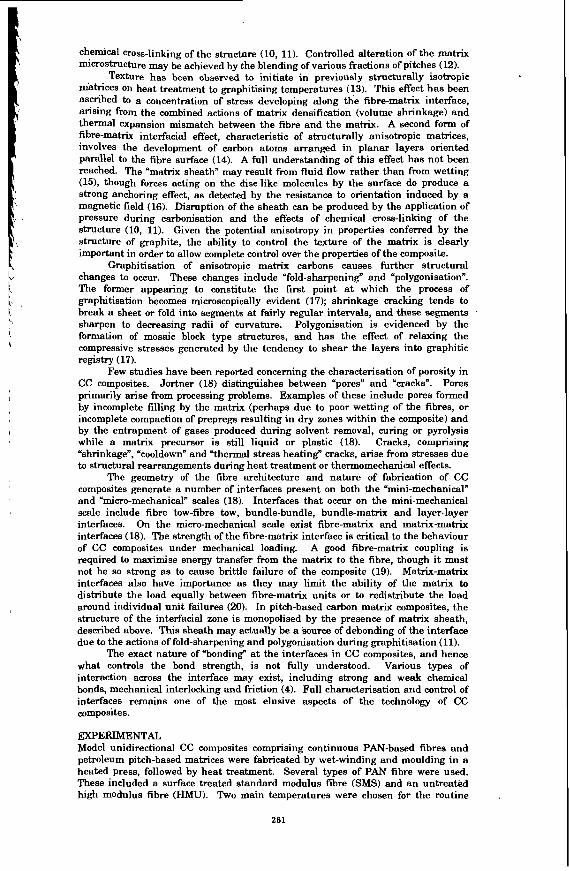
STRUCTURAL AND PHYSICAL CHARACTERISATION A major characteristic of the initial establishment of CC composite structures during carbonisation and graphitisation was the creation of a large number of voids due to matrix shrinkage. M e r initial carbonisation of the HMU-pitch composites, point counting revealed only - 20 % of the fibre surface to be contiguous with matrix. Cracks had developed which were mainly located a t the fibre-matrix interface. These cracks, however, were extensively interconnected and enabled very eE&ent densification of ilre structure by pitch-melt impregnation. Cracks in the SMS composite, conversely, were generally located within the matrix and tended to have a thin lath-like morphology, This reflected the greater strength of the fibre-matrix interface due to the surface treatment of the fibre, and also revealed the matrix to be prone to failure due to cleavage of the anisotropic structure along planes of weakness. Densification of the SMS composites was not very efficient due to the "bottle-shape'' nature of the voids. The location of shrinkage cracks was thus strongly influenced by the combination of the fibre-matrix interface strength and the strength and texture of the matrix (Figure 1). In turn, the void shapes and their degree of interconnectivity governed the efficiency of densification by liquid impregnation.
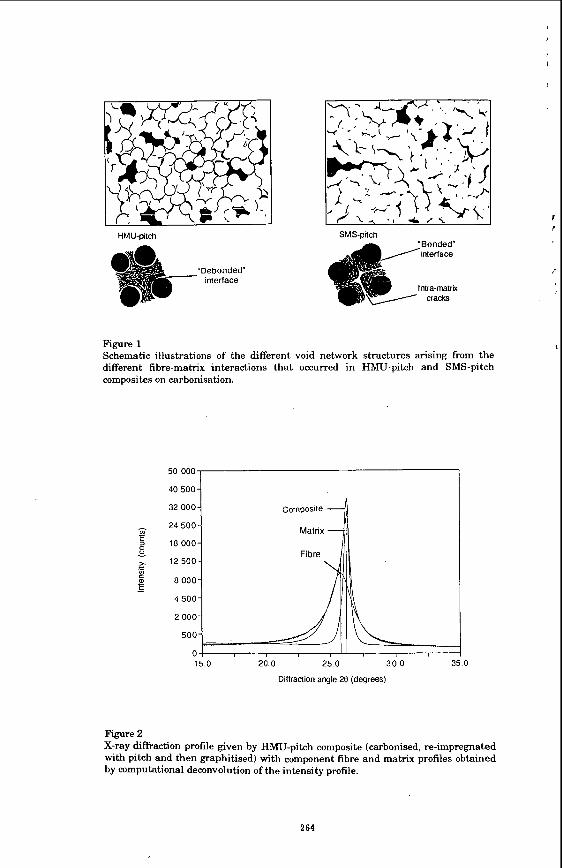
X-ray dieaction (002) profiles of the green and carbonised composites were largely dominated by the fibre (002) profiles. On graphitisation, marked changes in the composite (002) profiles occurred as they became matrix dominated. Deconvolution of the (002) intensity profiles into separate fibre and matrix profiles enabled do,, and L, to be determined for each constituent (Figure 2). The matrix L, values were greater with respect to similarly heat treated bulk raw materials, indicating the effects on structure of fibre-matrix interactions during graphitisation.
Measurements of electrical resistivity were made both parallel and perpendicular to the fibre axes. Of the densified composites, the carbonised SMS composites exhibited the lowest electrical anisotropy (- 6). This reflected both the lower structural anisotropy of the SMS fibre and matrix structures (cf. graphitised fibres / matrices) and the high degree of fibre-matrix contiguity present in the composite. Departures from one or more of these conditions resulted in greater anisotropy. Matrix resistivity in the axial direction was calculated by considering the composite as a sequence of parallel resistors, together with knowledge of the longitudinal fibre resistivities, V, V, and V,. The carbonised matrix resistivity averaged 1.64 x 10⁻⁶ a m , reducing to 4.02 x 10⁻⁶ a m on graphitisation. The axial resistivity of the graphitised pitch matrix thus approximately matched that of highly oriented Amoco P-100 pitch-based fibres after individual heat treatment to 2500 "C (21). These measurements clearly illustrate the potential of the matrix sheath regarding control of composite properties; alignment of matrix carbon basal planes parallel to the fibre axis greatly enhanced composite electrical conductivity in the longitudinal direction.
MECHANICAL PROPERTIES Flexural strengths were measured at span-to-depth ratios of 80:l. The strength of the fibre-matrix interface strongly influenced the mode of fracture during flexural testing. A range of fracture behaviour was observed, from "brittle-catastrophic" to "pseudo-ductile", depending on the fibre-matrix combination and fabrication history. The carbonised SMS composites failed by a brittle failure mechanism; only 25 % of the fibre strength was utilised. Failure of the carbonised, densified HMU composite was evidently by means of multiple matrix cracking followed by fibre failure and fibre pull-out. In this case 60 % utilisation of fibre strength was achieved (assuming the contribution of the matrix to strength to be negligible). Graphitisation may give rise to changes in the mode-of-failure due to changes in the nature of the interface and matrix texture. Similarly, low temperature oxidation, in which the oxidation reaction clearly takes place preferentially at the fibre-matrix interface may weaken the fibre-matrix interface enabling debonding and fibre sliding. Increases in utilisation of fibre strength may thus occur as a result of the greater strains at which maximum load occurs.
r
262

CONCLUSION Succesful control of fibre-matrix interactions at each stage of fabrication is key to the control of properties of CC composites. The void network established during the initial heat carbonisation has a large effect on the efficiency and effectiveness of subsequent densification processing. The influence of matrix texture on the elechical properties of CC has been illustrated; as the lattice properties of anisotropic carbons are similarly reflected in the properties of modulus of elasticity, thermal expansivity and thermal conductivity, an ability to control matrix texture is clearly of great importance. These properties are of especial importance regarding an emerging application of CC composites, namely the packaging of electronic systems. Finally, if improvements in utilisation of fibre properties are to be achieved, it is imperative to advance understanding of the various structural features
I
! 1
11 influencing modes-of-failure.
REFERENCES
i
2. 3.
4.
5.
6. 7.
8.
9.
10. 11. 12.
13.
14. 15.
16. 17. 18. 19.
20. 21.
H. M. Stoller and E. R. Frye, Symposium of the 73rd Annual Meeting of the American Ceramic Society, Advanced Materials: Composites and Carbon, American Ceramic Society (1973) p163. A. R. Taverna and L. E. Mdl is te r , ibid. p199. R. A. Meyer, Materially Speaking (Publication of The Materials Technology Centre, Southern Illinois University at Carbondale) 9, Summer (1994) pl. L. H. Peebles Jr., R. A. Meyer and J. Jortner, Proc. of 2nd Int. Conf. on Composite Interfaces, American Society of Metals, Ohio, Published as Interfaces in Polymer, Ceramic and Metal Matrix Composites, Ed. H. Ishida, Pub. Elsevier, New York (1988) p l . R. J. Diefendorf, Extended Abstracts of the 13th Biennial Conference on Carbon, American Carbon Society, Imine (1977) p381. W. Kowbel, E. Hippo and N. Murdie, Carbon 27 (1989) p219. R. Bacon, L. C. Nelson, S. L. Strong, E. F. Valla and G. Wagoner, Extended Abstracts of the 19th Biennial Conference on Carbon, American Carbon Society, Penn State (1989) p342. E. Fitzer and A. Burger, Proc. 1st Int. Conf. on Carbon Fibres, The Plastics Institute, London (1971) p134. J. E. Zimmer and J. L. White, Disclination Structures in the Carbonaceous Mesophase in Advances in Liquid Crystals 6, Pub. Academic Press, New York (1982) p157. E. Fitzer, W. Huttner and L. M. Manocha, Carbon 18 (1980) p291. J. L. White and P. M. Sheaf€er, Carbon 27 (1989) p697. S. Kimura, E. Yasuda, K. Yasuda, Y. Tanabe, K. Kawamura and M. Inagalu, Tanso 126 (1986) p62. Y. Hishiyama, M. Inagaki, S. Kimura and S. Yamada, Carbon 12 (1974) p249. J. E. Zimmer and J. L. White, Carbon 21 (1983) p323. J. H. Cranmer, I. G. Plotzker, L. H. Peebles Jr. and D. R. Uhlmann, Carbon 21 (1983) p201. J. E. Zimmer and R. L. Weitz, Carbon 26 (1988) p579. J. Dubois, C. Agache and J. L. White, Metallography 3 (1970) p337. J. Jortner, Carbon 24 (1986) p603. L. Boyne, D. Cook, J. Hill and K. Turner, Proc. 4th London Int. Carbon and Graphite Conf., SOC. of Chemical Industry, London (1974) p215. B. L. Butler, D. A. Northrup and T. R. Guess, J. Adhesion 6 (1973) p161. Y. Tanabe and E. Yasuda, Report of the Research Laboratory of Engineering Materials, Tokyo Institute of Technology 17 (1992) p137.
ACKNOWLEDGEMENTS S. P. Appleyard would like to acknowledge the financial support of the Science. and Engineering Research Council (SERC), Swindon, Wiltshire, UK. and IC1 Advanced Materials, IC1 Wilton Research Centre, Middlesbrough, Cleveland, UK.
263
HMU-pitch SMS-pitch
I r
Figure 1 Schematic illustrations of the different void network structures arising from the different fibre-matrix interactions that occurred in KMU-pitch and SMS-pitch composites on carbonisation.
40 500
32 000
24 500
18 000
12 500
8 000
4 500
2 000
500
0 15 0 20 0 25 0 30 0 35 0
Dilfraction angle 20 (degrees)
Figure 2 X-ray diffraction profile given by HMU-pitch composite (earbonised, re-impregnated with pitch and then graphitised) with component fibre and matrix profiles obtained by computational deconvolution of the intensity profile.
264

I
EVALUATION OF RESIDUAL SHALE OILS AS FEEDSTOCKS FORVALUABLE CARBONMATERIALS
You Qing Fei and Frank Derbyshire Centex for Applied Energy Research, University of Kentucky,
3572 Iron Works Pike, Lexington, KY 4051 1-8433
Keywords: Shale oil, carbonktion, solvent extracton
INTRODUCTION oil shale represents one of the largest fossil fuel resources in the US and in other parts of the world. Beginnhg in the 1970s until recently, there was considerable research and deveIopment activity directed primarily to technologies for the production of transportation fuels &om oil shale. Due to the low cost of petroleum, as with other alternate fuel strategies, oil shale processing is not economically viable at present. However, future scenarios can be envisaged in which non- petroleum resources may be expected to contribute to the demand for hydrocarbon fuels and chemicals, with the expectation that process technologies can be rendered economically attractive.
There is potential to improve the economics of oil shale utilization through broadening the spectrum of products that can be derived from this resource, and producing added-value materials that are either unavailable or more difficult to produce from other sources. This concept is by no means original. The history of oil shale development shows that most attempts to commercialize oil shale technology have relied upon the marketing of by-products [I]. These have included asphalts, constnrction bricks, cement, soil additives, town gas, lamp oil, rock wool insulation, ammonia, sulphur, paraffin, olefins and other chemicals, and power generation.
In this context, we have conducted investigations to assess the potential for producing p r d u m carbon materials fiom shale oil residues. Retorted shale oils generally contain more high-boiling fractions than petroleum crudes [2,3]. This is especially true for eastern US shale oils. These properties make shale oils very attractive as carbon sources because the heavy fiactions have high carbon contents. Another characteristic of shale oils is their high nitrogen content, which presents difficulties also in upgrading these liquids to clean fuels because extensive and deep hydrogenation is required. The nitrogen-containing species are more concentrated in the higher boiling fractions and accentuate the problem [4,5]. On the other hand, the nitrogen-containing compounds can become highly valuable feedstocks or chemicals if they are separated collectively or individually from shale oils.
We have already reported the successll production of isotropic carbon fibers and activated carbon fibers from the asphaltene fraction of residual shale oil produced &om eastem US shale by the Kentort process [6, 71. While the mechanical properties of the carbon fibers have yet to be assessed, the presence of nitrogen has been shown to enhance the catalytic properties of activated carbon fibers for reactions such as the ambient-temperature oxidation of SO2 [8], and the nitrogen content is believed to contribute to the wide pore structure that is formed in the activated fibers [7,9].
As the maltene fiaction of the shale oil residue has a much lower nitrogen content than the asphaltene fraction, it may be more suitable for the synthesis of other forms of carbon. In this paper, we present the results of studies to investigate the carbonization properties of this materia and to determine the potential for generating a pitch with high mesophase (a carbonaceous liquid aystal) content that could serve as a precursor for the production of materials such as needle cokes (a highty-oriented and graphitizable carbon) for the manufacture of graphite electrodes, and high-performance carbon fibers.
EXPERIMENTAL A shale oil residue (SOR), produced in the Kentort II process fiom eastern oil shale [lO,ll], was used in the study. This residual oil was collected in an electrostatic precipitator and comprised 70-80 wf?? of the total oil products from the retort. The sample was fmher fractionated by extraction with boiling hexane in a Soxhlet apparatus to obtain !?actions with different heteroatom contents or polarity 1121, namely, hexane-soluble @IS) and hexane-insoluble fractions. The parent shale oil sample and the extracted fiactions were subjected to elemental and 1H and 13C-NMR analySeS.
Carbonizntion reactions were conducted both at atmospheric pressure and elevated p-6. Atmospheric pressure carbonization was performed in a Pyrex tube. Samples were heated in the tube reactor under nitrogen flow at 440 OC for 4h, in a vertical electric timace. p r e w
265

carbonization was conducted using a stainless steel tubing bomb (41" x 4") [13, 141. The bomb was charged With 15-20g of sample and placed in a sand bath preheated at 440-500 OC for a reaction time of 4- 6 h. The reaction pressure was maintained at 700 kPa by pressurizing the bomb with nitrogen before the carbonization reaction and automatically rel-&g excess pressure through a relief nozzle over the course of the experiment. The carbonized products were weighed and hrther characterized by elemental analysis and optical microscopy Wtz, Mvp2), u@ polarized light, after mounting and polishing.
RESULTS AND DISCUSSIONS Almost the same yields of hexane-soluble (SOR-HS) and hexane-insoluble (SOR-HI) 6 d O n s were obtained upon extraction. This means that the eastern crude shale oil contains 30-40 wt?? of asphaltenes, in comparison with western shale oils which have less than 5 wto?[2,3]. Table 1 shows some analytical data for the parent shale oil and the extracted fractions. In the order of SOR-HS, parait SCR end SOR-HI, the aromaticity increased and the WC atomic ratio decreased. Aliphatic components are concentrated in the maltene (SOR-HS) 6 a d o n which has correspondingly low aromaticity. Sulfur is distributed evenly in both extracted M o n s although it is to be noted that the sulfur concentration is much higher than found in other shale oils [2,3]. About 85% of the total nitrogen in the parent shale oil is concentrated in the SOR-HI 6 d o n , where nitrogen content is about six times higher than that of SOR-HS.
Figure 1 shows the optical texture of products obtained by atmospheric pressure carbonization of the parent shale oil and the hexane soluble fraction. Both feeds produced mosaic texture cokes. The product from the parent shale oil has a fine mosaic texture (about 5 p in size), while larger isochromatic units (- 20 pm size) were observed in the SOR-HS coke. The hexane insoluble fraction (SOR-HI) also gave a 6ne mosaic texture very similar to that of the parent shale oil, possibly because the presence of the HI !?action dominates the carbonization progress, as indicated by carbonization yield in Table 2. The hexane soluble fraction alone gave a yield of only 8 wt %, whereas it was 46 wt% for the hexane-insoluble 6action. The yield for the parent shale oil was 26 wt%, essentially following the additive rule.
The optical micrographs of products obtained by pressurized carbonization of the shale oil and the hexane-soluble 6action are shown in Figure 2. Under these conditions, excellent flow domain textures were formed 6om the SOR-HS 6action. The MI-range shale oil gave a mosaic texture, -20 pm, larger than that obtained under atmospheric pressure. The effects of using elevated carbonization pressure have been reported to be favorable for anisotropy development for many other heavy oils, and it has been employed commercially to produce needle cokes[l4]. It has been reported that a western shale oil and its maltene fraction also produce mosaic texture cokes upon the atmospheric carbonization, even after various preheat treatments [IS, 161. These results are consistent With the experiment results described above, although there may be differences in composition, structure and reactivity between the eastern and western shale oils. The experiment results indicates the importance of both solvent fhctionation and overpressure to the carbonization of shale oil products. The results of the present study hrther suggest that the maltene 6action of eastern shale oil may be used to produce mesophase pitches for the synthesis of high-performance carbon fibers, or for premium coke production if sulfur and nitrogen contents are scceptable. Elemental analyses of green cokes shows that much lower nitrogen cokes are produced by using the maltene fractions rather than the full-range shale oil, Table 3.
The innuence of carbonization conditions on coke yield can also be seen in Table 2. Pressurized carbonization can substantially increase the yield. Notably, the yield from the maltene fraction WBS
increased by a factor of about four at 700 kPa. The effects of high pressure and a closed system will be to prevent the escape of volatile components and cracked products and retain a higher proportion of the precursor in the liquid phase. The coke yield also reflects the high reactivity of the SOR-HI fraction: there was only a 20% increase in yield upon going to pressurized carbonization.
Based upon previous hdings[6,7] and the results of the present investigation, at least one scheme can be proposed for the more effective use of residual shale oils, Figure 3. The fist step involves solvent separation into maltene and asphaltene fractions. Deasphalting processes have been used to prepare feedstocks for delayed coking in order to produce high grade cokes 60m petroleum heavy oils and lower the impurity contents @asidly metals, such M and V) of the coke products. The Same step seems necessary to render shale oils suitable for premium coke production, although the reasons appear to be somewhat different.
266

The asphaltene fraction from shale oil contains a high concentration of nitrogen species and has a high coking reaaivity that can inhibit mesophase development [SI. The nitrogen-containing species also tend to be retained in the resultant cokes, and cwld cause puffing problems at grphitization. Although the sulfurs in the SOR-HS may also result in puffing, desulphurization can be achieved relatively easily by mild hydrogenation [17]. Thus, by removing asphaltenes, a material can be obtained that would be a suitable precursor for the production of needle cokes, or 8 mesophase pitch for the manufacture of high performance carbon fibers. Alternatively, maltene fractions may be completely relined to produce liquid fuels by conventional catalytic upgradimg, since most of problematic nitrogen-containing species are removed.
The asphaltene fractions can be used as a source of specialty carbons with high nitrogen content. The combustion of such high nitrogen-content fuels could result in unacceptable emission of nitrogen oxides [Ig]. The production of isotropic carbon fibers and activated carbon fibers with unique properties may be an example of their practical utilization. Thus, starting with a heavy shale oil, we may produce a variety of valuable carbon materials in the form of pitch, coke and carbon fibers, with optical texture ranging from isotropic, fine mosaic to flow domain.
L
I t \ h
REFERENCES 1. C.F. Knutson, B.F. Russel and G.F. Dana, Proc. 20th Oil Shale Symposium, Colorado School of Mine, Golden, CO, USA, 1987, p2 17. 2. C.S. Scouten, In Fuel Science and Technology Handbook, edited by James G. Speight, published by Marcel Dekker, Inc. New York and Basel, (1990), p1008. 3. Peny Nowacki, In Oil Shale Technical Data Handbook, Published by Noyes Data Co., 1981, p19. 4. J.W. Bunger, P.AV. Devineni and D.E. Cogswell, Reprint, American Chemical Sociaty, Div. Fuel Chemistry, 37(2), 581(1992). 5. Pmky Udaja, Gregory J. Due and Martin D. Chensee, "Coking reactivities of Australian shale oils", Fuel, 69(9), 1 lSO(1990). 6. Y.Q. Fei, F. Derbyshire and T. Robl, "Carbon fibers and activated carbon fibers from shale oil residue", Preprints, Am. Chem. Soc., Div. Fuel Chemistry, 38(2) 427(1993). 7. Y.Q. Fei, F. Derbyshire, M. Jagtoyen and I. Mochida, "Advantages of producing carbon fibers and activated carbon fibers from shale oils", Proc., Eastern Oil Shale Symposium, Lexington, KY, USA, Nov.1619, 1993, p38. 8. F. Derbyshire, Y.Q. Fei, M. Jagtoyen and I. Mochida, Abstracts, International Workshop: Novel Technology for DeSOx and NOx, Fukuoka, Japan, Jan., 1994. 9. Y.Q. Fei, M. Jagtoyen, F. Derbyshire and I. Mochida, "Activated carbon fibers from petroleum, shale oil and coal liquids", Ext. Abstracts and Program, International Confecence on Carbon, Granada, Spain, June 3-8, p.666, 1994. 10. S.D. Carter, T. Robl, AM. Rubel and D.N. Taulbee, "Processing ofEastern US Oil Shale in a Mutistaged Fluidized Bed System", Fuel, 69(9), 1124(1990). 11. S.D. Carter, A.M. Rubel, T. Robl and D.N. Taulbee, "The development of the Kentort n process for Eastern Oil Shale", Final Report to DOE, Contract No. DE-FC21-86LC11086,
12. Y.Q. Fei, K. Sakanishi, Y.N. Sun, R.Yamashita and I. Mochida, Fuel, 69(2), 261 (1990). 13. I. Mochida, Y.Q. Fei and Y. Korai, "A study of the carbonization of ethylene tar pitch and needle coke formation", Fuel, 69(6), 667(1990) 14. I. Mochida, K. Fujimoto and T. Oyama, In Chemistry and Physics of Carbon, Vo1.24, edited by P. Thrower, publiskd by Marcel Dekker, Inc., 1994, pl11 IS. M.A. Sadeghi, V.L. Weinberg and T.F. Yen, "Alternative precurwrs for mesophase formation", Extended Abstracts and Program, American C o d Carbon, 1983, pl16. 16. M.A. Sadeghi, V.L. Weinberg and T.F. Yen, "Shale oil delayed coking products utilization for manufacturing graphites" Preprints, Am. Chem. SOC., Div. Fuel Chemistry, 29(3), 224(1984) 17. SeeRef 2, p199. 18. RK. Lyon and J.E. Hardy, "Combustion of spent shale and other nitrogenous chars", Combustion and Flame, 51,105(1983).
May 1990.
261

Table 1 Analytical data for the parent shale 011 and fractions
Yield Elemental Anal sls Wto Atomic Ratio fa I ID I (wt?h) 1 - 7 7 + + q " , C NIC(xl00)l
I SOR I - I 82.02 8.58 1.38 1.84 I 1.26 1.47 I 0.57
I SOR-HS I 52 I 82.55 10.21 0.41 1.85 I 1.48 0.43 10.45 I I I 81.39 6.88 2.49 4.81 I 1.01 2.62 10.71
SOR, parent shale oil; HS, hexane-soluble fraction; HI, hexane-insoluble fraction; fa, fraction of aromatic carbon
Table 2 Carbonization yield ( wt%) of parent shale oil and fractions
I
Atmospheric I Pressurized I I pressure (700 kPa) I Feedstock 11 SOR-HI 46 57
* SOR, parent shale oil; HS, hexane-soluble fraction; HI, hexane-insoluble fraction
Table 3 Properties of green cokes obtained from parent residual shale oil and HS fraction
I Feedstock I SOR I SOR-HS I conditiom
Optical texture Mosaic
N content (wfh)
SOR, parent shale oil; HS, hexane-soluble fraction.
268

Figure 1 Optical texture of products carbonized at atmospheric pressure from: (a) Parent SOR, (b) Hexane-soluble fraction of SOR
5Opm
Figure 2 Optical texture of products carbonked under pressure (700 Wa) from: (a) Parent SOR, (b) Hexane-soluble fraction of SOR
50pm
Figure 3 Illustration of a valueadding route for utilization of residual shale oils and resultant Intermediate and final products
269

PRODUCINQ VAPOR OROWN CARBON FIBERS WITH HIGH SULFUR COAL WITHOUT SO, E H I 8 8 I O N S
R. Alig, M. Lake, J. Guth, and D. Burton Applied Sciences, Inc.
P.O. BOX 579 Cedarville, OH 45314
Keywords: SO, Control Technologies, Coal Pyrolysis, Organic Sulfur Removal
ABBTBACT This paper describes the development of a unique prscess that produces a highly graphitic, vapor grown carbon fiber (VGCF) frcn the gas phase in pound quantities. Past vapor grown carbon fiber progress has stagnated because the iron catalyst did not grow filaments profusely enough to make a practical continuous reactor. It has been found that adding H,S at an equimolar level with the iron catalyst, the filament formation vastly increases. Coal is desirable as a sulfur source, for it eliminates the need for handling toxic H,S, and it is a very low cost hydrocarbon supply for the process. We show that Ohio, high-sulfur coal containing 2 . 5 to 4 .6% sulfur accomplishes both tasks. There is also evidence that sulfur from the coal remains with the carbon fiber catalyst during the reaction and does not exhaust as SO, into the atmosphere.
INTRODUCTION Carbon fibers have been of practical interest within the industrial community for over a century; Thomas Edison tried them as filaments for light bulbs. The Air Force started carbon fiber development for aerospace in the 1950 's because of their mechanical and electrical shielding properties. These fibers were found to be stronger than steel, stiffer than titanium, and yet lighter than aluminum. Today, golf clubs, fishing poles, and tennis rackets are typical uses in the commercial sector.
A. Commeroial fibers Commercial carbon fiber uses are limited because they are more expensive than competing metals for engineering applications. Furthermore, their diameter is 8 p , which is larger than normal fillers, such as carbon black, for reinforcement. This imposes expensive and limited processing techniques into composite applications. Hand lay-ups and slow pultrusion techniques are the norm; straight injection molding is out of the question. The total U . S . market for carbon fibers in 1990 was 6 million lb, of which 0.8 million lb were for the recreational market at an average cost of 23 $/lb for the carbon fiber'. For comparison: 3 billion lb of carbon black were shipped to rubber manufacturers in 1992, at an average cost of 0 . 2 5 $/lb.
Commercial carbon fibers are formed from polymer precursors such as polyacrylonitrile (PAN) or petroleum pitch. The precursor is extruded or spun similar to textiles into a continuous filament or thread, oxidized under tension to Zoo0 C, and followed by slow heating in the absence of air to 1 0 0 0 ~ C to carbonize the fiber. Sometimes, the carbon fiber is given additional heating up to 3000'C to develop higher degrees of graphitization, which is needed for expensive ultra-high strength (2000 $/lb range) applications.
8. Vapor grown carbon fiber This paper is based upon a unique form of carbon fiber requiring no precursor filament. It is called vapor grown carbon fiber (VGCF), known as PYROGRAF 111'". From initial inventions at General Motors, the patents were licensed to Applied Sciences, Inc. in 1992 for further development and manufacture. The process began by early workers, exposing vapor phase metals, generally iron, supported on inert substrates while exposed to hydrocarbons and hydrogen3 at a temperature in the 1000 - 1150' C. range. This catalyzed the growth of long, slender, partially graphitic filaments' as
270

shown in Figure 1. Although these methods remained essentially batch processes and too inefficient for mass production, this VGCF when subsequently heat-treated has a thermal conductivity Of 1950 W/m-K (highest value found in nature except for diamond) and is sold as a carbon/carbon composite for aerospace thermal management materials. This was followed by attempts at a continuous process by injecting and dispersing the iron catalyst particles directly into the gas stream, and eliminating the use of a substrate for This was still non-productive; the iron catalyst did not grow filaments profusely enough to make a practical continuous reactor. A breakthrough occurred when it was found and confirmed from early work in the 1950's by Kauffman and Griffiths' that sulfur was vital to fiber formation. Adding hydrogen sulfide (H2S) at an equimolar level with the iron catalyst, vastly increase9.'' the filament formation making a continuous reactor practical (Figure 2 ) . We believe that the sulfur is incorporated in the fiber by being adsorbed onto the catalyst, and subsequently overcoated with graphite.
Figure 3 shows scanning electron micrographs of vapor grown carbon fibers grown by a gas phase process in comparison with typical continuous commercial carbon fibers. The diameter of PYROGRAF I11 generally averages 0 . 2 ~ as produced, while commercial fibers are 8 p in diameter. Due to the nature of the gas phase generation, the fibers become entangled during growth and are not continuous like commercial fibers. The lengthldiameter ratio for PYROGRAF I11 ranges from 40 to 2 0 0 . Due to the process and purity with which carbon is formed into the fiber, VGCF is highly graphitized (Table 2 ) and the stressfstrain properties for 7.5~ VGCF (Figure 4) results in similar or higher property ranges than commercial carbon fibers. The smaller diameter and entanglements of the PYROGRAF I11 defy measurement.
c. Coal Most of the VGCF made to date used laboratory grade methane, benzene, acetylene, etc. as a hydrocarbon source as a step toward reproducible results. Since we have developed one product line that can produce almost a pound per hour, natural gas is frequently used for high volume trials. Although the addition of H2S was instrumental in achieving this improvement, it is used with great reluctance. Hydrogen sulfide is expensive, highly corrosive to rubber seals and metal fittings, flammable, and its toxicity is on a par with hydrogen cyanide.
This suggests that a fossil fuel such as Ohio high sulfur coal may be especially apropos for this problem since Ohio coal production has gone from 55 million tons in 1970 to 33 million tons in 1990. Ohio coal's high sulfur content is most responsible for this decline, which is projected to go lower due to the 1990 clean Air Act Amendment. Furthermore, coal would have a tremendous effect on the eventual price of the fiber. The hydrocarbon is the most expensive cost item, followed by the electric oven energy and the catalyst. Although the energy consumption and output capabilities are not yet optimized for a total cost picture, the formulations that will be discussed later show that coal at 30 $/ton not only drastically reduces the cost of the carbon source, but totally eliminates the price of the sulfur:
PYROGRAF I11 MATERIAL COST COMPARISON
Control Control Methane Natural
0.194 source
11 carbon I 69.83 10.44 10.419 10.067 source
271

EXPERIMENTAL In this experiment, a reactor that normally uses a feedstock mixture of 99.9% pure methane was converted to enable use of coal as the hydrocarbon feedstock (Figure 3 ) . Helium is bubbled through liquid iron pentacarbonyl to provide Fe catalyst particles, and 99.3% pure H,S gas is simultaneously injected into the llOoo C reactor. A typical control formulation that produces a 25% yield is shown in Table I. A screw type apparatus was assembled to feed the coal and driven by a variable speed motor. It is similar to commercial equipment except the feed box is sealed from the air; otherwise, it may cause combustion as the coal enters the reactor. A carrier gas is used to transport the coal dust from the screw feed into the reactcr hot zone.
Two trials using coal are shown in Table 1. In Trial 1, the hypothesis is that sulfur-bearing coal can replace H,S as the source of sulfur in the reaction. Coal and methane were used as the hydrocarbon feedstock. The formulation was developed so that the sulfur content in the coal was equivalent (1.6 H,S/Fe[CO], molar ratio) to the sulfur in the l'control" formulation using methane and hydrogen sulfide. Ohio I 8 Coal from CONSOL Inc., at 4.71% total sulfur and 46.6% total carbon, was pulverized to less than 6 3 ~ ~ . Methane was the carrier gas at a rate calculated to maintain a similar 1.6 molar sulfurlcarbon ratio as the "control". It was assumed that all the sulfur in the coal was converted to hydrogen sulfide.
Trial 2 was to test the hypothesis that coal could serve as the only supply of the hydrocarbon and sulfur, and produce vapor grown carbon fiber. The pulverized coal was carried into the reactor with a non-hydrocarbon carrier (hydrogen). Upper Freeport Seam coal was obtained from Kaiser Engrs. with 2 . 5 % total sulfur and an estimated 65% carbon content. In this case without methane dilution, the molar sulfurlcatalyst ratio is 4 . 5 , which is considerably higher than the minimum 111 ratio for good filament formation.
RESULTS AND DISCUSSION Carbon yield is here defined as the fraction of fiber harvested to the total carbon introduced into the reaction from all hydrocarbon sources. In the "control", vapor grown carbon is routinely produced with a yield of 25% with a 2 % standard deviation. In Trial 1, with coal, methane, and no HIS, the carbon yield is 19%. The photomicrograph in Figure 6 shows very good growth and confirms that the sulfur contained in the coal plays an active role in the catalytic prozess, and can potentially replace the need for using H,S in the reaction.
The sulfur content in coal is well beyond the optimum amount for the formation of carbon fibers. Figure 6 , reproduced from one of our prior papers", shows SEM photomicrographs of carbon fiber produced with H,S/Fe(CO)S ratios of 0, 1.411 and 1711. The sparse fiber in the photo without sulfur clearly illustrates the need for sulfur. However, the photo at the very high 1711 ratio still produces very good carbon fiber; the fiber length is+shorter, and tends to be more jagged and the soot content increases. Nevertheless, this leads to the possibility that high sulfur coal in spite of its problems for other uses may be a unique asset for the production of acceptable vapor grown carbon fiber.
In Trial 2 , coal is the only source of both hydrocarbon and sulfur; a yield of 47% was obtained and a SEM photomicrograph is shown in Figure 5 . There is good, but shorter fiber formation with a fair amount of soot and perhaps some ash. From past experience, the high carbon yield is anticipated, for we know that at extremely high sulfur levels, only soot will be formed. Nevertheless, these results support the conclusion that the inherent carbon in coal is actively pyrolyzed to products which participate in the catalytic fiber nucleation and growth process.
/ I
I
272

Photomicrographs are the basic estimate of fiber formation. However, X-ray diffraction can estimate the graphitic ordering and is the crucial property for assuring the quality of the fiber's strength and conductivity. Samples from the trials were analyzed by X-ray diffraction; Table 2 shows that the fiber samples from coal Trials 1 and 2 have a graphitization index that is typical for low modulus commercial fiber.
In earlier trials that rely on introducing H2S into a pure methane feedstock at equivalent ratios with the catalyst, periodic analysis has been made of the exhaust. To date, sulfur has not been detected in the exhaust. This could be explained by the proposal'0 that the sulfur dissolves in such large amounts that it melts the iron catalyst and thus stays with the catalyst at the base of the fiber. HOW much sulfur can be dissolved as the sulfur increases is unknown; there is a limit where fiber is no longer formed. A packed column gas chromatograph (GC) with thermal conductivity detector was used to estimate the composition of the exhaust gases of a series of coal trials when the sulfur was running at 4 . 5 times the usual amount (Trial 2) and the presence of sulfur was not detected. This instrument does not have the sensitivity to measure nitrogen or sulfur compounds below about 0.1-1 percent. Gastec detection tubes capable of detecting sulfur dioxide concentrations of 0.25 ppm and above were also used and no SO, was detected. Future work is needed with a capillary column GC with dedicated nitrogen and sulfur detectors.
Nevertheless, the data does support the theory that the sulfur does unite with the catalyst during fiber formation and would eliminate or reduce the release of harmful sulfur compounds into the atmosphere. Future work should also address the sulfur content, if any, in the residual ash over a wide range of sulfur/catalyst ratios. Although further work is needed to assess the effects of the organic and ash content variation in coal, their presence does not prevent the growth of a carbon fiber with graphitic ordering. For some applications such as rubber reinforcement, it is possible that the sulfur content in the fiber may be uniquely desirable and enhance the bonding during the rubber vulcanization process.
While these studies indicate the viability of using high sulfur coal as the hydrocarbon feedstock in production of VGCF, in practice, the high percentage of sulfur in various coals, as well as the variability of the percentage of sulfur in coal, will most likely mandate a combination of hydrocarbon feedstocks in order to maintain the process balance needed for optimum production. The role of coal in contributing to the hydrocarbon balance, as well as the sulfur balance, has significant implications.
CONCLUSIONS It has been demonstrated that high sulfur coal can be used to make VGCF, contributing both carbon and sulfur to the reaction. This work suggests an ecologically safe process for utilization of high sulfur coal. If future trials continue to confirm these conclusions, the economic impact of coal on the price of carbon fiber will open new applications for carbon fiber in rubber reinforcements, cement, composites for automobiles, electronics, and aerospace components.
ACKNOWLEDGEMENT This research was supported in part by the Ohio Coal Development Office/Ohio Department of Development under Grant Number CDO/R-922-8. The authors also gratefully acknowledge the contribution of Dr. Gary Tibbetts, General Motors NAo Research & Development, for his assistance and pioneering work that has made vapor grown carbon fibers a commercial reality, Dr. David Anderson from the University of Dayton Research Institute in providing X-ray analysis, and much assistance from the OCDO staff in performance of this work.
213

REPEBENCEB 1. C. Petersen, ADVANCED COMPOBITEB, March/April 1994, pp 20. 2. CARBON LINES Vol. 4, No. 1, March 1993, Newsletter by Huber engineered Carbons Division. 3. G.G. Tibbetts, carbon 30, 399 (1992). 4. J.L. Kaae, Carbon a, 665 (1985). 5. M. Endo and T. Koyama, Japanese patent 1983-180615, Oct 22 (1983). 6. Y. Komatsu and J. Endo, Japanese patent 60-32818, Feb 22 (1985) . 7. K. Arakawa, U.S. Patent 4,572,813, Feb. 25 (1986). 8. H.F. Kauffman and D.J. Griffiths, U. S. patent 2,796,331, June 18 (1957). 9. G.G. Tibbetts, D.W. Gorkiewicz, and R.L. Alig, CAFlBON 31, aG9 (1993). 10. G. G. Tibbetts, C. A. Bernardo, D. W. Gorkiewicz, and R. L. Alig, "Effect of Sulfur on the Production of Carbon Fibers in the Vapor Phase" CARBON, 2, no. 4, pp. 569-576, (1994).
TABLE 1. TRIAL FORMULATIONS' ....................................................... METHANE
CONTROL 96.90
COAL NONE SULFUR 0.47 HYDROGEN NONE HELIUM 0.96 Fe ( ~ 0 ) s 1.68
TRIAL 1 87.58
TRIAL 7, NONE
9.33 80.68 0.44 2.02 NONE 13.30 0.96 1.45 1.69 2.55
* Formulations are in per cent by weight
TABLE 2. X-RAY DIFFRACTION ANALYSIS
*& = (0.3340 - DSping)/(0.3440 - 0.3354)
2 1 4

Fiber Nucleation and Growth Model Hydrocarbon Diffusion and
Metal Catalyst Pyrolysis Fiber Growth
\ Fibe
Figure 1. Fiber Nucleation and Growth Model
Carbon Fiber Process \
Catalyst I Exhaust
C
/ Ceramic Tube
n
Figure 2. Carbon Fiber Processing
COMMERCIAL CARBON FIBER
Figure 3. Scanning Electron Micrographs Comparing Vapor Grown Carbon Fiber with Commercial Carbon Fiber
215

Tensile Modulus, Msi
0 15 29 44 58 73 87 102 116 131 8 1160
7 -
6 -
a 0 5 -
K E 4 -
0 T-1000 a VCCF(HT1 - 1015
- 870
- 725 0 T-800
s - 580 c1 E:L!CO:: C*XCiDi,'L
'y ARAMID
e Carbon 0 Ceramic 8 Hybrid v Organic . Metal a Vapor Grown
Carbon Fiber
276

THE PREPARATION OF FINE CARBIDE POWDERS FROM COAL SOLUTIONS
David, L. Morgan, Vladimir Cukan and Sara N. Prins Division of Materials Science and Technology, CSIR
P 0 Box 395, 0001 Pretoria, South Africa.
Keywords: silicon carbide, coal solution, sol-gel.
INTRODUCTION Non-oxide ceramics, such as silicon carbide [ l l , find use in applications requiring extreme hardness, chemical inertness and high-temperature strength. Transition metal carbides, such as tungsten carbides cemented with cobalt or nickel, are used extensively as wear components. Articles are generally fabricated by sintering pressed powder bodies at high temperatures. To maximise strength and hardness of the ceramic bodies, fine powders below 1 micron in size are needed together with small additions of sintering aids. Boron carbide plus carbon are used as sintering aids for silicon carbide. Very uniform dispersion of the sinter aid or binder metal with the carbide powder is necessary. This is achieved by milling the components together, often for many hours. The carbides are generally prepared
The low reactivity of particulate carbon means that high temperatures have to be used with extensive milling being required to reduce the particles to a suitable size. The end result of these requirements is that sinterable powders are expensive.
Fine oxide ceramic powders with very uniformly dispersed additives are prepared by the sol-gel process where the components are mixed as solutions or sols and the mixture then gelled [21. The solvent is removed and the ceramic converted at relatively low temperature to fine, easily-sinterable powder. It would be very desirable to be able to extend those ideas to the preparation of fine carbide powders by bringing a carbon source into very intimate contact with an oxide followed by carbothermal reaction to the carbide e.g.:
' by reacting the metal or oxide together with carbon.
SiO, + 3C-Sic + 2CO
However no low-cost carbon source has been readily available. Carbohydrates have been used in solution with colloidal silica sols but non-uniform drying could be expected (31. Polycarbosilanes andsilanes may be converted to silicon carbide but are very expensive [41. Most organic polymers pyrolise to carbon, but generally in low yield.
Coal solutions may be used as an effective and inexpensive source of carbon for the sol-gel preparation of silicon carbide. The coal molecules may also be brought into very intimate contact with the oxide by co-precipitating coal from solution together with an oxide gel under conditions of high shear. This approach is more general as maintaining both coal and metal oxide sol in solution together prior to gelling is not a simple matter. Absorbing coal molecules into a high surface,area oxide is also effective. The coal is immobilised by gelling prior to solvent recoven/.
We have prepared silicon carbide from coal solution by each of these three approaches [51. The products from the co-gel and co-precipitation routes were both fine powders, with a very small content of fibrous whiskers whilst that prepared by the mixing route was predominantly fibrous in nature.
X-ray diffraction measurements showed that in all cases the silicon carbide was in the /3-form, as would be expected from the low conversion temperature.
COAL SOLUTION The coal solution was prepared by alkali-induced solubilisation of a medium-volatile bituminous coal in dimethylformamide (DMFI [6,71. Over 90% of the organic part of suitable coals dissolve in DMF on addition of 10% (based on coal) of sodium or potassium hydroxide. The conditions for extraction are mild-atmospheric pressure,

temperature of 90°C but strict exclusion of oxygen. The mineral components are removed by centrifugation and filtration giving a purified solution of "refcoal". The refcoal solutions used for carbide preparation had typically a concentration of 8% coalderived material.
Refcoal solution gels on addition of 5% water or sufficient acid to neutralist? the alkali present, giving a soft gel strong enough for a cylinder 2cm x 6cm high to be self-supporting.
The refcoal after removal of solvent contained less than 0,2% ash and gave 75% yield of carbon on pyrolysis at 1000°C.
EXPERIMENTAL The coai used was a flotation concentrate, with essentially all particles being smaller than 0,85 mm. The analysis is given in the Table.
PREPARATION OF COAL SOLUTION Coal (5,O kg), DMF (50 kg) and sodium hydroxide pearls (0,5 kg) were stirred together under nitrogen at 90°C for 5 hours. The minerals and undissolved coal were removed by settling followed by filtration through polypropylene filter cloth. The clarified solution contained 8.0% dissolved coal material. The viscosity was 2.9 CP at 30°C.
PREPARATION OF SILICON CARBIDE BY SOL-GEL ROUTE A silica sol was prepared by mixing ethyl silicate (40% SiO,, 7,5 kg) in DMF (3.5 kg) with 1 % HCI solution in water (1,33 kg). The mixture warmed and became homogeneous over 60 minutes.
The silica sol was cooled to below 5°C and rapidly mixed (within 5 seconds) with coal solution (50 kg), also cooled to below 5°C. The mixture thickened and then gelled. The gel was broken up and the solvent removed under reduced pressure at 95OC to give a coarse powder which was pressed into briquettes (p. 8 g mass) under high pressure. The briquettes were pyrolised at 900"Cfor 3 hours and then converted to silicon carbide by heating to 1 500"Cfor 7 hours in a stream of argon (1 5 Ilmin). After cooling under argon the briquettes were crushed to smaller than 1 mm and excess carbon burned off at 700°C for 5 hours in a muffle furnace. Measurement of free silica showed 99,596 conversion although this may represent some re-oxidation during carbon burnoff. Sodium salts arising from the alkali present in the coal solution were removed with a dilute acid wash and the product was dried.
The silicon carbide was a fine grey powder. Size analysis gave a median particle size of 1,5 micron. SEM examination showed that the particles were made up of agglomerates of submicron particles. Whisker-like particles were virtually absent - a few could be found on active searching.
PREPARATION OF SILICON CARBIDE BY CO-PRECIPITATION ROUTE Sodium silicate solution (300 ml, containing 18,O g SiO, and 5,45 g Na,O), sulphuric acid (48 ml. containing 8,5 g H,SO,) and coal solution (300 ml) were pumped separately but simultaneously over 5 minutes using peristaltic pumps into a reactor (30 ml) fitted with a high-shear mixer. The overflow of gelatinous co- precipitate was collected and recirculated through the high-shear mixer for 30 minutes at 100 ml/min.
The co-precipitate was dried and sodium sulphate removed by washing with water. The precursor powder was briquetted under pressure and converted to silicon carbide by heating to 1450"Cfor 6 hours under flowing argon. Conversion of silica was complete. Excess carbon was burned off at 700°C for 5 hours.
The silicon carbide was a fine grey powder with a median particle size of 3,5-5 micron. SEM examination showed that the particles were made up of agglomerates of submicron particles. Few whiskers were seen but there were
278

more than were present in the co-gelled product.
PREPARATION OF SILICON CARBIDE BY MIXING ROUTE The precipitated silica used was Crosfield Neosyl GP, containing 88% 30, and with a typical BET surface area of 200 mZ/g. Precipitated silica (20,5 g, containing 18 g SiO,) was mixed with coal solution (300 ml). Water (15 ml) was added to gel the coal solution. The solvent was removed to give a precursor which was converted to silicon carbide as above. The conversion of silica was total.
The silicon carbide after excess carbon burnoff formed a felt of fibrous material. SEM examination showed that the great bulk of the product was fibrous with some interspersed amorphous material.
DISCUSSION The fineness and freedom from fibrous material of the silicon carbide prepared by the three different approaches from coal solution is clearly affected by the degree of inter-dispersion of the refcoal with the silica. The sol-gel route would be expected to give the highest inter-dispersion of carbon and silica as the components had been mixed together in solution prior to gelling. The mixed precursor might be expected to have the poorest inter-dispersion with the co- precipitated precursor in between. The properties of the silicon carbide prepared from co-precipitated precursor were very similar to that prepared from the co-gel material which suggests that the inter-dispersion was also similar. This augurs well for successfully extending the co-precipitation route to the preparation of other carbides, because control of this method is simpler than that of co-gelling coal solutions with oxide sols. Clearly the properties of the silicon carbide prepared by the co-gel route are better than those of co-precipitate material. However the cost of silica from sodium silicate is very much less than that from ethyl silicate so that our further efforts are being concentrated on optimising the co-precipitation route, and on the introduction of homogeneously dispersed sintering aids.
ACKNOWLEDGEMENTS The authors wish to thank the CSlR and the South African Department of Mineral and Energy Affairs, through the National Energy Council, for funding this work. Patents arising from the Project are held by Enerkom (Pty Ltd.
Technical assistance by Alpheus Bokaba, Tom Hardenberg and Samuel Sibanda is gratefully acknowledged.
REFERENCES . 1.
2. 3.
4. 5. D.L. Morgan and V. Cukan S.A. Patent No. 93/5725. 6. 7. D.L. Morgan US Patent No. 5 120 430.
TABLE: COAL ANALYSIS
Moisture 0,7% Ash 10,8 Vol. Mat. 22,6 Fixed carbon 65,9
DAF carbon 90,5 hydrogen 5.4 nitrogen 1,9
Y. Somiya and S. lnomata (eds.): Silicon Carbide Ceramics vols 1 and 2. Elsevier Science Publishers Ltd., London (1 991). L.L. Hench and J.K. West Chem. Rev, 1990 90 33. A. Jubbe, A. Larbot, C. Guizard, L. Lot, J. Charpin and P. Bergez, Mat. Res. Bull. 1990 25 601, R.M. Laine and F. Babonneau Chem. Mater. 1993 5 260.
D.L. Morgan Preprints ACS Div. Fuel. Chem. 1992 37/4) 1996.
279

ACTIVATED CARBONS FROM NORTH DAKOTA LIGNITE AND LEONARDITE
Brian C. Young, Edwin S. Olson, Curtis L. Knudson, and Ronald C. Timpe University of North Dakota Energy & Environmental Research Center (EERC)
Grand Forks, ND 58202
KEYWORDS Leonardite activated carbons
INTRODUCTION
The EERC is undertaking a research and development program on carbon development, pe*t of d i c h is directed towards investigating the key parameters in the preparation of activated carbons from low- rank coals indigenous to North Dakota. Carbons have been prepared and characterized for potential sorption applications in flue gas and waste liquid streams.
Lignite, owing to its wide occurrence and variability in properties, has received significant attention as a precursor of active carbon manufacture. Mineral matter content and its alkaline nature are two highly variable properties that can have important consequences on the production of suitable activated carbons. Other factors affecting the production include carbonizing conditions, the activation agents, activation temperature, and activation time (1, 2). However, as previously noted, the relationship between the above fadors and the sorption activity is particularly camplex (2). Part of the difficulty is that sorption activity encompasses at least three parameters, namely, surface area, pore distribution, and surface acidityhasicity. The presence of mineral matter in the mal can afTect not only carbonization but also the activation and subsequent sorption and desorption processes.
Lignite-based activated carbons typically have a low micropore volume, some 17% of the pores being micropores versus 35%-50% macropores (3). The macropores contribute little to the surface area and hence have a small impact on the adsorption process. Samaras, Diamadopulos, and Sakellaropoulos (4) have recently shown that the removal of mineral matter improves the micropore volume of activated carbons since the mineral matter catalyzes the pyrolysis and carbonization reactions, leading to an enlargement of the pores. Several inorganic species, such as Fe, K, Mg, Ca, and Na are likely gasification catalysts, but the mechanism is not well understood. Removal of mineral matter from lignites decreases the reactivity of the chars towards carbon dioxide and oxygen (5) and produces random changes in the surface area as a result of structural changes (6).
As well as surface area and Surface heterogeneity, the presence and structure of particular oxygen Surface groups are also important for the adsorption of specific gases or vapors (7, 8). Basic oxygen groups with a pyronic structure, for instance, favor the adsorption of sulfur dioxide (9). Furthermore, Davini (10) has recently demonstrated that carbons containing a significant mineral matter content, particularly if an appreciable amount of iron is present, and an enhanced content of acidic oxygen groups have reduced capacity for SO, sorption.
This paper reports recent results of an investigation of demineralization, carbonization temperature, activation temperature, and activation time for one lignite and one leonardite from North Dakota. The majority of the work has been carried out with leonardite. This work is developing further data and understanding on leonardite char adsorbents reported earlier in a patent by Knudson (11).
EXPERIMENTAL
The feedstocks included a Beulah-Zap lignite and a Georesources leonardite. The coals were crushed, ground, and sieved in the usual manner to recover the -10 x 30- or -12 x 30-mesh fraction for testing. The coal analyses (thermogravimetric [TGA] and proximate) are shown in Table 1. The composition of the mineral matter of the leonardite by x-ray fluorescence was also determined.
Two reactors were used to produce the chars, a large capacity (100 grams) TGA unit and a nominally 12-kg capacity Cress kiln (model X31TC). The latter has a bottom distributor plate through which gas, preheated by the kiln, enters to permeate the bed. The chars were activated in the TGA unit or a Lindbergh Type 59344 furnace (TF) incorporating a 19-inch-long by 1-inch-diameter Vycor tube,
A representative sample of the leonardite containing a high mineral matter content was physically and chemically cleaned. Physical cleaning involved float-sink with Certi-grav and using the 1.4 and 1.6 float fractions. Both hydrochloric and hydrofluoric acids were used for chemical cleaning.
The initial carbonization conditions were as follows:
1. TGA unit - Approximately 50 g of feed was carbonized at 700°C to 850°C under N, for up
2. Kiln vessel - Approximately 12 kg of feed was at 480°C under N, for 1 hour. Subsequently,
Table 2 lists the conditions for activating the leonardite carbonized at 480°C in the kiln. Once the optimum activation temperature was established, the optimum activation time was determined by repeating the test conditions. Table 3 shows the variables used in optimizing the conditions for sorbent preparation from the leonardite. Beulah lignite was activated at 750°C for 20 minutes under 20% steam in nitrogen.
to 1 hour followed by steam activation at the same temperature for up to 1 hour.
the leonardite was carbonized a t different temperatures (see below).
280
I
I
/
I

TABLE 1 Coal and Char Proximate Analyses
Coal Carbonization Activation wt%, ar' wt%, mf' wt%, mf wt%, mf
G O * NA** NA 32.6 44.1 27.6 28.3 Temp., "C Temp., "C Moisture Volatile8 Fixed C Ash
Geo-1.6 Float NA NA 22.3 38.4 51.7 9.9 &o-1.4 Float NA NA 42.9 51.2 41.8 7.0 Beulah NA NA 31.8 43.9 49.9 6.2 G e O 480 NA 5.3 32.8 47.2 20.0 G e O 480 700 1.1 8.7 52.6 38.6 G e O 480 750 1.1 8.4 53.6 38.0 G e O 480 800 0.9 7.0 57.6 35.5 Beulah 750 750 1.6 6.6 79.7 13.7
+ &-received.
* Georesources leonardite. ** Not applicable.
Moisture-free. ++
TABLE 2 Test Conditions for Activating Georesources Leonardite Char Carbonized
at 480°C in the Kiln Reactor* Test No. Samnle Size. e Reador TemDerature.OC
2 10 3 10 4 10 5 50 6 50 7 50 8 50
I TGA TGA TGA TF TF TF TF
750 800 850 800 850 900 950
9 50 TF 1000 * All samples were activated in 20% steam in nitrogen for 10 minutes.
TABLE 3 Test Conditions for Optimizing Char Sorbent Preparation
Variable Condition Activation Time under Steam Coal Cleaning Prior to Charring Carbonization Temp. 350, 480, 550°C
Carbonization Temp. 350,480, 550°C Activation Temp. 750°C Activation Gas Steam, steamlo, Gas-Char Contact Time
0, 10, 20. 40, 60 minutes 1.4, 1.6 Float; HCI, HCVHF leach
10, 20, 20 (steamY5 (0,) minutes
The activating agent was steam in nitrogen, with an approximate concentration range of 20% v/v. In one case, the leonardite char was activated with steam for 20 minutes followed by 3.5% v/v oxygen in nitrogen for an additional 5 minutes.
The activated carbons were characterized by TGA proximate analysis, SO2 sorption in a r p n at ambient temperature and at lOO"C, iodine number, surface area, and pore volume analysis.
RESULTS AND DISCUSSION
Demineralization of the leonardite reduced the mineral matter to 6.8 wt% on a moisture-free basis with HCI and to 0.4 wt% moisture-free with HF. The proximate analyses of the raw, cleaned, and carbonized leonardite, as a function of carbonization and activation temperatures, are shown in Table 1 along with proximate analysis data for the carbonized lignite. Overall ash levels remain approximately constant with activation temperature for the uncleaned leonardite carbonized at 480°C and steam activated at temperatures of 700°C and above. As expected, volatile matter demeases with increasing activation temperature.
X-ray fluorescence analysis of the leonardite ash revealed that silicon, aluminum, and calcium are the major mmponents, making up around 72 wt% on an oxygen-free basis, but the total weight of these four elements in the leonardite is 10.6 wt% 88 a consequence of the significantly high mineral matter
281

content (28.3 wtk) of the feedstock. The presence of calcium may be detrimental in the activation process for achieving microporosity but could be beneficial for assisting in the capture of SO,.
A limited aet of experiments was carried out on the lignite sample. Sorption tests with SO, at 100°C and 5000 ppm resulted in a small uptake, 2.4 wt% (g SOJlOO g char) with fine carbon and 1.9 w t l with carbon pelleta containing a binder, the carbons being produced in the TGA unit. Desorption at 1OO'C yielded a 0.2 and 0.4 wt% change, respectively, for the different samples, whereas desorption between 100' and 400°C yielded 1.0 and 0.9 wt% respectively.
Differences in sorption activity of produets from the TGA and tube furnace reactor were seen in the case of the Georesources leonardite. Here the sorption activity was examined as a function of steam activation temperature for leonardite char carbonized at 480'C. Figures 1 and 2 show the SO, sorption data for ambient and 100°C conditions, respectively. The dependence of sorption activity on reactor type is less marked a t the hizhher sorption temparature where the sorption capacity of the tube furnace product approached that of the TGA produd. Reactor conditions would seem to affect significantly the resultant sorption activity where mass flow fields are appreciably different. The maximum sorption activity at ambient temperature and 1OO'C appears to occur for char activated between 750' and 800°C (6.1 and 6.8 wt% SO,, respectively, at ambient temperature). However, the sorption activity is about one-third lower at 1OO'C (2.3 and 2.4 wt% SO,, respectively,) than that at ambient temperature.
Owing to the similarity between the trends in Figures 1 and 2, i t is feasible to plot the ratio of the two sorption values at the two sorption temperatures against activation temperature, as illustrated in Figure 3. The observed linear relationship leads to the following expression:
%,,SO, = 2.79 x %,,.,SO,
Differences between the sorption activity at the two temperatures can be explained by the weakness of the physisorption bonding (Van der Waals) and the decline in relative strength between the Van der Waal's bond and the increasing vibrational component of the bond energy with increasing thermal energy.
The iodine number provides an alternative measure of sorption activity, the results of which are depicted in Figure 4 for the range of activation temperatures examined. Here i t is seen more sharply that the optimum activation temperature for uncleaned leonardite char produced a t 480°C is 750' to 800'C, corresponding to the SO, sorption results at 1OO'C (see Figure 2). However, the maximum iodine number of 460 mg IJg char (590 mg I2/g C) is at the lower end of the range of that reported (600 to 1450 mg IJg C) for a commercial carbon.
Preliminary investigations on optimizing the carbonization and activation of leonardite (uncleaned) show that the maximum sorption activity as measured by SO, (5000 and 10,000 ppm in argon at 1OO'C) to be as follows: carbonizing temperature: 350"C, activation temperature: 750'C, activation time: 20 minutes. The resulta are shown in Figure 5. Subsequent activation with 3.5% vlv oxygen in nitrogen for an additional 5 minutes reduced the sorption by approximately 17%. This result is presumably due to a lowering of the microporosity as a result of increased burnoff.
Improvements in sorption activity of leonardite were found through physical cleaning. Carbonizing the 1.4 and 1.6 Certi-grav float-sink fractions (10.9 and 7.8 wt% ash, respectively) at48O0C, activation temperature of 750"C, and activation time of 20 minutes yielded 10.9 and 10.1 wt% SO,, respectively, a t 10.000 ppm SO, in argon at ambient temperature. The uncleaned leonardite yielded about 20% less SO, sorption (8.4 wt%).
Chemical cleaning of leonardite did not lead to successful sorption of SO, since both the HC1 and HF severely modified the carbon matrix by removing the bridging divalent ions. The remaining gel-like carbonaceous material aRer carbonizing and activation yielded sorption data that were comparable to that determined for the carbons derived from the uncleaned leonardite. The behavior of acid- washed leonardite is significantly different from that of acid-washed lignite, as determined from our study of chemically cleaned lignite.
The surface areas, determined by N, multipoint BET, for the uncleaned and physically cleaned (1.6 float-sink) leonardite char, both steam-activated at 750°C for 20 minutes, were 81.6 m2/g and 90.0 m2/g, respectively. Although physical cleaning enhances the surface area slightly, nonetheless, gasification of leonardite char appears to affect the development of the surface area significantly.
CONCLUSIONS
Enhanced sorption activity towards SO, was obtained with physically cleaned leonardite (< 7 w t l aah) activated carbon. The conditions for its production were as follows: carbonization temperature: 480"C, activation temperature: 750"C, activation time with steam: 20 minutes. The best sorption activity determined was 10.9 wt% SO, with 10,000 ppm SO, in a n argon stream. The surface area of the physically cleaned leonardite was 90.0 mVg. Optimization of these conditions is expected to enhance the adsorptivity of the char significantly.
282
I

7.0
6.5
6.0
5.5
5.0
4.5
4.0 50
-
-
-
-
-
-
Figure 1. Dependence on activation temperature of SO, adsorption from flowing gaa containing 5000 ppm SO, in argon at ambient temperature for Georesources leonardite (480°C) char.
2.5 - 2.4 - 2.3 - 2.2 - 2.1 - 2.0 - 1.9 . 1.8 ,
1.7 . 1.6
1.5
1.4 1 650 700 750 800 850 900 950 lo00 1
Steam Activation Temperature, "C
50
Figure 2. Dependence on activation temperature of leonardite SO, adsorption from 5000 ppm SO, in argon at 100°C for leonardite (480'C) char.
I . 4 t Y 8 1 TGA
0 l L - - 650 700 750 800 850 900 950 1000 1
Steam Activation Temperature, "C Slope = 0.0012PC
Figure 3. Ratio of SO, sorption capacity at ambient temperature to sorption capacity at 100°C for leonardite (480°C) char versus steam activation temperature.
283

460
440-
420
400-
380
360
340
300 320 650 1 700 750 800 850 800 850 1000 1(
Steam Activation Temperature, "C
-
-
- - -
0
Figure 4. Sorptive capacity for I, of uncleaned leonardite (480°C) char steam activated at increasing temperatures.
EERCBF11MO W R 10
Carbonaation Temp =55(PC Cirbonmtion Temp = W C
2
0 8
2 0 0
0 6 v) 0
& 4 e P ' 0 2 5
0 Steam for Steam for Steam for
10 min 20 min 20 minl0, for 5 min Activation Atmosphere and time, min
20% v/v steam in nitrogen 3.5% v/v O2 in nitrogen
Figure 5. Effect of carbonization temperature and activation gas on SO, (10,000 ppm) adsorption at ambient temperature for leonardite chars.
REFERENCES
1. Wilson, J. Fuel 1981, 60, 823. 2. Samaras, P.; Diamadopoulos, E.; Sakellaropoulos, G.P. Carbon 1981.29, 1181. 3. Baneal, R.C.; Donnet, J.-B.; Stoeckli, F. Actiue Carbon; Marcel Dekker: New York, 1988; p ix. 4. Samaras, P.; Diamadopoulos, E.; Sakellaropoulos, G.P. Carbon 1994.32, 771. 5. Fernandez-Morales, I.; Lopez-Ganon, F.J.; Lopez-Peinado, A,; Moreno-Castilla, C.;
Rivera-Utrilla, J. Fuel 1985, 64, 666. 6. Serio, M.A.; Solomon, P.R.; Bassilakis, R. In Proceedings of the International Conference on Coal
Science; Tokyo, Oct. 1989, pp 341-344. 7. King, A.J. Chemical Society 1937, 1489. 8. Boehm, H.P.; Heck, W.; Sappok, R. Angewandte Chemie 1964, 76,742. 9. Voll, M.; Boehm. H.P. Carbon 1971, 9,481. 10. Davini, P. Carbon 1993, 31, 47. 11. Knudson, C.L. "Leonardite Char Adsorbents," US. Patent No. 5 254 521, Oct. 19, 1993.
ACKNOWLEDGMENTS
The authors express their thanks to Mark Musich and Ron Kulas, both at the EERC, for their assistance in preparing the coals and chars and testing the carbons and to Georesources Inc. for supplying the leonardite. The authors also wish to extend gratitude to the US. Department of Energy Mowantown Energy Technology Center (METC) for financial support for this project.
.
284

PRODUCTION OF CHARCOAL AND ACTIVATED CARBON AT ELEVATED PRESSURE I Xiangfeng Dai, Niclas Norberg and Michael J. Antal, Jr.,
Hawaii Natural Energy Institute and the Department of Mechanical Engineering, University of Hawaii at Manoa, Honolulu, HI 96822
Keywords: Biomass, Charcoal, Activated carbon
INTRODUCTION With its wide range of properties, charcoal finds many commercial applications for
domestic cooking, refining of metals (steel, copper, bronze, nickel, aluminum and electro-
\ L
I manganese), production of chemicals (carbon disulfide, calcium carbide, silicon carbide, sodium
I cyanide, carbon black, fireworks, gaseous chemicals, absorbents, soil conditioners and pharmaceuticals), as well as production of activated carbon and synthesis gas. In 1991, the world production of charcoal was 22.8 million cubic meters (3.8 million metric tons) (FAO, 1992) as shown in Table 1. Brazil is the world's largest charcoal producer-5.9 million cubic meters or one million metric tons was produced in 1991, most of which is used in steel and iron industry (Calk et al, 1992). African countries produced 45% of the world total amount of charcoal, where 86% of the. wood-based energy is for domestic use O(hristova et al., 1993). most of which is inefficiently used, Charcoal is produced commercially in kilns with a 25% to 30% yield by mass on a 7 to 12 day operating cycle. Until recently, the highest yield of good quality charcoal reported in the literature was 38%.
Activated carbon has a wide range of applications, mostly as a purifying agent to remove trace quantities of undesirable species from gas or liquid phase, also as an economical media to recover materials. Some of the common applications are listed as follows: food industry, pharmaceutical industry, water purification, gas or air treatment, chemicals, oil refinery processing. Special applications of activated carbon are found in agriculture, as catalyst and catalyst support in chemical industry, for precious metal recovery and making batteries and military clothing, and in nuclear power stations. The consumption of activated carbon in industrialized countries in 1988 was 300,000 tons (Roskill, 1990), which was the majority of the world total.. The United States and Japan account for 60% of this consumption---130,000 tons for U.S. and 50,000 tons for Japan. The yield of activated carbon produced commercially is low (typically 10% to 12%) from raw material.
In this paper, an ASh4E code rated experimental system is presented for producing charcoal and activated carbon from biomass feedstock. Very high yield of high quality charcod is obtained in short cooking time, while very low yield of tar is found in the process from this system.
EXPERIMENTAL. Six biomass species were employed in this work, namely, Eucalyptus, Kiawe, Leucaena,
Coconut husk, Macadamia nut shells and Kukui nut shells. AI1 these feedstocks were air dried, the moisture contents of which are listed in Table 2. Macadamia nut shells and Kukui nut shells retained their original sizes of about 25 mm in diameter in hemispheric shape when being fed into the reactor. The other feedstocks were cut into small pieces (about 60 mm X 25 mm X 25 mm) in order to fit the feeding port of the reactor.
The experimental apparatus is schematically shown in Fig. 1. The reactor is made of 168 mm diameter X 1200 mm long steel pipe welded with flanges on both ends. A 114 mm diameter stainless steel canister is used to load feedstocks and to unload the reaction products, The available volume of the canister is 7.5 liters (2 gallons). The internal heating source consists of two 4 kW electric heaters, which are mounted on the bottom flange of the reactor. The heaters are controlled by a temperature controller. The Watt-hour meter is used to measure the power consumption. A back pressure regulator controls the reactor pressure. Thermocouples are placed in the center line of the reactor for measuring the temperature profile of the biomass bed. The effluents are flared in an exhaust line. For production of activated carbon by a thermal activation process, a steam and air mixture is used. The steam generator is built to provide a maximum steam flow of 3 kg/hr at 5.4 MPa pressure. Air is provided by an air tank with flow rate of 4 kg/hr. The whole system is ASME code rated---a "State Special" unit, which is operated with permission of the Hawaii State Boiler Inspector,
Feedstock is manually fed into the reactor. The experiment terminates when temperature or pressure remains stable or after a second temperature rise is observed. The heating time is about 3 hours from cold start. A tar converter is placed at the exit port. Charcoal and feedstock are analyzed according to ASTM standards by Huffman Laboratory, INC. The heat contents of Kukui nut shells and %awe are assumed 22 MJk& which are conservatively estimated according to data of Macadamia nut shells and of Redwood (heanwood), respectively. The heat content of Eucalyptus (Grandis) is obtained using the following equation (Graboski et al., 1981):
\
I I
I
HHV=2.3236[(141C+615H-10.2N+39.95S)-(1-ASH)(I7244WC)+149] (Wkg)
285

where HHV is the higher heating value on a dry basis, and C, H, N, S, ASH are the weight percent of carbon, hydrogen, nitrogen, sulhr and ash in the sample. Gas samples are analyzed using a gas chromatograph equipped with flame ionization and thermal conductivity detectors.
RESULTS AND DISCUSSIONS The mass yield of charcoal is the ratio of dry charcoal to dry feedstock by mass. In Table 2
are shown the experimental results for mass yields of charcoal. AU these species give very high mass yield---from 42% to, 65%. The nut shells have higher mass yield than these wood species probably due to their higher fixed carbon content. For example, Macadamia nut shells has 23.7% fixed carbon content, while Eucalyptus (Grandis) 16.9% (Jenkins, 1989). Nevertheless, the mass yields of charcoal from these feedstocks are much higher than that produced from commercial kilns.
The energy yield, the ratio of heat conteEt of dry charcoai to that of dry feed, is another indicaticr. s f ihuwai conversion. In Table 2 are also listed the energy yields of these charcoals. All of these give very high energy yield ranging from at least 64% to more than 88%.
The results of charcoal analysis are shown in Table 3. Samples for analysis are obtained from two extreme positions inside the reactor. Therefore, two sets of data are listed in the table. Generally speaking, charcoal closer to the heaters has higher fixed carbon (FC) content and higher heat content. Most of the charcoals have FC content and heating value lower than or close to British standard. However, after looking at the data tiom the previous work @ai, 1993) which have higher FC content and heating value as well as very high mass yield, we conclude that the quality of these charcoals can be improved by a somewhat higher temperature cook. (This work is now in progress.) Moreover, Macadamia nut shell charcoal has FC content close to and heating value higher than British standard. Nevertheless, all these charcoals have higher FC content and higher heat content than commercial briquette charcoal, which implies that they are suitable for domestic cooking and their precursors are suitable raw materials for charcoal production.
Charcoal density is low due to its high porosity, which implies that charcoal is reactive and good for hrther pore development by activation process to make activated carbon. The bulk densities of charcoal are in the range of 45% to 65% of their raw materials. The bulk densities of Macadamia nut shells and Kukui nut shells are about 470 k g h 3 and 5 10 kdm3, respectively. The shells sink in water.
From the temperature profiles in these experiments, it is found that under the reaction conditions, hemicellulose exothermicity occurs at about 275°C and cellulose exothermicity at about 350°C.
The result of gas analysis shows that the main gas species are H20, CO, COz, H2 and CH,. Other hydrocarbons are negligible. The typical molar ratio of CHq, CO and C02 to H2 is 1.7, 1.7 and 4.9.
Tar yield is very low, which reflects success of the reactor design and the tar converter. This also contributes to the high yield of charcoal.
Unfortunately, activated carbon production is now in process, and no information is available at this time.
CONCLUSION Charcoal with very high yields of 42% to 65% has been produced from six biomass
species in the newly built ASME code rated charcoal reactor. The nature ?f the feedstocks a f f . the yield and quality of charcoal significantly---the nut shells give higher yield and heat content of charcoal than wood species. Very low yield of tar is obtained in the process. Further work is now in progress to improve the uniformity of charcoal throughout the bed and to improve the quality of charcoal in terms of FC content and heating value while keeping mass yield still high,
REFERENCES Calle, F. R . ,Fudo , P., Hall, D.O. “Brazil charcoal: a case study for sustainable production and
Dai, X. ”Charcoal production and gasification under pressure”. MS thesis, May, 1993. Food and Agriculture Organization of the United Nation, FA0 Quarterly Bulletin of Statistics.,
Jenkins, B. M. “Physical properties of biomass”. Biomass hadbook. 1989. Khristova, P., Vergnet, L. “Evaluation of usher wood and karkadeh stem for charcoal in Sudan”.
Paddon, A. “Review of the available data concerning the amount of charcoal and helwood in
Graboski, M., Bain, R. ”Properties of biomass relevant to gasification“. Biomuss gasi$cuiion
Roskill Information Services, Ltd. “The economics ofactivated carbon 1900”. PTsResemch
use”. Biomass Users Nefwork. July-Aug., 1992.
Vol. 5, No. 4 1992.
BiomassondBioemrgv. Vol. 4, N0.6, 455-459, 1993.
Sudan”. Field Project Document No. 22. FAO, Khartoum, 1987.
principle and fechnology. Ed.: Reed, T. B., 1981.
Sfudies. 1-180. Aug. 9, 1990. ’
286

Table 1: The world annual production ofcharcoaifor 1980 and 1991 (1000 cubic meter)
region , 1980 1991 world 17117 22784 AtXca 6883 10453
N.& C. America 821 904 S. America 6170 7480
Brazil 4779 5924
Table 2. Charcoal yields
Species Mass yield Energy yield Feed moisture (W (%I content(%)
Eucalyptus 46 67 15.7 Kiawe 53 %4 10.0
Leucaena 42' 66' 1.5' Macadamia nut 51; 42' 76; 65' 13.5; 7.20*
Kukui nut shells 65; 62* >84; >88* 12.1; 12.5' shells
Coconut husk 50 66 88.1 'data from the previous work @ai, 1993).
Table 3. Charcoal evaluation 1 I Species . Fixed carbon Volatile matter Ash HHV 1
W) W) W/kg)
I Leucaena 67.6' 30.0' 2.34' 28.51'
Eucalyptus 53.1; 67.5 42.2; 30.9 4.66; 1.59 22.60; 28.62 Kiawe 57.4; 60.1 41.6; 30.9 0.95; 0.94 27.1 1; 26.08
Macadamia nut 68.9; 72.0 30.4; 27.1 0.74; 0.81 31.11; 31.74 shells 89.4' 9.37' 1.22' 32.43,
Kukui nut shells 52.3; 67.3 44.1; 29.2 3.55; 3.42 26.88; 29.71
Coconut husk 56.7; 62.8 39.7; 26.7 3.63; 10.6 24.37; 26.18 Commercial 46.5 36.4 17.2 22.8
I
78.8' 18.4' 2.26' - 31.13'
briquette
Kiawe
Mesquite British Standard >75 QO 4 . 0 >30.0 (Paddon, 1987)
Commercial 69.8 28.3 1.96 29.7
Commercial 86.8 9.04 4.17 31.8
a *data from the previous work @ai. 1993); b The two numbers indicate samples from top and bottom of the reactor, respectively.
230V
Fig. 1. Schematic diagram of the charcoal reactor

ACTIVATED CARBONS FROM STEAM EXF'LODED WOOD.
Marit Jagtoyen, Frank Derbyshm. Robert S. Wright* and Wolfgang GlasseP University of Kentucky, Center for Applied Energy Research,
Lexington, KY 4051 1-8433 *Biobased Materials Center, Virginia Polytechnical Institute,
Blacksburg, Virginia 24061-0323
Keywords: Activated carbon, Steam explosion, Porosity
INTRODUCI'ION
In a continuing experimental program, we are investigating the conversion of hardwoods. such as white oak (Quercw alba ) to activated carbcms by chemical ~cdvziioii with phosphoric acidl-3. The aims of the. research are to establish the relationships between chemical and morphological change and prosity development, with the long term goal of developing new adsorbents with conholled porosity and surface chemisq, through the selection of the pncursor, reagent, and reaction parameters. The research is further directed to enhancing the use of wood materials, some of which are not appropriate feedstocks for conventional industrial applications, and to providing potential solutions to the problem of the economic utilization of wood wastes from primary and secondazy wood industries.
Our previous work on phosphoric acid activation has demonsuated that there is a direct correspondence between porosity development and a dilation of the altered wood srmcture that takes place at heat treatment temperams above about 200-25o'C 1. W e the mechanisms that lead to this smctural expansion are unclear, it is clearly related to the effects of the reaction of phosphoric acid with the biopolymers in the wood, primarily lignin and cellulose. For example, compared to reaction in the absence of this nagent, phosphoric acid produces an increase in carbon yield that is amibuted primarily to the retention of cellulose, albeit in altered form, through the promotion of c r o s s l i n g reactions. However, lignin and other biopolymers, also contribute to the pore structure. The most significant chemical changes Seem to occur at low temperatures: 13C NMR spectra show that by 50°C there is a loss of carboxyl and methyl groups frmn the lignin structure, and the carbohydrate (cellulose and hemicellulose) signature disappears by 1 W C 4. These findings conespond with observations that lignin appears to undergo partial digestion ox depolymerization at low temperaturesl. It has been reported in other work that wood transforms into a "plastic" state on heat treatment to low temperatures 5.
For these reasons, current studies focus on elucidating the roles of wood biopolymers upon activation with H3PO4, and how they influence the porosity of the carbon product. In this context, wocd and wood fractions have. been produced by a technique known as steam explosion, that has been combined with exhaction methods to provide materials with a range of different compositional characteristics for the synthesis of activated carbons. Steam explosion of lignocellulosic biomass from agriculNtal and forest resources is a technology that was developed for converting woody resources not qualified for the production of paper pulp into constitutive biopolymers 6. The results presented here will consider how the pon size distribution of the activated carbons is influenced by the severity of the steam explosion treatment and fractionation protocol.
-rials and M-
Quantities of white oak were supplied in the form of wood chips (3 x 2 x 0.5 cm) by Westvaco Coqmation. The chips were subjected to steam explosion treatment at four severity levels in a pilot scale unit at the Virginia Polytechnic Institute (VPI). Samples of the products were then subjected to solvent extraction to provide a total of 17 starting materials with different compositional characteristics: the parent wood; the complete steam exploded product at four severities, and extracted fractions from each of these - insoluble fractions frmn water and allcali exmction and recovered lignin fom alkali exhaction. A schematic of the steam explosion process and product separation scheme is shown in Figure 1.
The conditions used for steam explosion influence the chemical and molecular charaneristics of the product and prcduct fractions. A calculated severity parameter, log R,,, is used to denote the combined effects of b e , temperature and steam pressure that are used in any particular mabnent 7. Differences in cell structure and in chemical structure are caused by varying the severity of steam explosion thus providing material of altered composition and microsbucture.
Water exuaction of the steam exploded wood fiber removes most of the hemicellulosc. A I M extraction creates a cellulose-rich fibrous fraction from which most of the lignin has been removed.
288

Extraction is accomplished using a liquor to wood ratio of 8: 1, at a caustic charge of 15-202 Of dry fiber, at 80 to 90'C for 30 minutes. Samples are then filtered, washed in a counter current mode and the solubles and insolubles are recovered. A lignin-rich fraction can be produced as a precipitate upon neutralization of the alkaline filtrate (approx. 90% lignin). By these procedures, the Component biopolymers are isolated as xylose-rich water soluble solids; as cellulose-rich fiber solids; and as lignin-rich fraction by acid precipitation.
Activated carbons are synthesized by mixing an aqueous solution of phosphoric acid with the starting material. after frst grinding the sample to produce a -100 mesh powder (to ensure good contact). The acid is added as an 85% solution in a volume such that the weight ratio of acid to as- received sample is 1.45 : 1.0. The mixture is then heat treated in two stages. First, low temperature heat treatment to 17VC for 30 min. under nitrogen flow to allow time for penetration of the reagent and to complete the initial reactions. This is followed by heating (again in flowing nitrogen) to a final temperature in the range 300-650'C. with a hold time of 1 hr. at maximum temperature. The product, after cooling, is then leached extensively with distilled warn to pH 6 -7 to TeC0Ve.T the reagent, before drying and further characterization.
I
Information on the carbon pore structure was derived from nitrogen adsorption isotherms obtained at 77K on a Coulter b n i s o r b IOOCX apparatus. Surface areas were determined by the BET method Micropore volumes (pores less than 2 nm diameter), Wo, were determined using the Dubinin-Raduskevich equation 8, and mesopore volumes (pores of diameter 2 to 50 nm diameter) were determined by the BJH method 9.
RESULTS AND DISCUSSION
One of the apparent effects of modifying the wood structure by steam explosion is that compared to the parent wood, there is more visible evidence of reaction commencing at room temperature upon addition of the acid solution. This observation could be considered to be due to the opening of the wood struchm by the steam explosion Watment, permitting increased access by the phosphoric acid. However, thermogravimetric analyses of samples of the parent wood and product from preaeament at log & = 4.0 have failed so far to show any significant differences in behavior on H$'O4 activation.
The micropore and mesopore volumes of activated carbons produced from the parent wood and from samples subjected to steam explosion treatment at different severities (without subsequent fractionation) are shown in Figure 2, together with the totals of these volumes. It can be seen that, even at the lowest severity, steam explosion causes an appreciable increase in total pore volume (excluding macropores, defined as 50 nm diameter). Compared to the parent wood, steam explosion at log & = 4.0 increases the total pore volume by about 30%. Most of this change is due to an increase in micropore volume, with an associated change in BET surface area from 13M) to 1950 m2.g-1, Figure 3. The result demonstrates that wood preaeahnent by steam explosion can be very effective for producing structural changes that smngly influence the pore characteristics of the derived carbons.
As can be seen, with further increase in log & there is a progressive reduction in total pore volume, due to decreases in both minopore volume, as reflected by the changes in BET surface area shown in Figure 3, and in mesopore volume. The fact that the volumes in both pore ranges decrease together suggests that the effect of steam explosion severity on porosity is more complex than simply shifting the overall pore size distribution to larger or smaller pore sizes. It appears that, at high aeatment severities, the wood smcture is so extensively disrupted that the normal mechanisms by which phosphoric acid activation generates porosity begin to become appreciably impaired.
Further modifications to the steam exploded wood samples were effected by the solvent extraction scheme described earlier to produce: water-insoluble fractions; alkali-insoluble fractions; and lignin-rich fractions recovemi from the alkali-solubles by precipitation. The pore structural parameters of activated carbons produced from these precursors, at the different levels of steam explosion severity, are summarized in Table 1: micropore volume, mesopore volume, and BET surface area -note that mampomsity is not included.
Although the reproducibility of these preliminary experiments has yet to be confirmed, certain aends can be tentatively identified For the series of carbons produced from the water-insoluble fractions, the micropore volumes appear to be insensitive to log %, over the range studied, while there is a a reduction in mesopore volume with increasing severity. The alkali-insolubles produce carbons with lower microporosity, but here the mesopore volume increases with severity. The data indicate that mesoporosity passes through a maximum, but in any case very high mesopore
289

volumes have been measured at high severities. Carbons with these characteristics would be suitable for liquid phase. applications, where wider pores are desirable from the standpoint of being able to accommodate large molecules, and to facilitate diffusion of the adsorbate through the liquid in the pores.
The lignin-rich fractions produced carbons with micropore volumes similar to those in the carbons from the alkali-insolubles, and again were unaffected by severity. However, the mesoporosity was !educed to low values at steam explosion severities greater than 4.0.
SYNOPSIS
The principal outcome of this research to date is that it has demonstrated that the techniques of steam explosion and solvent extraction allow the production of substantially different materials from a single wood type, and that these materials can function as precursors for the synthesis of powdered activated carbons possessing a range of pore smctural characteristics. For example, low severity steam explosion can be used to increase the. micropox volume and surface area and produce a carbon that would be more suitable for the adsorption of small molecules, typical requirements for gas phase adsorption. In contrast, high severity steam explosion followed by isolation of the alkali-insolubles can produce a carbon with high mesopore volume, suitable for ’ liquid phase applications. The differences between these materials are. clearly illustrated by the nitmgen adsorption isothems in Figure 4 whereas adsorption on the predominantly microporous carbon approaches a plateau at a relative pressure above about 0.3, adsorption on the mesoporous carbon continues to rise due to the filing of wider pores.
In future work, further studies will be made to establish links between precursor composition and the Properties of the powdered activated carbons, and investigations will be. made of the feasibility of producing exmded activated carbons from these same precursors.
REFERENCES
1. 2.
3.
4.
5. US Patent 5,238,470. 1993. 6.
7. 8.
9.
M. Jagtoyen and F. Derbyshm, Carbon, 31 171, 1993, 1185-1192. M. Jagtoyen, F.Derbyshm, Proceedings CARBON’94, Granada, Spain, July 3-8, 1994, pp 232-233. M. Jagtoyen, F. Derbyshm, W. Glasser, Proceedings CARBON’94, Granada, Spain,
M. Solum, M. Jagtoyen, F. Derbyshire and R. Pugmire, accepted for publication, Carbon, 1995.
W. G. Glasser, B. K. Avellar, Symposium on Lignocellulosic Reactions-11. AlChE 1990 Spring National Meeting, March 11-12, Orlando, Florida, 1990. R. P. Overend, E. Chomet, Phil. Trans. R. Soc. Lond., A 321, 1987, 523-536. Dubinin, M. M. Zaverina, E. D. and Raduskevich, L. V. Zh. Fiz. Khimii, 1351-1362, 1947. E.P. Barrett, L. G. Joyner and P. H. Halenda, J. Amer. Chem. Soc., 73, 1951, 373.
July 3-8, 1994, pp 228-229.
ACKNOWLFDGEMENT
The authors would like to thank the US Department of Agriculture, Contract #93-02345, Program Director: Dr. Charles Cleland and University of Kentucky, Center for Applied Energy Research for financial support.
290

1
,
Micropore volume(cc/g) ['Parent wood 0.51 cc/gl
4.01 4.26 4.35 4.43
0.77 0.76 0.67 0.73 0.7 0.75 0.59 0.77
0.60 0.42 0.44 0.60
Mesopore volume(cc/g) [*Parent wood 0.34 cc/gl
4.01 4.26 4.35 4.43
0.36 0.41 0.44 0.26 0.26 0.22 0.25 0.18
0.21 0.45 1.07 0.69
0.56 0.58 0.59 0.57
0.56 0.13 0.14 0.17
BET surface area(mz/g) [*Parent wood 1300 mWg]
4.01 1945 1920 1408 1697 4.26 1589 1746 1166 1327 4.3s 1691 1789 1314 1369 4.43 1413 1792 1734 1328
Figure 1: Schematic for seption of biomass into constituent polymers (Biobasd Matenals Center, Virginia Polytechnical Institute)
291

parent 4 4.26 4.35 4.43 steam explosion severity(log Ro)
2000 y 1800'
01600' 2 v 1400; 2 1200'
800; cn 600< I- : 4004
200 4 0;'
A
m
; 1000;
Figure 2: Influence of steam explosion severity on porosity of activated carbons (H3PO4 activation).
micro
mesa
total
I I I
parent 4 ' 4.26 4.35 4.43 steam explosion severity(1og RO)
Figure 3. Influence of steam explosion severity on BET surface area of activated carbon (H3PO4 activation).
292

... - .
0 0.1 0.2 0.3 0.4 0.5 0.6 0.7 0.8 0.9 PIP0
Figure 4. Nitrogen adsorption isotherms (77K) of activated carbons. (precursor materials derived from white oak)
293

X-RAY CHARACTERIZATION OF SOME ACTIVATED CARBON PREPARED FROM ILLINOIS BITUMINOUS COAL 106 AT THE CAER
David L. Wertz, Shuhua Jin, and Charles B. Smithhart' Department of Chemistry & Biochemistry
and Center for Coal Product Research University of Southern Mississippi Hattiesburg, MS 39406-5043 USA
Key Phrases: Activated carbon, x-ray spectroscopy, x-ray diffraction, phosphorus retention.
INTRODUCTION X-ray fluorescence spectroscopy (XRS) has been an established research tool for at least seventy-five years for the elemental analysis of condensed phases. Because of recent advances in materials development for the transmission and collection of soft x-rays ( A > 10 A), X R S offers new advantages in the study of fossil fuels and their processed products. Wavelength dispersive x-ray fluorescence spectroscopy offers the added advantages of a very low background and excellent peak length/width ratio. Taken together, these features allow WDXRS to be used for the detection of elements in condensed phases at the parts per million abundance level, and in some cases significantly lower.'
With WDXRS, as well as many other types of radiation experiments, attenuation of the incident and secondary radiation beams by the sample occurs. The result is that the measured intensity I,,, cannot be related to sample abundance?
The absorption-corrected intensity of a WDXRS peak, Io(A?l, is directly proportional to the abundance of analyte Q at A, P(A,) is related to the intensity measured at A, by:
I0(AQ) = [~*XWA*~A(~P) 't 8*~wA*~A,(AQ)l*1,,(~Q)* - exp[-{a*2wA*pA(AP) + 6*ZW+*~A(~Q)}ll. (1)
In eq. 1, wA represents the abundance of element A in the condensed phase sample, &,,(A,) is the intensity measured at wavelength A, due to the presence of analyte Q in the sample. The mass absorption coefficients, pA(AP) and pA(A,), are for the attenuation (absorption) of the primary radiation (chromium in these experiments) and for the secondary radiation emitted by the analyte Q, respectively. Constants related to the mass of the sample are represented by a and 8. The terms containing the absorption coefficients are designated the "matrix absorption" due to the sample and have a pronounced effect on the relationship between the measured intensity and the absorption-corrected intensity for analyte Q.
The condition of "infinite thinness" may be achieved when the matrix absorption effect -> 0 and is relatively constant. When this condition is satisfied, w, - I,,(A,)/K'; and the intensity of the peak at A, provides a useful measure of the abundance of analyte Q. The condition of "infhite thinness" is achieved in cleaned coal and biomass samples, where the presence of metal atoms is quite small and the structural units are predominantly either hydrocarbons and/or carbohydrates.
EXPERIMENTAL Samples were obtained from Jagtoyen as fine powders and were examined as received using conventional x-ray diffraction and x-ray spectral methods.
RESULTS AND DISCUSSION As seen in Figure 1, the FeS,, Fe,O,, SiO, and/or CaCO, (which are strong absorbers of Cu K. X rays) had been successfully removed from the IBC 106 prior to its use.
Jagtoyen and Derbyshire have discussed the processes by which bituminous coals and hardwood have been treated by their high temperature (H'lT) phosphoric acid process.'A
Shown in Figure 2 are the WDXRS spectra obtained from several samples of demineralized IBC 106 coal treated by the CAER hot phosphoric acid process used over the temperature range from ambient temperature (labeled DM coal) to 650°C. Ai ambient temperature a
294

large sulfur peak (1 = 5.372 A) is noted, corresponding to an organo-sulfur abundance of Ca. 21% in the cleaned mal. Comparison of the sulfur peak intensities indjcateS that as the Process temperature is increased, the percentage of sulfur retained in the carbon fibers reduced. When processed at 650"C, the fibers retain ea. 0.4%. Accompanying the increase in Process temperature is a retention of phosphorus (I = 6.155 A). A Simi lar increase in phosphorus retention is found in the white oak samples treated by Jagtoyen.','
m x R S cannot be extended to provide detailed information about the structural role@) of the phosphoric acid species involved in the CAER process because the technique only provides elemental (and not molecular) information.
We have previously shown5 that the full-width at half maximum (FWHM) for the graphene stacking peak, found at 35-4.0 A) in bituminous coals, measures the regularity of the stacking of the graphene layers in coals. Shown in Figure 4 are the x-ray diffractograms (XRD's) obtained from the unprocessed IBM 106 coal and the coal processed at the several temperatures noted above. Comparison of the XRD's indicates that the FWHM of the graphene stacking are affected significantly by the process temperature, with the higher process temperatures causing improved regularity of the graphene peaks.
Shown in Figure 5 is evidence that the reduction in FWHM is not due to thermal effects.
Jagtoyed has measured the BET surface area of the activated carbon produced from the IBC 106 as a function of process temperature. In addition, the CAER team reports a significant reduction in the hydrogen component of the activated carbon produced by their H l T process.' The increase in surface area and the reduction in hydrogen content parallel, at least crudely, with phosphorus uptake (measured by WDXRS) and the re-alignment of the graphene layers in the activated carbon (measured by XRD).
CONCLUSIONS The two x-ray characterization methods, wavelength dispersive x-ray spectroscopy and x-ray difiaction, each provide limited information about carbon fibers prFpared by Jagtoyen and Derbyshire. Unfortunately, neither method provides definitive information about the structural and/or bonding roles of the phosphorus moieties in the activated carbon.
REFERENCES
Support via a DOE-EPSCoR Graduate Fellowship is gratefully acknowledged.
1.
2.
Jenkins, R., "X-Ray Spectrometry", John Wiley & Sons, NY, 1988.
Mug, H. and Alexander, L. E., "X-Ray Diffraction Procedures", Wiley-Interscience, NY, p. 360.
Toles, C., Rimmer, S. M., Derbyshire, F., and Jagtoyen. M., Am. Chem. Soc., Div. Fuel Chem., 1994 (39) 596.
Jagtoyen, M. and Derbyshire, F. J., Carbon, 1993 (31) 1185.
Wertz, D. L and Bissell, M., Energy & Fuel, 1994 (8) 613.
3.
4.
5.
6. Jagtoyen, M., private correspondence.
295

600 -
400 -
m P
100 -
O - I I I I I I I I I 10 20 30 40 80 60 70 EO SO
DIFFRACTION AN- C u b X RAY8
FIGURE 1. XRD OF THE CLEANED IBC 106.
IBC 106 + 1(3po4 m ~ p r m ~ 4000 -
3000 -
1000 -
0
d,I, , ~ , q - r - y o c 0 1
70 75 EO 85 90 95 ANeLWEDUT WONOCHROFIATOR
FIGURE 2. WAVELENGTH DISPERSIVE X-RAY SPECTRAOFTHE I B C S M L E S TREATED WITHTHEKCAERmTREATh4ENTOVERTHERANGE FROM AMBIENT TO 55OoC. SULFUR AND PHOSPHORUS PEAKS ARE LABELED.
296

W -
W -
a-
0 1 0 0 a o 0 s w 4 0 0 ~ 8 0 0 7 0 0 R y w p R D E E B B - m
FIGURE 3. H'IT EFFECTS ON ORGANO-SULFUR AND PHOSPHORUS UPTAKE.
- e c
- s a o c
- rm c
FIGURE 4. HTT EFFECTS ON THE XRDs OF THE ACTIVATED CARBONS.
moo - COAL Hum TO 6 w C +
400 OMINERALIZED COAL Hum TO COAL SEOC
100 -
10 20 3 0 1 0 20 3 0 1 0 20 90 OI!TRACTXON *N8LE OIFFR*CTION M L E DIFFR*L7ION u(BLE
FIGURE 5. CORRELATION OF PHOSPHORUS RETENTION WITH BET SURFACE AREA6 MEASURED FOR THE ACTIVATED CARBONS.
297

PYROLYSIS AND HYDROPYROLYSIS OF BIOMASS AND LIGNINS - ACTIVITIES AT THE INSTITUTE OF WOOD CHEMISTRY IN HAMBURG, GERMANY
Dietrich Meier, Jochem Bems and Oskar Faix Federal Research Centre for Forestry and Forest Products
Institute of Wood Chemistry and Chemical Technology of Wood 21027 Hamburg, Germany
Keywords: biomass, lignin, hydrocracking, pyrolysis, liquefaction
INTRODUCTION After the frs t oil price crisis in 1973 research activities were initiated throughout the world to produce oil from renewable feedstocks l i e lignocellulosic biomass. Countries with huge biomass resources and strong dependence on imported petroleum such as Canada and the United States of America were leading in research at that time. At the Pittsburgh Energy Research Center (PERC) high pressure liquefaction of cellulosic wastes was studied using carbon monoxide and sodium carbonate as a catalyst (1). and a pilot plant in Albany, Oregon was constructed. At the same time, another high pressure conversion process for woody biomass was investigated at the Lawrence Berkeley Laboratories (2). The scaled-up version of this process was also tested in Albany. After several years of operation, the pilot plant was shut down due to economical and technical reasons. It was felt that high pressure technology is too sophisticated for the thermal conversion of biomass into liquid fuels and that simpler technologies should be developed. Therefore, in 1980 the Solar Energy Research Institute (today NREL) in Golden, Colorado, organized a specialists' workshop on fast pyrolysis of biomass. This process promised to give high yields of liquid products. During the workshop, researchers working on coal and biomass presented papers on both fundamental aspects - such as heat transfer mechanisms - and practical work regarding process parameters such as feedstock, particle size, heating rate, residence time, pressure etc. Since the early eighties a lot of progress has been made in the development of conversion technologies for biomass. The most important processes with their characteristics are compiled in Table 1.
In 1982 the German government also recognized the need for using renewable feedstocks and funded a research project dealing with the direct conversion of wood into a liquid fuel and/or chemical feedstocks. Based on the large tradition and experiences in coal conversion by the high pressure Bergius-Pier process in Germany (14 plants produced all transportation fuels during World War 11) the Institute of Wood Chemistq (IWC) adopted the process principles to woody feedstocks. During several years of experimental work at IWC, various process alternatives were studied covering
sluny phase hydrocracking in batch and semi-continuous reactors hydropyrolysis in batch and semi-continuous reactors flash pyrolysis in a bench-scale fluidized bed reactor.
In the present paper the research activities and main results on thermochemical conversion of biomass and lignins are summarized.
HIGH PRESSURE EXPERIMENTS Initial hydrocracking experiments were conducted in 25 ml autoclaves to compare conversion rates of different lignocellulosic feedstocks and to develop methods for separation and chemical characterization of the liquids (3.4). Palladium on active charcoal (Pd/C) was initially used as a catalyst. Temperature was 475°C and initial hydrogen pressure 6 Mpa. Surprisingly, very small amounts of solid residue ranging from 0.5 to 6.8 '70 were observed for all kinds of biomass such as softwood, hardwood, straw, sugar cane bagasse, lignins and cellulose. The oil
298

yields of the lignocelluloses were in the range of 41 %. Cellulose and hemicelluloses gave rise to around 30 % and lignins to ca. 62 70 of an oil. The average molecular weight of the oil was around 500 Dalton indicating severe depolymerization of the feedstocks during hydrocracking. The mass balance of these studies demonstrated that lignin is a more suitable feedstock with respect to oil yields than cellulose and hemicelluloses which have a tendency to give more char, water and gas.
After these orienting studies with the micro-autoclaves, experimental work was continued including a 1-L autoclave system (see Figure 1).
Reactor
SIYnyYoil
Biomass
Hot Separator Cold Separator 230'C 20'C -5O'C
W F Slurry Oil Net Product Oil
Water
Fig. 1-L autoclave system for hydrocracking of biomass
It consists of a high pressure stirred reactor, a high pressure hot separator and a high pressure cold separator (5). A sluny phase catalytic hydrocracking process was developed with PdC as catalyst. In general. spruce wood particles were mixed with the high boiling recycle oil fraction which was condensed in the hot separator at 230 "C. The light and middle distillate fraction was collected in the cold separator and yielded around 37 % of a net product oil (NPO). Several consecutive runs were made in which always the hot separator fraction of the previous run was used as a slurry oil. In this way, the stability of the recycled oil was proved and the conditions of a continuous process could be simulated. The experiments revealed that the NPO yields and the amount of recovered recycle oil were almost constant in all mns. Therefore, a mass balance was established which reflects the overall yields of each product fraction from hydrocracking of biomass (Figure 2).
Beside palladium, other catalysts were included in the hydrocracking experiments such as Co, Mo, Cr, Ni, Fe, and red mud. However, none of these catalysts reached the NPO yields of palladium. The slurry oil could be completely recycled only in the presence of the iron catalyst and a NPO yield of 28 % was found. In general. the NPO's had a heating value of around 37 MJkg. An energy balance for the hydrocracking conversion process is presented in Figure 3, taking into account a hydrogen consumption of 4 % and the individual proportions and heating values of the biomass constituents. The balance demonstrates that 59 90 of the input energy can be recovered and concentrated in the NPO. Its light fraction amounted to 50 % having a boiling point range < 220°C. The rest could be completely distilled between 220-360OC. In
299

comparison to oils obtained in the Albany plant, the NPO had a very low viscosity of 3.88 cSt at 2OoC, a low pour point of -24'C. and a low density of 0.92 g/l (6).
Figure 2 Mass balance for hydrockracking of biomass
HYDROGEN t BIOMASS - NPO + OTHER PRm. L kg 1 5 7 7 ~ 1 i o o q 1 1 7 m n 35kp n380HJI 69kP 1917Wl
\ / 2327MJ dOO%l- 59%
Figure 3 Energy Balance for hydrocracking of biomass
The variation of process parameters was also studied and is documented in various publications (7-9). There is a positive correlation between the pressure and the yield of liquids and a negative correlation between the pressure and the amount of char. At 3 MP initial hydrogen pressure the char yield is as high as 40% but between 10 and 13 MPa, char formation is very low and amounts to ca. 5 96 (8) (see Figure 4). The chemical characterization of the NPO's was mainly done by capillary gas chromatography and mass spectrometry with special emphasis on the qualitative and quantitative determination of phenolics which industry is mostly interested in. However, the unambiguous assignments of reaction products was difficult for the s h y oil phase reactions because the recycling oil was also degraded to a certain extent
Therefore, we carried out hydropyrolysis experiments without a co-solvent using the same conditions as before in the hydrocracking experiments. Beside spruce wood and china grass, we also included technical lignins from various pulping processes as feedstocks in our expenmental designs. Conversion of the feedstocks was excellent (10-12). In some cases, at suitable conditions, no char was formed. In general, lignins gave very high liquid yields of up to 80 %. VEBA OEL, the largest German refinery company, showed interest in lignin
300

hydrocracking for phenol production as methyl-aryl-ethers can be used as octane enhancers in gasoline. For this reason, we concentrated our work on lignin. A lot of experiments were performed at IWC including the application of slurry oils derived from petroleum and lignin. Despite of the high conversion rates, the amount of mono-phenols did not come up to our expectations. In the best case the yield of monomeric phenols was around 13 wt% (13.14).
" 1
3 6 u u h!m
Figure 4 Yield of hydrocracking products at different initial hydrogen pressures
FLASH PYROLYSIS OF BIOMASS IN A FLUIDIZED-BED REACTOR Since the aforementioned workshop on flash pyrolysis, several technologies have been developed mainly in Canada and the United States. At the moment, the most advanced flash pyrolysis technologies available are from ENSYSN. Gloucester. Ontario, Canada, (circulating fluidized bed), the University of Waterloo, Waterloo, Canada, (stationary fluidized bed) and NREL, Golden, Colorado, USA (vortex reactor). The Canadian know-how is now being exported to Europe. Especially the Waterloo Fast Pyrolysis Process (WFPP) is applied in research laboratories in Spain, Great Britain, Finland, and Germany. The fust pilot plant of the WFPP process, with a capacity of 200kgh. was installed in Spain funded by the EU and UNION FENOSA, a Spanish energy producer. Another pilot plant from ENSYN, Canada. wiU be erected in Italy in 1995. A typical mass balance of the flash pyrolysis process is shown in Figure. 5 . The elemental composition of the liquids is very similar to wood. Their quality is quite different from high pressure oils. They contain water (10 to 35 %) and are rich in oxygenated compounds. Pyrolysis liquids are corrosive due to their low pH-value and thermally unstable because they tend to condensate at elevated temperatures. Therefore, the direct use is difficult and upgrading is necessary depending on the application.
\ P Y \ \ I f I 75 Liquid 1
100 Biomass (incl. 25 Water)
Figure 5 Mass balance of flash pyrolysis
Recently, the investigations on thermochemical conversion at IWC were also extended to flash pyrolysis using a continuously operating bench scale fluidized-bed reactor from the University
301

I
of Waterloo with a capacity of 100 0. A reactor description is given elsewhere (15). There are several reasons why fast pyrolysis is now so attractive: 1. There is an increased interest in the EU to produce biofuels by flash pyrolysis for the
production of power, transportation fuels, and chemicals. 2. ICW is involved in a EU research project on "Integrated Chemicals and Fuels Recovery from Pyrolysis Liquids Generated by Ablative Pyrolysis". Within this project we can use OUI
expertise in analysis, fractionation, and upgrading of bio-oils. 3. IWC got funds from the German Foundation for Environment to investigate. the possibilities
of using the flash pyrolysis technology for the disposal of contaminated wood waste. For this purpose a 1 k g h pilot plant with a fluidized bed reactor and gas recycling will be erected at IWC in 1995. Flash pyrolysis in fluidized beds has some advantages over conventional incineration of waste wood which actually in Germany is very limited due to legislative resmctions. ( I ) the gas volume in the process is drastically reduced. Thus. gas cleaning is more easier, (2) the formation of dioxins is unlikely to occur due to the absence of oxygen, (3) the plant capacity can be very small.
REFERENCES 1.
2. 3. 4. 5. 6.
7. 8.
9.
10.
11 . 12. 13.
14.
15.
Appell, H.R., Y.C. Fu, E. G. Illig. F.W. Steffgen and R.D. Miller (1975) Bureau of Mines, Report of Investigation 8013, Pittsburg. Elliott, D.C., Biotech.&Bioeng. Symp. No. 1 1 (1981). 187-198. Meier, D.. D.R. Larimer and 0. Faix (1986) Fuel, 65,910-915. Meier, D.. D.R. Larimer and 0. Faix (1986) Fuel, 65,916-921. Meier, D, K. Fuch and 0. Faix (1987) "Energy Biomass & Wastes X", 785-800. Meier, D. and 0. Faix (1988) "Research in Thermochemical Biomass Conversion" (eds.: Bridgwater. AV, J.L.Kuester) Elsevier, 804-815. Meier, D., L. Jakobi and 0. Faix (1988) J. Wood Chem. Techn., 8,523-542. Meier, D. and 0. Faix (1989) "Energy from Biomass 4" (eds.: G. Grassi, D. Pinwitz.. H. Zibetta) Elsevier, 584-592. Meier, D. and M. Rupp (1991) "Biomass Pyrolysis Liquids Upgrading and Utilization" (eds.: A.V. Bridgwater, G. Grassi) Elsevier, 93-102. Meier, D. and 0. Faix (1990) "Biomass for Energy and Industry 5". Vol. 2, (eds.: G. Grassi, G. Gosse, G. dos Santos) Elsevier. 2646-2650. Meier, D. R. Ante and 0. Faix (1992) Bioresource Technol., 40, 171-177. Oasmaa, A. R. AlCn and D. Meier (1993) Bioresource Technol., 45.189-194. Meier, D. J. Bems and 0. Faix (1994) "Advances in Thermochemical Biomass Conversion (ed.: A.V. Bridgwater) Blackie, Vol.2, 1016-1031. D. Meier. J. Berns, 0. Faix, U. Balfanz and W. Baldauf (1994) Biomass & Bioenergy (in press) Scott, D.S. and J. Piskorz (1984) Can. J. Chem. Eng., 62,404-412.

\
u1
3
L
z
0 m -r
z
3 z .- VI .- - A e
z
0
7
z
a bo
5 .- VI
h .- - 5 n
303

CATALYTIC GASIFICATION OF WET BIOMASS IN SUPERCRITICAL WATER
Michael J. Antal, Jr., Yukihiko Matsumurn, Xiaodong Xu, Jonny Stenberg, and Peter Lipnik Hawaii Natural Energy Institute and the Department of Mechanical Engineering,
University of Hawaii at Manon, Honolulu, HI 96822
Keywords: Wet biom's, Catalytic gasification, Supercritical water
INTRODUCTION Wet biomass (water hyacinth, banana trees, cattails, green algae, kelp, etc.) grows rapidly
and abundaitly around the world. As a biomass crop, aquatic species are particularly attractive because their cultivation does not compete with land-based agricultural activities designed to produce food for consumption or export. However, wet biomass is not regarded as a promising feed for conventional thermochemical conversion proctsses becaiisc the cost associated with drying it is too high. This research seeks to address this problem by employing water as the gasification medium. Prior work has shown that low concentrations of glucose (a model compound for whole biomass) can be completely gasified in supercritical water at 600'C and 34.5 MPa after a 30 s reaction time (Dehui et al., 1993). Higher concentrations of glucose (up to 22% by weight in water) resulted in incomplete conversion under these conditions. The gas contained hydrogen, carbon dioxide, carbon monoxide, methane, ethane, propane, and traces of other hydrocarbons. The carbon monoxide and hydrocarbons are easily converted to hydrogen by commercial technology available in most retineries. This prior work utilized capillary tube reactors with no catalyst. A larger reactor system was fabricated and the heterogeneous catalytic gasification of glucose and wet biomass slurry of higher concentration was studied to attain higher conversions.
EXPERIMENTAL A schematic drawing of the reactor system is presented in Figure 1. The reactor was
constructed of Inconel 625 tubing with a 0.375" OD and 0.187" ID. The temperature of the reactant flow was abruptly raised to a desired value using an entry heater/cooling water jacket combination. The reactor was maintained at isothermal conditions using a furnace and down- stream heatedcooling water jacket combination. To improve the heat transfer from the heaters to the fluids inside the reactor, the heaters were coiled on stainless steel rods in direct contact with the hconel reactor. Different amounts of solid catalyst could be packed inside the reactor, giving the desired weight hourly space velocity (WHSV), which is defined as the ratio of the mass flow rate of the reactant to the mass of a proprietary "catalyst X" used in the heated zone. The axial temperature profile along the reactor's functional length of approximately 0.48 m was measured with IS ked, type K thermocouples. Pressure in the reactor system was measured using a pressure transducer. A back pressure regulator reduced the working pressure from 34.5 MPa to atmospheric pressure. m e r passing though the back pressure regulator, the reactor effluent then passed through an in-house fabricated glass gas-liquid separator. The gas flow rate was measured using a wet test meter.
The aqueous solution of glucose was fed into the reactor by an HPLC pump. A balloon feeding system was employed to feed the wet biomass slurry. Wet biomass was first ground with a blender and then with a homogenizer. The heterogeneous biomass slurry tilled the 500 d high pressurdtemperature vessel, which was equipped with a magnetic drive. A meteorological balloon was placed in the vessel together with the biomass slurry. Water was pumped into the balloon, and as the balloon expanded the biomass slurry was forced into the reactor.
The analysis of the. gaseous products was accomplished on a gas chromatograph equipped with flame ionization and thermal conductivity detectors. A 800/100 mesh carbosphere molecular sieve packed column was used, operating at 35OC for 4.2 min, followed by a lS°C/min ramp to 227OC, a 7OoC/min ramp to 35OoC, and a 5.3 min hold at 350'C. The following gases were detected as the products of glucose gasification: H2, CO, C02, CHq, QHQ, CzHg, C3%, and C3Hg. Gas yields were calculated as the ratio of mole of detected gas to the mole of reactant, Carbon gasification efficiency was calculated as the ratio of carbon converted into gas.
Ten cubic centimeters of the liquid effluent from the experiments were dried in small beakers in an oven and the weight gain measured. A dark tar deposit remained on the bottom of the b d e r after the drying for lower temperature or higher concentration. Tar yield was calculated as the ratio of the weight of tar to the weight of the reactant.
RESULTS AND DISCUSSIONS 1. Temperature eff'
The effect of temperature on the gasification of glucose in the presence of catalyst X is shown in Table 1. Complete carbon conversion was observed at 600T; however, as temperature dropped, carbon gasification efficiency decreased drastically. When the reaction temperature was
.
304

below 580°C, resulting in incomplete gasification conversion, the liquid effluent became yellowish and there was a thin layer of a dark brown, oil-like tar. Figure 7. illustrates the amount of tar present in the liquid sample as a fimction of reaction temperature. It is obvious that the tar yield in the liquid sample increws as temperature decreases. The tar yield at 6OOOC is significantly small.
2. Reactant concentration effect When 0.2 M glucose was gasified without the solid catalyst X at about 30 s residence time
in supercritical water at 600°C, 34.5 Mpa, complete carbon conversion was observed. The liquid sample was clear. As the reactant glucose concentration increased, the carbon conversion decreased. With 0.8 M glucose reactant, the conversion dropped to 88%, and a dark brownish oil layer was present in the liquid sample.
The presence of solid catalyst X resulted in complete conversion of glucose feed with concentration as high as 1.2 M at a WHSV of22.2 (g/h)/g (see Table 2). The liquid effluent was clear. Gas yields of H2, CO, CHq, and C02 increased significantly with the addition of catalyst X.
3. Pressure effect When the pressure increased from 25.6 MPa to 34.5 ma, the overall carbon gasification
efficiency remained almost the same However, as pressure increased, the yield of methane increased. This finding confirms the results ofElliott et al. (Elliott et al., 1993% 1993b; Baker et al., 1989; Sealock et al., 1993).
4. Deactivation of catalyst Deactivation of catalyst was observed in an 8-hour experiment using 1.2 M glucose as a
reactant. As shown in Table 3, the carbon gasification efficiency decreased, while the solid residual and carbon content in the liquid sample increased with time.
The liquid samples were collected for total organic carbon (TOC) analysis. TOC yield was calculated as the weight ratio of carbon in the liquid effluent to that in the reactant. Because of the lower carbon gasification efficiency, more carbon remained in the liquid effluent at the later stage of the experiment, as indicated in Table 3. Notice that the tar yield (which is a measurement ofthe non-volatile residual in the liquid effluent) also increased with time.
5 . Whole biomass gasification Various whole biomass feeds, including water hyacinth, depithed bagasse liquid extract,
sewage sludge, and paper sludge, were studied in the packed bed reactor. The gasification of the above feeds with catalyst X at 600"C, 34.5 MPa, resulted in a complete conversion to gas. The gas contained H2, C02, CHq, and trace amounts of high hydrocarbons. The amount of carbon monoxide in the gaseous product mixture was very small. V i a l l y no tar or char products were detected by the evaporation of the liquid effluent. The TOC analysis confirmed this result. Typical results are illustrated in Table. 4, which presents data for the gasification of sewage sludge.
CONCLUSION Glucose as high as 22% by weight in water can be completely gasified to a hydrogen-rich
gas with catalyst X at a WHSV as high as 22.2 (glhyg in supercritical water at 600"C, 34.5 MPa. Complete conversions of low concentrations of whole biomass feeds, including water hyacinth, depithed bagasse liquid extract, and sewage sludge, have also been achieved.
REFERENCES Baker, E.G., L. J. Sealock, Jr., R. S. Butner, D. C. Elliot, and G. G. Newenschwander (1989),
"Catalytic destruction of hazardous organics in aqueous wastes: Continuous reactor system experiments," Haznrahs Wmte di HazardousMat., 6,87-94.
Dehui, Y., M. Aihara, and M. J. Antal, Jr. (1993), "Hydrogen production by steam reforming glucose in supercritical water," Energy andFueLs, 7(5), 574-577.
Elliott, D. C., E. G. Baker, R. S. Butner, and L. J. Sealock, Jr. (1993a), "Bench-scale reactor tests of low temperature, catalytic gasification ofwet industrial wastes," J. Sol. k r g y f i g . . , 115,
Elliott, D. C., L. J. Sealock, Jr., and E. G. Baker (1993b), "Chemical processing in high-pressure 52-56.
aqueous environments. 2. Development of catalysts for gasification," Ind Eng. Chem. Res.,
Sealock, L. J. Jr., D. C. Elliott, E. G. Baker, and R. S. Butner (1993), "Chemical processing in 32, 1542-1548.
high-pressure aqueous environments. 1. Historical perspective and continuing developments," Ind fig. Chem. Res., 32, 1535-1541.
305

Table 1. Temperature effect on the gasification of ~ucose superaitid water with catalyst X (l.OMglucosereactant,WHSV= 13.5cgn?yg,34.5MPa)
Temaerature ' 6OOQC 55ooc 500°C
1.97 2.57 1.54 0.90 0.01 0.25 0.01 0.11
0.62 1.67 0.73 0.37 0.01 0.10 0.03 0.05
0.46 1.57 0.85 0.25 0.02 0.07 0.04 0.04
Carbon gasification 0.98 0.54 0.51 efficiency
Tar yield 0.1% 0.9% 1.3%
Table 2. Glucose reactant concentration effect on the gasification efIiciency in supercritical water at 6OO0C, 34.5 MPa, with catalyst X. (Flow rate: 1.0 cm3/min)
1.2 M glucose with 0.6 g catalyst
( WHSV = 22.2 (glh)/g )
0.8 M glucose with no catalyst
( Res. time = 28 s )
2.24 0.79 3.09 1.23 0.00 0.35 0.00 0.13
0.70 1.63 2.01 0.75 0.04 0.22 0.04 0.09
Carbon gasification efficiency 1.03 0.88
Tar yield 0.008% Not available
Table 3. Stability of catalyst X in a continuous run of glucose gasification in supercritical water at 6OO0C, 34.5 MPa (1.2 M glucose, WHSV = 19.9 (s/h)/g, catalyst X 2.55 g)
Time on stream 0.7 h 1.77 h 3.92 h 5.2 h
3.83 0.79 3.32 0.95 0.00 0.26 0.00 0.15
3.85 0.63 3.49 0.94 0.00 0.26 0.01 0.13
1.97 2.41 1.84 0.93 0.01 0.25 0.01 0.11
1.53 2.71 1.18 0.83 0.01 0.21 0.02 0.09
Carbon 1.00 1.00 1.01 0.91 gasification efficiency
Tar yield 0.02% 0.03% 0.07% 0.16%
TOC yield 1.4% 2.5% 5.4% 5.8%
306

Table 4. Sewage sludge gasification in supercritical water at 6OO0C, 34.5 MPa, with catalyst X (28 g/dm3 sewage sludge with 2.96 g catalyst X, WHSV = 0.50 (gh)/g )
Gas product Yielda Mole fractionb
co 3.5% 2.9% 66.2% 36% 16.3% 24% 0.05% 0.04% 7.7% 5.7%
' 0.3% 0.15% 1 .I% 0.89%
H2 2.1% 33%
c o 2 CHq.
c2Hq C2% C3% c3HS
total 98.4%
Liquid yieldc 0.99%
Mass balanced 99.4%
TOC analysis 0.28 g-carbon / dm3
a Gas yield = weight of gas /weight of reactant b Mole fraction = mole of gas /total mole of gas in the effluent c Liquid yield = weight of solid residue in liquid / gram of reactant d Mass balance =total gas yield + liquid yield
~
~ ::>.. .:.: ..:.. .:.:: .j:: .::. .:::
:.~. ::. .is ;;:>; 3.: :j:: ... . . ~ ..: . : ::: .:.: :.... . ,.. . . .. . . , .. .. .
Fig. 1. Reactor system scheme. 1) Balance; 2) Flask with reactant; 3) HPLC pump; 4) Feeding vessel with agitator, 5) Wet-biomass sluny. 6) Balloon; 7) Inconel 625 tube; 8) Cooliig jacket; 9) Heater; 10) Furnace; 11) Furnace shell; 12) Presswe transducer. 13) Back pressure regulator. 14) Gas sample output; 15) Liquid-gas separator. 16) Wet test meter
1.4
1.2
1 - f 0 8
," t 0.0
0.4
0.2
0
Fig. 2. Tar yield vs. reaction temperature (1.OM glucose reactant, WHSV = 13.5 (gih)/g )
307