non-financial sector balance sheets and financial ... · pdf filenon-financial sector balance...
TRANSCRIPT

Non-financial sector balance sheets and financial stability: what can we learn from
economic research?
Andrea Generale
Banca d’ItaliaMacroprudential
Analysis DivisionPrepared for the IMF and NBR Seminar on Financial
Stability IssuesSinaia
-
Romania

Outline
Household sector
-
Aggregate picture-
Micro data
Non-financial firms
-
Aggregate picture-
Micro data

The household sector: the aggregate picture
Recent trends in households’
balance sheets
1.
Debt growth (mainly in the longer-term component)
2.
Increase in financial and real wealth
3.
Change in the composition of assets (risky/safe assets)

The household sector: international comparison (1)
Household financial debt
54
93
25
46
63
9591
56
105
32
6974
10599
70
96
47
124
91
153
135
0
20
40
60
80
100
120
140
160
180
France Germany Italy Spain Euro area United Kingdom United States
1996 2000 2006
as a percentage of disposable income
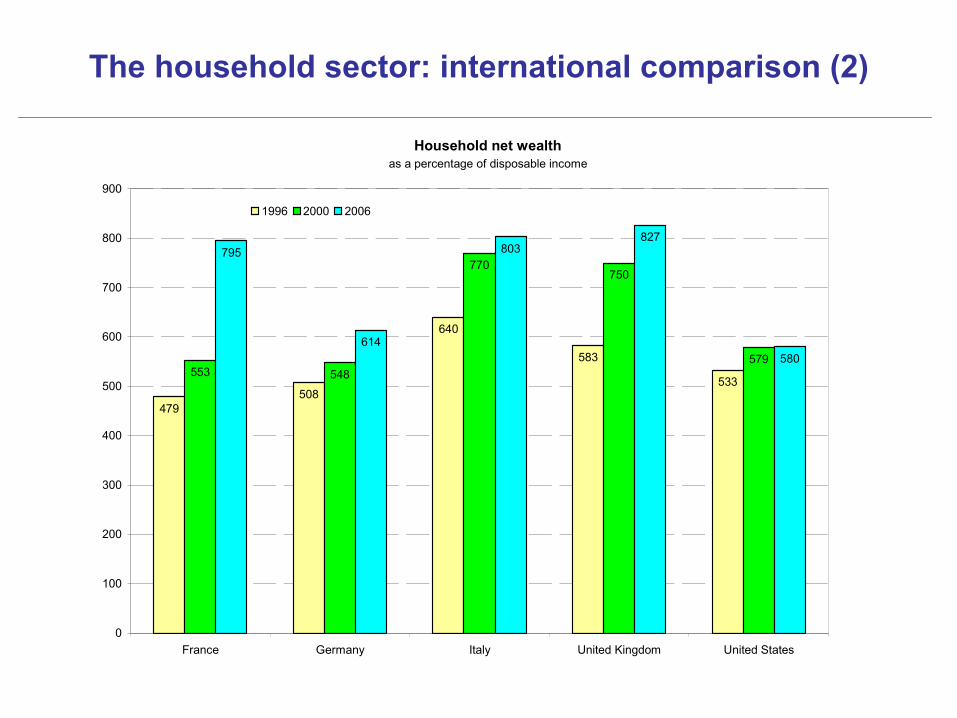
The household sector: international comparison (2)
Household net wealth
479508
640
583
533553 548
770750
579
795
614
803827
580
0
100
200
300
400
500
600
700
800
900
France Germany Italy United Kingdom United States
1996 2000 2006
as a percentage of disposable income

The household sector: international comparison (3)
Household financial assets
221 218
265
397419
267252
363
486
459
290 280
361
460449
0
100
200
300
400
500
600
France Germany Italy United Kingdom United States
1996 2000 2006
as a percentage of disposable income

The household sector: international comparison (4)
Household deposits over total financial assets
4041,5
36,4
47,3
39,6
23,7
12,4
33,4 34,2
22,9
39,8
31
20,3
10,3
29,1
33,9
25,7
36,9
31,2
26
13
0
5
10
15
20
25
30
35
40
45
50
France Germany Italy Spain Euro area United Kingdom United States
1996 2000 2006
percentage

The household sector: Italy
Sources: Bank of Italy, ISTAT.(1) Consumer households, producer households and non-profit institution serving households. The figure forgross disposable income in 2007 is a Bank of Italy estimate. (2) Left-hand scale. End-of period stocks. (3) Right-hand scale. The indicator relates only to consumer households. The figure for debt servicing (totalpayment of interest and principal) is a Bank of Italy estimate.
HOUSEHOLDS' DEBT (1)(as a percentage of gross disposable income)
5
15
25
35
45
55
1999 2000 2001 2002 2003 2004 2005 2006 20075,5
6,0
6,5
7,0
7,5
financial debt (2) debt servicing (3)

The household sector: Italy
The analysis of the aggregate data for Italy gives a quite comforting picture.
Debt and the cost of debt service have increased, but debt remains lower than that of other countries.
Wealth is high and so leverage measures (ratio of debt to assets) are low.

Italy: other indications
Factors related to the “soundness”
of the households
sector in Italy:-The share of mortgages granted at variable rates is higher in Italy than in other countries: 75 % considering new mortgages on average in 2003-07 as opposed to 20% in Germany and 30% in France and the Netherlands-Loan to value ratios increased in the decade reaching around 70% in 2006. They are still lower than in other countries-Recovery procedures are rather lengthy, affecting banks’
loss given default

Household sector: micro data
Macro data give a “weighted”
average measure of the household sector financial position.
Debt might well be concentrated among lower income/lower wealth households. It is impossible to gauge any evidence on this from macro data.
In this sense, “analysis using micro data can help identify pockets of fragility within the sector”.

Household sector: source of micro data
SHIW: Bi-annual survey covering a representative sample of around 8,000 households. Panel component is present.
Information on main socio-economic variables, income, assets and liabilities of the households.
Advantages: detailed information on households portfolios and link to main characteristics of the household.
Disadvantages: the main one is timeliness.

Household sector: what the SHIW tells us
In 2006 according to the Bank of Italy’s SHIW 12% of households had a mortgage loan and 13% some form of consumer credit.
The corresponding percentages for both categories of loan were close to 20 per cent in Spain (on data for 2001) and to 30 and 50 per cent respectively in France and the United States (in 2004).
Overall, the percentage of Italian households with some form of debt has fluctuated around 20% since the mid-
1990s, showing a slight tendency to rise since 2002.

Household sector: micro data
Source: Bank of Italy, Survey on Household Income and Wealth.(1) Percentages of households with debt out of total households covered by the survey. Excludes debts contracted forprofessional reasons.
PARTICIPATION IN THE CREDIT MARKET (1)(percentages)
5
10
15
20
25
1989 1991 1993 1995 1998 2000 2002 2004 20065
10
15
20
25
total
consumer credit
for house purchases

Household sector: what the SHIW tells us
The growth in aggregate household debt in recent years mainly reflects an increase in the average individual debt (intensive margin) rather than broader participation (extensive margin).
Loans for house purchases (60 per cent of total lending to Italian households) growth reflected a substantial increase in the average debt of the indebted households (~+50% in real terms in the decade) rather than broader participation in the credit market.
Participation rates for consumer credit show a more clear upward trend.

Household sector: what the SHIW tells us
1989 1995 2006
Share of households with debt (%) 12,7 20,5 22,2by income quartiles
1° 5,4 10,5 11,32° 12,9 16,9 18,13° 15,7 24,8 27,94° 16,9 29,7 31,7
Share of households with consumer credit (%) 7,4 9,3 12,8by income quartiles
1° 3,5 6,3 8,32° 8,2 8,2 10,23° 8,4 11,9 15,44° 9,3 10,8 17,2
Share of households with mortgage debt (%) 6,0 13,0 11,9by income quartiles
1° 2,0 4,8 3,82° 5,0 9,7 9,13° 7,9 15,7 16,14° 9,1 22,0 18,6
Debt/disposable income 23,9 31,8 35,6by income quartiles
1° 56,4 47,6 37,92° 30,2 40,9 35,13° 23,0 36,1 42,34° 15,3 24,4 27,8
HOUSEHOLD DEBT

Household sector: what the SHIW tells us
For mortgages the growth in participation recorded during the current decade has not extended to the lowest-income households.
The increase in the average size of mortgage loans
reflected, in particular, the increase in the loan-to-value ratio, which in 2006 reached an average of about 70 per cent.
In addition, it was possible to take out larger mortgages (lengthening of average maturity), which for contracts signed in 2006 exceeded 20 years.

Household sector: what the SHIW tells us
For consumer loans the growth in participation rates was more widespread among the different income classes.
For indebted households the median of total debt to income rose in the period of analysis.

Household sector: micro data
Source: Bank of Italy, Survey on Household Income and Wealth.(1) Payment of interest and repayment of principal only on motgage loans for the primary residence and only by households with this type of loan. Households are divided into income quartiles (ascending order). Excludes debt contracted for professional reasons.
DEBT SERVICING ON MORTGAGE LOANS BY INCOME CLASS (1)(as a percentage of disposable income; medians)
0
5
10
15
20
25
30
35
40
1995 1998 2000 2002 2004 20060
5
10
15
20
25
30
35
40
1st quartile 2nd quartile 3rd quartile 4th quartile total

Household sector: what the SHIW tells us
Debt servicing by indebted households alone can be analyzed using the data of the Survey on Household Income and Wealth. The survey has collected data on the debt servicing of mortgage loans only on households’
primary
residence since 1995.
For the median household, debt servicing costs on these loans amounted to 17 per cent of disposable income in 2006, compared with 12 per cent in 1995 and 2000.

Household sector: what the SHIW tells us
Between 2004 and 2006 the largest increase was recorded for households in the lowest income quartile, whose mortgage loan installments reached 32 per cent of disposable income; this high level had already been equaled and exceeded in previous periods (1995 and 2000).
For households with above-median income, debt servicing was close to 15 per cent of disposable income in 2006, rising with respect to the past especially for households in the top income quartile.

Household sector: risk
In 2006 the portion of households whose total debt installment amounted to 30 per cent or more of household income was 1.4 per cent (332,000 households scaled to the universe); 143,000 of these households (0.6 per cent of the total) belonged to the lowest income quartile and were among the most vulnerable to a rise in the cost of debt.
Households whose debt installment amounted to 50 per
cent or more of income numbered 93,000 (0.4 per cent of the total), including 55,000 in the lowest income quartile (0.2 per cent of the total).

Household sector: risk
Overall this evidence indicates that there are no particular signs of a deteriorating financial position of the household sector.
The quality of credit to households remains high; the ratio of new bad debts to outstanding loans was 0.8 per cent, the same as in 2006.
The expansion in the market in real-estate loans in recent years may have increased the financial vulnerability of
households, especially in the lower income brackets, but without yet being reflected in an increase in bad debts.

Household sector: risk
The rise in property prices and in the loan-to-value ratio led to an increase in the average size of new mortgages.
According to Central Credit Register data, for which the reporting threshold is €75,000, it rose from €125,000 in 2004 to €138,000 in 2007.

Household sector: risk
The increase in interest rates from the end of 2005 onwards, at a time when the proportion of variable-rate borrowing was high, was reflected in a rapid increase in households’
debt
servicing costs.
Analysis of Central Credit Register data on mortgage lending to households between 2004 and 2006 indicates that in the four years ending in 2007 3.5 per cent of borrowers were late with at least one repayment installment and that more than 1 per cent were reported as a bad or impaired debt.

Household sector: risk
The proportion of households that have difficulties in repaying the installments in a year after the contract has been signed grows for the more recent loan cohorts.
Variable rates mortgages are in general more risky than fixed rate ones.

Household sector: pricing of risk
Is the risk adequately priced?
A test using consumer loans interest rates drawn from the SHIWResearch by Silvia Magri
at the Bank of Italy
Aim of the research: verify if in Italy the prices of consumer loans, such as the loans to purchase a motor vehicle, furniture or for other purposes, are based on the specific risk of the borrower
Important issue in understanding banks’
behavior and perception of risk
Methodology:(both OLS and Heckman estimations)
Rate = f [(individual characteristics aimed at capturing individual risk
(e.g. age, employment status, income, wealth), characteristics of the local credit market
(e.g. geographical area of residence, concentration of credit markets,
efficiency of the recovery procedures)]

Household sector: pricing of risk
Is the risk adequately priced?
Results: the price charged by Italian lenders is barely influenced by the
traditional proxies of the specific risk of the borrower, such as income, net wealth, type of occupation, education, employment status, being a single parent or facing difficulties with the disposable income.
These variables are important in determining whether or not
a household has a consumer loan, but not its price.
Overall, there appears to exist different prices for few categories of products, primarily differentiated according to the residence of the borrower (a sort of background risk), the borrower being married or not (a proxy of the household income variability) and the borrower having also a mortgage (a sort of information effect).

Non financial firms: aggregate data
Main indicators used in the current analysis
leverage = debt/(debt + equity)
debt/GDP
financial expense/value added
liability composition

Non financial firms: aggregate data
Sources: Bank of Italy, ISTAT.(1) The data relate to "non-financial corporations".(2) Left-hand scale. (3) Right-hand scale. Thefigures for net interest expense are Bank of Italy estimates. Value added for 2007 is estimatedfrom national accounts data.
CORPORATE DEBT (1)(percentages)
0
15
30
45
60
75
1999 2000 2001 2002 2003 2004 2005 2006 20074,0
4,5
5,0
5,5
6,0
financial debt/GDP (2)
net interest expense/value added (3)
financial debt/(financial debt+equity) (2)
Non financial firms: aggregate data
Linking real and financial flows
Identity: S –
I = Δ
FA –
Δ
FL (theoretically)
Data on self-financing (a proxy for S) and investment drawn (estimated) from institutional national accounts
Ratio of self-financing over investment helps interpret the financial flows (external funding requirement)

Non financial firms: aggregate data
Sources: Bank of Italy, ISTAT.(1) Estimates based on national accounts data for the sector "non-financial corporations", 1999-2006. Thedata for 2007 are estimated on the basis of the national accounts for the year. Investment includes inventories.(2) Indices, 1999=100. (3) Bank of Italy estimates.
THE EXTERNAL FUNDING REQUIREMENT OF FIRMS (1) (annual data)
40
45
50
55
60
65
1999 2000 2001 2002 2003 2004 2005 2006 200740
45
50
55
60
65
Self-financing as a percentage of investment
100
120
140
160
180
200
100
120
140
160
180
200 self-financing (2) gross operating profit (2) investment (2)net interest expense (2) (3)

Non financial firms: aggregate data
Ratio of debt to GDP on an increasing trend, though lower than in other major countries (with the exception of Germany). It was 74 % in 2007.
Firms’
leverage increased in 2007 to 41 %: higher than in the euro
area and in the US but lower than in the UK.
Primarily reflecting the increase in interest rates, net interest expense rose from 5.2 per cent of value added in 2006 to 6.2 per cent last year
Composition of Italian firms’
financial debt differs from that in the other industrial countries primarily on account of lower fund-raising in the bond market
Short-term debt more important in Italy
Lower stock market capitalization

Non financial firms: micro data
Limits of the aggregate data
Need to address firms’
heterogeneity
Micro data: assess the dispersion in financial conditions
Analyze some specific features (e.g. differences
according to size, sector of economic activity, geographical location, distributive effects of tax reforms)
Specific research questions (e.g. balance-sheet
channel, firms’
listing decisions, venture capital
financing)

Non financial firms: micro data
The Company accounts database
Open sample with balance sheet and income statements for some 35,000 non-financial firms each year.
Data collected by a consortium of banks; firms enter the sample by borrowing from one of the banks in the consortium.
The sample includes a large number of unlisted companies
May be biased towards firms with multiple banking
relationships, which in turn are likely to be larger.

Non financial firms: micro data
Micro data permit to calculate the same set of indicators as the one used in the aggregate analysis plus other important variables for profitability, flow of funds and composition of assets and liabilities (e.g. tangible vs. intangible assets).
Limits of micro data: main one is the lag in updating of the information.
Historically, by looking at the main indicators, the trend is coherent with that observed at the aggregate level.
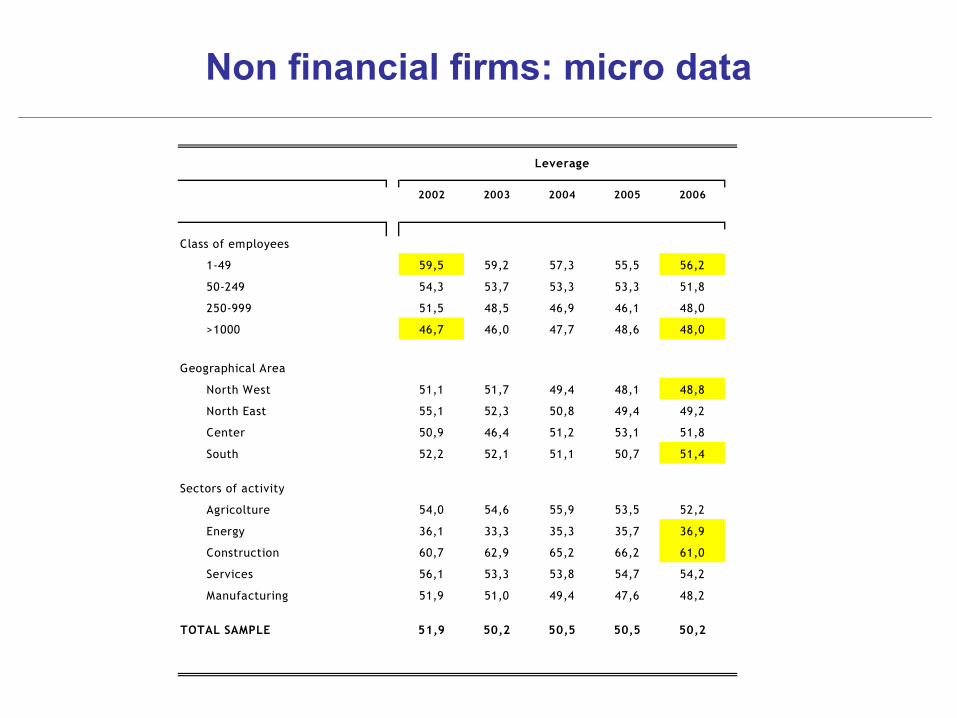
Non financial firms: micro data
2002 2003 2004 2005 2006
Class of employees
1-49 59,5 59,2 57,3 55,5 56,2
50-249 54,3 53,7 53,3 53,3 51,8
250-999 51,5 48,5 46,9 46,1 48,0
>1000 46,7 46,0 47,7 48,6 48,0
Geographical Area
North West 51,1 51,7 49,4 48,1 48,8
North East 55,1 52,3 50,8 49,4 49,2
Center 50,9 46,4 51,2 53,1 51,8
South 52,2 52,1 51,1 50,7 51,4
Sectors of activity
Agricolture 54,0 54,6 55,9 53,5 52,2
Energy 36,1 33,3 35,3 35,7 36,9
Construction 60,7 62,9 65,2 66,2 61,0
Services 56,1 53,3 53,8 54,7 54,2
Manufacturing 51,9 51,0 49,4 47,6 48,2
TOTAL SAMPLE 51,9 50,2 50,5 50,5 50,2
Leverage

Non financial firms: micro data
Heterogeneity in firms financial conditions implies that indicators based on aggregate data might hide potential vulnerabilities
We can have a stable average of the indicator (e.g leverage), but higher dispersion (see work developed on
micro data, e.g. by the Bank of Spain)
Need to document heterogeneity to detect pockets of risks
A simple way is to try to quantify the relevance of firms that can be considered “fragile”
according to some
metrics
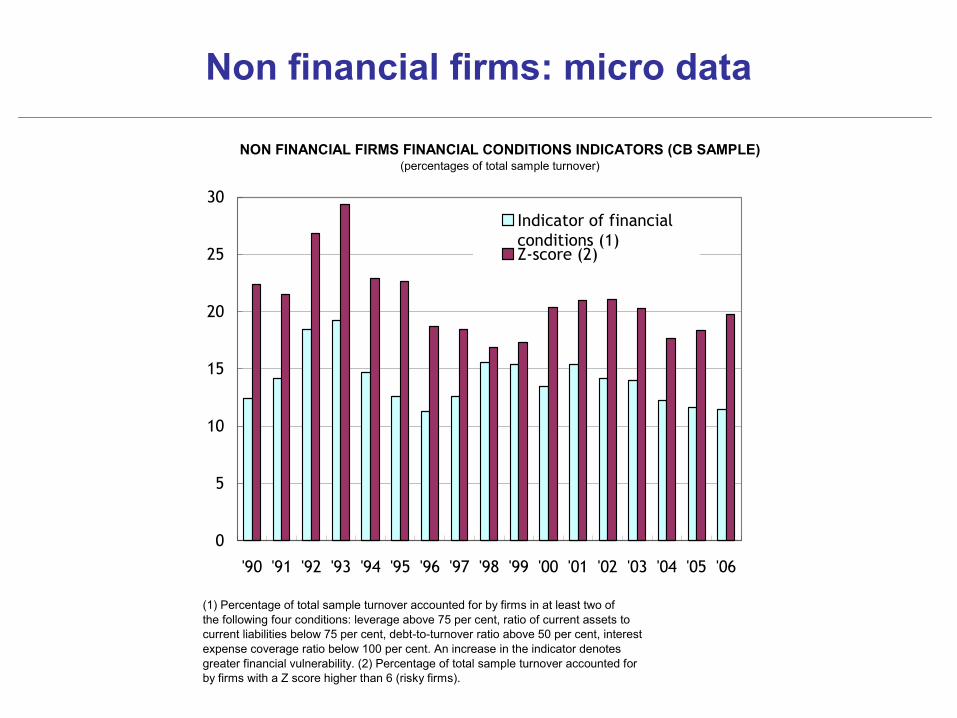
Non financial firms: micro data
(1) Percentage of total sample turnover accounted for by firms in at least two ofthe following four conditions: leverage above 75 per cent, ratio of current assets tocurrent liabilities below 75 per cent, debt-to-turnover ratio above 50 per cent, interestexpense coverage ratio below 100 per cent. An increase in the indicator denotesgreater financial vulnerability. (2) Percentage of total sample turnover accounted forby firms with a Z score higher than 6 (risky firms).
NON FINANCIAL FIRMS FINANCIAL CONDITIONS INDICATORS (CB SAMPLE)(percentages of total sample turnover)
0
5
10
15
20
25
30
'90 '91 '92 '93 '94 '95 '96 '97 '98 '99 '00 '01 '02 '03 '04 '05 '06
Indicator of financialconditions (1)Z-score (2)

Non financial firms: micro data
What micro data tell us on firms’
financial conditions
Analysis of the joint distribution of a group of balance- sheet indicators (leverage, financial debt/sales, the
coverage ratio and the ratio of short-term assets to short-term liabilities) shows that in 2006 the share over total sales of firms with at least two indicators over given (bad) thresholds was lower than in previous
recessionary periods.
The “relevance”
of firms with “bad”
Z scores decreased.

Non financial firms: micro data
Can use micro analysis to assess the probability of defaultApplication
Sample: 600,000 non-financial firms representative of 95 per cent of total lending to corporate sector matched with data on firms’
banking debt drawn from the Central credit register.
PD
= Probabilities of default (estimated by means of logit
models)
LGD = Loss given default (hypothesis=45%)
Losses = PD*LGD*Amount of loan
Estimated PD for current year were multiplied by 4 in order to reproduce the frequency of defaults of the 1993 recession
Estimated decrease in regulatory capital of 7 %

Non-financial sector balance sheets and financial stability: what can we learn from
economic research?
Andrea Generale
Banca d’ItaliaMacroprudential
Analysis DivisionPrepared for the IMF and NBR Seminar on Financial
Stability IssuesSinaia
-
Romania