noise by the numbers - noisecom
TRANSCRIPT

Noise by the Numbers

For reference level comparison, a calibrated noise
source with a flat band across a large spectrum is com-
pared to the noise floor of the instrument under test.
This is typical for spectrum analyzers, but any device
that requires an absolute noise floor for operation can
use this method. This same noise signal is used by de-
sign engineers to calculate noise figure (NF) and am-
plifier gain. This is less expensive than using a preci-
sion sweeping sine generator for these measurements.
The average temperature of the earth’s surface is ap-
proximately 62.3°F, 16.8°C, or 290°K and provides
the energy to the surrounding matter that generates
natural background noise. The thermal noise gener-
ated due to this temperature equals -174 dBm/Hz or
a few nanovolts. While these power levels are of con-
cern to astronomers and astrophysicists, most engi-
neers require higher power levels for their purposes.
The simplest source for higher power analog white
Gaussian noise is a reversed biased diode (fig 2).
Due to the quantum nature of electron-hole pairing on
a semiconductor substrate, a truly random noise signal
is generated 25 to 30 dB above the -174 dBm thermal
noise floor. These power levels are now measurable on
modern RF and Microwave equipment, like a spectrum
analyzer or Vector Network Analyzer (vna). The power
must be increased by an additional 40 to 50 dB for an
oscilloscope or Bit Error Rate Testing (bert).
The two primary applications for white noise are signal
jamming/impairment and reference level comparison.
Signal jamming/impairment is further divided into two
categories: secure signal jamming and telecommunica-
tion signal impairment. Secure signal jamming is high
power broadband noise for the purpose of disrupting
communication signals. Telecommunication signal im-
pairment is a gradual change in Signal to Noise Ra-
tio (snr) to measure the robustness of the receiving
network. This type of impairment is for coaxial and
wireless applications. Digital Engineers working with
PCIexpress, sata, or 10GigE refer to these coaxial im-
pairments as “jitter” or Rj. Wireless RF Engineers work-
ing with WiMax, wcdma, or lte consider it Eb/No or C/N.
In either case the noise requirements are the same.
What can I do with noise?
How is noise created?
1
2
-1
CATHODE
CR
+
–
FRV51
C ≥1
2πRL(fc)
RL
Typical Bias Circuit
Fig 1 Fig 2
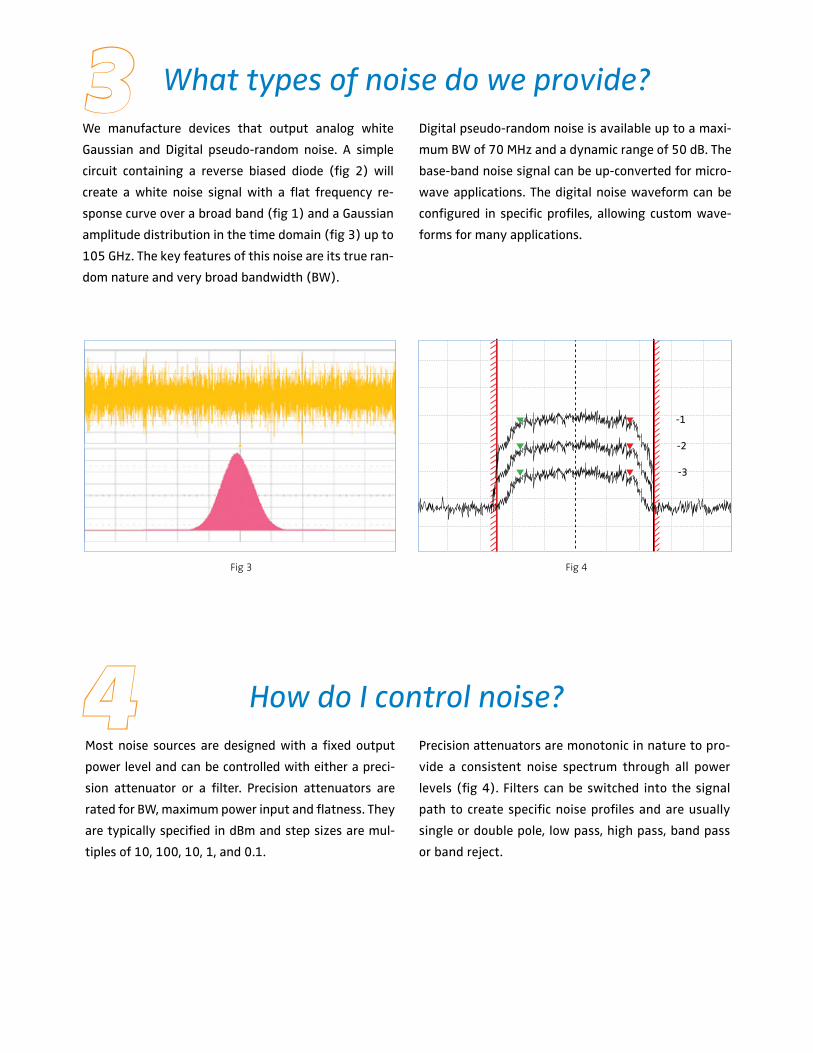
We manufacture devices that output analog white
Gaussian and Digital pseudo-random noise. A simple
circuit containing a reverse biased diode (fig 2) will
create a white noise signal with a flat frequency re-
sponse curve over a broad band (fig 1) and a Gaussian
amplitude distribution in the time domain (fig 3) up to
105 GHz. The key features of this noise are its true ran-
dom nature and very broad bandwidth (BW).
Digital pseudo-random noise is available up to a maxi-
mum BW of 70 MHz and a dynamic range of 50 dB. The
base-band noise signal can be up-converted for micro-
wave applications. The digital noise waveform can be
configured in specific profiles, allowing custom wave-
forms for many applications.
Most noise sources are designed with a fixed output
power level and can be controlled with either a preci-
sion attenuator or a filter. Precision attenuators are
rated for BW, maximum power input and flatness. They
are typically specified in dBm and step sizes are mul-
tiples of 10, 100, 10, 1, and 0.1.
What types of noise do we provide?
How do I control noise?
-1
-2
-3
Fig 3 Fig 4
3
4Precision attenuators are monotonic in nature to pro-
vide a consistent noise spectrum through all power
levels (fig 4). Filters can be switched into the signal
path to create specific noise profiles and are usually
single or double pole, low pass, high pass, band pass
or band reject.

Noisecom components include diodes, calibrated &
amplified modules, built-in-test PC board components
(through-hole, or surface mount). The diodes are avail-
able in several package types for different circuit board
requirements and range in frequency from audio to mi-
crowave bands up to 105 GHz (fig 5). Calibrated noise
modules come in several different packages and range
in BW from a few KHz to 105 GHz.
They have low power, a flat frequency band and either
a coaxial or waveguide connector. They require either a
two wire or bnc voltage input (fig 6). The NC1000A am-
plified modules have three standard form factors but
can be custom designed for a specific application. They
also require a two wire power input and have coaxial
output connectors (sma typical). They have power out-
puts up to +13 dBm and frequency ranges to 10 GHz.
What Products are available from Noisecom?
Fig 5
Fig 8
Fig 6
Fig 9
Fig 7
Fig 10
5
Noisecom programmable instruments include our gen-
eral purpose, precision snr and digital noise genera-
tors. The NC6000A manual series of instruments are
designed for direct connection to a DUT and simple
operation. They have output power to +30 dBm, BW’s
to 40 GHz and optional connectors, filters and combin-
ers (fig 7). The Noisecom 7000A remote control series
consists of the UFX, PNG and J series. They have a touch
screen gui interface and standard Ethernet remote
control capability. There are several options includ-
ing multiple sources, multiple filter paths, signal input
combiners and external outputs. Power outputs, up to
+30 dBm and BW’s to 40 GHz are available (fig 8). The
UFX EbNo is a precision signal to noise generator with
an internal power meter. The incoming user signal is
measured and combined with the appropriate amount
of noise for a selected snr value. The output snr can
be adjusted from +5 dBm to -55 dBm, with a 0.2 dB
(rss) accuracy and up to 40 GHz BW (fig 9). The digital
noise generators can produce specific profiles from a
spreadsheet-like gui or in a MatLab program. The BW is
from 10 KHz to 70 Mhz.

Choose an application
Noise signal requirements:
What is your required noise frequency band?
( KHz, MHz, GHz )
What do I need to know before purchasing a noise solution?
What is total power in dBm if my noise bandwidth
is 1 MHz to 2 GHz with a desired power spectral density
PSD = -90 dBm / Hz?
•dBm=dBm/Hz+10log(noiseBW)
•totalpower (dBm)=-90dBm/Hz+10log(2e9Hz)
•totalpower(dBm)=-90+93=3dBm
Helpful formulas for specific noise parameters
What is the enr (Excess Noise Ratio) for a module hav-
ing -130 dBm / Hz?
•PSD(dBm/Hz)=-174dBm/Hz+ENR
•ENR(dB)=174dBm/Hz–PSD(dBm/Hz)
•ENR(dB)=174dBm/Hz–130dBm/Hz
•ENR(dB)=44dB
6
7
How much power is required?
( dBm, dBmV, mV )
What form factor?
Component: Diode
Module: Calibrated or Amplified
Instrument: Manual or Programmable

Wireless Telecom Group Inc. 25 Eastmans Rd Parsippany, NJ 07054 Tel: +1 973 386 9696 www.noisecom.com
ENR Tk°
+30 dB 290290°k (-144 dBm/Hz)
0 dB 580°k (-171 dBm/Hz)
-30 dB 290.290°k (-174 dBm/Hz)
Calculating Noise Figure requires a knowledge of noise temperature, excess noise ratio (ENR) and noise power relative to 1 mW. The Noise Power Conversion Table is a graphic illustration of these relationships and is supported by mathematical definitions with example calculations.
Noise PowerThe formula: Np = kTB, equates noise power in watts to temperature in Kelvin(°K), an absolute non-negative reference scale.
Np = noise power in watts based on system BW and Boltzmann constant
k = Boltzman constant (normalizing the power to an atomic level)
B = noise BW; normalizing to 1 Hz allows the use of power spectral density (PSD) in dBm/Hz for simple calculations
T = temperature in °K
Example calculation at 290°K or ≈ 62°F (17°C)Np = (1.38065e-23)*(290°K)*(1 Hz)
Np = 4.004e-21 W/Hz
Note: 62°F, 17°C 290°K is the average tempera-ture of the surface of the Earth and is chosen to model an external antennae temperature. Using 290°K as a reference equates to a noise power value of 4.00e-21, and is easily calculated using a slide ruler.
Normalizing the noise power to 1 mW in a 50 Ω system for convenienceThe following calculation for a noise power value is normalized to 1 mW in a 50Ω system for conve-nience when using T&M equipment. It is displayed using a logarithmic scale.
Np (dBm/Hz) = 10log(4.004e-21/.001W) = -174 dBm/Hz
This value is equivalent to 50Ω resistor power output at 62°F (17°C), and is commonly used as a noise figure measurement reference point.
Deriving an Excess Noise Ratio (ENR) scaleENR is a logarithmic scale that displays the ratio of hot (Th), and cold (Tc) noise temperature val-ues for calculating noise figure. The scale range is arbitrary and based upon the selection of the lowest hot (Th) temperature chosen for the cal-culation.
ENR = (Th/Tc - 1); where Th > Tc (290°K); Th = temperature hot; Tc = temperature cold
By selecting a temperature value close to 290°K, a large ENR log scale can be calculated.
The following example references a Th of 290.290°K. Selecting this value creates a loga-rithmic scale from -30 dB to +30 dB ENR.
Example calculationsTk of 290.290°KENR = (290.290/290 - 1) = 0.001; ENR dB = 10log(.001) = - 30 dB
Tk of 580°KENR = (580/290 - 1) = 1; ENR dB = 10log(1) = 0
Tk of 290290.00°KENR = (290290/290 -1) = 1000; ENR dB = 10log(1000) = +30
Noise Power Conversion Table