noaa technical memorandum nmfs - swfsc home page · this tm series is used for documentation and...
TRANSCRIPT
U.S. DEPARTMENT OF COMMERCENational Oceanic and Atmospheric AdministrationNational Marine Fisheries ServiceSouthwest Fisheries Science Center
NOAA-TM-NMFS-SWFSC-574
NOAA Technical Memorandum NMFS
APRIL 2017
doi:10.7289/V5/TM-SWFSC-574
BREEDING SEASON DISTRIBUTION AND POPULATION GROWTH OF CALIFORNIA
SEA LIONS, Zalophus californianus, IN THE UNITED STATES DURING 1964-2014
Mark S. Lowry, Sharon R. Melin, and Jeffrey L. Laake

The National Oceanic and Atmospheric Administration (NOAA), organized in 1970, has evolved into an agency that establishes national policies and manages and conserves our oceanic, coastal, and atmospheric resources. An organizational element within NOAA, the Office of Fisheries, is responsible for fisheries policy and the direction of the National Marine Fisheries Service (NMFS).
In addition to its formal publications, NMFS uses the NOAA Technical Memorandum series to issue informal scientific and technical publications when complete formal review and editorial processing are not appropriate or feasible. Documents within this series, however, reflect sound professional work and may be referenced in the formal scientific and technical literature.
SWFSC Technical Memorandums are accessible online at the SWFSC web site (http//swfsc.noaa.gov). Print copies are available from the National Technical Information Service, 5285 Port Royal Road, Springfield, VA 22151 (http://www.ntis.gov).
NOAA-TM-NMFS-SWFSC-574
U.S. DEPARTMENT OF COMMERCE Wilbur L. Ross, Secretary of CommerceNational Oceanic and National Oceanic and Atmospheric Atmospheric AdministrationBenjamin Friedman, Acting NOAA Administrator
National Marine Fisheries ServiceSamuel D. Rauch III, Acting Assistant Administrator for Fisheries
NOAA Technical Memorandum NMFSNOAA Technical Memorandum NMFSThis TM series is used for documentation and timely communication of preliminary results, interim reports, or special purpose information. The TMs have not received complete formal review, editorial control, or detailed editing
doi:10.7289/V5/TM-SWFSC-574
APRIL 2017
BREEDING SEASON DISTRIBUTION AND POPULATION GROWTH OF CALIFORNIA SEA
LIONS, Zalophus californianus, IN THE UNITED STATES DURING 1964-2014
1 - NOAA Fisheries, Southwest Fisheries Science Center, 8901 La Jolla Shores Drive, La Jolla, CA 920372 - Marine Mammal Laboratory, Alaska Fisheries Science Center, 7600 Sand Point Way N. E. Seattle, WA 98115-0070
Mark S. Lowry1, Sharon R. Melin2, and Jeffrey L. Laake2,
1
ABSTRACT
Breeding-season distribution and population growth rate of California sea lions (Zalophus
californianus) in the U.S. population are estimated from counts of pups and non-pups collected
during 1964 to 2014. Pup and non-pup count data were compiled from published and
unpublished sources. These data showed that during this period the U.S. count of live-pups
increased at an average annual rate of 4.7% per year (L95% CI=4.2%, U95% CI=5.2%).
Average annual growth rates of live-pup counts at the four main island-rookeries in southern
California (Santa Barbara Island, San Clemente Island, San Nicolas Island, and San Miguel
Island; hence fore referred to as the Main Channel Islands) ranged from 4.2% to 5.5% from 1964
to 2014. The Channel Islands count of non-pups (non-pup counts were unavailable for the entire
U.S. population prior to 2003) increased at an average annual growth rate of 2.8% per year
(L95% CI=2.4%, U95% CI=3.4%). San Nicolas Island and San Miguel Island were the largest
rookeries in the U.S. population, both having the most pups and non-pups. Prior to 1990, 59.2%
of live pups counted in the Channel Islands were on San Miguel Island, and 32.4% were on San
Nicolas Island. After 1990, these islands constituted 44.9% and 45.6% of Channel Island pups,
respectively. California-wide surveys conducted during 2003-2005, 2007, and 2011-2013
indicated that the Main Channel Islands rookeries accounted for 99.71% of live pups counted in
California and 77.35% of hauled-out non-pups in California during the breeding season. Sea lion
counts were modeled (using generalized linear modeling) as a function of sea level height at Los
Angeles, California (SLH-LA), Pacific Decadal Oscillation (PDO), North Pacific Gyre
Oscillation (NPGO), and Multivariate El Niño Index (MEI). This model indicated that more
pups were produced during cold-water conditions and fewer pups were produced during warm-
water conditions, and that fewer non-pups were present at southern California rookeries during
warm-water conditions and more were present during cold-water conditions.
2
INTRODUCTION
California sea lions (Zalophus californianus) are distributed from central Mexico to
Alaska. The primary California sea lion (CSL) rookeries in the United States (U.S.) are located
at the Channel Islands in southern California (Figure 1) and are separated by approximately 600
km from the primary rookeries of western Baja California, Mexico. The U.S. and Mexico
populations are genetically distinct (Schramm et al., 2009). Although mixing of individuals
occurs within their range, it is hypothesized that philopatric behavior, physical oceanography,
and foraging behavior are responsible for creating five genetically distinct stocks of the species
(Schramm et al., 2009). Schramm et al. (2009) called the U.S. population the Pacific Temperate
population, but here CSLs found in the U.S. during the breeding season will be referred as the
U.S. population.
The number of CSLs in southern California expands and contracts during various times
of the year as individuals from Mexico enter and leave the area and as individuals from the
Channel Islands in southern California migrate southward into Mexico or northward as far as
British Columbia, Canada (Bartholomew, 1967; Mate, 1975; Bonnell et al., 1980, 1983; Bigg,
1988; Huber, 1991) and Alaska (Maniscalco et al., 2004). Sexually mature CSLs return to a
rookery in the summer for pupping and breeding. Rookeries on four of the Channel Islands
(Santa Barbara Island [SBI], San Clemente Island [SCI], San Nicolas Island [SNI], and San
Miguel Island [SMI]; Figure 1) are the reproductive center of the U.S. population (Lowry and
Maravilla-Chavez, 2005). Although a few births occur at Anacapa Island, Santa Catalina Island,
Año Nuevo Island, and the Farallon Islands (Figure 1) or various other sites in central California
(Pierotti, et al., 1977; Keith, et al., 1984; Lowry and Maravilla-Chavez, 2005), these sites did not
qualify as rookeries previously because fewer than 50 pups were produced at those sites. Since
2007, the accepted definition of a pinniped rookery is one where >50 pups are born annually
(Pitcher et al., 2007).
The CSL breeding season at rookeries in the U.S. begins in mid-to-late-May when full-
term pups are born, and sub-adult and adult males arrive at the rookery. Adult females are
generally year-round residents at the rookeries. Juveniles are present at rookeries year round, as
well as at other haulouts throughout California. The number of newborn pups and adult males
present at southern California rookeries reaches maximum on or about July 2 (Heath and Francis,
1983, 1984; Stewart and Yochem, 1984, 1986). Soon after that date, the numbers of pups

3
decrease due to mortality and sub-adult and adult males begin to depart the rookery, leaving
adult females at the rookery to forage in local waters and raise their pups. Many sub-adult males
and adult males remain at the rookeries until late July, but most migrate north by early-to-mid-
August.
Records of historic exploitation and distribution were compiled from the literature and
personal communications by Helling (1984), Cass (1985), and Seagars et al. (1985). Extensive
hunting of CSLs for their oil and hides took place in the middle 1800's resulting in population
declines (Bonnot, 1928). Sea lions were protected by California laws passed in 1909 and 1927,
but only in certain regions of the state (Bonnot, 1928). Until the Marine Mammal Protection Act
(MMPA) became law in 1972, CSLs continued to be hunted for pet food, hides, trimmings,
display (public and scientific), sport, and bounty; and also were killed to reduce fishery
depredation and for target practice. It is assumed that when the MMPA was passed in 1972, the
population size was below pre-exploitation levels, but to what extent cannot be determined from
historical records.
The first documented counts of CSLs in California were made in 1927 and were
continued intermittently until the mid-1970s, after which annual counts were made for most
years (Bonnot, 1928, 1931, 1937, 1938; Bureau of Marine Fisheries, 1938; Bonnot and Ripley,
1948; Bartholomew and Boolootian, 1960; Ripley et al., 1962; Carlisle and Aplin, 1966, 1970,
1971; Frey and Aplin, 1966, 1970; Bonnell et al., 1980; Lowry and Maravilla-Chavez, 2005).
Pups at all four major Channel Island rookeries were first counted during the breeding-season in
1964 (Odell, 1971). The counts were made by biologists on the ground or in small boats and
from black-and-white or color photographs taken with small-format and large-format aerial
cameras which were either hand-held for oblique photography or mounted vertically inside the
aircraft (Table 1).
A complete census of CSLs using counts of hauled-out individuals is not possible
because not all age classes are ashore at the same time. In the 1980’s counts of pups became the
principal age class used for monitoring the CSL population in the U.S. because it is the only age
class available for a complete census (DeMaster et al., 1982; Boveng, 1988; Lowry et al., 1992;
Lowry and Maravilla-Chavez, 2005). Newborn pup counts have been used to estimate total
population size (using a life table model to extrapolate abundance for the other age classes) and
to estimate population growth rates (Boveng, 1988; Lowry et al., 1992; Lowry and Maravilla-

4
Chavez, 2005). Although pups were sometimes surveyed in June before all were born, most
surveys were conducted in July, and sometimes in August, after virtually all births had occurred.
The slightly inconsistent timing of surveys adds measurement error to the time series in the sense
that the fluctuations in the annual count data are in part due to variation in the survey timing
rather than true variation in pup production.
In the 1980’s ground counts of CSL pups was the primary method used for estimating
pup abundance, but large groups of them could not be counted accurately and either a large
workforce would be required or a long time-period would be needed to count them over a wide
geographical area. In 1987, researchers at the Southwest Fisheries Science Center (SWFSC)
developed aerial photographic survey methods using a 126-mm-format surplus military
recognizance camera mounted inside a low flying aircraft to census northern elephant seals
(Mirounga angustirostris), Steller sea lions (Eumetopias jubatus), and CSLs (Lowry et al., 1996;
Westlake et al., 1997; Lowry, 1999). Counts of CSL pups at San Nicolas Island during 1992-
1994 from aerial color photographs taken with this camera were shown to be as accurate (and in
some cases more accurate) than ground counts (Lowry, 1999). Subsequently, aerial
photographic surveys became the primary method used to census CSLs and other pinniped
species in the U.S.
Here, counts of CSLs in the U.S. population during the CSL breeding season are
summarized for 1964 to 2014. Pup and non-pup count data from published sources were
compiled with previously unpublished data collected by the NOAA Southwest Fisheries Science
Center and Alaska Fisheries Science Center (AFSC). A method is presented for correcting live-
pup counts that were made prior to the maximum or peak count to obtain annual pup estimates
that are more comparable through time. This paper provides estimates of U.S. CSL population
growth rates from counts of live pups and non-pups during 1964-2014 and describes
geographical distribution of CSLs in California during the breeding season.
METHODS
Survey methods
CSL surveys were first designed to count every pup, and later included other age/sex
classes present on land. Surveys were conducted primarily via ground counts through the mid-

5
1980s. A mix of ground counts and aerial photographic survey methods were used through the
1990s and 2000s. Ground count data was used in the analysis when aerial photographic count
data was not obtained.
For ground counts, CSLs were tallied by biologists on the ground using mechanical hand-
counters; animals were observed directly or through a hand-held binocular or tripod-mounted
spotting scope. Ground counts were made by one or more biologists over several days,
depending on the size of the island. Because the counts were conducted when pups were too
young to swim, double counting on subsequent days was not a concern for pups. However,
movement of non-pups does occur, so we assume that their rate of movement during the survey
period is constant within a rookery, between islands, and between wide geographical areas. At
SBI, sea lions were also counted from a small boat 20-30 meters offshore. Ground and boat-
based counts at SBI, SCI, and SNI were made in a manner that would minimize disturbance to
sea lions. Disturbance counts of CSL pups were required at SMI in some areas that were not
countable from a distance. In these areas, biologists herded pups into small groups and counted
them as the pups streamed out of the herd.
For aerial photographic counts, CSLs were counted from vertical aerial photographs
taken with a high-resolution aerial film camera during 1987-2009 or with a digital single lens
reflex (DSLR) camera during 2011-2014. Aerial photographic surveys were conducted with a
twin-engine, high-winged Aero Commander Twin 500B (1991-1994 aerial photo surveys of Año
Nuevo Island) or with a Partenavia P-68 (1992-1993) or Partenavia P-68 Observer model aircraft
(1987-1990 and 1994-2014). The glass nose of the Partenavia P-68 Observer model aircraft
provided the pilot with excellent forward and downward views for aligning the aircraft over
beaches or rocks and became the preferred aircraft for aerial photographic surveys of CSLs.
Aircraft were flown at a ground speed of 185 km/h (100 knots) and at an altitude of
approximately 213 m (700 ft) during 1987 to 2009 or approximately 244 m (800 ft) during 2011
to 2014, except at the Farallon Islands and SBI where the aircraft was flown at approximately
396 m (1300 ft) to prevent disturbance to nesting seabirds. The low altitude and lens
configuration (see below) ensured that CSLs could be detected on rocky substrates (especially
when animals were wet and consequently darkly colored), aided in identification of different
pinniped species and CSL age/sex classes, and enabled accurate counts from aerial photographs.
All CSLs onshore were photographed. The aircraft was flown directly over the coastline or

6
slightly offshore or inshore to locate and photograph sea lions onshore. Multiple overlapping
photographic passes were made over large rocks or portions of coastlines and beaches to ensure
that all hauled-out CSLs were photographed. Surveys were made without regard to tidal
conditions and at any time of day between approximately 2 hours after sunrise and 2 hours
before sunset. Aerial photographic surveys of CSLs in California took one to two weeks to
complete.
Prior to the use of digital cameras in 2011, sea lions were photographed with a 126-mm-
format Chicago Aerial Industries, Inc. KA-45A or KA-76 military recognizance camera
equipped with forward motion compensation and operated at a cycle rate that achieved 67%
overlap between adjacent frames. The location of each photograph was recorded by linking the
camera to a laptop computer and Global Positioning System (GPS) receiver. The camera was
attached to a gimbal camera-mount placed vertically over a camera port inside the aircraft and
was manually leveled with a bubble level to obtain a vertical image. A 152-mm-focal-length
lens was used for low altitude photography (i.e., altitude of approximately 213 m [700 ft]) and a
305-mm-focal–length lens was used for higher altitude photography (i.e., altitude of
approximately 396 m [1300 ft]). The camera was set at an aperture of f/5.6 with a shutter speed
between 1/400 second and 1/3000 second. Three types of film were used: (1) Kodak
Aerochrome MS Film 2448, a very fine-grained, medium-speed, color transparency, film was
used during 1987-1999, (2) Aerochrome HS Film SO-359, a very fine-grained, high-speed, color
transparency film was used during 1997-2005, and (3) KODAK Aerochrome III MS Film 2427,
a very fine grained, medium-speed color-reversal aerial film was used during 2003-2009.
Two different DSLR cameras were used during 2011-2014. During 2011through 2013,
CSLs were photographed with a Canon EOS 1Ds Mark III, full-frame 21.1-megapixel DSLR
camera having a Zeiss 85-mm-focal-length lens for photographing at an altitude of
approximately 244 m (800 ft) or a Canon 135-mm-focal-length lens for photographing at an
altitude of approximately 396 m (1300 ft) altitude. In 2014, CSLs were photographed with a
Canon EOS 5D Mark III, full-frame 22.3-megapixel DSLR having a Zeiss 85-mm-focal-length
lens for photographing at an altitude of approximately 244 m or a Zeiss 135-mm-focal-length
lens to photograph CSLs from 396 m altitude. Image motion compensation was achieved using a
custom-made rocking mechanism in the camera mount (manufactured by Aerial Imaging

7
Solutions1). The focus ring of the 85mm lens was immobilized with tape when focused at
approximately 244 m and the 135 mm lens was taped when focused at approximately 396 m. A
laptop computer was connected to the camera, a GPS receiver, radar altimeter, and controlled the
camera’s forward motion compensation mechanism. A video camera and monitor provided a
view through the camera’s viewfinder which allowed the operator to see what was being
photographed. For each photograph, the computer recorded the geographical position, date and
time the photograph was taken, altitude from the GPS and radar altimeter, lens being used, and
ground speed of the aircraft in a comma separated variable (csv) text file. The DSLR camera
was attached to a gimbal camera-mount placed vertically over a camera port inside the aircraft
and the camera was manually leveled at the vertical position with a bubble level. The computer
controlled all camera functions. Camera aperture was set at f/5.6 in aperture priority shooting
mode and shutter speed was set at or above 1/800 second by changing the ISO image sensor
setting between 100 and 1000. Photographs were overexposed by +1/3 f-stop (for sunny
condition) or +2/3 f-stop (for overcast condition). White balance in the camera was set on
automatic, and all photographs were taken in JPEG image file format set at fine image quality
and at 3:2 aspect ratio. The camera was operated at a cycle rate that achieved 40% overlap
between adjacent photographs, and occasionally at 60% overlap for short photographic passes.
CSLs in 126-mm-format transparencies were counted through a 7-70X zoom binocular
microscope as the photographs were back-illuminated on a light table. Images of animals were
counted and marked on a clear acetate overlay with a different colored pen for each age/sex class
category (see “Age-sex classes counted” below). Marks on the acetate were compared and
verified with overlapping photographs. If all animals could not be counted in one photograph,
the overlay was placed on another photograph at the exact location where the count ended
previously and the count continued on the uncounted portion. Sea lions swimming in the water
within approximately 30 meters of land were included in the count.
CSLs in digital photographs were counted in a two-step process: creation of mosaics
from merged photographs and counting CSLs in the mosaics. Adobe Bridge CS5 was used to
review and select digital photographs, and to initiate the photo-merging process. Adobe
Photoshop CS5 Extended, version 12.1 x64 on Windows 7 64-bit operating system, received
photographs from Adobe Bridge CS5 and was subsequently used to create photographic mosaics
1 Aerial Imaging Solutions, LLC, 5 Myrica Way, Old Lyme, CT 06371. [email protected]
8
from multiple overlapping digital photographs of a beach-section or rock within the Adobe
Photoshop software screen on a 24-inch or 27-inch Dell ultra-sharp computer monitor.
Photographs were merged together manually using the move tool and transpose tools. Under-
exposed or over-exposed images were brightened or darkened with image tools in Adobe
Photoshop. The brush tool was used to draw a line to separate and mark animals and to code
areas on the mosaic that would be counted. Adjacent mosaic files of photographs were
compared, and a brush-line was inserted onto the mosaic to separate counted animals from
uncounted ones, or to mark areas where animals should be, or not be, counted. Age/sex class
categories for counting were manually entered into the count tool of Adobe Photoshop Extended,
each animal was marked with a unique colored dot and number using the computer mouse, and
the software maintained a running total of each age/sex class category.
The number counted for each age/sex class category were entered into a Microsoft Excel
spreadsheet along with other metadata for the counts (e.g., date, time photo was taken location,
area codes) and then converted into a Microsoft Access data-table in a database.
Two types of surveys were conducted over the study period: pup counts and total
population counts. Surveys focused on counting pups covered all areas where pups were born
and covered a smaller area than surveys focused on counting all animals in the population which
included breeding and haulout areas. California-wide surveys for total population counts
(excluding the continental coastline of southern California) were conducted in 2003-2005 and
2011-2013 to document breeding season distribution of CSLs within the state and estimate total
numbers of CSL for seven age-sex classes.
Age-sex classes counted
When the AFSC census of CSLs began in 1971 and by SWFSC in 1981, the primary
objective was to census live-pups because pup counts were to be used for estimating population
growth rate, population abundance, and to determine population status. While SWFSC
biologists counted live-pups, counts were also made of all “non-pups” which included all age/sex
classes except pups. The category “adult males” was first included in counts in 1986. Starting in
1992, CSL counts at all breeding areas and non-breeding haulout areas were expanded to include
seven age-sex class categories:
9
1) Live-pup: Newborns, very small compared to other age/sex classes, dark to lite brown in
color when dry, black when wet, short neck and muzzle.
2) Dead pup: Pups that are decomposing, are bloated, partially covered with sand, have a
western gull (Larus occidentalis) eating it, or which are lying on their side with the head
bent back toward the spine as a result of rigor mortis.
3) Juvenile: Larger than live-pups, about one-fourth to two-thirds the length of an adult
female with brown or lite brown hair, elongated neck and muzzle. Sometimes found
suckling on adult female or lying next to one.
4) Adult female: When dry, most often pelage will be blond in color, but sometimes are
dark brown. They are dark grey when wet. Cranial sagittal crest is not present.
5) Young male: They are approximately the same size as an adult female. Cranial crest has
not begun to develop, dark brown or charcoal color. During breeding season rarely if
ever found within groups of breeding adult females but will be found at the periphery of
adult female groups or will be within groups of “bachelor” males or juveniles. When in
tide pools they will bark like an adult male and will play-fight with similar sized sea
lions.
6) Sub-adult male: Sagittal crest is present and may or may not be fully formed; tuft of
white hair on sagittal crest may or may not be present. Pelage is dark brown to grey in
color. They do not have a wide chest and neck, and are larger than an adult female.
7) Adult male: Sagittal crest is fully formed and has tuft of white hair. Pelage is dark
brown to grey in color. Has a wide chest and neck. Will often be patrolling a territory
when in water or on land during the breeding season. When stationary or near vertical in
the water, the tuft of white hair on the sagittal crest will be visible.
Study areas, 1971 - 2014
A posteriori geographic strata were created (Figure 1A) for summarizing counts. The
California coast was divided into three sections: (1) southern California, which includes the
continental coast and all Channel Islands (the Coronado Islands, which are in Mexico, were not
included); (2) central California, which includes the continental coastline, offshore rocks, and
islands between Point Conception (34° 26.8' N, 120° 28.0' W) and Point Reyes (38°00.0' N,
123°00.0' W) and San Francisco Bay estuary; and (3) northern California, which includes the
10
continental coastline, offshore rocks, and islands between Point Reyes and the California-Oregon
border (42° 0' N, 124° 12.7 W). Secondary, smaller strata within each California section were
created as follows: (1) Central and northern California were stratified into 7 zones (zones A, B,
and C in northern California; zones D, E, F, and G in central California; see Lowry and Forney,
2005); and (2) southern California was stratified into two zones with one zone consisting of the
four principal CSL Channel Island rookeries (referred to as the Main Channel Islands and
include SBI, SCI, SMI, and SNI) and the other zone having the remaining islands and rocks
(referred to as the Other Channel Islands). The continental coast within the southern California
section was not surveyed due to too extremely low abundance of CSLs in that area and safety
concerns of flying at low level in a large metropolitan coastal area. Counts were also
summarized separately for each Channel Island. The Farallon Islands were divided into South
Farallon Islands and North Farallon Islands. Within San Francisco Bay Estuary, only CSLs at
Pier 39 in San Francisco (37° 48.6' N, 122° 25.2' W) were surveyed during central California
surveys.
CSL ground surveys at SMI by AFSC began in 1971 and aerial photographic surveys at
SMI by SWFSC began in 1987 (Table 1; Figure 1B). In most years, AFSC ground surveys were
also conducted at Castle Rock, a sub-island located 1 km offshore of SMI. Although aerial
surveys at SMI by SWFSC began in 1987, ground counts by AFSC continued to be conducted
annually to ensure uninterrupted data collection. When aerial survey data were available they
were used for estimates of CSLs at SMI to provide consistency in analysis among areas. While
AFSC ground counts were only made of pups, SWFSC aerial photographic counts also included
other age/sex classes.
CSL ground and aerial photographic surveys at the Channel Islands in southern
California by SWFC began at SCI in 1981and were later expanded to include other islands in
southern California and the continental coastline of central and northern California (Table 1;
Figure 1B). Año Nuevo Island and the Farallon Islands, in central California, were included in
aerial photographic surveys in 1992 and 1995, respectively (Table 1; Figure 1C). The
continental coastline in central California and northern California between Point Conception,
California and the California/Oregon border was included in aerial photographic surveys in 1998
(Table 1; Figure 1A). At SCI, CSL ground surveys were conducted along the western shoreline
between Seal Cove (32° 54.5’ N, 118° 32.3’ W) and 2.2 km south of Mail Point (32° 52.1’ N,
11
118° 30.4’ W) where all CSL pups at that island are born; aerial photographic surveys included
the entire island (however, sometimes the entire island was not accessible due to naval
operations). Aerial photographic surveys of SNI covered the entire island and ground surveys
covered the southern shoreline between Point Vizcaino (33° 16.7’ N, 119° 34.6’ W) and East
End Sand Spit (33° 17.8’ N, 119° 25.9’ W) where CSLs occurred. At SBI, ground surveys and
small-boat surveys were conducted during 1983-1998 and aerial photographic surveys were
conducted during 1997-2014.
Population Growth Rates and Trends
Population growth rates and trends were examined by combining data collected by AFSC
and SWFSC during 1971-2014 (Lowry et al., 1987; Oliver and Lowry, 1987; Oliver et al., 1988;
Wexler and Oliver, 1988; Oliver, 1991a, 1991b; Oliver and Wexler, 1991; Lowry, 1999; Carretta
et al., 2000; Lowry and Maravilla-Chavez, 2005; M. Lowry and S. Melin, unpublished data;
Table 2, 3, and 4) with published data collected by other biologists during 1964-1987 (Carlisle
and Aplin, 1966; Peterson and Bartholomew, 1967; Odell, 1971, 1972; Bonnell et al., 1980,
1983; Heath and Francis, 1983, 1984; Stewart and Yochem, 1984, 1986; Francis and Heath,
1991; Stewart et al., 1993; Table 5). Two corrections to live-pup count data were made:
1. Castle Rock correction at SMI: CSL live-pups at Castle Rock, a small sub-island just
off SMI, were not counted in every year, but Castle Rock is considered part of the SMI
CSL colony. When both Castle Rock and SMI were censused, SMI represented an
average of 0.962 of the total for the two sites. The inverse of 0.962 (1/0.962=1.04)
provided a multiplier that was applied to the years when Castle Rock was not censused
to estimate total live-pups for the combined rookery during 1971, 1972, 1978, and 1981-
1984.
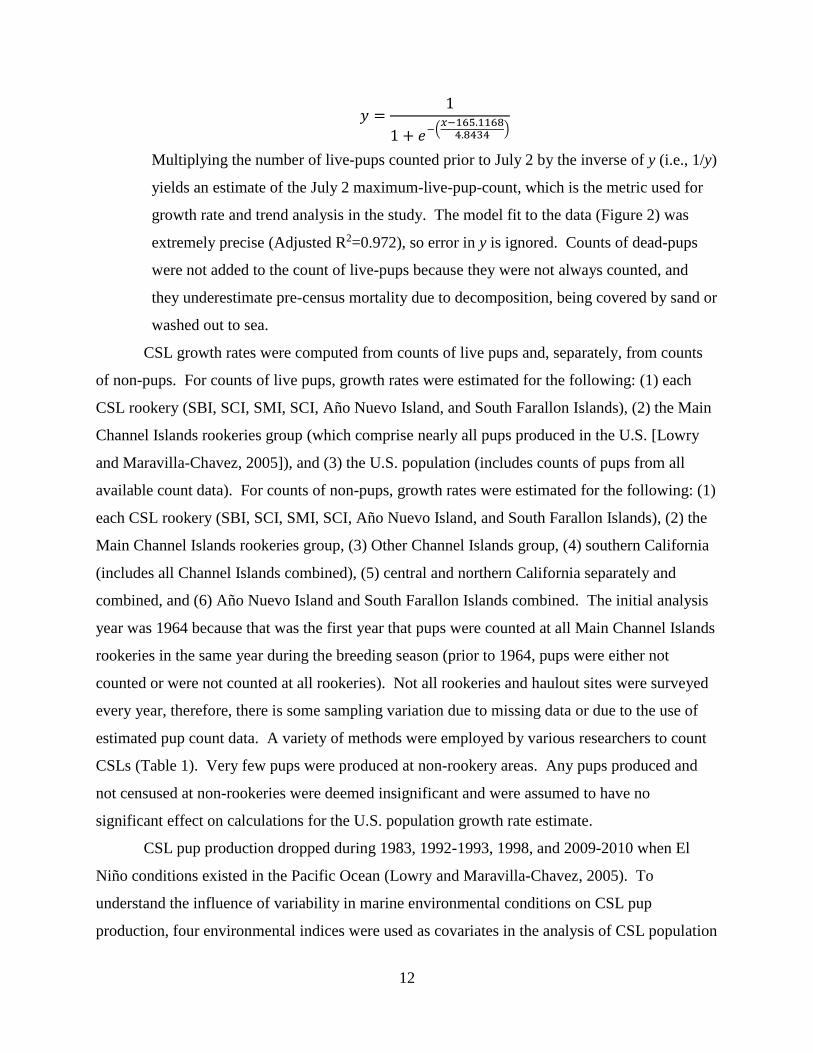
2. Correction to counts of live-pups made prior to the peak count date of July 2: Heath and
Francis (1983, 1984) and Stewart and Yochem (1984, 1986) provide a series of CSL
live-pup counts made during the May-July breeding season (Table 6). The proportion of
the maximum-live-pup-count was calculated for each count, year, and source. Logistic
regression analysis (Figure 2) was used to obtain the following model describing the
relationship between Julian date (x) and relative pup count levels (as a proportion of the
maximum counts expected around July 2):
12
𝑦 =1
1 + 𝑒−(𝑥−165.1168
4.8434)
Multiplying the number of live-pups counted prior to July 2 by the inverse of y (i.e., 1/y)
yields an estimate of the July 2 maximum-live-pup-count, which is the metric used for
growth rate and trend analysis in the study. The model fit to the data (Figure 2) was
extremely precise (Adjusted R2=0.972), so error in y is ignored. Counts of dead-pups
were not added to the count of live-pups because they were not always counted, and
they underestimate pre-census mortality due to decomposition, being covered by sand or
washed out to sea.
CSL growth rates were computed from counts of live pups and, separately, from counts
of non-pups. For counts of live pups, growth rates were estimated for the following: (1) each
CSL rookery (SBI, SCI, SMI, SCI, Año Nuevo Island, and South Farallon Islands), (2) the Main
Channel Islands rookeries group (which comprise nearly all pups produced in the U.S. [Lowry
and Maravilla-Chavez, 2005]), and (3) the U.S. population (includes counts of pups from all
available count data). For counts of non-pups, growth rates were estimated for the following: (1)
each CSL rookery (SBI, SCI, SMI, SCI, Año Nuevo Island, and South Farallon Islands), (2) the
Main Channel Islands rookeries group, (3) Other Channel Islands group, (4) southern California
(includes all Channel Islands combined), (5) central and northern California separately and
combined, and (6) Año Nuevo Island and South Farallon Islands combined. The initial analysis
year was 1964 because that was the first year that pups were counted at all Main Channel Islands
rookeries in the same year during the breeding season (prior to 1964, pups were either not
counted or were not counted at all rookeries). Not all rookeries and haulout sites were surveyed
every year, therefore, there is some sampling variation due to missing data or due to the use of
estimated pup count data. A variety of methods were employed by various researchers to count
CSLs (Table 1). Very few pups were produced at non-rookery areas. Any pups produced and
not censused at non-rookeries were deemed insignificant and were assumed to have no
significant effect on calculations for the U.S. population growth rate estimate.
CSL pup production dropped during 1983, 1992-1993, 1998, and 2009-2010 when El
Niño conditions existed in the Pacific Ocean (Lowry and Maravilla-Chavez, 2005). To
understand the influence of variability in marine environmental conditions on CSL pup
production, four environmental indices were used as covariates in the analysis of CSL population

13
growth rate: (1) the Pacific Decadal Oscillation (PDO), a large-scale ocean-atmospheric cycle
that affects productivity in the Pacific ocean (Mantua et al., 1997), (2) North Pacific Gyre
Oscillation (NPGO), a basin-scale ocean-atmospheric cycle that affect the north Pacific ocean
and is out of phase with the PDO (Di Lorenzo et al., 2008), (3) Multivariate El Niño Index
(MEI), a measure of the El Niño Southern Oscillation cycle at the equator (Wolter and Timlin,
1993), and (4) sea level height at Los Angeles, California harbor (SLH-LA) with its seasonal and
linear trends removed so as to index anomalies, as a local measure of environmental conditions
(Zervas, 2009). PDO values were obtained from The Pacific Decadal Oscillation website
(http://research.jisao.washington.edu/pdo/data; accessed on May 25, 2016). NPGO values were
obtained from the North Pacific Gyre Oscillation website (http://www.o3d.org/npgo/; accessed
on 20 May 2016). MEI values were obtained from NOAA Earth System Research Laboratory,
Physical Science Division website (http://www.esrl.noaa.gov/psd/enso/mei/index.html#Home,
last accessed February 22, 2016). SLH-LA values were obtained from NOAA Center for
Operational Oceanographic Products and Services website
(http://tidesandcurrents.noaa.gov/sltrends/sltrends.html; last accessed March 21, 2016). The
October-to-May mean was calculated for each covariate because those months corresponded to
the gestation period of CSLs and environmental conditions that affect prey available to pregnant
females during this period would affect the annual birth rates. Log-transformed live-pup counts
and (separately) non-pup counts were modeled as functions of year, PDO, NPGO, MEI, and
SLH-LA, using a backward-stepwise Generalized Linear Model (GLM) with a normal/Gaussian
error assumption in Systat 13.00.05 64-bit for Windows software. Rookeries having zero values
had a 1 added, as per Sokal and Rolf (1995), to all values before being log transformed to
prevent zero data from being eliminated in the analysis. The stepwise GLM model removed
insignificant covariates (p>0.05). The annual rate of increase (λ) was calculated as er where r is
the year coefficient of the GLM analysis (Eberhardt and Simmons, 1992). The 95% confidence
interval for the year coefficient was used to estimate the 95% CI for λ. The average annual
growth rate was calculated separately for counts of live pups and counts of non-pups. Average
percentage annual growth rate is computed as %= (λ-1)*100.

14
RESULTS
From 1964 to 2014, counts of CSL live-pups in the U.S. population increased from 6,113
to a high of 67,398 in 2012 and counts of non-pups in southern California increased from 29,875
to a high of 95,814 in 2013 (Figure 3). The California wide total count of non-pups was between
91,772 (in 2003) and 113,141 (in 2013; Figure 3). In 2012 there were 169,813 CSLs (pups +
non-pups) counted in California (excluding the continental coastline of southern California;
Figure 4). This does not represent the full CSL population size because many non-pups were at
sea and, thus, unavailable for counting. During the CSL breeding season, southern California
had the most CSLs by age/sex class categories, followed by central California and northern
California (Tables 2, 3, and 4; Figure 5). SNI and SMI were the largest rookeries in the U.S.
population, having the most pups and non-pups (Tables 2, 3, 4, and 5; Figure 6A and 6B). Prior
to 1990, 59.2% of live pups counted in the Main Channel Islands rookeries were at SMI and
32.4% were at SNI (Figure 7A). After 1990, 44.9% of live pups were at SMI and 45.6% were at
SNI. The percentage distribution of non-pups amongst the Main Channel Islands rookeries and
the Other Channel Islands did not change over the years with SMI having the highest proportion
(~50%; Figure 7B).
In years when all the California study areas were surveyed, 99.71% (SD=0.239) of pups
counted were at the Main Channel Islands rookeries; 0.29% (SD=0.197) were in central
California; 0.05% (SD=0.044) were at Other Channel Islands; none were in northern California
(Table 7). Counts of non-pups at the Main Channel Islands rookeries averaged 77.35%
(SD=5.040) of the California totals, with 2.40% (SD=1.378) found at Other Channel Islands,
18.96% (SD=3.675) in central California, and 1.29% (SD=1.770) in northern California. Those
surveys also showed that San Miguel Island and San Nicolas Island had the greatest percentage
of each age/sex class within the state (Table 8).
CSLs were not uniformly distributed in central and northern California (Table 3, Figure
5). More pups were produced at Año Nuevo Island (mean=35; SD=35) and South Farallon
Islands (mean=53; SD=60), located within zones D and E, respectively, than at other zones
(Tables 3 and 4). Beginning in 2009, more than 50 pups were counted at Año Nuevo Island and
South Farallon Islands, qualifying them as new rookeries. Zone E had the most non-pups
(mean=7,539; SD=3,121), followed by zone G (mean=6,066; SD=2,866) and D (mean=5,027;
SD=2,816). Northern California zones A, B, and C had very few CSLs compared to central
15
California zones (D through G).
From 1964 to 2014, the U.S. count of live-pups and the count of live pups at the Main
Channel Islands rookeries, increased at an average annual growth rate of 4.6% per year (L95%
CI=4.1%, U95% CI=5.1%; Table 9). For the same period, the southern California count of non-
pups increased at an average annual growth rate of 2.8% per year (L95% CI=2.4%, U95%
CI=3.4%) and that of the Main Channel Islands rookeries increased at 2.9% per year (L95%
CI=2.5%, U95% CI=3.4%); Table 9). Average annual growth rates from live-pup counts were
higher at San Nicolas Island (5.7%) and Santa Barbara Island (5.3%) than at San Clemente
Island (4.7%) and San Miguel Island (4.1%). However, average annual growth rates from counts
of non-pups at each of the Main Channel Islands rookeries were lower (ranged 2.2% to 3.5% for
individual rookeries) than was estimated from counts of live-pups at the same rookeries (Table
9).
Stepwise GLM analysis indicated that the environmental covariates SLH-LA and NPGO
were negatively related to the count of live pups at the Channel Islands (i.e., the negative slope of
the coefficient indicates that fewer pups were produced as SLH-LA and NPGO increased), and
that they were positively related to SLH-LA at the central California rookeries at Año Nuevo
Island and the South Farallon Islands (i.e., the positive slope of the coefficient indicates that
more pups were produced as SLH-LA increased; Table 9). Likewise, SLH-LA was negatively
related to counts of non-pups at San Miguel Island, San Nicolas Island, and the combined Main
Channel Islands rookeries group (Table 9). Non-pup counts at the South Farallon Islands
increased as MEI increased (i.e., as conditions went from cold-water La Niña to warm-water El
Niño) and non-pup counts at Año Nuevo Island increased as NPGO increased. None of the
environmental covariates improved the model of non-pup counts for central and northern
California (Table 9).
DISCUSSION
During the 1980s and 1990s, CSL pup surveys were emphasized to estimate population
status and only the Main Channel Islands rookeries were surveyed regularly; non-pups were not
counted regularly and not counted at all the rookeries. With time, other age/sex class categories
were counted and SWFSC surveys expanded geographically. Eventually, surveys covered all the
16
California Channel Islands and the continental coastline of California from Point Conception to
the California/Oregon border. These surveys along with published data made it possible to
examine statewide CSL population growth rates from counts of pups and non-pups over a fifty-
year period, and allowed examination of the geographical distribution within California of
various age/sex classes during the July breeding season.
The first estimates of average annual growth rates of the U.S. population of CSLs were
based on counts of pups at San Miguel Island and San Nicolas Island between 1970 and 1986
(Boveng, 1988). The estimates were variable depending on the time period included in the
estimate: 3.4% (1971-1986), 6.4% (1970-1982), and 11.9% (1983-1986). The variability in the
rates was attributed to effects of El Niño on pup production (Boveng, 1988). Lowry et al. (1992)
then estimated a population growth at 4.6% from pup counts between 1975 and 1990 from the
Main Channel Islands rookeries. From 1975 to 2000, the mean annual growth rate was estimated
at 6.1% (Lowry and Maravilla-Chavez, 2005), and five years later in 2005 it declined to 5.6%
(Carretta et al., 2007). However, analyses generating these two estimates omitted pup counts
obtained during 1983-1984, 1992-1993, and 1998 when El Niño conditions resulted in low pup
production. The growth rates in this report incorporate more years (1964-2014) and did not omit
pup count data but rather used four environmental condition indices as covariates (MEI, SLH-
LA, PDO and NPGO) to model the effect of the environmental conditions on pup count data, of
which SLH-LA and NPGO were identified as being the most influential. These two
environmental indices are positively correlated with ENSO and their negative relationships with
pup counts, indicating that elevated temperature reflected by thermal expansion derived from sea
level data and NPGO values resulted in fewer pups born.
Counts of non-pups were also used to estimate population growth. The 4.7% average
annual growth rate obtained from counts of pups at the Main Channel Islands rookeries during
1964-2014 is probably more representative of California-wide population growth than the 2.9%
growth rate obtained from non-pup data because it is unclear whether trends in non-pup counts
(number of hauled-out animals) would be linearly 1:1 related to growth of the full population.
For generating stock assessment reports (SARs) under the Marine Mammal Protection
Act, a default of 12% is assumed to be the maximum annual rate of increase for pinnipeds
(Wade, 1998). The growth rates in this report are much lower. Possibly this reflects some
density-dependence in the time series, noting that the population would only be expected to grow

17
at its intrinsic rate when population size is very low relative to available resources (i.e., in the
earliest part of the time series). It is also possible it indicates that CSL maximum growth is less
than 12%. One factor likely affecting population growth rate estimates early in the time series
was bycatch of non-pups in gillnet-fisheries. Mortality from U.S. west coast gillnet fisheries
prior to a gillnet ban in southern California coastal waters in 1994 was on the order of a few
thousand animals per year (Barlow et al., 1994), which would have corresponded to several
percent of the total population size at the time and thus reduced the population growth rate. This
fishery bycatch mortality on non-pups could also partially explain the difference in growth rate
estimates between pups and non-pups.
The western coast of the contiguous U.S. periodically experiences above average warm-
water periods associated with the El Niño Southern Oscillation (ENSO) cycle that occurs in
equatorial waters off South America (Fahrbach et al., 1991). The ENSO cycle is composed of
the warm-water El Niño period, the cold-water La Niña period, and a neutral phase. The El Niño
periods decrease primary productivity and abundance and availability of CSL forage along the
California coast (Arntz et al., 1991). El Niño periods have been observed to have short and long-
term effects on the CSL population in the U.S. Short-term effects were apparent in drops in CSL
pup production during 1983, 1992-1993, 1998, and 2009-2010 and were the most noticeable
effect of recent El Niño periods on population growth (Fig. 3). The decline in pup births reflects
an inability of pregnant females to find sufficient food to support the energetic demands of
pregnancy. Lower numbers of pup births in the El Niño years resulted in fewer adults in later
years for the affected cohorts resulting a long-term population affect. After an El Niño period,
pup production sometimes rebounds in the following year to pre-El Niño levels (as was observed
in 1994, 1999, and 2011), usually when the event is weak or mild or of short duration. The
immediate rebound in pup production will not occur when adult females die during an El Niño
event, as probably occurred during the very strong and prolonged 1982-1983 El Niño period
(DeLong et al., 1991) due to fewer adult females of reproductive age in the population than were
present prior to the El Niño event. Pup production took about five years to reach the level it was
at prior to the 1982-1983 El Niño. Other characteristics of El Niño’s are higher pup and juvenile
mortality rates (DeLong et al., 1991), that also affect future recruitment into the adult population
for the affected cohorts, and delayed recruitment into the breeding population of females that are
born during El Niño conditions or experience El Niño conditions while they are juveniles (Melin

18
et al., 2012). These responses also slow population growth as was observed (in the form of
reduced pup production) five to six years after the 1992-1993 El Niño (there was a drop in births
in 1997 and 1998, with the 1998 also affected by the 1997-1998 El Niño) and in 2002 and 2003
after the 1997-1998 El Niño (Figs. 1 and 6). Other factors that have affected population growth
rates are domoic acid poisoning from an environmental toxin that results in adult female and
juvenile mortality and reproductive failure, and hookworm infections that result in elevated pup
mortality rates (Scholin et al., 2000; Lefebvre et al., 2000; Lyons et al., 2001; Bejarano et al.,
2008).
Four environmental covariate indices (MEI, SLH-LA, PDO and NPGO) were examined
to determine whether and how they affected the U.S. population growth rate estimates of CSLs.
Each of the four indices reflects different environmental conditions. NPGO measures sea surface
height in the Northeast Pacific and has been found to correlate with fluctuations in salinity,
nitrates, and chlorophyll-a in the southern portion of the California Current (Di Lorenzo et al.,
2008). PDO is an El Niño like pattern that measures variability in North Pacific sea surface
temperatures (Mantua et al., 1997) over multiple decades (20-30 years). MEI is an ENSO index
derived from tropical measurements of sea level pressure, surface wind, and sea surface
temperature at the equator (Wolter and Timlin, 1993). SLH-LA is the sea level height at Los
Angeles, California harbor with its seasonal variation and long-term trend removed (Zervas,
2009), resulting in a measure of the thermal expansion and contraction of the water mass. The
SLH-LA index used here, however, should not be confused with sea level rise due to climate
change (e.g., melting glaciers) because seasonal and long-term trend were removed from the
observed data.
Population growth rate analysis of CSLs at California rookeries indicated that SLH-LA
and NPGO explained the rise and fall of pup production and SLH-LA explained
presence/absence of non-pups. The relationship between CSL pup production and distribution of
non-pups within California with SLH-LA and NPGO (which both represent heat content in
oceanic water) may indicate how CSLs will respond to climate change. If oceanic water
temperature increases in the Pacific Ocean (Overland and Wang, 2007) and the Southern
California Bight (Auad et al., 2006) due to climate change, it is possible that fewer CSL pups
will be produced at southern California rookeries and more CSLs may occur in central and
northern California in the future.
19
ACKNOWLEDGEMENTS
Robert DeLong, George Antonelis, Patrick Gearin, Anthony Orr and Jeff Harris and other
AFSC MML staff and many interns and volunteers participated in the live pup counts at San
Miguel Island. This report was also made possible by biologists from SWFSC who went to the
field to count sea lions; especially Jim Carretta and Chuck Oliver. Thanks to Robert DeLong,
Sharon Melin, Anthony Orr, and others from the Alaska Fisheries Science Center, Seattle, WA
who provided weather information during aerial surveys and arranged their fieldwork schedules
for aerial photographic surveys at San Miguel Island. Channel Islands National Park assisted
with aerial photographic surveys and supported fieldwork at Santa Barbara Island and San
Miguel Island. Wayne Perryman of SWFSC provided photographic equipment for aerial
photographic surveys and Morgan Lynn of SWFSC maintained the cameras in working
condition. Thanks to Don Leroy, of Aerial Imaging Solutions, for creating electronic equipment
and software for operating the 126-mm-format cameras and for building the digital camera
system used in aerial photographic surveys. Jay Barlow and Jeffrey Moore assisted with
statistical analysis. Aircraft for conducting aerial photographic surveys were chartered from
Everingham Brothers (1987-1991), Air Flight Service (1991-1994), California Department of
Fish and Game (2006), and Aspen Helicopters, Inc. (1992-2005 and 2007-2014). Vessel
transport to Santa Barbara Island was provided by Channel Islands National Park (1983-1987)
and chartered from Peter Howorth of Howorth Associates, Santa Barbara, CA (1988-1998). The
U.S. Navy assisted with surveys at San Clemente Island and San Nicolas Island, provided
chartered aircraft for conducting aerial surveys in southern California during 2008-2014, and
provided funding for counting pinnipeds from aerial photographs during 2013-2014. The U.S.
Air Force assisted with surveys at Vandenberg Air Force Base. Aerial DSLR photographs were
obtained from Ryan Berger and Russ Bradley of Point Blue Conservation Science and Gerry
McChesney of the U.S. Fish and Wildlife Service who conducted the aerial survey at the
Farallon Islands on August 6, 2013. Stephanie Nehasil and Beth Jaime helped to count CSLs in
surveys conducted in 2013 and 2014, respectively. The report was improved by comments
provided by Jay Barlow and Jeffrey Moore. All SWFSC surveys were conducted under Marine
Mammal Research Permits 347, 404, 684, 704, 774-1437, 774-1714, and 14097; and National
Marine Sanctuary Permits GFNMS/MBNMS/CINMS-04-98, MULTI-2002-003, MULTI-2003-
20
003, and MULTI-2008-003. AFSC Surveys at San Miguel Island were conducted under Marine
Mammal Protection Act Permits 16087-02.
LITERATURE CITED
Arntz, W., W. G. Pearcy, and F. Trillmich. 1991. The time sequence and magnitude of physical
effects of El Niño in the eastern Pacific. In F. Trillmich and K. A. Ono (Eds.) Pinnipeds
and El Niño: Responses to environmental stress (pp. 8-21), Springer-Verlag, Berlin
Heidelberg New York.
Auad, G., A. Miller, and E. Di Lorenzo (2006), Long-term forecast of oceanic conditions off
California and their biological implications, J. Geophysical Res., 111, C09008,
doi:10.1029/2005JC003219.
Barlow, J, R. W. Baird, J. E. Heyning, K. Wynne, A. M. Manville II, L. F. Lowry, … V. N.
Burkanov. 1994. A review of cetacean and pinniped mortality in coastal fisheries along
the west coast of the USA and Canada and the east coast of the Russian Federation.
Report International Whaling Commission (Special Issue 15):405-426.
Bartholomew, G. A. 1967. Seal and sea lion populations of the Channel Islands. In R. N.
Philbrick, (Ed.). Proceedings of the Symposium on the Biology of the California Islands,
(pp. 229-243). Santa Barbara Botanic Garden, Santa Barbara, California.
Bartholomew, G. A. and R. A. Boolootian. 1960. Numbers and population structure of the
pinnipeds on the California Channel Islands. Journal of Mammalogy 41(3):366-375.
Bejarano, A. C., F. M. Gulland, T. Goldstein, J. St Leger, M. Hunter, L. H. Schwacke, F. M.
Van Dolah, and T. K. Rowles. 2008. Demographics and spatio-temporal signature of the
biotoxin domoic acid in California sea lion (Zalophus californianus) stranding records.
Marine Mammal Science 24:899-912. DOI: 10.1111/j.1748-7692.2008.00224.x

21
Bigg, M. A. 1988. Status of the California sea lion, Zalophus californianus, in Canada.
Canadian Field Naturalist 102:307-314.
Bonnell, M. L., B. J. Le Boeuf, M. O. Pierson, D. H. Dettman, G. D. Farrens, C. B. Heath, R. F.
Gantt, and D. J. Larsen. 1980. Summary of marine mammal and seabird surveys of the
Southern California Bight area 1975-1978. Vol. 3, Investigators' Reports, Part 1.
Pinnipeds of the Southern California Bight. University of California, Santa Cruz,
California. Final Report to the Bureau of Land Management, under contract AA550-
CT7-365. NTIS PB81-248-71.
Bonnell, M. L., M. O. Pierson, and G. D. Farrens. 1983. Pinnipeds and sea otters of central and
northern California, 1980-1983: Status, abundance, and distribution, Pp-220. Center for
Marine Studies, University of California, Santa Cruz. Prepared for: Pacific OCS Region,
Minerals Management Service, U.S. Department of Interior, contract #14-12-0001-
29090.
Bonnot, P. 1928. Report on the seals and sea lions of California. California Fish and Game
Bulletin No. 14.
Bonnot, P. 1931. The California sea lion census for 1930. California Fish and Game 17(2):150-
155.
Bonnot, P. 1937. California sea lion census for 1936. California Fish and Game 23(2):108-112.
Bonnot, P. 1938. California sea lion census for 1938. California Fish and Game 24(4):415-419.
Bonnot, P. and W. E. Ripley. 1948. California sea lion census for 1947. California Fish and
Game 34(3):89-92.
Bureau of Marine Fisheries. 1938. California sea lion census for 1946. California Fish and
Game (331):19-22.

22
Boveng, P. 1988. Status of the California sea lion population on the U. S. west coast. NMFS,
Southwest Fisheries Center, La Jolla, California Administrative Report LJ-88-07.
Carlisle, J. G. and J. A. Aplin. 1966. Sea lion census for 1965 including counts of other
California pinnipeds. California Fish and Game 52(2):119-120.
Carlisle, J. G. and J. A. Aplin. 1970. Sea lion census for 1969, including counts of other
California pinnipeds. California Fish and Game 56(2):130-133.
Carlisle, J. G. and Aplin, J. A. 1971. Sea lion census for 1970, including counts of other
California pinnipeds. California Fish and Game 57(2):124-126.
Carretta, J. V., M. S. Lowry, C. E. Stinchcomb, M. S. Lynn, and R. E. Cosgrove. 2000.
Distribution and abundance of marine mammals at San Clemente Island and surrounding
offshore waters: results from aerial and ground surveys in 1998 and 1999. NMFS,
Southwest Fisheries Science Center, La Jolla, CA, Administrative Report LJ-00-02.
Carretta, J. V., K. A. Forney, M. S. Lowry, J. Barlow, J. Baker, B. Hansen, and M. M. Muto.
(2007). U.S. Pacific Marine Mammal Stock Assessments: 2007. NOAA Technical
Memorandum, NOAA-TM-NMFS-SWFSC-414.
Cass, V. L. 1985. Exploitation of California sea lions, Zalophus californianus, prior to 1972.
Marine Fisheries Review 47:36-38.
DeLong, R. L., G. A. Antonelis, C. W. Oliver, B. S. Stewart, M. S. Lowry, and P. K. Yochem.
1991. Effects of the 1982-1983 El Niño on several population parameters and diet of
California sea lions on the California Channel Islands. In F. Trillmich and K. A. Ono
(Eds.) Pinnipeds and El Niño: Responses to environmental stress (pp. 166-172), Springer-
Verlag, Berlin Heidelberg New York.

23
DeMaster, D. P., D. J. Miller, D. Goodman, R. L. DeLong, and B. S. Stewart. 1982. Assessment
of California sea lion fishery interactions. Transactions of the 47th North American
Wildlife and Natural Resources Conference, Wildlife Management Institute, Washington,
D.C.
Di Lorenzo, E., N. Schneider, K. M. Cobb,…P. Rivière. 2008. North Pacific Gyre Oscillation
links ocean climate and ecosystem change. Geophysical Research Letters 35, L08607,
doi:10.1029/2007GL032838.
Eberhardt, L. L. and M. A. Simmons. 1992. Assessing rates of increase from trend data.
Journal of Wildlife Management 56:603-610.
Fahrbach, E., F. Trillmich, and W. Arntz. 1991. Biological consequences of the 1982-1983 El
Niño in the eastern Pacific. In F. Trillmich and K. A. Ono (Eds.) Pinnipeds and El Niño:
Responses to environmental stress (pp. 22-42), Springer-Verlag, Berlin Heidelberg New
York.
Francis, J. M. and C. B. Heath. 1991. Population abundance, pup mortality, and copulation
frequency in the California sea lion in relation to the 1983 El Niño on San Nicolas Island.
In F. Trillmich and K. A. Ono (Eds.) Pinnipeds and El Niño: Responses to environmental
stress (pp. 119-128). Springer-Verlag, Berlin Heidelberg New York.
Frey, R. W. and J. A. Aplin. 1966. Sea lion census for 1965 including counts of other California
pinnipeds. California Fish and Game 52(2):119-120.
Frey, R. W. and J. A. Aplin. 1970. Sea lion census for 1969, including counts of other
California pinnipeds. California Fish and Game 56(2):130-133.
Heath, C. B. and J. M. Francis. 1983. Population dynamics and feeding ecology of the
California sea lion with applications for management: Results of 1981-1982 research on
24
Santa Barbara and San Nicolas Islands. NMFS, Southwest Fisheries Science Center, La
Jolla, CA, Administrative Report LJ-83-04C.
Heath, C. B. and J. M. Francis. 1984. Results of research on California sea lions, San Nicolas
Island, 1983. NMFS, Southwest Fisheries Science Center, La Jolla, CA, Administrative
Report LJ-84-41C.
Helling, H. E. 1984. A follow-up report on available data for California and Steller sea lion
(Zalophus californianus, Eumetopias jubatus) exploitation prior to 1950. Administrative
Report LJ-84-45C. National Marine Fisheries Service, Southwest Fisheries Center, La
Jolla, California. 10 pp.
Huber, H. R. 1991. Changes in the distribution of California sea lions north of the breeding
rookeries during the 1982-83 El Niño. In F. Trillmich and K. A. Ono (Eds.) Pinnipeds
and El Niño: Responses to environmental stress (pp. 129-137. Springer-Verlag, Berlin
Heidelberg, Germany.
Keith, E. O., R. S. Condit, and B. J. Le Boeuf. 1984. California sea lions breeding at Año
Nuevo Island, California. Journal of Mammalogy 65:695.
Lefebvre, K., C. Powel, G. Doucette, J. Silver, P. Miller, P. Hughes, … R. Tjeerdema. 2000.
Domoic acid-producing diatoms: probable cause of neuroexcitotoxicity in California sea
lions. Marine Environmental Research 50:485-488.
Lowry, M. S., L. J. Hansen, and S. D. Hawes. 1987. California sea lion and northern elephant
seal pup counts and tagging at Santa Barbara Island, California, from 1983 through July
1986. NMFS, Southwest Fisheries Science Center, La Jolla, CA, Administrative Report
LJ-87-03.
Lowry, M. S., P. Boveng, R. J. DeLong, C. W. Oliver, B. S. Stewart, H. DeAnda, and J. Barlow.
1992. Status of the California sea lion (Zalophus californianus californianus) population
25
in 1992. NMFS, Southwest Fisheries Science Center, La Jolla, CA, Administrative
Report LJ-92-32.
Lowry, M. S., W. L. Perryman, M. S. Lynn, R. L. Westlake, and F. Julian. 1996. Counts of
northern elephant seals, Mirounga angustirostris, from large-format aerial photographs
taken at rookeries in southern California during the breeding season. Fishery Bulletin, U.
S. 94:176-185.
Lowry, M. S. 1999. Counts of California sea lion (Zalophus californianus) pups from aerial
color photographs and from the ground: A comparison of two methods. Marine Mammal
Science 15:143-158.
Lowry, M. S. and K. A. Forney. 2005. Abundance and distribution of California sea lions
(Zalophus californianus) in central and northern California during 1998 and summer
1999. U.S. Fishery Bulletin 103:331-343.
Lowry, M. S. and O. Maravilla-Chavez. 2005. Recent abundance of California sea lions in
western Baja California, Mexico and the United States. In D. K. Garcelon and C. A.
Schwemm (Eds.) Proceedings of the Sixth California Islands Symposium, Ventura,
California, December 1-3, 2003 (pp. 485-497). National Park Service Technical
Publication CHIS-05-01, Institute for Wildlife Studies, Arcata, California.
Lyons, E. T., S. R. Melin, R. L. DeLong, A. J. Orr, F. M. Gulland, and S. C. Oliver. 2001.
Current prevalence of adult Uncinaria spp. in northern fur seal (Callorhinus ursinus) and
California sea lion (Zalophus californianus) pups on San Miguel Island, California, with
notes on the biology of these hookworms. Veterinary Parasitology 97:309-308.
Maniscalco, J. M., K. Wynne, K. W. Pritcher, M. B. Hanson, S. R. Melin, and S. Atkinson.
2004. The occurrence of California sea lions (Zalophus californianus) in Alaska.
Aquatic Mammals 30:427-433.
26
Mantua, N. J., S. R. Hare, Y. Zhang, J. M. Wallace, and R. C. Francis. 1997. A Pacific
interdecadal climate oscillation with impacts on salmon production. Bulletin of the
American Meteorological Society, 78:1069-1079.
Mate, B. R. 1975. Annual migrations of the sea lions Eumetopias jubatus and Zalophus
californianus along the Oregon USA coast. In K. Ronald and A. W. Mansfield (Eds.).
Biology of the Seal: Proceedings of a Symposium held in Guelph 14-17 August 1972 (pp.
455-461). Rapports et Process-Verbaux des Reunions Volume 169. Conseil
International Pour L’Exploration de la Mer, Charlottenlund Slot, Denmark.
Melin, S. R., J. L. Laake, R. L. DeLong, and D. B. Siniff. 2012. Age-specific recruitment and
natality of California sea lions at San Miguel Island, California. Marine Mammal
Science 28:751-776. doi:10.1111/j.1748-7692.2011.00538.x
Odell, D. K. 1971. Censuses of pinnipeds breeding on the California Channel Islands. Journal
of Mammalogy 52(1):187-190.
Odell, D. K. 1972. Studies on the biology of the California sea lion and the northern elephant
seal on San Nicolas Island, California. (Unpublished doctoral dissertation). University
of California, Los Angeles.
Oliver, C. W. and M. S. Lowry. 1987. Pinniped studies conducted between August, 1981 and
December, 1982 at San Clemente Island, California. NMFS, Southwest Fisheries
Science Center, La Jolla, CA, Administrative Report LJ-87-23.
Oliver, C. W., M. S. Lowry, and L. M. Ferm. 1988. Pinniped studies conducted at San
Clemente Island, California during 1983. NMFS, Southwest Fisheries Science Center,
La Jolla, CA, Administrative Report LJ-88-08.
Oliver, C. W. 1991a. 1986-1987 field studies on pinnipeds at San Clemente Island. NMFS,
Southwest Fisheries Science Center, La Jolla, CA, Administrative Report LJ-91-25.
27
Oliver, C. W. 1991b. 1988-1991 field studies on pinnipeds at San Clemente Island. NMFS,
Southwest Fisheries Science Center, La Jolla, CA, Administrative Report LJ-91-27.
Oliver, C. W. and J. Wexler. 1991. 1985 field studies on pinnipeds at San Clemente Island.
NMFS, Southwest Fisheries Science Center, La Jolla, CA, Administrative Report LJ-91-
24.
Overland, J. E. and M. Wang. 2007. Future climate of the North Pacific Ocean. EOS
Transactions of the American Geophysical Union, 88: 178–182.
Peterson, R. S. and G. A. Bartholomew. 1967. The natural history and behavior of the
California sea lion. The American Society of Mammalogists, Special Publication No. 1.
Pierotti, R. J., D. G. Finley, and T. J. Lewis. 1977. Birth of a California sea lion on Southeast
Farallon Island. California Fish and Game 63:64-66.
Pitcher, K. W., P. F. Olesiuk, R. F. Brown, M. S. Lowry, S. J. Jeffries, J. L. Sease, W. L.
Perryman, C. E. Stinchcomb, and L. F. Lowry. 2007. Abundance and distribution of the
eastern North Pacific Steller sea lion (Eumetopias jubatus) population. U. S. Fishery
Bulletin 107:102-115.
Ripley W. E., K. W. Cox, and J. L. Baxter. 1962. California sea lion census for 1958, 1960 and
1961. California Fish and Game 48(4):228-231.
Scholin, C. A., F. Gulland, G. J. Doucette, S. Benson, M. Busman, F. P. Chavez…F. M. Van
Dolah. 2000. Mortality of sea lions along the central California coast linked to a toxic
diatom bloom. Nature 403:80-84.
Schramm, Y., S. L. Mesnick, J. de la Rosa, D. M. Palacios, M. S. Lowry, D. Aurioles-
Gamboa,… S. Escorza-Treviño. 2009. Phylogeography of California and Galapagos sea

28
lions and population structure within the California sea lion. Marine Biology 156:1375-
1387.
Seagars, D. J., D. P. DeMaster and R. L. DeLong. 1985. A survey of historic rookery sites for
California and northern sea lions in the Southern California Bight. Administrative Report
LJ-85-13, National Marine Fisheries Service, Southwest Fisheries Center, La Jolla,
California.
Sokal, R. R. and F. J. Rolf. 1995. Biometry: The principles and practice of statistics in biological
research. Third edition. W. H. Freeman and Company, New York.
Stewart, B. S. and P. K. Yochem. 1984. Seasonal abundance of pinnipeds at San Nicolas Island,
California, 1980-1982. Bulletin of the Southern California Academy of Sciences 83:121-
132.
Stewart, B. S. and P. K. Yochem. 1986. Assessment of population dynamics of the California
sea lion (Zalophus californianus) at San Nicolas Island, 1984-1985. NMFS, Southwest
Fisheries Science Center, La Jolla, CA, Administrative Report LJ-86-11C.
Stewart, B. S., P. K. Yochem, R. L. DeLong, and G. A. Antonelis. 1993. Trends in abundance
and status of pinnipeds on the southern California Channel Islands, In F. G. Hochberg
(Ed.) Third California Islands Symposium: Recent Advances in Research on the
California Islands (pp. 501-516). Santa Barbara Museum of Natural History, Santa
Barbara, California.
Wade, P. R. 1998. Calculating limits to the allowable human-caused mortality of cetaceans and
pinnipeds. Marine Mammal Science 14:1-37.
Westlake, R. L., W. L. Perryman, and K. A. Ono. 1997. Comparison of vertical photographic
and ground censuses of Steller sea lions at Año Nuevo Island, July 1990-1993. Marine
Mammal Science 13:207-218.

29
Wexler, J. and C. W. Oliver. 1988. Pinniped research conducted at San Clemente Island during
1984. NMFS, Southwest Fisheries Science Center, La Jolla, CA, Administrative Report
LJ-88-16).
Wolter, K. and M.S. Timlin, 1993: Monitoring ENSO in COADS with a seasonally adjusted
principal component index. Proc. of the 17th Climate Diagnostics Workshop, Norman,
OK, NOAA/NMC/CAC, NSSL, Oklahoma Clim. Survey, CIMMS and the School of
Meteor., Univ. of Oklahoma, 52-57.
Zervas, C. 2009. Sea level variations of the United States 1854-2006. NOAA Technical Report
NOS-OPS 053.
30
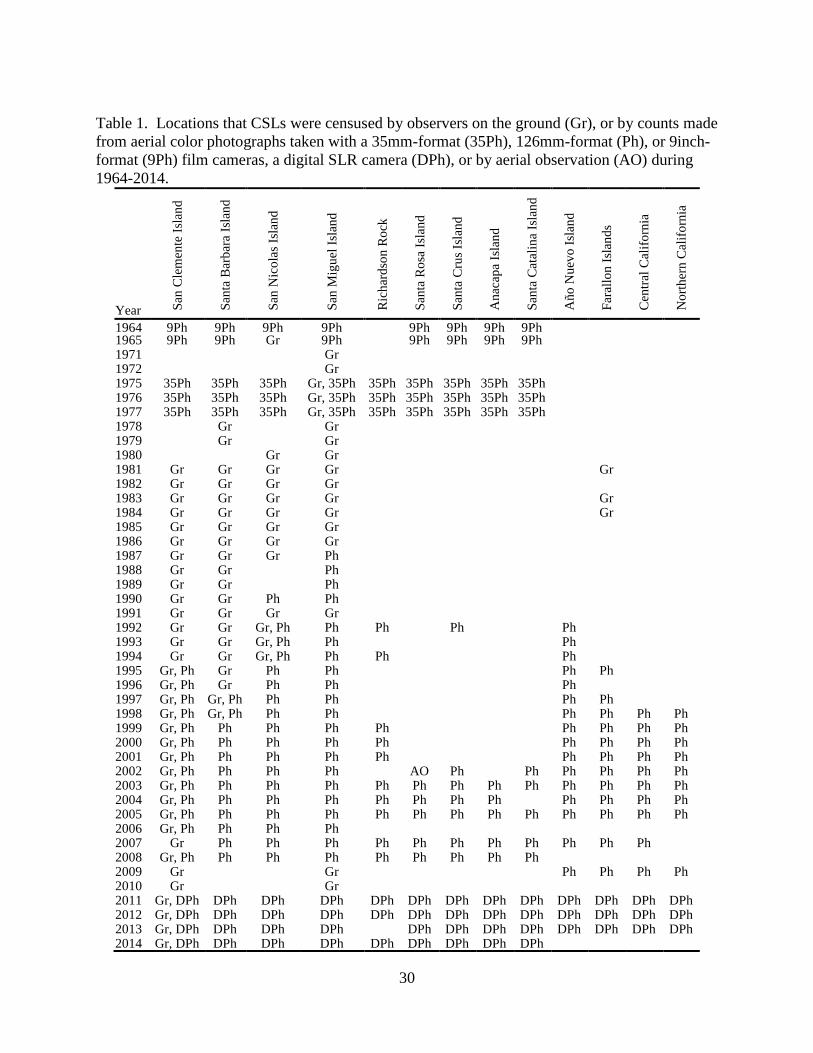
Table 1. Locations that CSLs were censused by observers on the ground (Gr), or by counts made
from aerial color photographs taken with a 35mm-format (35Ph), 126mm-format (Ph), or 9inch-
format (9Ph) film cameras, a digital SLR camera (DPh), or by aerial observation (AO) during
1964-2014.
Year San
Cle
men
te I
slan
d
San
ta B
arb
ara
Isla
nd
San
Nic
ola
s Is
lan
d
San
Mig
uel
Isl
and
Ric
har
dso
n R
ock
San
ta R
osa
Isl
and
San
ta C
rus
Isla
nd
An
acap
a Is
lan
d
San
ta C
atal
ina
Isla
nd
Añ
o N
uev
o I
slan
d
Far
allo
n I
slan
ds
Cen
tral
Cal
ifo
rnia
No
rth
ern
Cal
ifo
rnia
1964 9Ph 9Ph 9Ph 9Ph 9Ph 9Ph 9Ph 9Ph 1965 9Ph 9Ph Gr 9Ph 9Ph 9Ph 9Ph 9Ph 1971 Gr 1972 Gr 1975 35Ph 35Ph 35Ph Gr, 35Ph 35Ph 35Ph 35Ph 35Ph 35Ph 1976 35Ph 35Ph 35Ph Gr, 35Ph 35Ph 35Ph 35Ph 35Ph 35Ph 1977 35Ph 35Ph 35Ph Gr, 35Ph 35Ph 35Ph 35Ph 35Ph 35Ph 1978 Gr Gr 1979 Gr Gr 1980 Gr Gr 1981 Gr Gr Gr Gr Gr 1982 Gr Gr Gr Gr 1983 Gr Gr Gr Gr Gr 1984 Gr Gr Gr Gr Gr 1985 Gr Gr Gr Gr 1986 Gr Gr Gr Gr 1987 Gr Gr Gr Ph 1988 Gr Gr Ph 1989 Gr Gr Ph 1990 Gr Gr Ph Ph 1991 Gr Gr Gr Gr 1992 Gr Gr Gr, Ph Ph Ph Ph Ph 1993 Gr Gr Gr, Ph Ph Ph 1994 Gr Gr Gr, Ph Ph Ph Ph 1995 Gr, Ph Gr Ph Ph Ph Ph 1996 Gr, Ph Gr Ph Ph Ph 1997 Gr, Ph Gr, Ph Ph Ph Ph Ph 1998 Gr, Ph Gr, Ph Ph Ph Ph Ph Ph Ph 1999 Gr, Ph Ph Ph Ph Ph Ph Ph Ph Ph 2000 Gr, Ph Ph Ph Ph Ph Ph Ph Ph Ph 2001 Gr, Ph Ph Ph Ph Ph Ph Ph Ph Ph 2002 Gr, Ph Ph Ph Ph AO Ph Ph Ph Ph Ph Ph 2003 Gr, Ph Ph Ph Ph Ph Ph Ph Ph Ph Ph Ph Ph Ph 2004 Gr, Ph Ph Ph Ph Ph Ph Ph Ph Ph Ph Ph Ph 2005 Gr, Ph Ph Ph Ph Ph Ph Ph Ph Ph Ph Ph Ph Ph 2006 Gr, Ph Ph Ph Ph 2007 Gr Ph Ph Ph Ph Ph Ph Ph Ph Ph Ph Ph 2008 Gr, Ph Ph Ph Ph Ph Ph Ph Ph Ph 2009 Gr Gr Ph Ph Ph Ph 2010 Gr Gr 2011 Gr, DPh DPh DPh DPh DPh DPh DPh DPh DPh DPh DPh DPh DPh 2012 Gr, DPh DPh DPh DPh DPh DPh DPh DPh DPh DPh DPh DPh DPh 2013 Gr, DPh DPh DPh DPh DPh DPh DPh DPh DPh DPh DPh DPh 2014 Gr, DPh DPh DPh DPh DPh DPh DPh DPh DPh
31
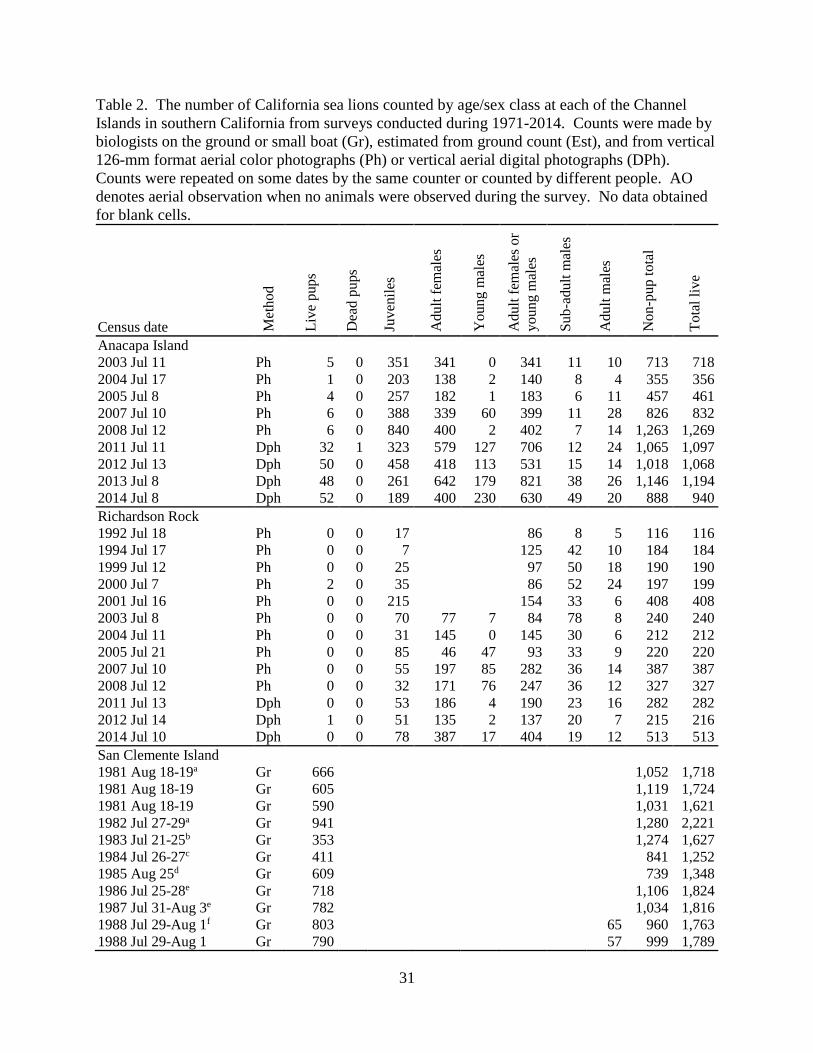
Table 2. The number of California sea lions counted by age/sex class at each of the Channel
Islands in southern California from surveys conducted during 1971-2014. Counts were made by
biologists on the ground or small boat (Gr), estimated from ground count (Est), and from vertical
126-mm format aerial color photographs (Ph) or vertical aerial digital photographs (DPh).
Counts were repeated on some dates by the same counter or counted by different people. AO
denotes aerial observation when no animals were observed during the survey. No data obtained
for blank cells.
Census date Met
ho
d
Liv
e p
up
s
Dea
d p
ups
Ju
ven
iles
Ad
ult
fem
ales
Yo
un
g m
ales
Ad
ult
fem
ales
or
yo
un
g m
ales
Su
b-a
du
lt m
ales
Ad
ult
mal
es
No
n-p
up
to
tal
To
tal
liv
e
Anacapa Island
2003 Jul 11 Ph 5 0 351 341 0 341 11 10 713 718
2004 Jul 17 Ph 1 0 203 138 2 140 8 4 355 356
2005 Jul 8 Ph 4 0 257 182 1 183 6 11 457 461
2007 Jul 10 Ph 6 0 388 339 60 399 11 28 826 832
2008 Jul 12 Ph 6 0 840 400 2 402 7 14 1,263 1,269
2011 Jul 11 Dph 32 1 323 579 127 706 12 24 1,065 1,097
2012 Jul 13 Dph 50 0 458 418 113 531 15 14 1,018 1,068
2013 Jul 8 Dph 48 0 261 642 179 821 38 26 1,146 1,194
2014 Jul 8 Dph 52 0 189 400 230 630 49 20 888 940
Richardson Rock 1992 Jul 18 Ph 0 0 17 86 8 5 116 116
1994 Jul 17 Ph 0 0 7 125 42 10 184 184
1999 Jul 12 Ph 0 0 25 97 50 18 190 190
2000 Jul 7 Ph 2 0 35 86 52 24 197 199
2001 Jul 16 Ph 0 0 215 154 33 6 408 408
2003 Jul 8 Ph 0 0 70 77 7 84 78 8 240 240
2004 Jul 11 Ph 0 0 31 145 0 145 30 6 212 212
2005 Jul 21 Ph 0 0 85 46 47 93 33 9 220 220
2007 Jul 10 Ph 0 0 55 197 85 282 36 14 387 387
2008 Jul 12 Ph 0 0 32 171 76 247 36 12 327 327
2011 Jul 13 Dph 0 0 53 186 4 190 23 16 282 282
2012 Jul 14 Dph 1 0 51 135 2 137 20 7 215 216
2014 Jul 10 Dph 0 0 78 387 17 404 19 12 513 513
San Clemente Island 1981 Aug 18-19a Gr 666 1,052 1,718
1981 Aug 18-19 Gr 605 1,119 1,724
1981 Aug 18-19 Gr 590 1,031 1,621
1982 Jul 27-29a Gr 941 1,280 2,221
1983 Jul 21-25b Gr 353 1,274 1,627
1984 Jul 26-27c Gr 411 841 1,252
1985 Aug 25d Gr 609 739 1,348
1986 Jul 25-28e Gr 718 1,106 1,824
1987 Jul 31-Aug 3e Gr 782 1,034 1,816
1988 Jul 29-Aug 1f Gr 803 65 960 1,763
1988 Jul 29-Aug 1 Gr 790 57 999 1,789

32
Table 2. (Continued)
Census date Met
ho
d
Liv
e p
up
s
Dea
d p
ups
Ju
ven
iles
Ad
ult
fem
ales
Yo
un
g m
ales
Ad
ult
fem
ales
or
yo
un
g m
ales
Su
b-a
du
lt m
ales
Ad
ult
mal
es
No
n-p
up
to
tal
To
tal
liv
e
San Clemente Island (Continued)
1989 Jul 21-23f Gr 795 65 1,460 2,255
1990 Jul 20-21f Gr 629 88 960 1,589
1991 Jul 12-14f Gr 913 77 1,560 2,473
1992 Jul 24-25g Gr 789 54 737 1,526
1993 Jul 23-24g Gr 745 52 637 1,382
1994 Jul 23g Gr 1,067 64 1,205 2,272
1995 Aug 15g Gr 1,189 1,656 2,845
1995 Jul 21g Ph 1,028 0 395 1,650 50 90 2,185 3,213
1995 Jul 22g Ph 970 2 362 1,481 39 79 1,961 2,931
1996 Jul 12-14g Gr 1,207 227 1,076 49 111 1,463 2,670
1996 Jul 12-14g Gr 1,047 211 1,081 42 84 1,418 2,465
1996 Jul 12-14g Gr 1,040 225 1,085 45 93 1,448 2,488
1996 Jul 12-14g Gr 1,208 220 1,132 55 112 1,519 2,727
1996 Jul 21g Ph 1,243 3 120 1,192 57 87 1,456 2,699
1996 Jul 23g Ph 1,468 1 138 1,198 29 79 1,444 2,912
1997 Jul 14g Ph 1,326 4 89 953 56 140 1,238 2,564
1997 Jul 15-16g Gr 1,248 147 857 26 89 1,119 2,367
1997 Jul 15-16g Gr 1,203 122 866 26 99 1,113 2,316
1998 Jul 18-20g Gr 537 35 787 7 87 916 1,453
1998 Jul 18-20g Gr 587 44 830 17 84 975 1,562
1998 Jul 20g Ph 682 4 97 1,291 43 123 1,554 2,236
1998 Jul 26h Ph 600 0 80 1,142 41 96 1,359 1,959
1999 Jul 10g Ph 1,004 3 339 1,837 55 161 2,392 3,396
1999 Jul 14g Gr 1,326 220 1,170 8 93 1,491 2,817
2000 Jul 25-26g Gr 1,660 338 1,305 14 87 1,744 3,404
2000 Jul 7g Ph 1,735 1 422 2,454 127 174 3,177 4,912
2001 Jul 12 Ph 1,722 0 330 2,179 102 182 2,793 4,515
2001 Jul 17 Gr 1,629 328 1,576 97 79 2,080 3,709
2002 Jul 13 Ph 2,081 4 438 2,799 38 2,837 100 188 3,563 5,644
2002 Jul 30-31 Gr 1,631 315 2,150 35 51 2,551 4,182
2003 Jul 16-18 Gr 1,128 214 1,232 110 88 1,644 2,772
2003 Jul 7 Ph 1,549 3 311 2,337 5 2,342 148 160 2,961 4,510
2004 Jul 10 Ph 1,839 0 454 2,547 95 2,642 197 180 3,473 5,312
2004 Jul 29 Gr 1,630 96 1,686 33 68 1,883 3,513
2005 Jul 20 Ph 1,587 3 231 2,229 99 2,328 93 199 2,851 4,438
2005 Jul 56 Gr 1,479 129 1,685 91 201 2,106 3,585
2006 Jul 17 Ph 2,130 3 363 2,141 131 2,272 98 202 2,935 5,065
2006 Jul 18-19 Gr 1,859 178 1,581 54 181 1,994 3,853
2007 Jul 24-25 Gr 2,146 143 1,898 47 162 2,250 4,396
2008 Jul 10 Ph 2,144 3 496 2,292 149 2,441 203 267 3,407 5,551
2008 Jul 22-23 Gr 2,086 397 1,348 98 158 2,001 4,087
2009 Jul 21-22 Gr 1,813 566 1,377 62 123 2,128 3,941
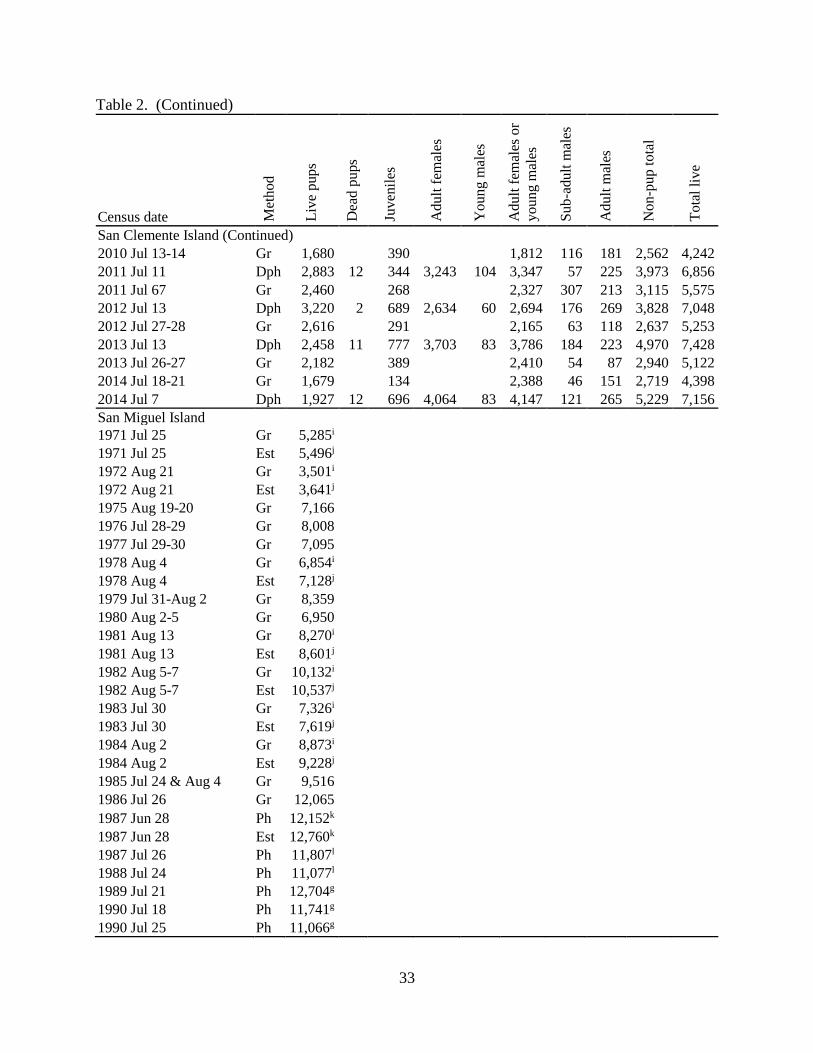
33
Table 2. (Continued)
Census date Met
ho
d
Liv
e p
up
s
Dea
d p
ups
Ju
ven
iles
Ad
ult
fem
ales
Yo
un
g m
ales
Ad
ult
fem
ales
or
yo
un
g m
ales
Su
b-a
du
lt m
ales
Ad
ult
mal
es
No
n-p
up
to
tal
To
tal
liv
e
San Clemente Island (Continued)
2010 Jul 13-14 Gr 1,680 390 1,812 116 181 2,562 4,242
2011 Jul 11 Dph 2,883 12 344 3,243 104 3,347 57 225 3,973 6,856
2011 Jul 67 Gr 2,460 268 2,327 307 213 3,115 5,575
2012 Jul 13 Dph 3,220 2 689 2,634 60 2,694 176 269 3,828 7,048
2012 Jul 27-28 Gr 2,616 291 2,165 63 118 2,637 5,253
2013 Jul 13 Dph 2,458 11 777 3,703 83 3,786 184 223 4,970 7,428
2013 Jul 26-27 Gr 2,182 389 2,410 54 87 2,940 5,122
2014 Jul 18-21 Gr 1,679 134 2,388 46 151 2,719 4,398
2014 Jul 7 Dph 1,927 12 696 4,064 83 4,147 121 265 5,229 7,156
San Miguel Island 1971 Jul 25 Gr 5,285i
1971 Jul 25 Est 5,496j 1972 Aug 21 Gr 3,501i 1972 Aug 21 Est 3,641j 1975 Aug 19-20 Gr 7,166 1976 Jul 28-29 Gr 8,008 1977 Jul 29-30 Gr 7,095 1978 Aug 4 Gr 6,854i 1978 Aug 4 Est 7,128j 1979 Jul 31-Aug 2 Gr 8,359 1980 Aug 2-5 Gr 6,950 1981 Aug 13 Gr 8,270i 1981 Aug 13 Est 8,601j 1982 Aug 5-7 Gr 10,132i 1982 Aug 5-7 Est 10,537j 1983 Jul 30 Gr 7,326i 1983 Jul 30 Est 7,619j 1984 Aug 2 Gr 8,873i 1984 Aug 2 Est 9,228j 1985 Jul 24 & Aug 4 Gr 9,516 1986 Jul 26 Gr 12,065
1987 Jun 28 Ph 12,152k
1987 Jun 28 Est 12,760k
1987 Jul 26 Ph 11,807l
1988 Jul 24 Ph 11,077l
1989 Jul 21 Ph 12,704g
1990 Jul 18 Ph 11,741g
1990 Jul 25 Ph 11,066g
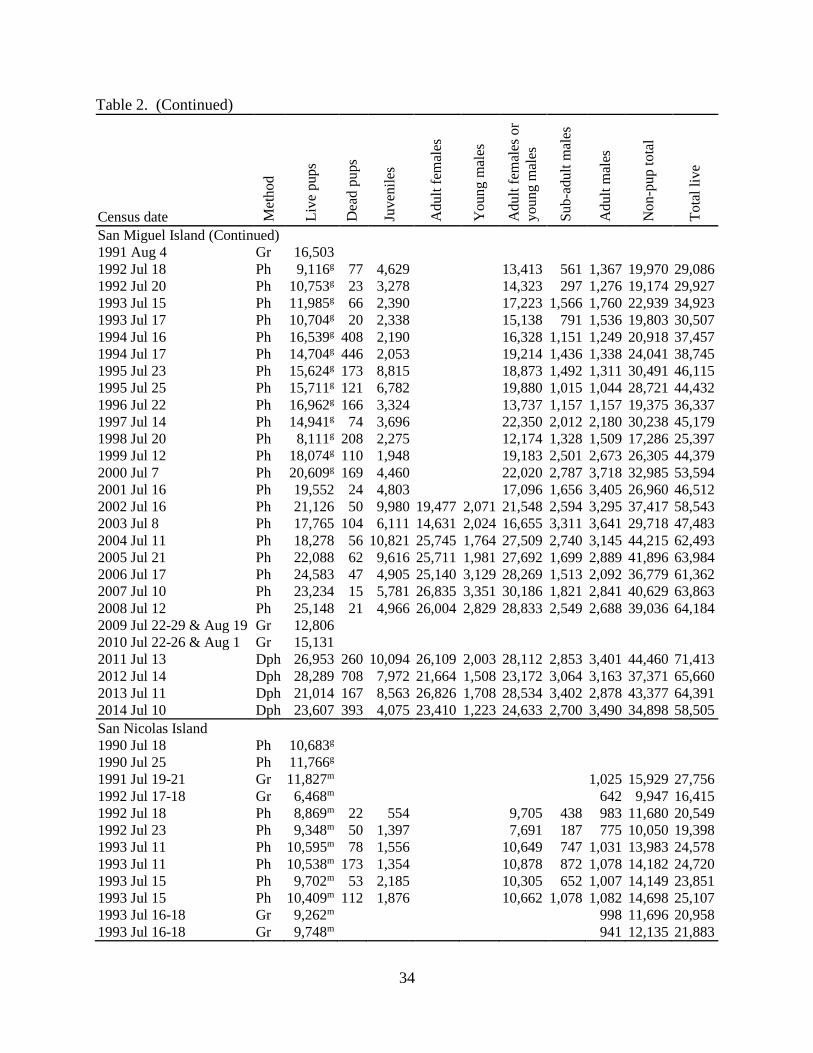
34
Table 2. (Continued)
Census date Met
ho
d
Liv
e p
up
s
Dea
d p
ups
Ju
ven
iles
Ad
ult
fem
ales
Yo
un
g m
ales
Ad
ult
fem
ales
or
yo
un
g m
ales
Su
b-a
du
lt m
ales
Ad
ult
mal
es
No
n-p
up
to
tal
To
tal
liv
e
San Miguel Island (Continued)
1991 Aug 4 Gr 16,503
1992 Jul 18 Ph 9,116g 77 4,629 13,413 561 1,367 19,970 29,086
1992 Jul 20 Ph 10,753g 23 3,278 14,323 297 1,276 19,174 29,927
1993 Jul 15 Ph 11,985g 66 2,390 17,223 1,566 1,760 22,939 34,923
1993 Jul 17 Ph 10,704g 20 2,338 15,138 791 1,536 19,803 30,507
1994 Jul 16 Ph 16,539g 408 2,190 16,328 1,151 1,249 20,918 37,457
1994 Jul 17 Ph 14,704g 446 2,053 19,214 1,436 1,338 24,041 38,745
1995 Jul 23 Ph 15,624g 173 8,815 18,873 1,492 1,311 30,491 46,115
1995 Jul 25 Ph 15,711g 121 6,782 19,880 1,015 1,044 28,721 44,432
1996 Jul 22 Ph 16,962g 166 3,324 13,737 1,157 1,157 19,375 36,337
1997 Jul 14 Ph 14,941g 74 3,696 22,350 2,012 2,180 30,238 45,179
1998 Jul 20 Ph 8,111g 208 2,275 12,174 1,328 1,509 17,286 25,397
1999 Jul 12 Ph 18,074g 110 1,948 19,183 2,501 2,673 26,305 44,379
2000 Jul 7 Ph 20,609g 169 4,460 22,020 2,787 3,718 32,985 53,594
2001 Jul 16 Ph 19,552 24 4,803 17,096 1,656 3,405 26,960 46,512
2002 Jul 16 Ph 21,126 50 9,980 19,477 2,071 21,548 2,594 3,295 37,417 58,543
2003 Jul 8 Ph 17,765 104 6,111 14,631 2,024 16,655 3,311 3,641 29,718 47,483
2004 Jul 11 Ph 18,278 56 10,821 25,745 1,764 27,509 2,740 3,145 44,215 62,493
2005 Jul 21 Ph 22,088 62 9,616 25,711 1,981 27,692 1,699 2,889 41,896 63,984
2006 Jul 17 Ph 24,583 47 4,905 25,140 3,129 28,269 1,513 2,092 36,779 61,362
2007 Jul 10 Ph 23,234 15 5,781 26,835 3,351 30,186 1,821 2,841 40,629 63,863
2008 Jul 12 Ph 25,148 21 4,966 26,004 2,829 28,833 2,549 2,688 39,036 64,184
2009 Jul 22-29 & Aug 19 Gr 12,806 2010 Jul 22-26 & Aug 1 Gr 15,131 2011 Jul 13 Dph 26,953 260 10,094 26,109 2,003 28,112 2,853 3,401 44,460 71,413
2012 Jul 14 Dph 28,289 708 7,972 21,664 1,508 23,172 3,064 3,163 37,371 65,660
2013 Jul 11 Dph 21,014 167 8,563 26,826 1,708 28,534 3,402 2,878 43,377 64,391
2014 Jul 10 Dph 23,607 393 4,075 23,410 1,223 24,633 2,700 3,490 34,898 58,505
San Nicolas Island
1990 Jul 18 Ph 10,683g
1990 Jul 25 Ph 11,766g
1991 Jul 19-21 Gr 11,827m 1,025 15,929 27,756
1992 Jul 17-18 Gr 6,468m 642 9,947 16,415
1992 Jul 18 Ph 8,869m 22 554 9,705 438 983 11,680 20,549
1992 Jul 23 Ph 9,348m 50 1,397 7,691 187 775 10,050 19,398
1993 Jul 11 Ph 10,595m 78 1,556 10,649 747 1,031 13,983 24,578
1993 Jul 11 Ph 10,538m 173 1,354 10,878 872 1,078 14,182 24,720
1993 Jul 15 Ph 9,702m 53 2,185 10,305 652 1,007 14,149 23,851
1993 Jul 15 Ph 10,409m 112 1,876 10,662 1,078 1,082 14,698 25,107
1993 Jul 16-18 Gr 9,262m 998 11,696 20,958
1993 Jul 16-18 Gr 9,748m 941 12,135 21,883

35
Table 2. (Continued)
Census date Met
ho
d
Liv
e p
up
s
Dea
d p
ups
Ju
ven
iles
Ad
ult
fem
ales
Yo
un
g m
ales
Ad
ult
fem
ales
or
yo
un
g m
ales
Su
b-a
du
lt m
ales
Ad
ult
mal
es
No
n-p
up
to
tal
To
tal
liv
e
San Nicolas Island (Continued)
1993 Jul 17 Ph 9,698m 84 2,066 9,373 620 1,067 13,126 22,824
1993 Jul 17 Ph 10,345m 104 1,706 9,668 907 1,132 13,413 23,758
1993 Jul 23-26 Gr 8,723m 400 8,113 16,836
1993 Jul 23-26 Gr 8,382m 683 7,782 16,164
1994 Jul 12-13 Gr 16,503m 803 15,777 32,290
1994 Jul 14 Ph 15,766m 180 1,020 12,534 1,181 1,144 15,879 31,645
1994 Jul 16 Ph 16,889m 247 966 12,782 1,101 1,171 16,020 32,909
1995 Jul 21 Ph 17,512g 97 4,831 16,591 1,323 1,222 23,967 41,479
1995 Jul 22 Ph 16,926g 117 5,363 14,205 1,285 1,055 21,908 38,834
1996 Jul 21 Ph 19,308g 112 1,659 12,199 853 1,206 15,917 35,225
1996 Jul 22 Ph 20,285g 85 1,776 12,178 603 1,082 15,639 35,924
1997 Jul 14 Ph 20,488g 120 1,167 13,531 1,511 1,986 18,195 38,683
1998 Jul 20 Ph 4,885g 61 1,679 10,445 900 1,567 14,591 19,476
1999 Jul 10 Ph 19,878g 87 2,010 16,531 1,517 2,614 22,672 42,550
2000 Jul 7 Ph 24,167g 59 3,951 17,554 2,504 2,908 26,917 51,084
2001 Jul 12 Ph 24,741 56 5,248 17,140 2,037 2,797 27,222 51,963
2002 Jul 22 Ph 19,719 86 2,591 10,806 518 11,324 1,742 1,943 17,600 37,319
2003 Jul 7 Ph 15,702 50 4,496 15,384 1,652 17,036 3,112 2,824 27,468 43,170
2004 Jul 10 Ph 20,866 30 2,722 17,792 2,496 20,288 2,874 2,773 28,657 49,523
2005 Jul 21 Ph 21,799 85 2,459 17,015 1,807 18,822 1,311 2,109 24,701 46,500
2006 Jul 14 Ph 26,154 121 2,228 18,208 2,145 20,353 1,865 3,355 27,801 53,955
2007 Jul 11 Ph 25,198 5 2,053 16,811 2,119 18,930 1,970 3,246 26,199 51,397
2008 Jul 11 Ph 29,052 102 2,307 18,173 2,261 20,434 2,510 3,309 28,560 57,612
2009 Jul 3-4n Est 19,697 2010 Jul 16 n Est 15,131 2011 Jul 18 Dph 28,087 411 3,629 15,191 924 16,115 1,755 2,316 23,815 51,902
2012 Jul 13 Dph 31,972 276 5,317 20,171 1,527 21,698 2,612 3,251 32,878 64,850
2013 Jul 17 Dph 16,225 78 8,037 24,277 956 25,233 2,688 2,881 38,839 55,063
2014 Jul 9 Dph 19,587 81 4,205 23,363 1,082 24,445 2,446 3,350 34,446 54,033
Santa Barbara Island 1983 Jun 30 p Gr 237
1984 Jul 11-12 p Gr 280 1985 Jul 5-6 p Gr 543 1986 Jul 9-10 l, p Gr 796 110 1,166 1,962
1986 Jul 9-10 l, p Gr 792 92 1,241 2,033
1987 Jul 9-10 Gr 917g 95 1,349 2,266
1988 Jul 8-9 Gr 1,089g
1989 Jul 14 Gr 1,307g 104 2,240 3,547
1990 Jul 8-9 Gr 1,286g 155 2,549 3,838
1991 Jul 8-9 Gr 1,504g 151 2,974 4,478
1992 Jul 6-7 Gr 1,470g 125 1,956 3,427

36
Table 2. (Continued)
Census date Met
ho
d
Liv
e p
up
s
Dea
d p
ups
Ju
ven
iles
Ad
ult
fem
ales
Yo
un
g m
ales
Ad
ult
fem
ales
or
yo
un
g m
ales
Su
b-a
du
lt m
ales
Ad
ult
mal
es
No
n-p
up
to
tal
To
tal
liv
e
Santa Barbara Island (Continued)
1993 Jul 6-7 Gr 949g 230 1,725 40 106 2,101 3,050
1994 Jul 6-7 Gr 1,688g 540 2,637 109 143 3,429 5,117
1995 Jul 17-18 Gr 1,647g 164 4,592 6,239
1996 Jul 7 Gr 2,326g 549 2,466 175 170 3,360 5,686
1997 Jul 18 Ph 2,095g 0 211 2,185 61 146 2,603 4,698
1997 Jul 8 Gr 2,467g 146 2,047 83 160 2,436 4,903
1997 Jul 8 Gr 2,351g 162 1,898 93 204 2,357 4,709
1998 Jul 13 Gr 564l 195 2,616 3,180
1998 Jul 20 Ph 707g 1 186 2,191 30 129 2,536 3,243
1999 Jul 31 Ph 2,410g 9 266 2,439 14 87 2,806 5,216
2000 Jul 7 Ph 2,851g 5 1,009 3,932 166 305 5,412 8,263
2001 Jul 12 Ph 3,061 18 1,328 3,399 167 274 5,168 8,229
2002 Jul 15 Ph 2,697 9 458 3,177 102 3,279 245 242 4,224 6,921
2003 Jul 10 Ph 1,528 6 554 2,613 51 2,664 208 206 3,632 5,160
2004 Jul 10 Ph 2,484 3 545 4,191 112 4,303 196 267 5,311 7,795
2005 Jul 20 Ph 2,827 4 375 2,992 142 3,134 179 257 3,945 6,772
2006 Jul 11 Ph 3,277 11 374 3,294 190 3,484 141 325 4,324 7,601
2007 Jul 12 Ph 3,473 14 435 3,056 181 3,237 204 384 4,260 7,733
2008 Jul 11 Ph 3,424 16 516 2,697 249 2,946 217 342 4,021 7,445
2009o Est 1,597 2010o Est 1,508 2011 Jul 18 Dph 3,941 31 359 2,414 165 2,579 134 244 3,316 7,257
2012 Jul 13 Dph 3,558 26 452 2,862 221 3,083 208 271 4,014 7,572
2013 Jul 11 Dph 2,918 24 615 3,495 100 3,595 258 351 4,819 7,737
2014 Jul 8 Dph 2,498 17 296 3,785 111 3,896 153 284 4,629 7,127
Santa Catalina Island 2002 Jul 13 Ph 0 0 79 0 12 12 1 3 95 95
2003 Jul 10 Ph 0 0 19 16 0 9 2 2 32 32
2005 Jul 20 Ph 0 0 50 0 76 76 6 0 132 132
2007 Jul 11 Ph 0 0 218 135 0 132 0 4 357 357
2008 Jul 10 Ph 0 0 118 89 0 89 3 1 211 211
2011 Jul 11 Dph 17 0 118 251 22 273 2 6 399 416
2012 Jul 13 Dph 31 0 74 147 6 153 4 7 238 269
2013 Jul 12 Dph 20 0 109 294 5 299 10 8 426 446
2014 Jul 7 Dph 19 0 36 247 24 271 3 12 322 341
Santa Cruz Island 1992 Jul 18 Ph 0 0 31 105 3 6 145 145
2002 Jul 16 Ph 0 0 29 0 98 98 12 6 145 145
2003 Jul 11 Ph 2 0 311 398 122 260 27 4 602 604
2004 Jul 17 Ph 0 0 117 0 256 128 11 2 258 258
2005 Jul 8 Ph 0 0 56 155 17 172 7 6 241 241

37
Table 2. (Continued)
Census date Met
ho
d
Liv
e p
up
s
Dea
d p
ups
Ju
ven
iles
Ad
ult
fem
ales
Yo
un
g m
ales
Ad
ult
fem
ales
or
yo
un
g m
ales
Su
b-a
du
lt m
ales
Ad
ult
mal
es
No
n-p
up
to
tal
To
tal
liv
e
Santa Cruz Island (Continued)
2007 Jul 10 Ph 0 0 309 740 25 382 13 4 708 708
2008 Jul 12 Ph 0 0 40 305 11 316 18 1 375 375
2011 Jul 11 Dph 1 0 285 683 16 699 38 3 1,025 1,026
2012 Jul 13 Dph 0 0 402 1,078 56 1,134 20 15 1,571 1,571
2013 Jul 8 Dph 0 0 450 935 31 966 34 19 1,469 1,469
2014 Jul 8 Dph 0 0 119 650 56 706 32 13 870 870
Santa Rosa Island 2002 Jul 16 AO 0 0 0 0 0 0 0 0 0 0
2003 Jul 11 Ph 0 0 33 53 0 53 2 1 89 89
2004 Jul 17 Ph 0 0 8 0 52 26 3 3 40 40
2005 Jul 8 Ph 0 0 4 11 1 12 0 3 19 19
2007 Jul 10 Ph 0 0 6 17 2 19 2 1 28 28
2008 Jul 12 Ph 0 0 234 296 0 296 4 2 536 536
2011 Jul 11 Dph 0 0 365 515 6 521 9 5 900 900
2012 Jul 13-14 Dph 3 0 609 835 87 922 38 12 1,581 1,584
2013 Jul 11 Dph 3 0 155 561 5 566 32 15 768 771
2014 Jul 10 Dph 1 0 109 651 118 769 12 7 897 898 aOliver and Lowry (1987) bOliver et al. (1988) cWexler and Oliver (1988)
dOliver and Wexler (1991) eOliver (1991a) fOliver (1991)
gLowry and Maravilla-Chavez (2005) hCarretta, et al. (2000) iCastle Rock (the sub-island at San Miguel Island) was not censused jEstimate for Castle Rock added to ground count (ground count multiplied by 1.04) kRevised count for Lowry and Maravilla-Chavez (2005); multiplying 12,152 pups counted by
1.05 yields 12,760 pups. lRevised count for Lowry et al. (1987) and Lowry and Maravilla-Chavez (2005) mLowry (1999) nAppendix 1 oEstimated from data in Appendix 1 (subtracted SMI+SNI+SCI from total estimate) pLowry, et al. (1987)

38
Table 3. Number of California sea lions counted within seven zones in central and northern
California for surveys conducted in July or August (refer to map in Figure 1A for location of
zones). Some zones required more than one day to survey due to weather conditions. Counts
were made by biologists on the ground (Gr), from vertical 126-mm format aerial color
photographs (Ph), vertical aerial digital photographs (DPh), or hand-held digital photographs
(HDPh). AO denotes aerial observation when no animals were observed during the survey.
Census date(s) Met
ho
d
Liv
e p
up
s
Dea
d p
up
s
Juv
enil
es
Ad
ult
fem
ales
Yo
un
g m
ales
Ad
ult
fem
ales
or
yo
ung
mal
es
Su
b-a
du
lt m
ales
Ad
ult
mal
es
No
n-p
up
to
tal
To
tal
Liv
e
Northern California: Zone A
1998 Jul 15-16 Gr/Ph 0 0 358 206 148 22 734 734
1999 Jul 7 Ph 0 0 111 167 5 4 287 287
2000 Jul 8 Ph 0 0 49 0 52 52 3 6 110 110
2001 Jul 17 Ph 0 0 361 0 49 49 37 14 461 461
2002 Jul 9 Ph 0 0 204 0 426 426 1 0 631 631
2003 Jul 12 Ph 0 0 1,521 0 333 333 20 2 1,876 1,876
2004 Jul 5 Ph 0 0 702 0 303 303 4 0 1,009 1,009
2005 Jul 12 Ph 0 0 254 0 267 267 15 1 537 537
2009 Jul 8 Ph 0 0 1,416 19 1,241 1,260 104 68 2,848 2,848
2011 Jul 15 DPh 0 0 34 0 233 233 6 2 275 275
2012 Jul 5-6 DPh 0 0 43 0 228 228 12 20 303 303
2013 Jul 6 DPh 0 0 0 0 5 5 4 4 13 13
Northern California: Zone B
1998 Jul 7, 13, 15 Ph 0 0 2,382 116 162 62 2,722 2,722
1999 Jul 7 Ph 0 0 6 6 1 1 14 14
2000 Jul 8 Ph 0 0 1 0 1 1 2 0 4 4
2001 Jul 17 Ph 0 0 17 0 31 31 24 7 79 79
2002 Jul 9 Ph 0 0 13 0 6 6 2 0 21 21
2003 Jul 12 Ph 0 0 360 0 51 51 1 1 413 413
2004 Jul 5 Ph 0 0 0 0 9 9 2 1 12 12
2005 Jul 12 Ph 0 0 2 0 3 3 0 0 5 5
2009 Jul 8 Ph 0 0 446 0 161 161 58 31 696 696
2011 Jul 15 DPh 0 0 0 0 1 1 5 3 9 9
2012 Jul 5 DPh 0 0 60 0 88 88 20 23 191 191
2013 Jul 6 AO 0 0 0 0 0 0 0 0 0 0
Northern California: Zone C
1998 Jul 13, 18 Ph 0 0 320 287 190 101 898 898
1999 Jul 7 Ph 0 0 0 0 1 0 1 1
2000 Jul 12 Ph 0 0 72 0 5 5 28 11 116 116
2001 Jul 17 Ph 0 0 422 0 181 181 132 146 881 881
2002 Jul 12 Ph 0 0 638 0 83 83 2 2 725 725
2003 Jul 8, 11, 12 Ph 1 0 1,644 1 450 451 40 14 2,149 2,150
2004 Jul 9 Ph 0 0 5 0 0 0 0 0 5 5
2005 Jul 12 Ph 0 0 137 0 33 33 10 18 198 198
2009 Jul 8, 10, 12, 13 Ph 0 0 965 62 876 938 94 28 2,025 2,025
2011 Jul 14-15 DPh 1 0 10 19 11 30 2 7 49 50

39
Table 3. (Continued)
Census date(s) Met
ho
d
Liv
e p
up
s
Dea
d p
up
s
Juv
enil
es
Ad
ult
fem
ales
Yo
un
g m
ales
Ad
ult
fem
ales
or
yo
ung
mal
es
Su
b-a
du
lt m
ales
Ad
ult
mal
es
No
n-p
up
to
tal
To
tal
Liv
e
Northern California: Zone C (Continued)
2012 Jul 4 DPh 0 0 58 0 116 116 16 29 219 219
2013 Jul 5 DPh 0 0 20 10 9 19 6 12 57 57
Central California: Zone D
1998 Jul 18 Ph 55 0 1,918 7,318 1,283 290 10,809 10,864
1999 Jul 6, 8 Ph 3 0 193 970 109 91 1,363 1,366
2000 Jul 8, 12 Ph 4 0 789 6 441 447 252 90 1,578 1,582
2001 Jul 17 Ph 0 0 1,658 58 856 914 441 190 3,203 3,203
2002 Jul 9, 23 Ph 29 0 2,863 49 2,110 2,159 91 122 5,235 5,264
2003 Jul 8, 9, 14 Ph 48 0 4,117 437 3,043 3,480 241 98 7,936 7,984
2004 Jul 19 Ph 10 0 2,055 47 568 615 451 224 3,345 3,355
2005 Jul 23, 24 Ph 11 0 859 446 1,133 1,579 592 430 3,460 3,471
2007 Jul 18 Ph 12 0 3,893 505 656 1,161 732 262 6,048 6,060
2009 Jul 7, 11, 13 Ph 71 0 1,841 4,988 1,059 6,047 585 170 8,643 8,714
2011 Jul 14 DPh 136 3 399 1,367 727 2,094 184 183 2,860 2,996
2012 Jul 4 DPh 174 2 1,068 963 2,639 3,602 254 257 5,181 5,355
2013 Aug 6 HDPh 141 0 617 2,885 860 3,745 986 346 5,694 5,835
Central California: Zone E
1998 Jul 10 Ph 54 0 2,920 3,226 564 178 6,888 6,942
1999 Jul 9, 11 Ph 4 0 1,226 5,652 398 65 7,341 7,345
2000 Jul 6, 8 Ph 6 0 6,690 481 759 1,240 224 121 8,275 8,281
2001 Jul 14 Ph 2 0 7,219 306 2,179 2,485 612 283 10,599 10,601
2002 Jul 23 Ph 5 0 7,808 172 2,450 2,622 1,314 480 12,224 12,229
2003 Jul 8 Ph 48 0 1,536 5,451 981 6,432 242 92 8,302 8,350
2004 Jul 9 Ph 11 0 1,764 88 402 490 86 64 2,404 2,415
2005 Jul 10 Ph 11 0 3,408 1,009 23 1,032 124 67 4,631 4,642
2007 Jul 1 Ph 13 0 3,926 228 28 256 85 50 4,317 4,330
2009 Jul 7 Ph 75 1 1,724 8,280 639 8,919 407 125 11,175 11,250
2011 Jul 14, 15, 16 DPh 52 0 3,320 5,567 990 6,557 850 296 11,023 11,075
2012 Jul 3 DPh 94 0 2,046 1,592 2,788 4,380 307 168 6,901 6,995
2013 Jul 7 DPh 92 0 2,061 1,266 224 1,490 152 228 3,931 4,023
Central California: Zone F
1998 Jul 10 Ph 12 0 63 510 125 50 748 760
1999 Jul 9, 11 Ph 0 0 270 578 90 14 952 952
2000 Jul 6 Ph 0 0 1,569 222 443 665 80 41 2,355 2,355
2001 Jul 14 Ph 0 0 574 248 319 567 124 81 1,346 1,346
2002 Jul 8 Ph 1 0 3,140 24 686 710 61 44 3,955 3,956
2003 Jul 8 Ph 10 0 632 647 387 1,034 52 29 1,747 1,757
2004 Jul 9 Ph 1 0 2,264 0 756 756 31 6 3,057 3,058
2005 Jul 10 Ph 4 0 2,168 694 7 701 57 28 2,954 2,958
2007 Jul 1 Ph 5 0 2,850 525 10 535 24 11 3,420 3,425
2009 Jul 6-7 Ph 0 0 476 985 63 1,048 79 27 1,630 1,630

40
Table 3. (Continued)
Census date(s) Met
ho
d
Liv
e p
up
s
Dea
d p
up
s
Juv
enil
es
Ad
ult
fem
ales
Yo
un
g m
ales
Ad
ult
fem
ales
or
yo
ung
mal
es
Su
b-a
du
lt m
ales
Ad
ult
mal
es
No
n-p
up
to
tal
To
tal
Liv
e
Central California: Zone F (Continued)
2011 Jul 16 DPh 6 0 1,327 1,195 231 1,426 228 72 3,053 3,059
2012 Jul 3 DPh 6 0 1,712 609 196 805 47 18 2,582 2,588
2013 Jul 7 DPh 0 0 1,619 897 190 1,087 35 21 2,762 2,762
Central California: Zone G
1998 Jul 10 Ph 0 0 779 1,362 92 30 2,263 2,263
1999 Jul 9 Ph 0 0 919 2,426 186 63 3,594 3,594
2000 Jul 6 Ph 0 0 2,637 1,632 620 2,252 148 61 5,098 5,098
2001 Jul 14, 16 Ph 0 0 3,810 2,271 489 2,760 191 50 6,811 6,811
2002 Jul 8, 23 Ph 0 0 4,825 0 1,496 1,496 214 49 6,584 6,584
2003 Jul 8 Ph 3 0 1,569 754 1,339 2,093 182 50 3,894 3,897
2004 Jul 9, 17 Ph 0 0 2,959 117 2,058 2,175 156 29 5,319 5,319
2005 Jul 10 Ph 0 0 4,757 2,505 7 2,512 195 57 7,521 7,521
2007 Jul 1,10 Ph 1 0 7,949 1,775 587 2,362 146 74 10,531 10,532
2009 Jul 6 Ph 2 0 2,096 7,229 2,973 10,202 288 106 12,692 12,694
2011 Jul 15, 16, 18 DPh 1 0 1,344 2,981 748 3,729 212 72 5,357 5,358
2012 Jul 3 DPh 2 0 2,475 931 673 1,604 166 77 4,322 4,324
2013 Jul 7 DPh 0 0 2,701 1,663 337 2,000 107 62 4,870 4,870

41
Table 4. Counts of California sea lions at Año Nuevo Island, South Farallon Islands, and North
Farallon Islands from aerial photographic surveys conducted during 1992-2013.
Census date Met
hod
Liv
e pups
Dea
d p
ups
Juven
iles
Adult
fem
ales
Young m
ales
Adult
fem
ales
or
young m
ales
Sub
-adult
mal
es
Adult
mal
es
Non-p
up t
ota
l
Tota
l li
ve
Año Nuevo Island
1992 Jul 08 Ph 4 0 554
1,505 179 71 2,309 2,313
1993 Jul 08 Ph 0 0 263
2,975 113 61 3,412 3,412
1994 Jul 06 Ph 1 0 82
2,696 58 59 2,895 2,896
1995 Jul 11 Ph 3 0 1761
3,490 358 96 5,705 5,708
1996 Jul 10 Ph 3 0 383
2,938 417 224 3,962 3,965
1997 Jul 10 Ph 1 0 454
7,404 277 223 8,358 8,359
1998 Jul 10 Ph 51 0 2,692 2,687 451 126 5,956 6,007
1999 Jul 09 Ph 4 0 1,010 4,925 205 61 6,201 6,205
2000 Jul 08 Ph 6 0 4,893 456 353 809 154 93 5,949 5,955
2001 Jul 14 Ph 2 0 5,704 202 1,965 2,167 517 267 8,655 8,657
2002 Jul 23 Ph 5 0 5,525 172 2,147 2,319 1,149 441 9,434 9,439
2003 Jul 08 Ph 48 0 1,077 5,451 69 5,520 196 81 6,874 6,922
2004 Jul 09 Ph 11 0 1,688 88 384 472 74 56 2,290 2,301
2005 Jul 10 Ph 11 0 2,877 927 18 945 109 60 3,991 4,002
2007 Jul 01 Ph 13 0 3,652 225 28 253 85 48 4,038 4,051
2009 Jul 07 Ph 75 1 934 7,157 564 7,721 356 102 9,113 9,188
2011 Jul 14 DPh 52 0 1,418 4,381 320 4,701 624 253 6,996 7,048
2012 Jul 03 DPh 94 0 1,162 1,301 2,226 3,527 275 151 5,115 5,209
2013 Jul 05 DPh 92 0 1,785 1,165 142 1,307 136 209 3,437 3,529
South Farallon Islands
1995 Jul 11 Ph 11 0 1,432
2,254 211 69 3,966 3,977
1997 Jul 10 Ph 22 0 61
7,226 313 188 7,788 7,810
1998 Jul 18 Ph 55 0 1,380 7,102 1,231 281 9,994 10,049
1999 Jul 06 Ph 3 0 186 939 108 91 1,324 1,327
2000 Jul 12 Ph 4 0 761 6 427 433 250 90 1,534 1,538
2001 Jul 17 Ph 0 0 1,613 58 850 908 427 186 3,134 3,134
2002 Jul 09 Ph 29 0 2,726 49 2094 2,143 78 91 5,038 5,067
2003 Jul 14 Ph 48 0 2,186 437 2855 3,292 233 92 5,803 5,851
2004 Jul 19 Ph 10 0 2,004 47 547 594 434 218 3,250 3,260
2005 Jul 24 Ph 11 0 858 446 1129 1,575 582 414 3,429 3,440
2007 Jul 18 Ph 12 0 3,860 505 632 1,137 659 175 5,831 5,843
2009 Jul 11 Ph 71 0 1,144 4,815 830 5,645 511 145 7,445 7,516
2011 Jul 14 DPh 136 3 398 1,367 727 2,094 184 182 2,858 2,994
2012 Jul 04 DPh 174 2 1,066 963 2599 3,562 254 254 5,136 5,310
2013 Aug 06 DPh 141 0 616 2,876 844 3,720 979 343 5,658 5,799

42
Table 4. (Continued)
Census date Met
hod
Liv
e pups
Dea
d p
ups
Juven
iles
Adult
fem
ales
Young m
ales
Adult
fem
ales
or
young m
ales
Sub
-adult
mal
es
Adult
mal
es
Non-p
up t
ota
l
Tota
l li
ve
North Farallon Islands
1995 Jul 11 Ph 0 0 48
44 1 1 94 94
1998 Jul 18 Ph 0 0 47 53 14 0 114 114
1999 Jul 06 Ph 0 0 2 1 0 0 3 3
2000 Jul 12 Ph 0 0 27 0 13 13 2 0 42 42
2001 Jul 17 Ph 0 0 1 0 1 1 0 0 2 2
2002 Jul 09 Ph 0 0 136 0 16 16 2 0 154 154
2003 Jul 14 Ph 0 0 171 0 117 117 3 1 292 292
2004 Jul 19 Ph 0 0 51 0 21 21 17 6 95 95
2007 Jul 18 Ph 0 0 20 0 18 18 23 2 63 63
2009 Jul 11 Ph 0 0 100 93 36 129 14 5 248 248
2012 Jul 04 DPh 0 0 2 0 40 40 0 3 45 45
2013 Aug 06 DPh 0 0 1 9 16 25 7 3 36 36
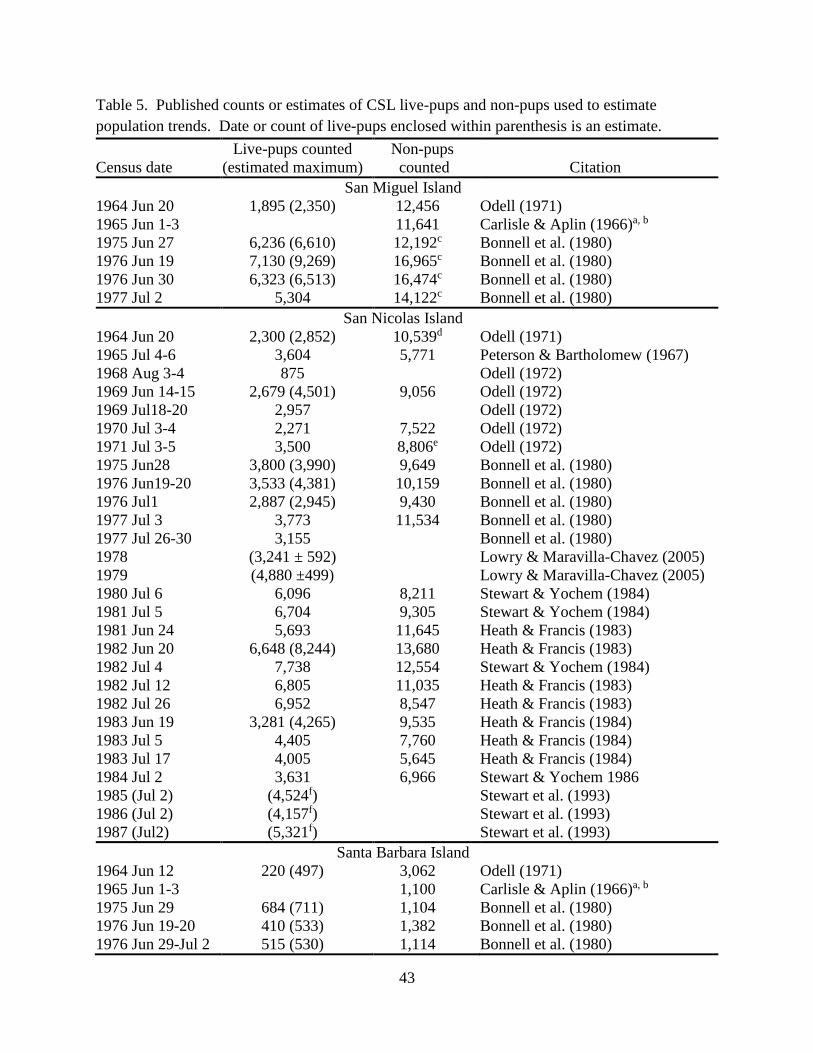
43
Table 5. Published counts or estimates of CSL live-pups and non-pups used to estimate
population trends. Date or count of live-pups enclosed within parenthesis is an estimate.
Census date
Live-pups counted
(estimated maximum)
Non-pups
counted Citation
San Miguel Island
1964 Jun 20 1,895 (2,350) 12,456 Odell (1971)
1965 Jun 1-3 11,641 Carlisle & Aplin (1966)a, b
1975 Jun 27 6,236 (6,610) 12,192c Bonnell et al. (1980)
1976 Jun 19 7,130 (9,269) 16,965c Bonnell et al. (1980)
1976 Jun 30 6,323 (6,513) 16,474c Bonnell et al. (1980)
1977 Jul 2 5,304 14,122c Bonnell et al. (1980)
San Nicolas Island
1964 Jun 20 2,300 (2,852) 10,539d Odell (1971)
1965 Jul 4-6 3,604 5,771 Peterson & Bartholomew (1967)
1968 Aug 3-4 875 Odell (1972)
1969 Jun 14-15 2,679 (4,501) 9,056 Odell (1972)
1969 Jul18-20 2,957 Odell (1972)
1970 Jul 3-4 2,271 7,522 Odell (1972)
1971 Jul 3-5 3,500 8,806e Odell (1972)
1975 Jun28 3,800 (3,990) 9,649 Bonnell et al. (1980)
1976 Jun19-20 3,533 (4,381) 10,159 Bonnell et al. (1980)
1976 Jul1 2,887 (2,945) 9,430 Bonnell et al. (1980)
1977 Jul 3 3,773 11,534 Bonnell et al. (1980)
1977 Jul 26-30 3,155 Bonnell et al. (1980)
1978 (3,241 ± 592) Lowry & Maravilla-Chavez (2005)
1979 (4,880 ±499) Lowry & Maravilla-Chavez (2005)
1980 Jul 6 6,096 8,211 Stewart & Yochem (1984)
1981 Jul 5 6,704 9,305 Stewart & Yochem (1984)
1981 Jun 24 5,693 11,645 Heath & Francis (1983)
1982 Jun 20 6,648 (8,244) 13,680 Heath & Francis (1983)
1982 Jul 4 7,738 12,554 Stewart & Yochem (1984)
1982 Jul 12 6,805 11,035 Heath & Francis (1983)
1982 Jul 26 6,952 8,547 Heath & Francis (1983)
1983 Jun 19 3,281 (4,265) 9,535 Heath & Francis (1984)
1983 Jul 5 4,405 7,760 Heath & Francis (1984)
1983 Jul 17 4,005 5,645 Heath & Francis (1984)
1984 Jul 2 3,631 6,966 Stewart & Yochem 1986
1985 (Jul 2) (4,524f) Stewart et al. (1993)
1986 (Jul 2) (4,157f) Stewart et al. (1993)
1987 (Jul2) (5,321f) Stewart et al. (1993)
Santa Barbara Island
1964 Jun 12 220 (497) 3,062 Odell (1971)
1965 Jun 1-3 1,100 Carlisle & Aplin (1966)a, b
1975 Jun 29 684 (711) 1,104 Bonnell et al. (1980)
1976 Jun 19-20 410 (533) 1,382 Bonnell et al. (1980)
1976 Jun 29-Jul 2 515 (530) 1,114 Bonnell et al. (1980)

44
Table 5. (Continued)
Census date
Live-pups counted
(estimated maximum)
Non-pups
counted Citation
Santa Barbara Island
1976 Jul 29 582 Bonnell et al. (1980)
1976 Jul 31–Aug 3 403 Bonnell et al. (1980)
1977 Jun 30-Jul 3 349 1,200 Bonnell et al. (1980)
1977 Jul 29 492 Bonnell et al. (1980)
1978 (Jul 2) 465 Heath & Francis (1983)
1979 (Jul 2) 625 Heath & Francis (1983)
1980 (773 ± 54) Lowry & Maravilla-Chavez (2005)
1981 (Jul 2) 730 Heath & Francis (1983)
1982 (Jul 2) 818 Heath & Francis (1983)
San Clemente Island
1964 Jun 12 183 (414) 3,637 Odell (1971)
1965 Jun 1-3 1,900 Carlisle & Aplin (1966)a, b
1975 Jun 29 608 (632) 1,239 Bonnell et al. (1980)
1976 Jun 19-20 413 (512) 1,463 Bonnell et al. (1980)
1976 Jul 31-Aug 3 438 Bonnell et al. (1980)
1977 Jul 3 351 1,067 Bonnell et al. (1980)
1978 (465 ± 38) Lowry & Maravilla-Chavez (2005)
1979 (549 ± 31) Lowry & Maravilla-Chavez (2005)
1980 (619 ± 34) Lowry & Maravilla-Chavez (2005)
Richardson Rock
1975 Jun 27 0 131 Bonnell et al. (1980)
1976 Jun 19 368 Bonnell et al. (1980)
1976 Jun 30 3 274 Bonnell et al. (1980)
1977 Jul 2 0 305 Bonnell et al. (1980)
Anacapa Island
1965 Jun 1-3 0 Carlisle & Aplin (1966)
1975 Jun 27-30 0 0 Bonnell et al. (1980)
1977 Jun 30-Jul 3 0 0 Bonnell et al. (1980)
Santa Cruz Island
1964 Jun 20 0 89 Odell (1971)
1965 Jun 1-3 401 Carlisle & Aplin (1966) a, b
1975 Jun 27-30 0 25 Bonnell et al. (1980)
1976 Jun 19-20 0 212 Bonnell et al. (1980)
1976 Jun 29-Jul 2 0 239 Bonnell et al. (1980)
1977 Jun 30-Jul 3 0 185 Bonnell et al. (1980)
Santa Rosa Island
1964 Jun 20 0 0 Odell (1971)
1965 Jun 1-3 125 Carlisle & Aplin (1966) a, b
1975 Jun 27-30 0 0 Bonnell et al. (1980)
1976 Jun 29-Jul 2 0 111 Bonnell et al. (1980)
1977 Jun 30-Jul 3 0 0 Bonnell et al. (1980)

45
Table 5. (Continued)
Census date
Live-pups counted
(estimated maximum)
Non-pups
counted Citation
Santa Catalina Island
1964 Jun 20 0 92 Odell (1971)
1965 Jun 1-3 35 Carlisle & Aplin (1966) a, b
1975 Jun 27-30 0 0 Bonnell et al. (1980)
1976 Jun 29-Jul 2 0 14 Bonnell et al. (1980)
1977 Jun 30-Jul 3 0 106 Bonnell et al. (1980)
South Farallon Islands
1982 July 15 2 1,836 Huber et al. (1983)
1983 July 7 2 3,494 Huber et al. (1985)
1984 July 6 1 2,297 Huber et al. (1986)
Central California
1980 July 1-3 4,272 Bonnell et al. (1983)
1981 June 30-July 2 7,935 Bonnell et al. (1983)
1982 June 28-30 11,208 Bonnell et al. (1983)
Northern California
1980 July 1-3 214 Bonnell et al. (1983)
1981 June 30-July 2 0 Bonnell et al. (1983)
1982 June 28-30 1 Bonnell et al. (1983) aCounts of CSLs south of Point Conception may include Steller sea lions. bCount of non-pups may contain pups. cCount for Richardson Rock removed from San Miguel Island total. dNon-pup total derived from sum of adult males and females/immature males. eNon-pup total derived from sum of total males and females/immature males. fCounts estimated by digitizing Figure 4 in Stewart et al. (1993).

46
Table 6. Previously published counts of live California sea lion pups at San Nicolas Island,
California used to estimate corrections for survey date (see text) when live pup counts were
made prior to the July 2 maximum.
Year date Julian
day
Live-
pup
count
Proportion of
maximum live-
pup count
Source of pup count data
1982 16-May 136 6 0.001 Heath and Francis (1983)
1982 23-May 143 43 0.006 Heath and Francis (1983)
1982 6-Jun 157 1,853 0.267 Heath and Francis (1983)
1982 20-Jun 171 6,648 0.956 Heath and Francis (1983)
1982 12-Jul 193 6,805 0.979 Heath and Francis (1983)
1982 26-Jul 207 6,952 1 Heath and Francis (1983)
1983 15-May 135 2 0 Heath and Francis (1984)
1983 29-May 149 127 0.029 Heath and Francis (1984)
1983 5-Jun 156 728 0.165 Heath and Francis (1984)
1983 19-Jun 170 3,281 0.745 Heath and Francis (1984)
1983 5-Jul 186 4,405 1 Heath and Francis (1984)
1980 17-May 138 34 0.006 Stewart and Yochem (1984)
1980 8-Jun 160 1,276 0.209 Stewart and Yochem (1984)
1980 6-Jul 188 6,096 1 Stewart and Yochem (1984)
1981 16-May 136 0 0 Stewart and Yochem (1984)
1981 22-May 142 121 0.018 Stewart and Yochem (1984)
1981 12-Jun 163 3,336 0.498 Stewart and Yochem (1984)
1981 5-Jul 186 6,704 1 Stewart and Yochem (1984)
1981 11-Jul 192 6,626 0.988 Stewart and Yochem (1984)
1981 24-Jul 205 6,676 0.996 Stewart and Yochem (1984)
1982 29-May 149 274 0.035 Stewart and Yochem (1984)
1982 12-Jun 163 3,396 0.439 Stewart and Yochem (1984)
1982 4-Jul 185 7,738 1 Stewart and Yochem (1984)
1984 19-May 140 3 0.001 Stewart and Yochem (1986)
1984 10-Jun 162 631 0.174 Stewart and Yochem (1986)
1984 17-Jun 169 1,786 0.492 Stewart and Yochem (1986)
1984 2-Jul 184 3,631 1 Stewart and Yochem (1986)
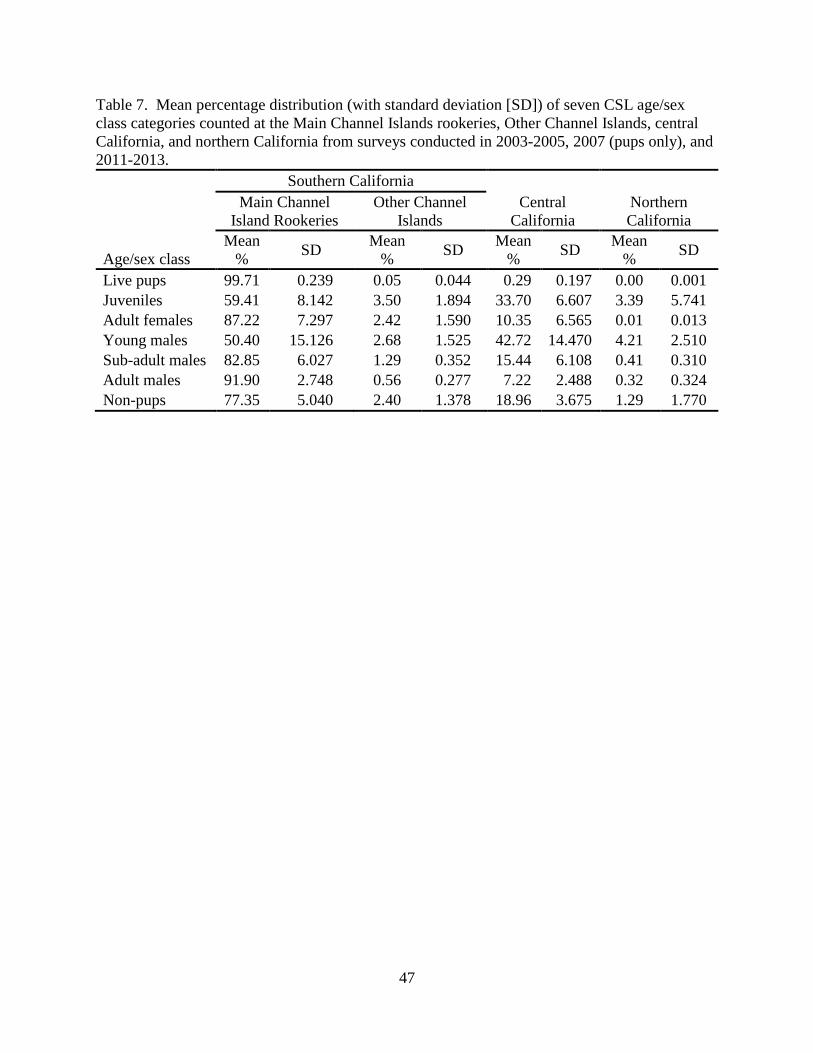
47
Table 7. Mean percentage distribution (with standard deviation [SD]) of seven CSL age/sex
class categories counted at the Main Channel Islands rookeries, Other Channel Islands, central
California, and northern California from surveys conducted in 2003-2005, 2007 (pups only), and
2011-2013.
Southern California
Age/sex class
Main Channel
Island Rookeries
Other Channel
Islands
Central
California
Northern
California
Mean
% SD
Mean
% SD
Mean
% SD
Mean
% SD
Live pups 99.71 0.239 0.05 0.044 0.29 0.197 0.00 0.001
Juveniles 59.41 8.142 3.50 1.894 33.70 6.607 3.39 5.741
Adult females 87.22 7.297 2.42 1.590 10.35 6.565 0.01 0.013
Young males 50.40 15.126 2.68 1.525 42.72 14.470 4.21 2.510
Sub-adult males 82.85 6.027 1.29 0.352 15.44 6.108 0.41 0.310
Adult males 91.90 2.748 0.56 0.277 7.22 2.488 0.32 0.324
Non-pups 77.35 5.040 2.40 1.378 18.96 3.675 1.29 1.770

48
Table 8. Mean percentage distribution (with standard deviation [SD]) of seven CSL age/sex class categories counted at zones in
central California, northern California, and at each of the Channel Islands in southern California from surveys conducted in 2003-
2005, 2007 (pups only), and 2011-2013. Refer to Figure 1 for location of zones and islands (Richardson rock is 10 km northwest of
Point Bennett, San Miguel Island).
Zone, Rock, or Island Live pups Juveniles Adult females Young males Sub-adult males Adult males Non-pups
Mean % SD Mean % SD Mean % SD Mean % SD Mean % SD Mean % SD Mean % SD
Northern CA, zone A 0.00 0.00 1.77 2.52 0.00 0.00 2.89 1.59 0.16 0.12 0.07 0.10 0.70 0.74
Northern CA, zone B 0.00 0.00 0.30 0.61 0.00 0.00 0.25 0.35 0.07 0.11 0.06 0.12 0.11 0.18
Northern CA, zone C 0.00 0.00 1.32 2.77 0.01 0.01 1.06 1.64 0.18 0.19 0.19 0.14 0.48 0.92
Central CA, zone D 0.14 0.13 6.33 5.91 1.71 1.46 18.49 8.50 7.06 4.83 3.78 1.97 4.77 2.10
Central CA, zone E 0.09 0.07 9.86 3.65 4.79 4.96 10.30 9.72 4.49 4.47 2.18 1.35 6.25 3.25
Central CA, zone F 0.01 0.01 6.69 2.35 1.21 0.66 3.66 2.81 1.19 1.21 0.42 0.33 2.69 0.49
Central CA, zone G 0.00 0.00 10.82 4.74 2.64 1.85 10.28 7.78 2.70 1.08 0.83 0.23 5.25 1.46
Richardson Rock 0.00 0.00 0.24 0.08 0.22 0.08 0.28 0.37 0.56 0.28 0.14 0.05 0.24 0.03
San Miguel Island 44.78 2.96 36.89 7.49 42.70 6.18 26.15 9.27 42.35 2.12 46.18 4.19 40.12 5.22
Santa Rosa Island 0.00 0.00 0.84 1.06 0.56 0.62 0.27 0.35 0.19 0.23 0.09 0.08 0.54 0.61
Santa Cruz Island 0.00 0.00 1.13 0.63 0.95 0.73 0.97 0.99 0.33 0.17 0.12 0.10 0.84 0.53
Anacapa Island 0.04 0.04 1.29 0.42 0.68 0.30 1.16 1.52 0.21 0.13 0.21 0.12 0.78 0.29
Santa Barbara Island 5.80 0.88 2.00 0.37 5.74 1.41 1.86 0.82 3.01 0.67 3.86 0.70 4.17 0.72
San Nicolas Island 44.71 3.49 18.34 7.78 33.54 4.44 20.94 7.46 35.31 5.82 38.78 3.73 29.22 3.91
Santa Catalina Island 0.02 0.02 0.31 0.18 0.23 0.20 0.37 0.56 0.08 0.05 0.06 0.05 0.24 0.15
San Clemente Island 4.41 0.76 1.93 0.85 5.06 0.48 1.14 0.71 2.12 0.67 3.03 0.48 3.64 0.48

49
Table 9. Average annual rates of increase (λ) during 1964 to 2014 predicted from (A) counts of
live-pups and (B) counts of non-pups at rookeries or regions. Rates are estimated from the year
coefficient of a backward-stepwise Generalized Linear Model (GLM) with Multivariate ENSO
Index (MEI), Sea Level Height at Los Angeles, California harbor (SLH-LA), Pacific Decadal
Oscillations (PDO), and North Pacific Gyre Oscillation (NPGO) as continuous covariates. Only
significant (p≤0.05) covariates are included.
Rookery, group, or
region (year data
range) N
Adjusted
R2 Effect Coefficient t
p-
Value
95% CI for
regression
coefficients Predicted
λ
95% CI for λ
Lower Upper Lower Upper
A. Live pup counts
San Miguel Island
(1964-2014)
41 0.878 Constant -71.364 -14.935 <0.001 -81.037 -61.691
Year 0.041 16.909 <0.001 0.036 0.045 1.042 1.037 1.046
SLH-LA -2.279 -2.906 0.006 -3.866 -0.691
San Nicolas
Island
(1964-2014)
39 0.841 Constant -101.084 -12.844 <0.001 -114.523 -85.984
Year 0.054 13.758 <0.001 0.048 0.062 1.055 1.049 1.064 SLH-LA -7.830 -5.776 <0.001 -9.932 -4.090
NPGO -0.115 -2.208 0.034 -0.262 -0.044
Santa Barbara
Island
(1964-2014)
38 0.856 Constant -101.084 -12.844 <0.001 -117.077 -85.09
Year 0.054 13.758 <0.001 0.046 0.062 1.055 1.047 1.064 SLH-LA -7.83 -5.776 <0.001 -10.585 -5.075
NPGO -0.115 -2.208 0.034 -0.22 -0.009
San Clemente
Island
(1964-2014)
38 0.905 Constant -84.83 -16.817 <0.001 -95.070 -74.589
Year 0.046 18.202 <0.001 0.041 0.051 1.047 1.042 1.052
SLH-LA -4.633 -6.011 <0.001 -6.198 -3.068
Año Nuevo
Island
(1992-2013)
19 0.739 Constant -421.492 -7.222 <0.001 -545.219 -297.76
Year 0.212 7.262 <0.001 0.15 0.274 1.236 1.162 1.315
SLH-LA 11.951 2.603 0.019 2.216 21.686
S. Farallon Islands
(1981-2013) 18 0.493 Constant -237.021 -4.137 0.001 -358.472 -115.57
Year 0.120 4.185 0.001 0.059 0.181 1.127 1.061 1.198
Año Nuevo Is. +
S. Farallon Islands
(1995-2013)
15 0.557 Constant -379.106 -4.118 0.001 -579.693 -178.52
Year 0.191 4.158 0.001 0.091 0.291 1.210 1.095 1.338
SLH-LA 15.651 2.322 0.039 0.968 30.335
Main Channel
Islands rookeries
(1964-2014)
34 0.923 Constant -81.521 -16.992 <0.001 -91.319 -71.723
Year 0.046 19.13 <0.001 0.041 0.051 1.047 1.042 1.052 SLH-LA -5.369 -6.361 <0.001 -7.092 -3.645
NPGO -0.100 -3.223 0.003 -0.164 -0.037
U.S. population
(1964-2014)
34 0.924 Constant -81.669 -17.120 <0.001 -91.411 -71.927
Year 0.046 19.271 <0.001 0.041 0.051 1.047 1.042 1.052 SLH-LA -5.346 -6.370 <0.001 -7.059 -3.632
NPGO -0.099 -3.215 0.003 -0.162 -0.036
B. Non-pup counts
San Miguel
Island
(1964-2014)
26 0.849 Constant -46.827 -9.793 <0.001 -56.719 -36.935
Year 0.029 11.922 <0.001 0.024 0.034 1.029 1.024 1.035
SLH-LA -1.785 -2.102 0.047 -3.542 -0.028
San Nicolas
Island
(1964-2014)
33 0.891 Constant -54.591 -13.732 <0.001 -62.710 -46.472
Year 0.032 16.176 <0.001 0.028 0.036 1.033 1.028 1.037
SLH-LA -2.318 -3.079 0.004 -3.855 -0.780

50
Table 9. (Cont.)
Rookery, group, or
region (year data
range) N
Adjusted
R2 Effect Coefficient t
p-
Value
95% CI for
regression
coefficients Predicted
λ
95% CI for λ
Lower Upper Lower Upper
B. Non-pup counts (Cont.)
Santa Barbara
Is. (1964-2014) 31 0.575 Constant -50.12 -5.565 <0.001 -68.539 -31.701
Year 0.029 6.449 <0.001 0.020 0.038 1.029 1.020 1.039
San Clemente
Island
(1964-2014)
39 0.498 Constant -39.671 -3.879 <0.001 -60.412 -18.93
Year 0.024 4.617 <0.001 0.013 0.034 1.024 1.013 1.035
PDO -0.277 -3.71 0.001 -0.428 -0.126
Main Channel
Islands rookeries
(1964-2014)
26 0.885 Constant -46.782 -11.237 <0.001 -55.394 -38.17
Year 0.029 13.843 <0.001 0.025 0.033 1.029 1.025 1.034
SLH-LA -2.157 -2.916 0.008 -3.686 -0.627
Southern
California
(1964-2014)
14 0.942 Constant -45.599 -11.76 <0.001 -54.048 -37.15
Year 0.028 14.568 <0.001 0.024 0.033 1.028 1.024 1.034
Other Channel Is.
(1964-2014) 14 0.647 Constant -120.165 -4.71 0.001 -175.751 -64.579
Year 0.064 4.978 <0.001 0.036 0.092 1.066 1.037 1.096
Año Nuevo
Island
(1992-2013)
19 0.197 Constant 20.46 0.6 0.557 -51.884 92.803
Year -0.006 -0.351 0.730 -0.042 0.030 0.994 0.959 1.030
NPGO 0.204 2.312 0.034 0.017 0.392
S. Farallon
Islands
(1982-2013)
18 0.459 Constant -58.83 -2.641 0.019 -106.31 -11.35
Year 0.034 3.010 0.009 0.010 0.057 1.035 1.010 1.059
MEI 0.403 3.459 0.004 0.155 0.652
Año Nuevo Island
+ S. Farallon Is.
(1995-2013)
15 0 Constant 23.312 0.729 0.479 -45.794 92.418
Year -0.007 -0.440 0.667 -0.042 0.027 0.993 0.959 1.027
Central California
(1980-2013) 16 0.603 Constant -65.962 -4.251 0.001 -99.244 -32.681
Year 0.038 4.878 <0.001 0.021 0.054 1.039 1.021 1.055
N. California
(1980-2013) 15 0.340 Constant -284.712 -2.808 0.015 -503.748 -65.677
Year 0.145 2.866 0.013 0.036 0.255 1.156 1.037 1.290
Central + North.
California
(1980-2013)
15 0.556 Constant -67.063 -3.754 0.002 -105.653 -28.474
Year 0.038 4.301 0.001 0.019 0.058 1.039 1.019 1.060

51
Figure 1. A. Map of California shoreline showing a posteriori strata of the coastline comprised
of three sections (southern, central, and northern) and zones A through G within central and
northern California. B. Map of Southern California strata showing names and location of
California Channel Islands. Most of the U.S. population of CSL breeds at rookeries on San
Clemente, San Nicolas, Santa Barbara and San Miguel Islands. C. Map of coastline from
Monterey Bay to Bodega Bay showing location of northernmost CSL rookeries at Año Nuevo
Island and the Farallon Islands.

52
Figure 2. Cumulative proportion of live pups counted for each Julian day that a count was made.
Logistic equation (black line) is fit to published data (black circles) of live-pup counts made at
San Nicolas during the breeding season (data from Heath and Francis 1983, 1984, Stewart and
Yochem 1984, 1986). The logistic curve is parameterized to estimate the expected proportion of
pups that would be counted on July 2 (Julian day 183).

53
Figure 3. Counts of CSL live-pups in the U.S. population, and counts of non-pups in southern
California and total for California (southern California mainland not surveyed) for surveys
conducted during 1964-2014. Grey bars indicate moderate or strong El Niño conditions based
on SLH-LA. Gaps represent years when no counts were available.
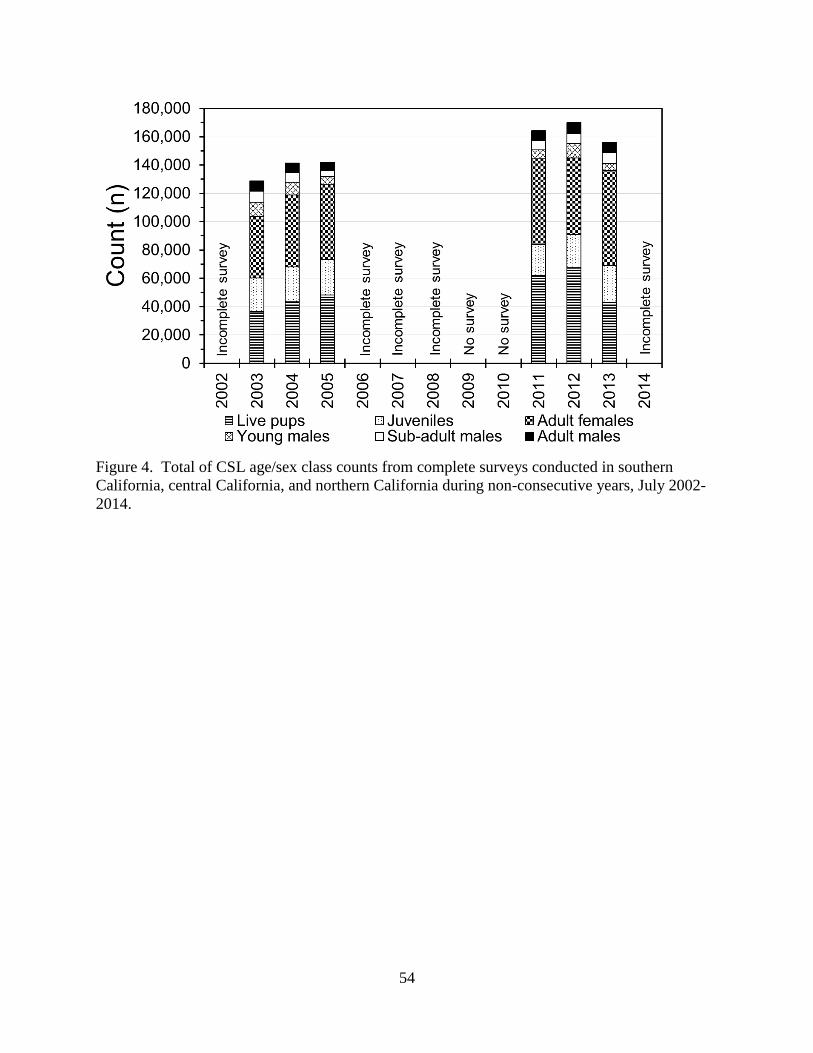
54
Figure 4. Total of CSL age/sex class counts from complete surveys conducted in southern
California, central California, and northern California during non-consecutive years, July 2002-
2014.
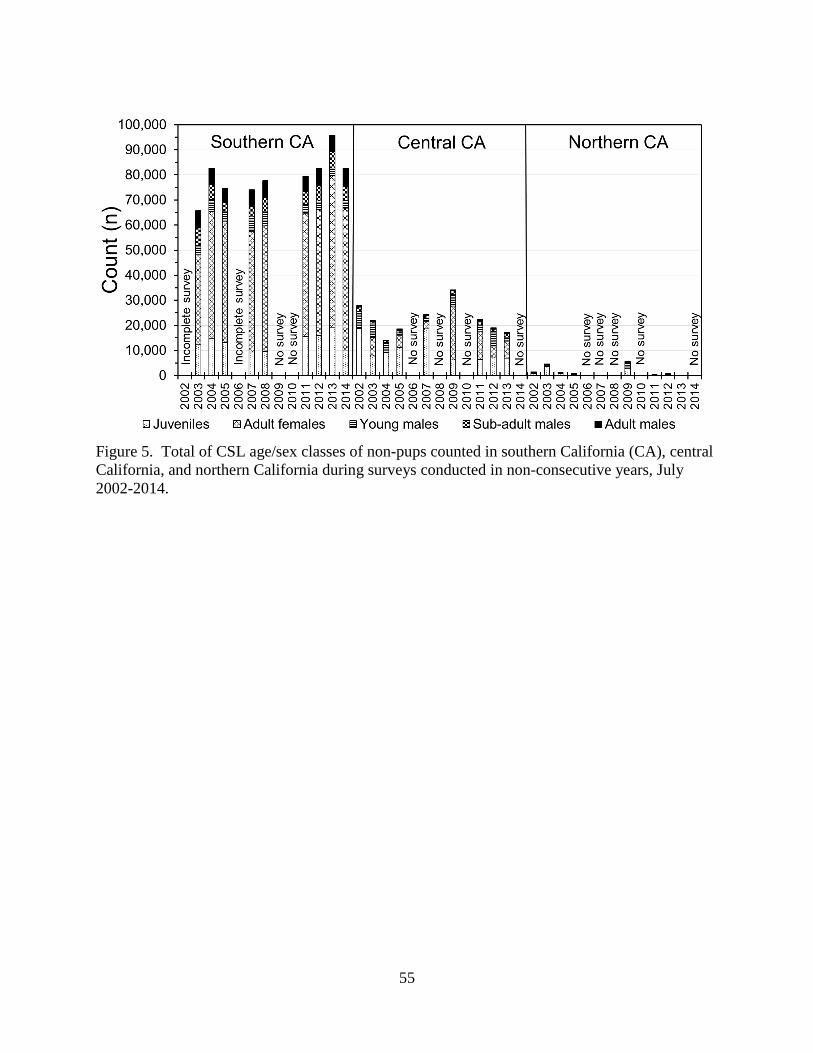
55
Figure 5. Total of CSL age/sex classes of non-pups counted in southern California (CA), central
California, and northern California during surveys conducted in non-consecutive years, July
2002-2014.
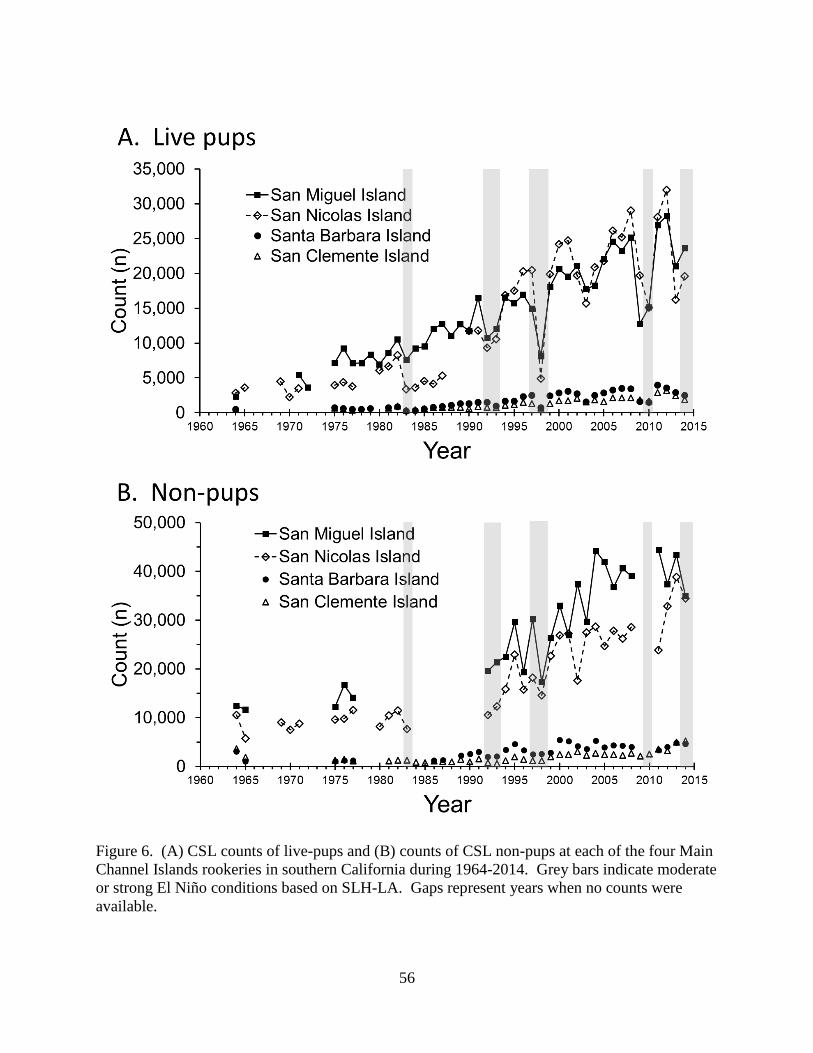
56
Figure 6. (A) CSL counts of live-pups and (B) counts of CSL non-pups at each of the four Main
Channel Islands rookeries in southern California during 1964-2014. Grey bars indicate moderate
or strong El Niño conditions based on SLH-LA. Gaps represent years when no counts were
available.
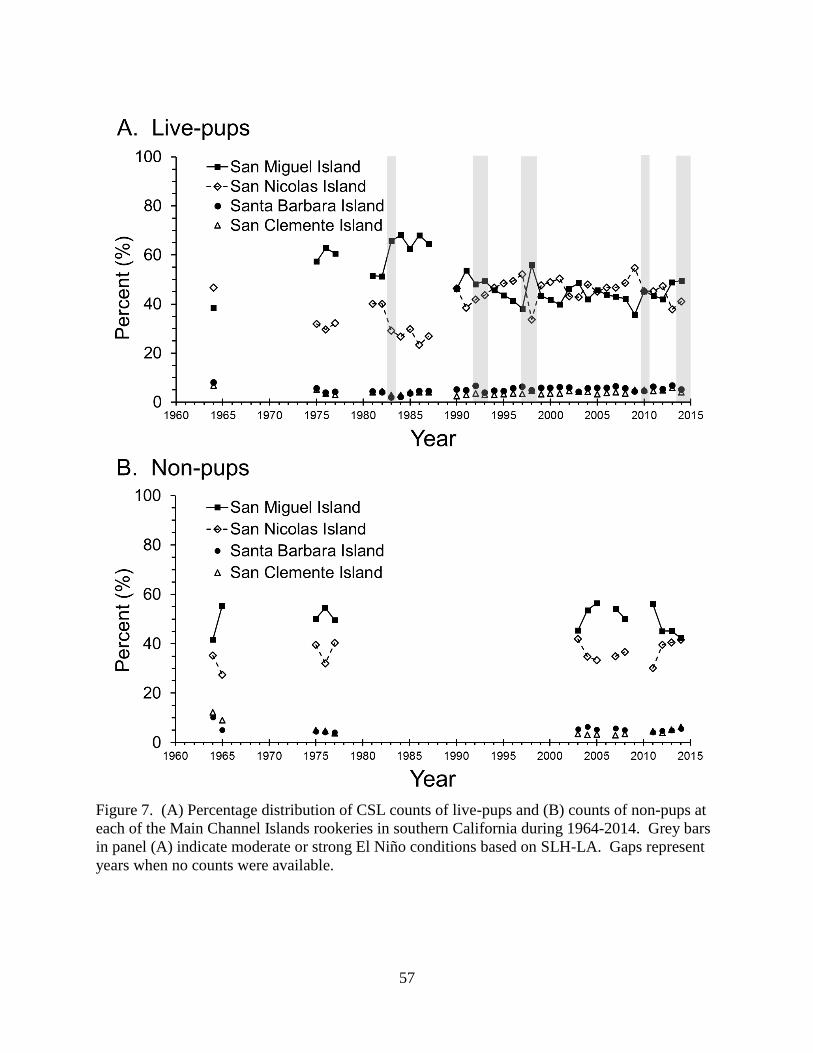
57
Figure 7. (A) Percentage distribution of CSL counts of live-pups and (B) counts of non-pups at
each of the Main Channel Islands rookeries in southern California during 1964-2014. Grey bars
in panel (A) indicate moderate or strong El Niño conditions based on SLH-LA. Gaps represent
years when no counts were available.

58
Appendix 1. California sea lion pup calculation for the U. S. stock in 2009-2010
Total California sea lion (CSL) pup counts for the U.S. population were not available for
2009 and 2010, but a complete ground count was available for San Miguel Island (SMI) and a
partial ground count was available for San Nicolas Island (SNI). The partial ground counts at
SNI were obtained within the SNI trend study area (Figure A1). To expand the partial count
from the SNI trend study area to a total island count, aerial photo count data at SNI for the years
1990, 1992-2008, and 2011-2013 was used (Table 3). For each year the proportion of pups in
the trend study areas was computed from aerial photographic surveys (Table A1). A temporal
trend with a cubic polynomial was fitted to the proportions with a log-link and a normal error
distribution (Figure A2). With the predicted proportions from the regression for 2009 and 2010,
the partial ground count was expanded to a total island count for SNI for those years. The SNI
estimated total count was then added to the SMI ground count (Table A2). With the aerial
survey data, the total U.S. count was regressed against the count at SMI and SNI to provide a
correction factor to expand the total from SMI and SNI to the total U.S. pup count (Figure A3,
Table A2).

59
Table A1. Aerial survey counts of California sea lion pups from 1990, 1992-2008, and 2011-2013 at San Nicolas Island. Counts are for the entire island and for the SNI trend study area. The proportion of the count in the SNI trend study area is also shown. Multiple counts were available for some years.
Year SNI Trend study area U.S. Total Proportion
1990 9,765 10,683 0.914 1990 10,361 11,766 0.881
1992 7,268 8,869 0.819
1992 7,617 9,348 0.815
1993 8,463 10,595 0.799
1993 8,315 10,538 0.789
1993 7,920 9,702 0.816
1993 8,366 10,409 0.804
1993 7,831 9,698 0.807
1993 8,285 10,345 0.801
1994 11,079 15,766 0.703
1994 11,885 16,889 0.704
1995 11,395 17,512 0.651
1995 11,218 16,926 0.663
1996 11,264 19,308 0.583
1996 11,841 20,285 0.584
1997 11,951 20,488 0.583
1998 2,373 4,885 0.486
1999 9,882 19,878 0.497
2000 11,323 24,167 0.469
2001 11,023 24,741 0.446
2002 8,717 19,719 0.442
2003 6,568 15,702 0.418
2004 8,167 20,866 0.391
2005 8,072 21,799 0.370
2006 9,232 26,154 0.353
2007 8,962 25,198 0.356
2008 10,134 29,052 0.349
2011 9,075 28,087 0.323
2012 10,399 31,972 0.325
2013 4,569 16,225 0.282
2014 5,676 19,587 0.290

60
Table A2. Ground count of California sea lion pups at San Miguel Island, estimated number of
pups at San Nicolas Island from partial ground count and estimate of total number of pups in
U.S. waters for 2009-2010.
Year SMI Ground Count SNI Estimate U.S. Total Estimate
2009 12,806 19,697 35,913
2010 15,131 15,554 33,873
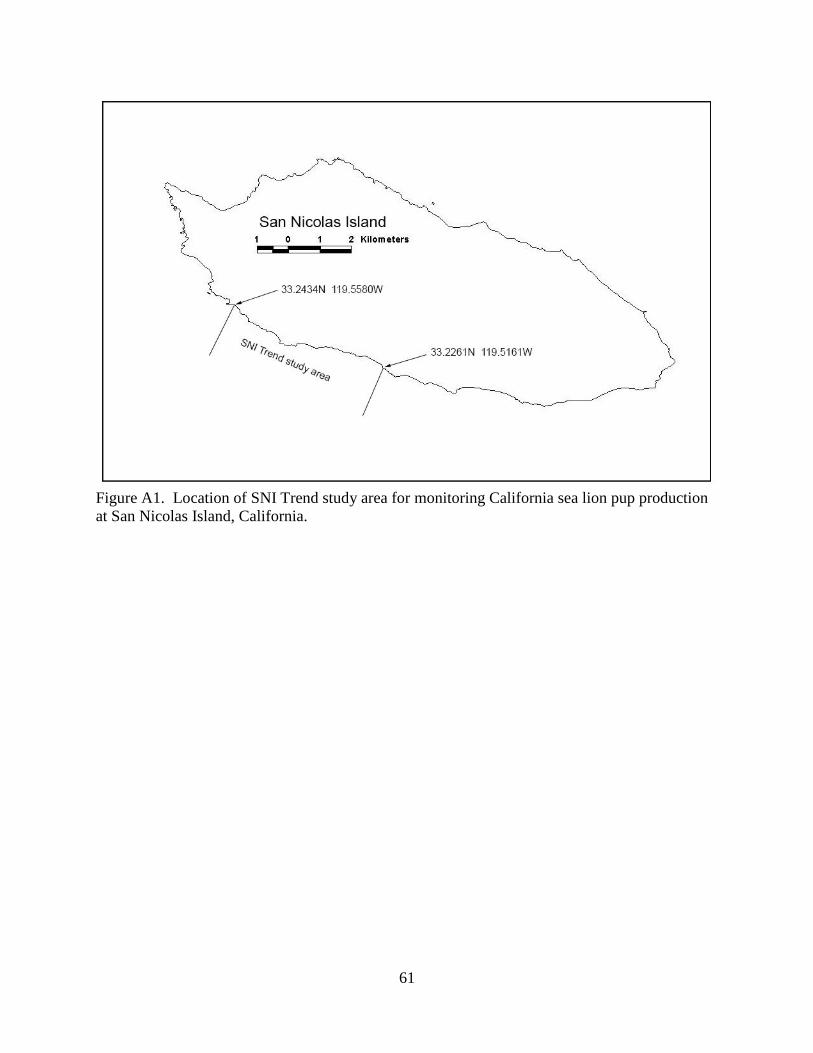
61
Figure A1. Location of SNI Trend study area for monitoring California sea lion pup production
at San Nicolas Island, California.
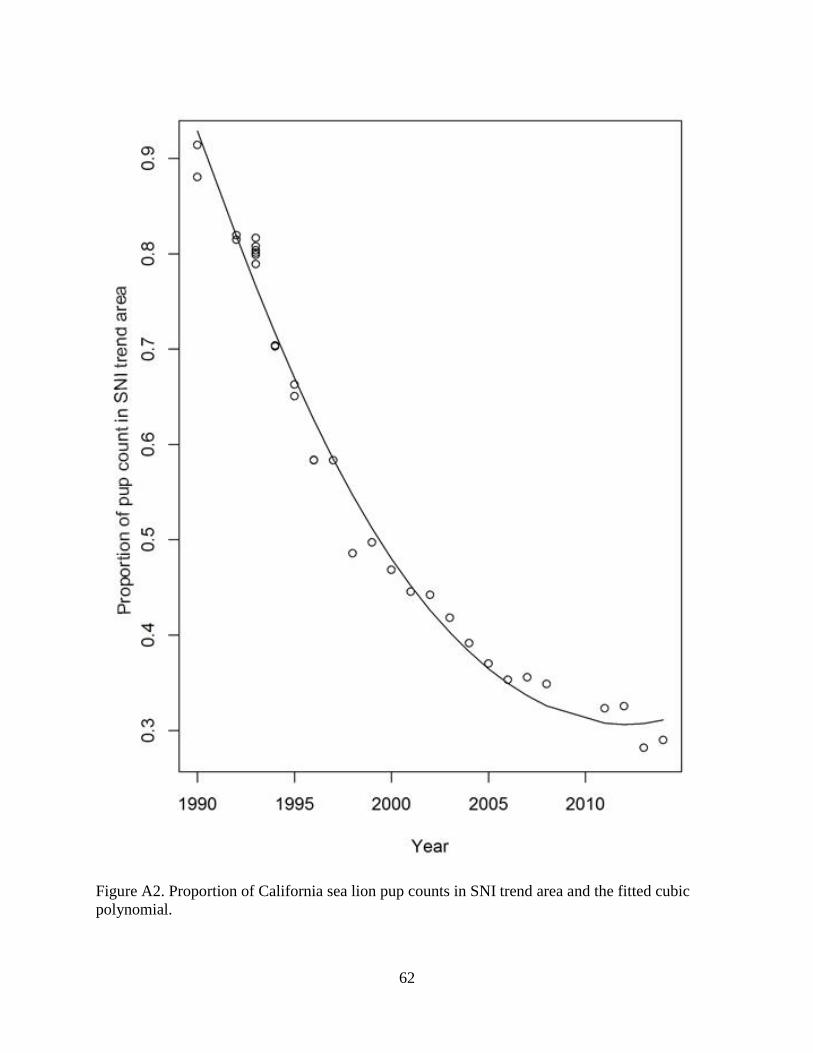
62
Figure A2. Proportion of California sea lion pup counts in SNI trend area and the fitted cubic
polynomial.

63
Figure A3. Linear regression of total U.S. pup count against total of San Miguel Island and San
Nicolas Island pup counts.