noaa form 76-35a · 2009-04-03 · was the platform for multibeam sonar, sidescan sonar and sound...
TRANSCRIPT
Descriptive Report, H11650 SAIC Doc 07-TR-011
Project No. OPR-D302-KR-07 05/02/2008
NOAA FORM 76-35A
U.S. DEPARTMENT OF COMMERCE
NATIONAL OCEANIC AND ATMOSPHERIC ADMINISTRATION NATIONAL OCEAN SERVICE
DESCRIPTIVE REPORT
Type of Survey Multibeam and Sidescan Sonar Field No. F Registry No.
LOCALITY
H11650
State Delaware - Maryland General Locality Atlantic Ocean Sublocality
7 NM East of Fenwick Island
2007
CHIEF OF PARTY
Gary R. Davis
Science Applications International Corporation
LIBRARY & ARCHIVES
DATE
Descriptive Report, H11650 SAIC Doc 07-TR-011
Project No. OPR-D302-KR-07 i 05/02/2008
NOAA FORM 77-28 U.S. DEPARTMENT OF COMMERCE REGISTRY NO. (11-72) NATIONAL OCEANIC AND ATMOSPHERIC ADMINISTRATION
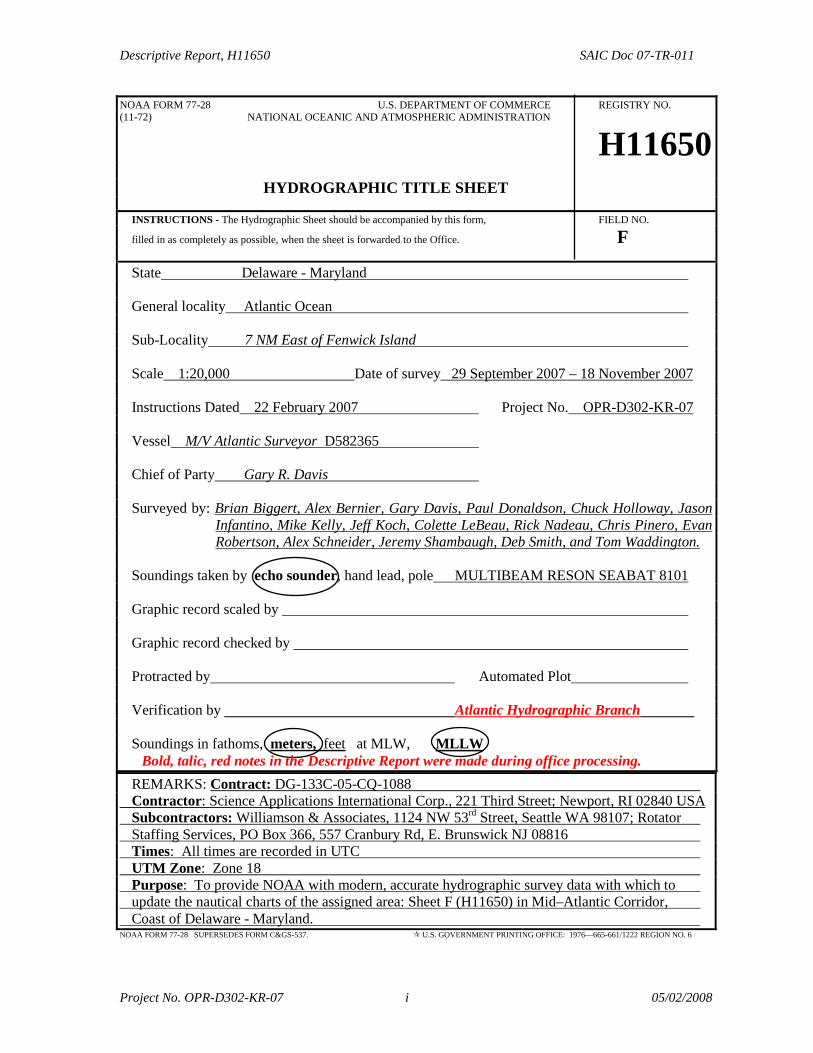
H11650 HYDROGRAPHIC TITLE SHEET INSTRUCTIONS - The Hydrographic Sheet should be accompanied by this form, FIELD NO. filled in as completely as possible, when the sheet is forwarded to the Office. F
State Delaware - Maryland General locality Atlantic Ocean Sub-Locality 7 NM East of Fenwick Island Scale 1:20,000 Date of survey 29 September 2007 – 18 November 2007 Instructions Dated 22 February 2007 Project No. OPR-D302-KR-07 Vessel M/V Atlantic Surveyor D582365 Chief of Party Gary R. Davis Surveyed by: Brian Biggert, Alex Bernier, Gary Davis, Paul Donaldson, Chuck Holloway, Jason
Infantino, Mike Kelly, Jeff Koch, Colette LeBeau, Rick Nadeau, Chris Pinero, Evan Robertson, Alex Schneider, Jeremy Shambaugh, Deb Smith, and Tom Waddington.
Soundings taken by echo sounder, hand lead, pole MULTIBEAM RESON SEABAT 8101 Graphic record scaled by Graphic record checked by Protracted by Automated Plot Verification by Atlantic Hydrographic Branch Soundings in fathoms, meters, feet at MLW, MLLW Bold, talic, red notes in the Descriptive Report were made during office processing. REMARKS: Contract: DG-133C-05-CQ-1088 Contractor: Science Applications International Corp., 221 Third Street; Newport, RI 02840 USA Subcontractors: Williamson & Associates, 1124 NW 53rd Street, Seattle WA 98107; Rotator Staffing Services, PO Box 366, 557 Cranbury Rd, E. Brunswick NJ 08816 Times: All times are recorded in UTC UTM Zone: Zone 18 Purpose: To provide NOAA with modern, accurate hydrographic survey data with which to update the nautical charts of the assigned area: Sheet F (H11650) in Mid–Atlantic Corridor, Coast of Delaware - Maryland.
NOAA FORM 77-28 SUPERSEDES FORM C&GS-537. U.S. GOVERNMENT PRINTING OFFICE: 1976—665-661/1222 REGION NO. 6

Descriptive Report, H11650 SAIC Doc 07-TR-011
Project No. OPR-D302-KR-07 ii 05/02/2008
Science Applications International Corporation (SAIC) warrants only that the survey data acquired by SAIC and delivered to NOAA under Contract DG-133C-05-CQ-1088 reflects the state of the sea floor in existence on the day and at the time the survey was conducted.

Descriptive Report, H11650 SAIC Doc 07-TR-011
Project No. OPR-D302-KR-07 iii 05/02/2008
Table of Contents Page
A. AREA SURVEYED .................................................................................................. 1 B. DATA ACQUISITION AND PROCESSING ........................................................ 4
B.1 EQUIPMENT ........................................................................................................... 4 B.2 QUALITY CONTROL ............................................................................................... 5
Survey Systems Uncertainty Model ............................................................................. 6 CUBE Uncertainty Analysis ....................................................................................... 7 Junction and Crossing Analysis .................................................................................. 8 Multibeam Coverage Analysis .................................................................................... 9
B.3 CORRECTIONS TO ECHO SOUNDINGS ..................................................................... 9 B.4 DATA PROCESSING .............................................................................................. 10
C. HORIZONTAL AND VERTICAL CONTROL .................................................. 10
D. RESULTS AND RECOMMENDATIONS ........................................................... 12 D.1 CHART COMPARISON ........................................................................................... 12
Chart 12214, 1/80,000 scale, 48th Edition 10/01/2007 corrected through 03/08/2008 ................................................................................................................................... 12 Chart 12211, 1/80,000 scale, 43rd Edition 10/01/2007 corrected through 03/08/2008 ................................................................................................................................... 13 ENC US4DE11M, 1/80,000 compilation scale, 11th Edition Issued 01/11/2007 Update 11/01/2007 .................................................................................................... 14 ENC US4VA50M, 3rd Edition Issued 12/20/2007 Update 12/20/2007 ..................... 15 AWOIS Item Investigations ....................................................................................... 17 Additional Features for Charting ............................................................................. 17 Danger to Navigation Reports .................................................................................. 17
D.2 ADDITIONAL RESULTS ......................................................................................... 17
E. APPROVAL SHEET .............................................................................................. 18 Appendix I DANGER TO NAVIGATION REPORTS Appendix II SURVEY FEATURE REPORT Appendix III FINAL PROGRESS SKETCH AND SURVEY OUTLINE Appendix IV TIDES AND WATER LEVELS Appendix V SUPPLEMENTAL SURVEY RECORDS & CORRESPONDENCE
Descriptive Report, H11650 SAIC Doc 07-TR-011
Project No. OPR-D302-KR-07 iv 05/02/2008
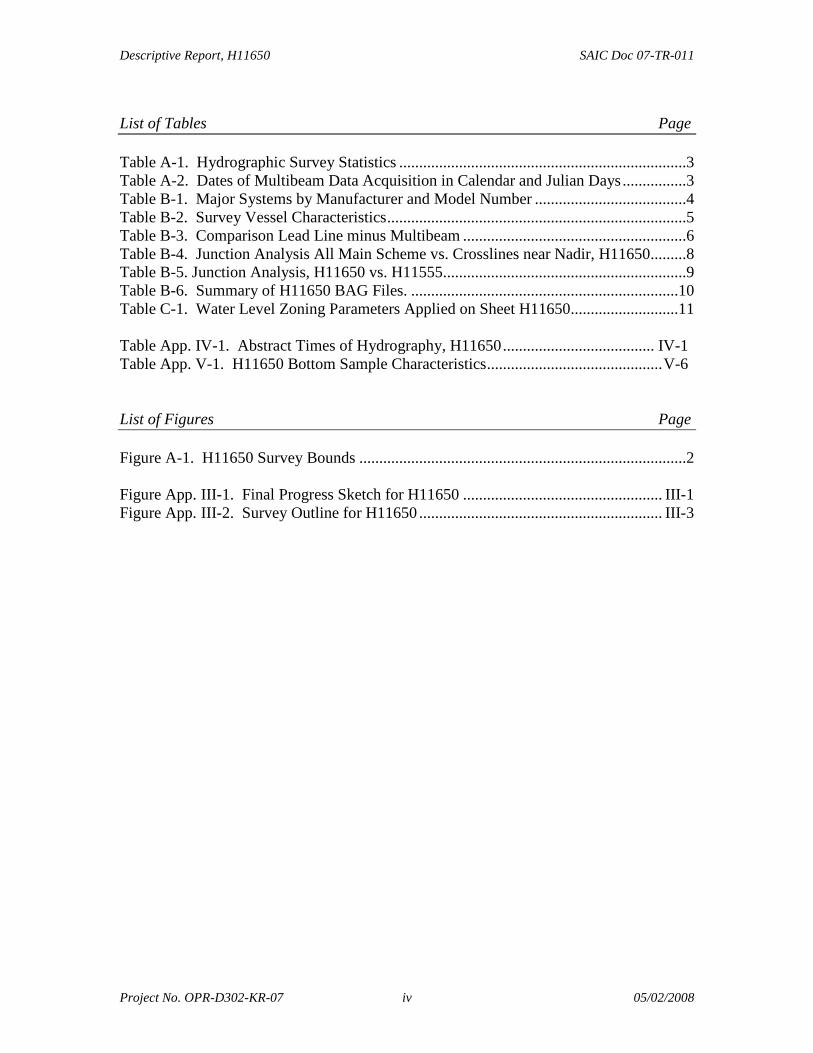
List of Tables Page
Table A-1. Hydrographic Survey Statistics ........................................................................3 Table A-2. Dates of Multibeam Data Acquisition in Calendar and Julian Days ................3 Table B-1. Major Systems by Manufacturer and Model Number ......................................4 Table B-2. Survey Vessel Characteristics ...........................................................................5 Table B-3. Comparison Lead Line minus Multibeam ........................................................6 Table B-4. Junction Analysis All Main Scheme vs. Crosslines near Nadir, H11650 .........8 Table B-5. Junction Analysis, H11650 vs. H11555.............................................................9 Table B-6. Summary of H11650 BAG Files. ...................................................................10 Table C-1. Water Level Zoning Parameters Applied on Sheet H11650...........................11 Table App. IV-1. Abstract Times of Hydrography, H11650 ...................................... IV-1 Table App. V-1. H11650 Bottom Sample Characteristics ............................................ V-6 List of Figures Page
Figure A-1. H11650 Survey Bounds ..................................................................................2 Figure App. III-1. Final Progress Sketch for H11650 .................................................. III-1 Figure App. III-2. Survey Outline for H11650 ............................................................. III-3

Descriptive Report, H11650 SAIC Doc 07-TR-011
Project No. OPR-D302-KR-07 1 05/02/2008
Descriptive Report to Accompany Hydrographic Survey H11650 Scale 1:20,000, Surveyed 2007
M/V Atlantic Surveyor Science Applications International Corporation (SAIC)
Gary R. Davis, Lead Hydrographer PROJECT Project Number: OPR-D302-KR-07 Dates of Instructions: 22 February 2007 Task Order#: T0003 Dates of Supplemental Instructions: 27 April 2007, 02 October 2007, and 11 April 2008 Sheet Letter: F Registry Number: H11650 Purpose: To provide NOAA with modern, accurate hydrographic survey data with which to update the nautical charts of the assigned area.
A. AREA SURVEYED
The area surveyed was a section of the Atlantic Ocean off of Delaware and Maryland, 7NM East of Fenwick Island (Figure A-1). The line kilometers, bottom samples, item investigations and other survey parameters are located in Table A-1. The area was surveyed at set line spacing with multibeam sonar and towed sidescan sonar from 29 September 2007 to 18 November 2007 (Table A-2). The depth range encountered in this area was from 5.94 meters, 0.270 meter uncertainty, to 28.61 meters, 0.280 meter uncertainty, (19 to 94 feet). The survey area provided in Statement of work from NOAA, did not junction with survey H11555 (Sheet B) conducted in 2006. After contacting NOAA, SAIC extended the survey area to provide junction with the prior survey H11555 (see Appendix V). Data attached to this report.

Descriptive Report, H11650 SAIC Doc 07-TR-011
Project No. OPR-D302-KR-07 2 05/02/2008
Figure A-1. H11650 Survey Bounds

Descriptive Report, H11650 SAIC Doc 07-TR-011
Project No. OPR-D302-KR-07 3 05/02/2008
Table A-1. Hydrographic Survey Statistics
M/V Atlantic Surveyor, Sheet F H11650
LNM Single beam mainscheme N/A LNM Multibeam mainscheme 2118.6 LNM Lidar mainscheme N/A LNM Sidescan Sonar mainscheme
2118.6 Lineal nautical miles of mainscheme multibeam and sidescan 2118.6 LNM Crosslines singlebeam and multibeam combined 102.0 LNM Lidar Crosslines N/A LNM development lines non-mainscheme 0.2 LNM shoreline/nearshore investigations N/A Number of Bottom Samples 16 Number of items investigated that required additional time/effort in the field beyond the above survey operations 0
Total number of square nautical miles 52.61
Table A-2. Dates of Multibeam Data Acquisition in Calendar and Julian Days
Calendar Date Julian Day Calendar Date Julian Day
29 September 2007 272 14 October 2007 287 30 September 2007 273 15 October 2007 288
01 October 2007 274 16 October 2007 289 02 October 2007 275 17 October 2007 290 03 October 2007 276 18 October 2007 291 04 October 2007 277 19 October 2007 292 05 October 2007 278 21 October 2007 294 06 October 2007 279 22 October 2007 295 07 October 2007 280 23 October 2007 296 09 October 2007 282 14 November 2007 318 10 October 2007 283 15 November 2007 319 13 October 2007 286 18 November 2007 322
Descriptive Report, H11650 SAIC Doc 07-TR-011
Project No. OPR-D302-KR-07 4 05/02/2008
B. DATA ACQUISITION AND PROCESSING SEE ALSO THE EVALUATION REPORT.
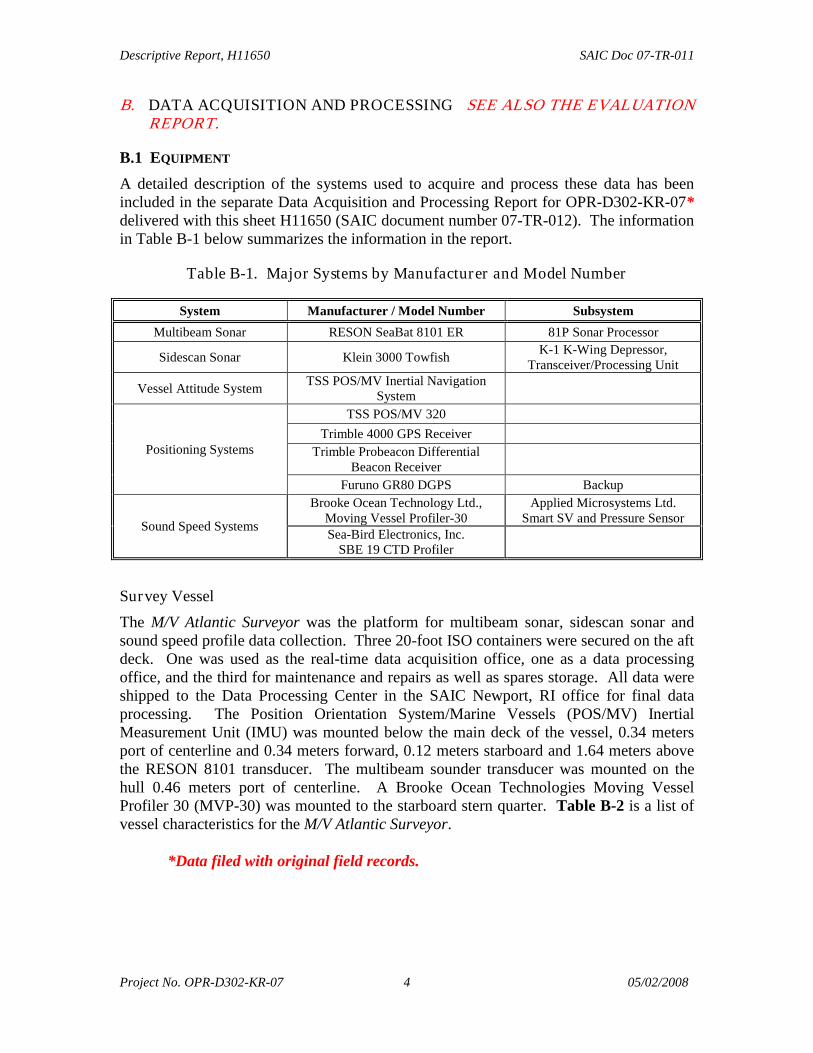
B.1 EQUIPMENT A detailed description of the systems used to acquire and process these data has been included in the separate Data Acquisition and Processing Report for OPR-D302-KR-07* delivered with this sheet H11650 (SAIC document number 07-TR-012). The information in Table B-1 below summarizes the information in the report.
Table B-1. Major Systems by Manufacturer and Model Number
System Manufacturer / Model Number Subsystem Multibeam Sonar RESON SeaBat 8101 ER 81P Sonar Processor
Sidescan Sonar Klein 3000 Towfish K-1 K-Wing Depressor, Transceiver/Processing Unit
Vessel Attitude System TSS POS/MV Inertial Navigation System
Positioning Systems
TSS POS/MV 320 Trimble 4000 GPS Receiver
Trimble Probeacon Differential Beacon Receiver
Furuno GR80 DGPS Backup
Sound Speed Systems
Brooke Ocean Technology Ltd., Moving Vessel Profiler-30
Applied Microsystems Ltd. Smart SV and Pressure Sensor
Sea-Bird Electronics, Inc. SBE 19 CTD Profiler
Survey Vessel The M/V Atlantic Surveyor was the platform for multibeam sonar, sidescan sonar and sound speed profile data collection. Three 20-foot ISO containers were secured on the aft deck. One was used as the real-time data acquisition office, one as a data processing office, and the third for maintenance and repairs as well as spares storage. All data were shipped to the Data Processing Center in the SAIC Newport, RI office for final data processing. The Position Orientation System/Marine Vessels (POS/MV) Inertial Measurement Unit (IMU) was mounted below the main deck of the vessel, 0.34 meters port of centerline and 0.34 meters forward, 0.12 meters starboard and 1.64 meters above the RESON 8101 transducer. The multibeam sounder transducer was mounted on the hull 0.46 meters port of centerline. A Brooke Ocean Technologies Moving Vessel Profiler 30 (MVP-30) was mounted to the starboard stern quarter. Table B-2 is a list of vessel characteristics for the M/V Atlantic Surveyor.
*Data filed with original field records.

Descriptive Report, H11650 SAIC Doc 07-TR-011
Project No. OPR-D302-KR-07 5 05/02/2008
Table B-2. Survey Vessel Character istics
Vessel Name LOA Beam Draft Max Speed
Gross Tonnage
Power (Hp)
Registration Number
M/V Atlantic Surveyor 110’ 26’ 9’ 14 knots
Displacement 68 net tons
Deck load 65 long tons
900 D582365
Major Systems SAIC used their Integrated Survey System (ISS-2000) software on a Windows XP platform to acquire these survey data. Survey planning and data analysis were conducted using SAIC’s SABER software on Red Hat Enterprise 4 Linux platforms. Klein 3000 sidescan data were collected on a Windows XP platform using Klein’s SonarPro version 9.6 software. The Klein 3000 sidescan sonar data were collected in eXtended Triton Format (XTF) and maintained at full resolution, with no conversion or down sampling techniques applied. All sidescan data were reviewed using Triton Isis software, while coverage mosaics were produced using SABER on a Linux platform.
B.2 QUALITY CONTROL There were approximately 102 linear nautical miles of crosslines surveyed and approximately 2118 linear nautical miles of main scheme lines surveyed. This resulted in approximately five percent of linear nautical miles of crosslines compared to main scheme lines. The cross lines were oriented at 90°/270° and spaced approximately 950 meters apart, while the main scheme lines were oriented at 12°/192° and spaced at either 40 or 65 meters, depending on the sidescan sonar range scale setting. The sidescan sonar range scale was set to 50 or 75 meters for all main scheme operations, providing either a 100 or 150 meter imagery swath. The 75-m sidescan sonar range scale setting was only used in areas where the water depth was consistently deeper than 18 meters (60 feet). As required for object detection, the vessel speed was controlled so that there were always at least three sidescan sonar pings per meter along track. Because of the reduced sidescan sonar ping rate at the 75-m range scale setting, these operations were conducted at slower speeds than the operations at the 50-m range scale setting. A 54° beam angle was used as the cutoff for acceptable multibeam data, resulting in an effective multibeam swath width of approximately 2.75 times the water depth. Full multibeam bottom coverage was not required, however, in depths greater than 16 meters for the 40-meter spaced lines and 22 meters for the 65-meter spaced lines there was sufficient outer beam overlap to provide 100% bottom coverage. A Brooke Ocean Technology Moving Vessel Profiler (MVP) with an Applied Microsystems SV&P Smart Sensor or a Seabird Electronics SBE-19 CTD was used to collect sound speed profile (SSP) data. SSP data were obtained at intervals frequent enough to reduce sound speed errors. The frequency of casts was based on observed sound speed changes from previously collected profiles and time elapsed since the last cast. Multiple casts were taken along a survey line to identify the rate and location of

Descriptive Report, H11650 SAIC Doc 07-TR-011
Project No. OPR-D302-KR-07 6 05/02/2008
sound speed changes. Subsequent casts were made based on the observed trend of sound speed changes. As the sound speed profiles changed, cast frequency and location were modified accordingly. Confidence checks of the sound speed profile casts were conducted weekly by comparing two consecutive casts taken with different SV&P Smart Sensors or with a SV&P Smart Sensor and a Seabird SBE-19 CTD. Static draft measurements were taken on each side of the vessel at each port call, both after arrival and before departure. These observed static draft measurements were used to compute and apply a prorated daily static draft between each port call to account for changes due to fuel and water consumption. A dynamic draft value was also applied to the data based on recorded input from the shaft RPM counters and the dynamic draft look-up table that was constructed from settlement and squat measurements taken during the pre-survey Sea Acceptance Trials. Horizontal positioning of the multibeam transducer by the POS/MV was verified by daily confidence checks against an independent Trimble DGPS system. The ISS-2000 real-time system constantly monitored and provided a continuous view of this positioning comparison. An alarm was triggered if the comparisons were not within the acceptable range. Multibeam confidence checks were conducted at least weekly by lead line measurement while in port. Table B-3 presents a summary of these comparisons showing mean differences of less than 6 centimeters between the lead line and the multibeam.
Table B-3. Compar ison Lead Line minus Multibeam
DAY DATE PORT MEAN
(M)
PORT STD DEV
(M)
STBD MEAN
(M)
STBD STD DEV
(M) 268 9/25/2007 -0.023 0.014 0.002 0.019 276 10/3/2007 -0.008 0.014 0.011 0.018 283 10/10/2007 0.016 0.011 0.014 0.019 290 10/17/2007 0.026 0.011 0.023 0.011 297 10/24/2007 -0.004 0.009 -0.014 0.015 316 11/12/2007 0.030 0.011 0.058 0.021 323 11/19/2007 0.018 0.010 0.016 0.020 323 11/19/2007 0.016 0.014
MEAN OF SETS 0.008 0.011 0.016 0.017
Survey Systems Uncer tainty Model The Total Propagated Uncertainty (TPU) model that SAIC has adopted has its genesis at the Naval Oceanographic Office (NAVOCEANO), and is based on work by Rob Hare and others (“Error Budget Analysis for NAVOCEANO Hydrographic Survey Systems, Task 2 FY 01”, 2001, HSRC FY01 Task 2 Final Report). Until recently, this concept had been referred to as the Total Propagated Error (TPE) model; however, because true error

Descriptive Report, H11650 SAIC Doc 07-TR-011
Project No. OPR-D302-KR-07 7 05/02/2008
can not be measured, the term “uncertainty” has now replaced “error” throughout this discussion. This terminology has been adopted by the International Hydrographic Organization in Special Publication No. 44, “IHO Standards for Hydrographic Surveys, 5th Edition, February 2008”. The fidelity of any uncertainty model is coupled to the applicability of the equations that are used to estimate each of the components that contribute to the overall uncertainty that is inherent in each sounding. SAIC’s approach to quantifying the TPU is to decompose the cumulative uncertainty for each sounding into its individual components and then further decompose those into a horizontal and vertical components. The model then combines the horizontal and vertical uncertainty components to yield an estimate of the system uncertainty as a whole. This cumulative system uncertainty is the Total Propagated Uncertainty. By using this approach, SAIC can more easily incorporate future uncertainty information provided by sensor manufacturers into the model. This also allows SAIC to continuously improve the fidelity of the model as our understanding of the sensors increases or as more sophisticated sensors are added to a system. The data needed to drive the uncertainty model were captured as parameters taken from the Error Parameter File (EPF), which is an ASCII text file created during survey system installation and integration. The DAPR* provides a more detailed discussion on development of the EPF and application of the TPU. Some of the required parameters are also obtained from values recorded in the GSF files during data acquisition and processing. While the input units vary, all uncertainty values that contribute to the cumulative TPU estimate are eventually converted to meters by SABER’s Errors program. The cumulative TPU estimates are recorded as the Horizontal Uncertainty and Vertical Uncertainty at the 95% confidence level in the GSF file. These uncertainty estimates are then used to estimate the accuracy of each individual sounding’s position and depth during both data acquisition and data processing. *Data field with original field records. CUBE Uncer tainty Analysis The vertical and horizontal uncertainty values that were estimated by the TPU model for individual multibeam soundings varied little across the dataset, tending to be most affected by beam angle. All individual soundings used in development of the final CUBE depth surface had modeled vertical and horizontal uncertainty values at or below the allowable IHO Order 1 uncertainty. Two separate uncertainty surfaces are calculated by the SABER software – CUBE Standard Deviation and Average Total Propagated Uncertainty (Average TPU). The CUBE standard deviation is a measure of the general agreement between all of the soundings that contributed to the best hypothesis for the node. The Average TPU is the average of the vertical uncertainty component for each sounding that contributed to the best hypothesis for the node. A third uncertainty surface is generated from the larger of these two uncertainties at each node and is referred to as the Final Uncertainty. After creation of the initial one-meter and half-meter PFM CUBE surfaces, the SABER Check PFM Uncertainty function was used to highlight all of the cases where computed final node uncertainties exceeded IHO Order 1. An initial review of the areas with final
Descriptive Report, H11650 SAIC Doc 07-TR-011
Project No. OPR-D302-KR-07 8 05/02/2008
uncertainties exceeding IHO Order 1 revealed that these areas were around wrecks or obstructions and on steeper slopes where there tended to be much greater variability in the soundings that contributed to a particular node. In some cases, this uncertainty review led to the creation of additional features or designated soundings. In addition, the uncertainty review also highlighted some areas that required additional data cleaning.
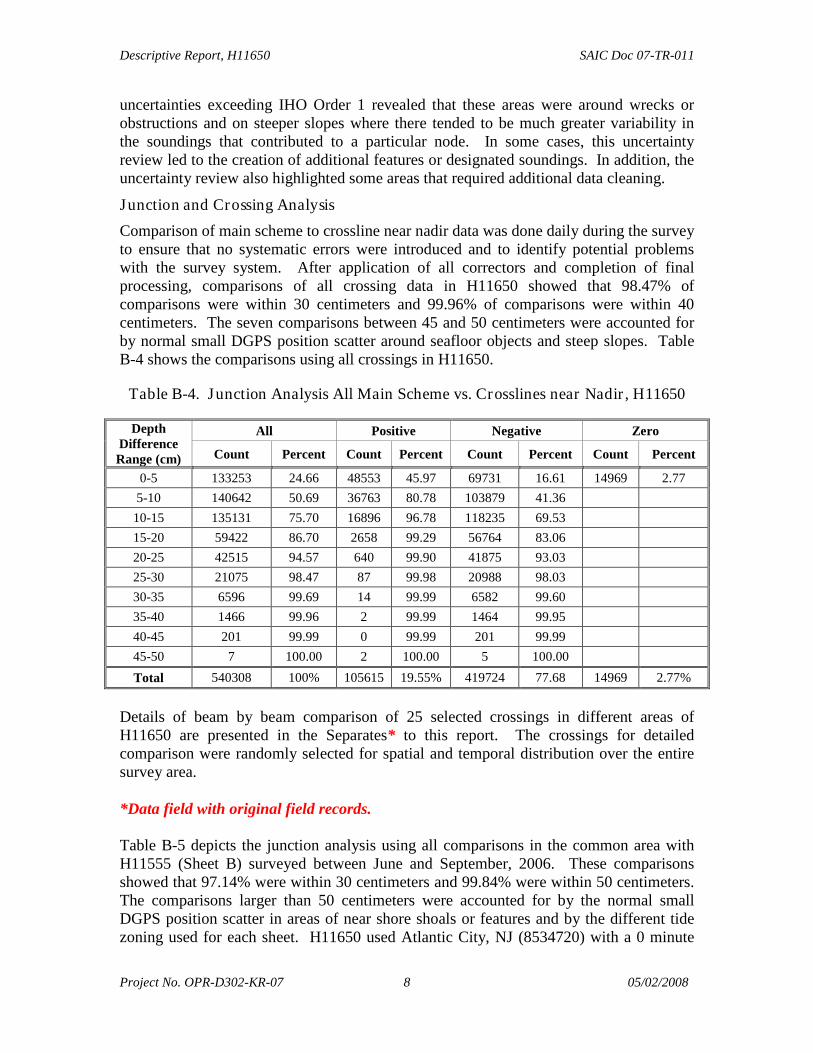
Junction and Crossing Analysis Comparison of main scheme to crossline near nadir data was done daily during the survey to ensure that no systematic errors were introduced and to identify potential problems with the survey system. After application of all correctors and completion of final processing, comparisons of all crossing data in H11650 showed that 98.47% of comparisons were within 30 centimeters and 99.96% of comparisons were within 40 centimeters. The seven comparisons between 45 and 50 centimeters were accounted for by normal small DGPS position scatter around seafloor objects and steep slopes. Table B-4 shows the comparisons using all crossings in H11650.
Table B-4. Junction Analysis All Main Scheme vs. Crosslines near Nadir , H11650
Depth Difference Range (cm)
All Positive Negative Zero
Count Percent Count Percent Count Percent Count Percent
0-5 133253 24.66 48553 45.97 69731 16.61 14969 2.77 5-10 140642 50.69 36763 80.78 103879 41.36
10-15 135131 75.70 16896 96.78 118235 69.53 15-20 59422 86.70 2658 99.29 56764 83.06 20-25 42515 94.57 640 99.90 41875 93.03 25-30 21075 98.47 87 99.98 20988 98.03 30-35 6596 99.69 14 99.99 6582 99.60 35-40 1466 99.96 2 99.99 1464 99.95 40-45 201 99.99 0 99.99 201 99.99 45-50 7 100.00 2 100.00 5 100.00 Total 540308 100% 105615 19.55% 419724 77.68 14969 2.77%
Details of beam by beam comparison of 25 selected crossings in different areas of H11650 are presented in the Separates* to this report. The crossings for detailed comparison were randomly selected for spatial and temporal distribution over the entire survey area. *Data field with original field records. Table B-5 depicts the junction analysis using all comparisons in the common area with H11555 (Sheet B) surveyed between June and September, 2006. These comparisons showed that 97.14% were within 30 centimeters and 99.84% were within 50 centimeters. The comparisons larger than 50 centimeters were accounted for by the normal small DGPS position scatter in areas of near shore shoals or features and by the different tide zoning used for each sheet. H11650 used Atlantic City, NJ (8534720) with a 0 minute

Descriptive Report, H11650 SAIC Doc 07-TR-011
Project No. OPR-D302-KR-07 9 05/02/2008
time corrector and a 0.87 range ratio, while H11555 used Lewes, DE (8557380) with a -72 minute time corrector and a 0.86 range ratio.
Table B-5. Junction Analysis, H11650 vs. H11555
Depth Difference Range (cm)
All Positive Negative Zero
Count Percent Count Percent Count Percent Count Percent
0 - 5 22951 24.59 12769 16.61 7537 54.49 2645 2.83% 5 - 10 23414 49.67 19197 41.59 4217 84.98
10 - 15 21851 73.08 20321 68.03 1530 96.04 15 - 20 9798 83.58 9484 80.36 314 98.31 20 - 25 7858 92.00 7702 90.38 156 99.44 25 - 30 4804 97.14 4751 96.57 53 99.82 30 - 35 1515 98.77 1494 98.51 21 99.97 35 - 40 542 99.35 539 99.21 3 99.99 40 - 45 320 99.69 319 99.63 1 100.00 45 - 50 142 99.84 142 99.81 0 100.00 50 - 60 129 99.98 129 99.98 0 100.00 60 - 70 17 100.00 17 100.00 0 100.00
Totals 93341 100.00% 76864 82.35% 13832 14.82% 2645 2.83%
Multibeam Coverage Analysis These survey operations were conducted at line spacing optimized to achieve 200% sidescan sonar coverage. Multibeam coverage was not required to be 100%. Main scheme lines were run at 40-meter line spacing (while running the sidescan at 50-meter range scale) and at 65-m line spacing (while running the sidescan at 75m range scale). The five one-meter node BAGs (H11650_1_of_15.bag to H11650_5 of 15.bag) made from the one-meter node PFM CUBE Surface was used to document survey coverage. The SABER Gapchecker routine flagged multibeam data gaps exceeding the allowable limit of three contiguous nodes. In addition the entire surface was visually scanned for holidays. Additional survey lines were run to fill any detected holidays. Due to data degradation from bubble sweep along the hull, there were 12 areas identified in final processing that had from 4 to 15 contiguous nodes without data. These small gaps were isolated to the outer most beams of the swath. The final CUBE Surface had valid depths in more than 99% of the nodes.
B.3 CORRECTIONS TO ECHO SOUNDINGS Please refer to the Data Acquisition and Processing Report SAIC Doc 07-TR-012* for a description of all corrections applied to echo soundings. There were no deviations from the corrections described therein. *Data field with original field records.

Descriptive Report, H11650 SAIC Doc 07-TR-011
Project No. OPR-D302-KR-07 10 05/02/2008
B.4 DATA PROCESSING Five BAGs at 1-meter node resolution (H11650_1_of_1.bag through H11650_5_of_15.bag) are submitted for the entire area. These BAGs serve for a demonstration of coverage for this set line spacing survey as well as the bathymetric model for the areas of the survey that are 15 meters or deeper. Ten additional BAGs at half-meter resolution are submitted to cover the areas where the depths are less than 15 meters (H11650_6_of_15.bag through H11650_15 of 15). The data fully support these resolutions. Table B-6 summarizes the BAG files and node spacing. Note that the 1-meter BAGs overlay the area of the half-meter BAGs.
Table B-6. Summary of H11650 BAG Files.
BAG File Name Node Spacing (m) Comments
H11650_1_of_15.bag 1.0 Southern 1.0m most bag H11650_2_of_15.bag 1.0 H11650_3_of_15.bag 1.0 H11650_4_of_15.bag 1.0 H11650_5_of_15.bag 1.0 Northern most 1.0m bag H11650_6_of_15.bag 0.5 Southern 0.5m most bag H11650_7_of_15.bag 0.5 H11650_8_of_15.bag 0.5 H11650_9_of_15.bag 0.5
H11650_10_of_15.bag 0.5 H11650_11_of_15.bag 0.5 H11650_12_of_15.bag 0.5 H11650_13_of_15.bag 0.5 H11650_14_of_15.bag 0.5 H11650_15_of_15.bag 0.5 Northern most 0.5m bag
C. HORIZONTAL AND VERTICAL CONTROL SEE ALSO THE EVALUATION REPORT.
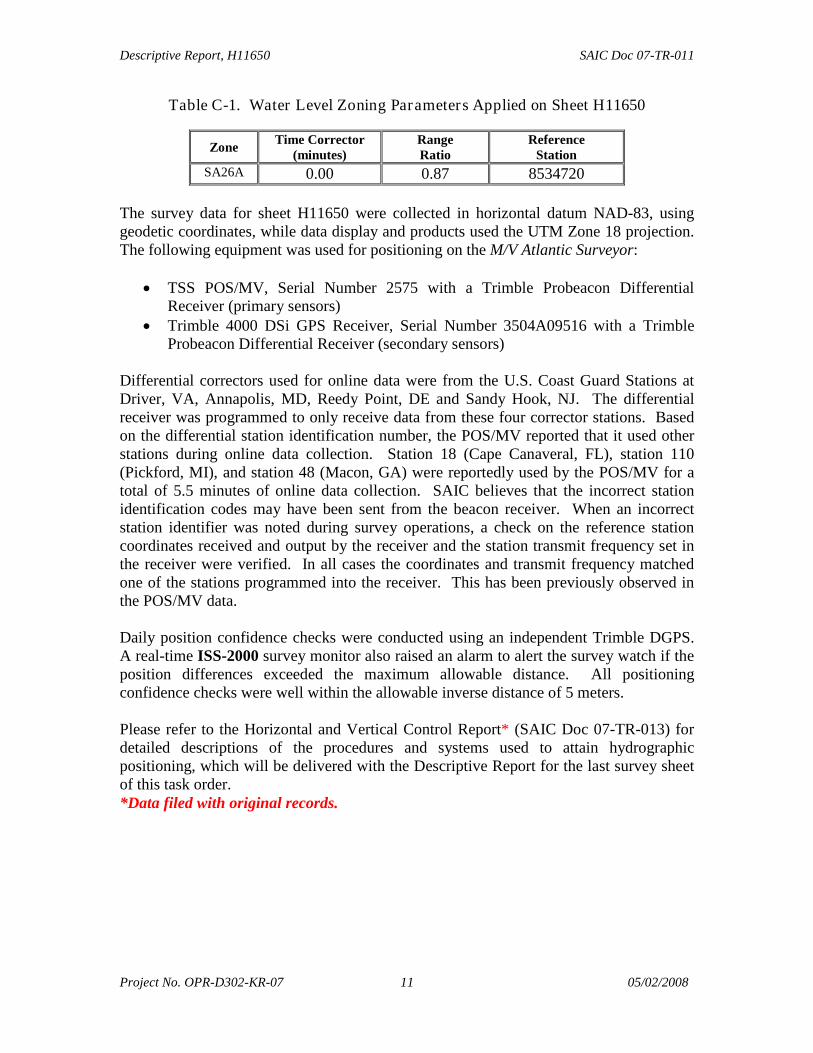
NOAA tide station 8534720 Atlantic City, NJ was the source of verified water level heights for determining correctors to soundings on H11650. The primary means for analyzing the adequacy of zoning was examination of sun illuminated CUBE surfaces on screen for adequacy of zoning. Crossline comparisons were used to analyze zoning for the influence of wind and weather. The water level zoning parameters provided by NOS, Table C-1, were adequate for application of the observed verified water levels.
Approved tides and zoning were applied during field processing.
Descriptive Report, H11650 SAIC Doc 07-TR-011
Project No. OPR-D302-KR-07 11 05/02/2008
Table C-1. Water Level Zoning Parameters Applied on Sheet H11650
Zone Time Corrector (minutes)
Range Ratio
Reference Station
SA26A 0.00 0.87 8534720
The survey data for sheet H11650 were collected in horizontal datum NAD-83, using geodetic coordinates, while data display and products used the UTM Zone 18 projection. The following equipment was used for positioning on the M/V Atlantic Surveyor:
• TSS POS/MV, Serial Number 2575 with a Trimble Probeacon Differential Receiver (primary sensors)
• Trimble 4000 DSi GPS Receiver, Serial Number 3504A09516 with a Trimble Probeacon Differential Receiver (secondary sensors)
Differential correctors used for online data were from the U.S. Coast Guard Stations at Driver, VA, Annapolis, MD, Reedy Point, DE and Sandy Hook, NJ. The differential receiver was programmed to only receive data from these four corrector stations. Based on the differential station identification number, the POS/MV reported that it used other stations during online data collection. Station 18 (Cape Canaveral, FL), station 110 (Pickford, MI), and station 48 (Macon, GA) were reportedly used by the POS/MV for a total of 5.5 minutes of online data collection. SAIC believes that the incorrect station identification codes may have been sent from the beacon receiver. When an incorrect station identifier was noted during survey operations, a check on the reference station coordinates received and output by the receiver and the station transmit frequency set in the receiver were verified. In all cases the coordinates and transmit frequency matched one of the stations programmed into the receiver. This has been previously observed in the POS/MV data. Daily position confidence checks were conducted using an independent Trimble DGPS. A real-time ISS-2000 survey monitor also raised an alarm to alert the survey watch if the position differences exceeded the maximum allowable distance. All positioning confidence checks were well within the allowable inverse distance of 5 meters. Please refer to the Horizontal and Vertical Control Report* (SAIC Doc 07-TR-013) for detailed descriptions of the procedures and systems used to attain hydrographic positioning, which will be delivered with the Descriptive Report for the last survey sheet of this task order. *Data filed with original records.

Descriptive Report, H11650 SAIC Doc 07-TR-011
Project No. OPR-D302-KR-07 12 05/02/2008
A. RESULTS AND RECOMMENDATIONS SEE ALSO THE EVALUATION REPORT. D.
D.1 CHART COMPARISON H11650 was compared to the largest scale charts covering the area as follows:
• Chart 12214, 1/80,000 scale, 48th Edition 10/01/2007 corrected by NTM through 3/8/2008
• Chart 12211, 1/80,000 scale, 43rd Edition 10/01/2007 corrected by NTM through 3/8/2008
• ENC US4DE11M, 1/80,000 compilation scale, 11th Edition Issued 01/11/2007 Update 11/01/2007
• ENC US4VA50M, 3rd Edition Issued 12/20/2007 Update 12/20/2007, area common to chart 12300, overlays charts 12323, 12324, and 12326
The chart comparisons were conducted using SAIC’s SABER software to view the BSB Raster charts with overlain layers of H11650 data such as the CUBE depth surface, selected soundings, and features. For ENC comparisons a combination of HydroService’s dKart Inspector and 7C’s SeeMyDENC were used in conjunction with SABER. Results from the comparisons are described below. Recommend reconstruction of the common areas of all charts using data from this survey. Sand waves exist throughout the majority of the area; therefore, soundings are subject to change. Concur
Char t 12214, 1/80,000 scale, 48th Edition 10/01/2007 corrected through 03/08/2008 The northern 6500 meters of H11650 overlaps with the southern portion of Chart 12214. Over their common areas, the depths and features from this survey should supersede the presently charted information. Concur Listed below are the results of the comparison between this survey and Chart 12214. The charted dangerous wreck (AWOIS 1084) with a 62 foot sounding, danger circle and blue tint in 38° 30’ 31.91”N 074° 50’ 31.73”W was found in 38° 30’ 31.74”N 074° 50’ 32.42”W with a least depth of 62 feet (18.88 meters, 0.280 meter uncertainty) (Feature 5). No changes to the chart are necessary. Concur with clarification - Revise charted 62 Wk and danger curve to present survey location. The charted 29 foot sounding with blue tint and 30 foot curve in 38° 29’ 08.64”N 074° 55’ 00.84”W was found approximately 300 meters southwest in the 0.5m BAG with a least CUBE depth of 30 feet (9.19 meters, 0.274 meter uncertainty) in 38° 28 59.60’N 074° 55’ 08.32”W. Concur
Descriptive Report, H11650 SAIC Doc 07-TR-011
Project No. OPR-D302-KR-07 13 05/02/2008
The two small shoal areas charted as a 29 foot sounding, 30 foot depth curve and blue tint in 38º 28’ 29.90”N 074º 54’ 02.48”W and a 30 foot sounding, 30 foot depth curve and blue tint in 38° 28’ 16.72”N 074° 54’ 13.53” was found to be a single shoal area in the 0.5m BAG with a least CUBE depth of 30 feet (9.30 meters, 0.270 meter uncertainty) in 38° 28’ 19.75”N 074° 54’ 11.54”W. Concur The northeast area of Fenwick shoal as defined by the 30 foot depth curve and blue tint in 38° 28’ 43.42”N 074° 55’ 10.20”W to 38° 27’ 30.60”N 074° 55’ 34.45”W still exists, though there have been small changes in its extent. Concur The charted 35 foot sounding in 38° 28’ 39.74”N 074° 54’ 25.01”W was found in the 0.5m BAG to be in depths of 42 feet. Concur The charted 52 foot sounding in 38° 27’ 06.64”N 074° 52’ 50.37”W was found in the 1.0m BAG to be in depths of 60 to 61 feet. Concur The charted 60-ft contour agrees with this survey. Concur Recommend updating the chart with the results of this survey. Concur.
Char t 12211, 1/80,000 scale, 43rd Edition 10/01/2007 corrected through 03/08/2008 Most of H11650 (except for the northernmost 2800 meters) overlaps with the northern portions of Chart 12211. Over their common areas, the depths and features from this survey should supersede the presently charted information. Concur Listed below are the results of the comparison between this survey and Chart 12211. The two small shoal areas charted as a 29 foot sounding, 30 foot depth curve and blue tint in 38º 28’ 29.60”N 074º 54’ 02.45”W and a 30 foot sounding, 30 foot depth curve and blue tint in 38° 28’ 15.61’N 074° 54’ 13.65”W was found in the 0.5m BAG to be a single shoal area with a least CUBE depth of 30 feet (9.30 meters, 0.270 meter uncertainty) in 38° 28’ 19.75”N 074° 54’ 11.54”W. Concur The northeast area of Fenwick Shoal as defined by the 30 foot depth curve and blue tint in 38° 28’ 43.33”N 074° 55’ 09.49”W to 38° 27’ 27.87”N 074° 55’ 36.15”W still exists, though there have been small changes in its extent. Concur The small shoal area noted by a 30 foot depth curve, blue tint and charted 25 foot sounding in 38º 25’ 27.63”'N 074º 55’ 26.45”W, 29 foot sounding in 38° 25’ 44.59”W 074° 55’ 11.65”W, and 27 foot sounding in 38° 25’ 22.57”W 074° 55’ 41.89”W has extended slightly southward. The shoalest CUBE depth in the 0.5m BAG was 26 ft (7.91 meters, 0.270m uncertainty) in 38º 25’ 25.98”N 074º 55’ 24.59”W. Concur Isle of Wight Shoal charted with a 30 foot depth curve and blue tine and least depths of 20 feet in 38º 23’ 25.42”N 074º 55’ 21.07”W and 38° 23’ 14.88”N 074° 55’ 36.67” still exists, though there have been small changes in its extent. The shoalest CUBE depth in

Descriptive Report, H11650 SAIC Doc 07-TR-011
Project No. OPR-D302-KR-07 14 05/02/2008
the 0.5m BAG was 19 ft (5.94 meters, 0.270 meter uncertainty) in 38º 23’ 13.78”N 074º 55’ 33.19”. Concur The charted 35 foot sounding in 38° 28’ 38.31”N 074° 54’ 24.13”W was found in the 0.5m BAG to be in depths of 42 feet. Concur The charted 52 foot sounding in 38° 27’ 05.93”N 074° 52’ 51.22”W was found in the 1.0m BAG to be in depths of 60 to 61 feet. Concur The charted 44 foot sounding in 38° 26’ 13.90”N 074° 53’ 07.25”W was found in the 0.5m BAG to be in depths of 49 to 50 feet. Concur The charted 60-ft contour agrees with this survey. Concur An uncharted obstruction with a least depth of 61 feet (18.55 meters, 0.280 meter uncertainty) was found in 38° 22’ 20.93”N 074° 56’ 55.08”W (Feature 1). Recommend charting 61 foot sounding and label Obstn in 38° 22’ 20.93”N 074° 56’ 55.08”W. Do not concur - Determined insignificant during office processing. Depths range from 59 to 65 feet in vicinity of the item. Do not chart. An uncharted obstruction with a least depth of 38 feet (11.68 meters, 0.270 meter uncertainty) was found in 38° 23’ 34.56”N 074° 55’ 58.30”W (Feature 2). Recommend charting 38 foot sounding, danger circle, blue tint, and label Obstn in 38° 23’ 34.56”N 074° 55’ 58.30”W. Do not concur - Determined insignificant during office processing. Depths range from 38 to 42 feet in vicinity of the item. Do not chart. The charted wreck in 38° 21’ 06.59”N 074° 52’ 52.97”W was not found in its charted position. Approximately 1275 meters to the west southwest, a wreck (AWOIS 1049) with a least depth of 42 feet (12.87 meters, 0.280 meter uncertainty) was found in 38° 20’ 58.84”N 074° 53’ 44.47”W (Feature 6)). Recommend removing the charted wreck symbol in 38° 21’ 06.59”N 074° 52’ 52.97”W and charting a 42 foot sounding, danger circle, blue tint, and label Wk in 38° 20’ 58.84”N 074° 53’ 44.47”W. Concur Delete non-dangerous sunken wreck. Chart 42 Wk and danger curve. An uncharted wreck with a least depth of 71 feet (21.65 meters, 0.280 meter uncertainty) was found in 38° 21’ 30.68”N 074° 57’ 10.05”W (Feature 7). Recommend charting 71 foot sounding and label Wk in 38° 21’ 30.68”N 074° 57’ 10.05”W. Do not concur - Determined insignificant during office processing. Depths range from 71 to 72 feet in vicinity of the item. Do not chart. Chart 71 foot depth. Recommend updating the chart with the results of this survey. Concur.
ENC US4DE11M, 1/80,000 compilation scale, 11th Edition Issued 01/11/2007 Update 11/01/2007 The depicted dangerous wreck (AWOIS 1084) with an 18.8 meter sounding in 38° 30’ 31.61”N 074° 50’ 32.50”W was found in 38° 30’ 31.74”N 074° 50’ 32.42”W with a least

Descriptive Report, H11650 SAIC Doc 07-TR-011
Project No. OPR-D302-KR-07 15 05/02/2008
depth of 18.88 meters, 0.280 meter uncertainty (Feature 5). Concur with clarification - Revise charted 62 Wk and danger curve to present survey location. The depicted 8.8 meter sounding and 9.1 meter depth contour in 38° 29’ 07.80”N 074° 55’ 01.13”W and was not found. The shoalest CUBE depth in the area was found in the 0.5m BAG, approximately 300 meters southwest with a CUBE depth of 9.19 meters, 0.274 meter uncertainty in 38° 28 59.60’N 074° 55’ 08.32”W . Concur The two small shoal areas depicted as an 8.8 meter sounding and a 9.1 meter depth contour in 38° 28’ 28.74”N, 074° 54’ 02.84”W; and a 9.1 meter sounding and 9.1 meter depth contour in 38° 28’ 15.74”N 074° 54’13.93”W were not found. The shoalest CUBE depth in the area was found in the 0.5m BAG at 9.30 meters, 0.270 meter uncertainty, in 38° 28’ 19.75”N 074° 54’ 11.54”W . Concur The northeast area of Fenwick Shoal as depicted by the 9.1 meter depth contour in 38° 28’ 42.82”N 074° 55’ 07.93”W to 38° 27’ 33.41”N 074° 55’ 32.27”W still exists, though there have been small changes in its extent. Concur The depicted 10.6 meter sounding in 38° 28’ 39.04”N 074° 54’25.34”W was found in the 0.5m BAG to be in a depths of 12.71 to 12.99 meters. Concur The depicted 15.8 meter sounding in 38° 27’ 05.94”N 074° 52’ 50.30”W was found in the 1.0m BAG to be in a depths of 18.16 to 18.46 meters. Concur The depicted 18.2 meter contour agrees with this survey. Concur Depicted soundings are generally within 1 meter of those found in this survey. Concur Recommend updating the chart with the results of this survey. Concur.
ENC US4VA50M, 3rd Edition Issued 12/20/2007 Update 12/20/2007 The shoal area depicted by a 9.1 meter depth curve and an 8.8 meter sounding in 38º 25’ 44.93”'N 074º 55’ 11.62”W, 7.6 meter sounding in 38° 25’ 28.08”W 074° 55’ 26.37”W, and 8.2 meter sounding in 38° 25’ 23.19”W 074° 55’ 42.16”W has extended slightly southward. The shoalest CUBE depth in the 0.5m BAG was 7.91 meters, 0.270m uncertainty, in 38º 25’ 25.98”N 074º 55’ 24.59”W. Concur Isle of Wight Shoal depicted by a 9.1 meter depth contour and least depths of 7.0 meters in 38º 23’ 41.62”N 074º 55’ 03.10”W, 6.0 meters in 38º 23’ 25.82”N 074º 55’ 20.96”W, 6.0 meters in 38º 23’ 15.20”N 074º 55’ 36.71”W, 8.5 meters in 38º 23’ 12.54”N 074º 55’ 56.96”W, and 8.2 meters in 38° 22’ 57.63”N 074° 55’ 51.66”W has migrated slightly southwestward. The shoalest CUBE depth in the 0.5m BAG was 5.94 meters, 0.270 meter uncertainty) in 38º 23’ 13.78”N 074º 55’ 33.19”. Concur The depicted 13.4 meter sounding in 38° 26’ 14.74”N 074° 53’ 07.18”W was found in the 0.5m BAG to be in 15.16 to 15.32 meters. Concur

Descriptive Report, H11650 SAIC Doc 07-TR-011
Project No. OPR-D302-KR-07 16 05/02/2008
A submerged obstruction with a least depth of 18.55 meters, 0.280 meter uncertainty, was found in 38° 22’ 20.93”N 074° 56’ 55.08”W (Feature 1). Recommend adding a submerged obstruction object in 38° 22’ 20.93”N 074° 56’ 55.08”W. Do not concur - Determined insignificant during office processing. Depths range from 18.15 to 19.41 feet in vicinity of the item. Do not chart. A submerged obstruction with a least depth 11.68 meters, 0.270 meter uncertainty, was found in 38° 23’ 34.56”N 074° 55’ 58.30”W (Feature 2). Recommend adding a submerged obstruction object in 38° 23’ 34.56”N 074° 55’ 58.30”W. Do not concur - Determined insignificant during office processing. Depths range from 11.21 to 12.67 feet in vicinity of the item. Do not chart. The depicted non-dangerous wreck in 38° 21’ 07.15”N 074° 52’ 52.99”W was not found in its depicted position. Approximately 1275 meters to the west southwest, a submerged dangerous wreck (AWOIS 1049) with a least depth of 12.87 meters, 0.280 meter uncertainty, was found in 38° 20’ 58.84”N 074° 53’ 44.47”W (Feature 6). Recommend removing the depicted non-dangerous wreck in 38° 21’ 07.15”N 074° 52’ 52.99”W and adding a submerged dangerous wreck object in 38° 20’ 58.84”N 074° 53’ 44.47”W. Concur - Delete non-dangerous sunken wreck. Chart 42 Wk and danger curve. A submerged non-dangerous wreck with a least depth of 21.65 meters, 0.280 meter uncertainty, was found in 38° 21’ 30.68”N 074° 57’ 10.05”W (Feature 7). Recommend adding a submerged non-dangerous wreck object in 38° 21’ 30.68”N 074° 57’ 10.05”W. Do not concur - Determined insignificant during office processing. Depths range from 71 to 72 feet in vicinity of the item. Do not chart. Chart 71 foot depth. A submerged obstruction with a least depth 8.35 meters, 0.270 meter uncertainty, was found in 38° 23’ 18.42”N 074° 55’ 52.46”W (Feature 4). Recommend adding a submerged obstruction object in 38° 23’ 18.42”N 074° 55’ 52.46”W. Do not concur - Determined insignificant during office processing. Depths range from 8.18 to 8.86 feet in vicinity of the item. Do not chart. A submerged obstruction with a least depth 8.73 meters, 0.270 meter uncertainty, was found in 38° 23’ 16.41”N 074° 55’ 59.37”W (Feature 3). Recommend adding a submerged obstruction object in 38° 23’ 16.41”N 074° 55’ 59.37”W. Do not concur - Determined insignificant during office processing. Depths range from 8.52 to 9.47 feet in vicinity of the item. Do not chart. Charted soundings are generally within one meter of those found in this survey. Concur The charted 18.2 meter contour agrees with this survey. Concur Recommend updating the chart with the results of this survey. Concur.

Descriptive Report, H11650 SAIC Doc 07-TR-011
Project No. OPR-D302-KR-07 17 05/02/2008
AWOIS Item Investigations No AWOIS items were assigned for full investigation within H11650 (Sheet F). Concur AWOIS items have been discussed in above sections.
Additional Features for Char ting No other uncharted wrecks or obstructions were found during this survey. Concur.
Danger to Navigation Repor ts No Danger to Navigation Reports were submitted for this survey. Concur
D.2 ADDITIONAL RESULTS Shoreline verification was not required for this survey. Comparison with prior surveys was not required under this task order. There were no Aids to Navigation that fell within this survey. Concur.

Descriptive Report, H11650 SAIC Doc 07-TR-011
Project No. OPR-D302-KR-07 18 05/02/2008
APPROVAL SHEET
02 May 2008 LETTER OF APPROVAL REGISTRY NUMBER: H11650 This report and the accompanying digital data for project OPR-D302-KR-07, Mid-Atlantic Corridor, Coast of Delaware-Maryland Project are respectfully submitted. Field operations and data processing contributing to the accomplishment of this survey, H11650, were conducted under supervision of myself and lead hydrographers Paul L. Donaldson, and Jason M. Infantino with frequent personal checks of progress and adequacy. This report and accompanying deliverable data items have been closely reviewed and are considered complete and adequate as per the Statement of Work. Reports concurrently submitted to NOAA for this project include:
Report Submission Date Data Acquisition and Processing Report, SAIC Doc 07-TR-012 02 May 2008
SCIENCE APPLICATIONS INTERNATIONAL CORPORATION
Gary R. Davis Chief Hydrographer
Science Applications International Corporation 02 May 2008

Descriptive Report, H11650 SAIC Doc 07-TR-011
APPENDIX I. DANGER TO NAVIGATION REPORTS There were no Danger to Navigation Reports submitted for H11650.
Project No. OPR-D302-KR-07 I-1 05/02/2008
Descriptive Report, H11650 SAIC Doc 07-TR-011
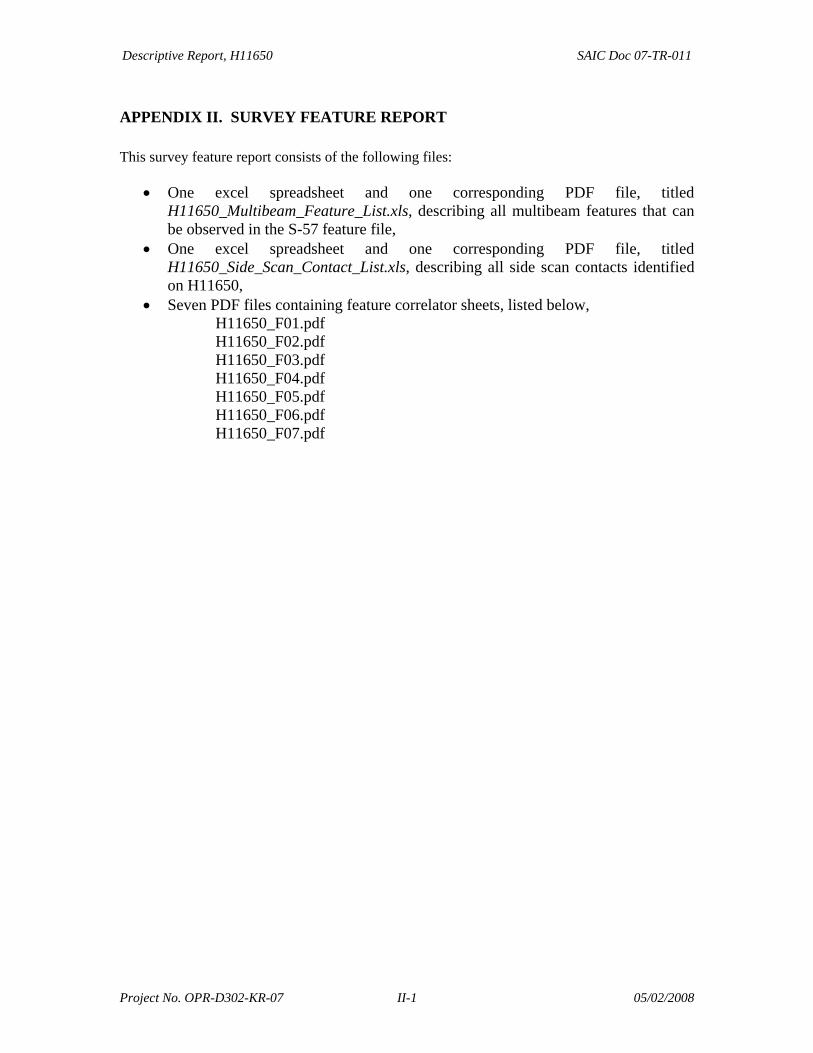
APPENDIX II. SURVEY FEATURE REPORT This survey feature report consists of the following files:
• One excel spreadsheet and one corresponding PDF file, titled H11650_Multibeam_Feature_List.xls, describing all multibeam features that can be observed in the S-57 feature file,
• One excel spreadsheet and one corresponding PDF file, titled H11650_Side_Scan_Contact_List.xls, describing all side scan contacts identified on H11650,
• Seven PDF files containing feature correlator sheets, listed below, H11650_F01.pdf H11650_F02.pdf H11650_F03.pdf H11650_F04.pdf H11650_F05.pdf H11650_F06.pdf H11650_F07.pdf
Project No. OPR-D302-KR-07 II-1 05/02/2008
Descriptive Report, H11650 SAIC Doc 07-TR-011
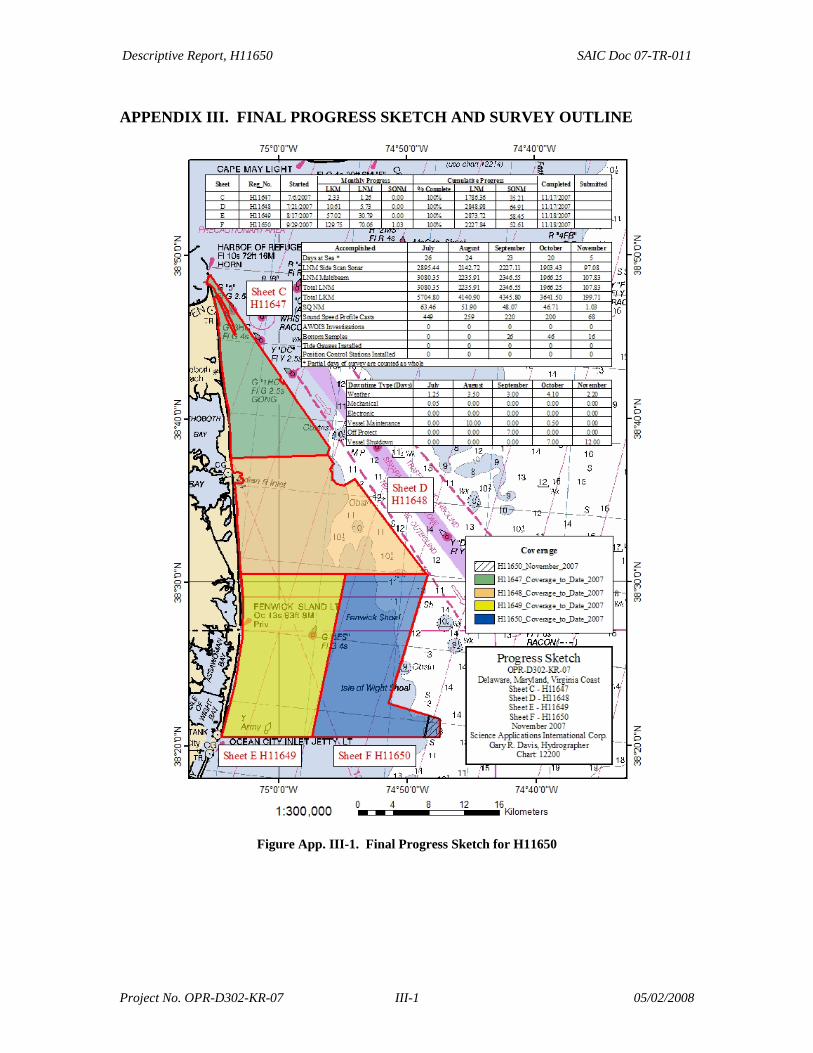
APPENDIX III. FINAL PROGRESS SKETCH AND SURVEY OUTLINE
Figure App. III-1. Final Progress Sketch for H11650
Project No. OPR-D302-KR-07 III-1 05/02/2008

Descriptive Report, H11650 SAIC Doc 07-TR-011
The Survey Outline for H11650 was delivered to the COTR, on 29 November 2007 in file DELMARVA_Completed_Survey_Outlines.zip. The WinZip file contained a DXF format survey outline in lat/lon format for import into MapInfo for each sheet surveyed. The survey outline file for Sheet F (H11650_survey_outline_lat_long.dxf) is also part of this delivery. Figure App. III-2 demonstrates the graphical depiction of the DXF.
Figure App. III-2. Survey Outline for H11650
Project No. OPR-D302-KR-07 III-2 05/02/2008

Descriptive Report, H11650 SAIC Doc 07-TR-011
APPENDIX IV. TIDES AND WATER LEVELS The on-line times for acquisition of valid hydrographic data for this sheet are presented in Table App. IV-1, Abstract of Times of Hydrography, H11650. Project: OPR-D302-KR-07 Registry No.: H11650 Contractor Name: Science Applications International Corporation Date: 18 November 2007 Sheet Letter: F Inclusive Dates: 29 September 2007 – 18 November 2007 Field work is complete.
Table App. IV- 1. Abstract Times of Hydrography, H11650
Year Begin
Julian Day Date Begin Time
End Julian Day Date End Time
2007 272 09/29/2007 11:27:41 276 10/03/2007 07:31:37 2007 277 10/04/2007 14:56:09 280 10/07/2007 23:51:03 2007 282 10/09/2007 20:44:50 283 10/10/2007 07:28:15 2007 286 10/13/2007 20:02:06 288 10/15/2007 00:39:53 2007 288 10/15/2007 22:44:47 290 10/17/2007 07:49:36 2007 291 10/18/2007 14:42:22 292 10/19/2007 16:54:46 2007 294 10/21/2007 04:23:59 296 10/23/2007 21:54:34 2007 318 11/14/2007 13:28:32 319 11/15/2007 10:38:00 2007 322 11/18/2007 02:11:21 322 11/18/2007 15:54:05
Final Tide Note Observed verified water levels were downloaded for Atlantic City, NJ (8534720) from the NOAA Tides & Currents website (http://tidesandcurrents.noaa.gov). Water Level correctors were prepared for each zone using the SABER/Tools/Create Water Level Files software. SABER/Apply Correctors/Tides software applied these files to the multibeam data according to the zone containing the nadir beam of each ping. Analysis of the H11650 multibeam data in the SABER Multi-View Editor and in depth grids revealed minimal depth jumps across the junction of zones based on Atlantic City, NJ (8534720). A spreadsheet analysis also confirmed the adequacy of zoning correctors based on Atlantic City, NJ (8534720). The water level zoning correctors based entirely on Atlantic City, NJ (8534720) were applied to all multibeam data for H11650.
Project No. OPR-D302-KR-07 IV-1 05/02/2008
Descriptive Report, H11650 SAIC Doc 07-TR-011
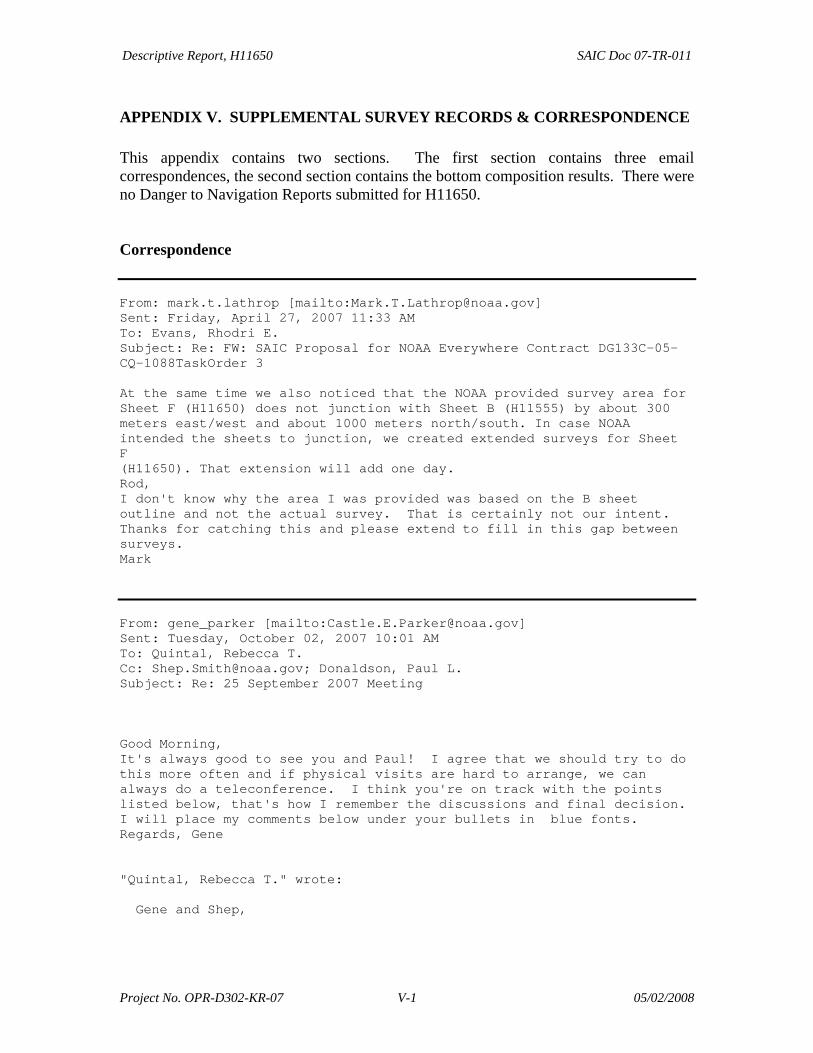
APPENDIX V. SUPPLEMENTAL SURVEY RECORDS & CORRESPONDENCE This appendix contains two sections. The first section contains three email correspondences, the second section contains the bottom composition results. There were no Danger to Navigation Reports submitted for H11650. Correspondence
From: mark.t.lathrop [mailto:[email protected]] Sent: Friday, April 27, 2007 11:33 AM To: Evans, Rhodri E. Subject: Re: FW: SAIC Proposal for NOAA Everywhere Contract DG133C-05-CQ-1088TaskOrder 3 At the same time we also noticed that the NOAA provided survey area for Sheet F (H11650) does not junction with Sheet B (H11555) by about 300 meters east/west and about 1000 meters north/south. In case NOAA intended the sheets to junction, we created extended surveys for Sheet F (H11650). That extension will add one day. Rod, I don't know why the area I was provided was based on the B sheet outline and not the actual survey. That is certainly not our intent. Thanks for catching this and please extend to fill in this gap between surveys. Mark
From: gene_parker [mailto:[email protected]] Sent: Tuesday, October 02, 2007 10:01 AM To: Quintal, Rebecca T. Cc: [email protected]; Donaldson, Paul L. Subject: Re: 25 September 2007 Meeting Good Morning, It's always good to see you and Paul! I agree that we should try to do this more often and if physical visits are hard to arrange, we can always do a teleconference. I think you're on track with the points listed below, that's how I remember the discussions and final decision. I will place my comments below under your bullets in blue fonts. Regards, Gene "Quintal, Rebecca T." wrote: Gene and Shep,
Project No. OPR-D302-KR-07 V-1 05/02/2008

Descriptive Report, H11650 SAIC Doc 07-TR-011
Thanks so much for taking time out to meet with Paul and myself last week. We find these meetings very valuable and hope to try have them more regularly. We have composed our notes of the specific questions that we asked and are hoping you can just read over these quickly before we send them off to Crescent and Mark. Things went back and forth a few times so we just want to double check that we are on the same page before we send the official requests to the COTRs. Thanks and please let us know if we got something wrong! -Rebecca LakeBorgne Questions/Answers: 1.. For contacts with no least depth (i.e. we don’t have bathy but are estimating the depth from side scan instead) should use a QUASOU of 9 (Value reported, not confirmed). Concur. This is in tune with MCD request for attribution. 2.. MCOVR and MQUAL will be made from the outer perimeter of the bathy (GS+ and SB). Concur. Since bathy data is the source for chart update, the coverage is based upon the source of updates (bathy). 3.. A single MQUAL will be made for an entire sheet. MQUAL will have a CATZOC of 2 (ZOC A2 - Full seafloor ensonification or sweep. All significant seafloor features detected and depths measured.) We decided on this because we do have full ensonification via the side scan and all features do have depths measured except where noted (see QUASOU of 9 above). Note that the S&D states that we should use a CATZOC of 6 (not assessed), but AHB have started accessing and would like us to as well. Concur. We'll have to note this for clarification of Specs revisions in 2008. 2007 Spec, page 122 ... "M_QUAL (Quality of Data) This should be separated for different classes of survey. Singlebeam, multibeam (Complete) and multibeam (Object Detection), and Lidar should be separate. page 123... "Point features with heights or surveyed extents of features: For features with heights rather than depths, or where extents were collected for islets, reefs, ledges, shoreline construction, etc., use CATZOC 6 (U for data not assessed)." · I think the U ( not assessed) refers to heights of features that are above MLLW and has elevation values. 4.. 5.. 6.. MQUAL will also have a TECSOU of 1, 2 and 3 (found by echo sounder, found by side scan and found by multi-beam, respectively). Concur. Only attribute with hardware used. Techsou 1 refers to VBES, so in most cases, SAIC would use 2 and 3 for SSS and SWMB. 7.. Regarding Section 6.2 of the SOW below: If an interferometric side scan is used, final depth data from the side scan shall be submitted as a Bathymetric Attributed Grid (BAG). The DR shall discuss the uncertainty and total propagated error (TPE) of the data and describe what portions of the swath (if any) meet IHO Order 1 specifications. The single beam soundings shall be submitted separately as part of the S-57 feature file. We asked if they really wanted every valid sounding of every singlebeam file to be populated in the S-57 feature file. Shep ended up calling Gerd Glang and Jeff Ferguson about this issue to see what
Project No. OPR-D302-KR-07 V-2 05/02/2008
Descriptive Report, H11650 SAIC Doc 07-TR-011
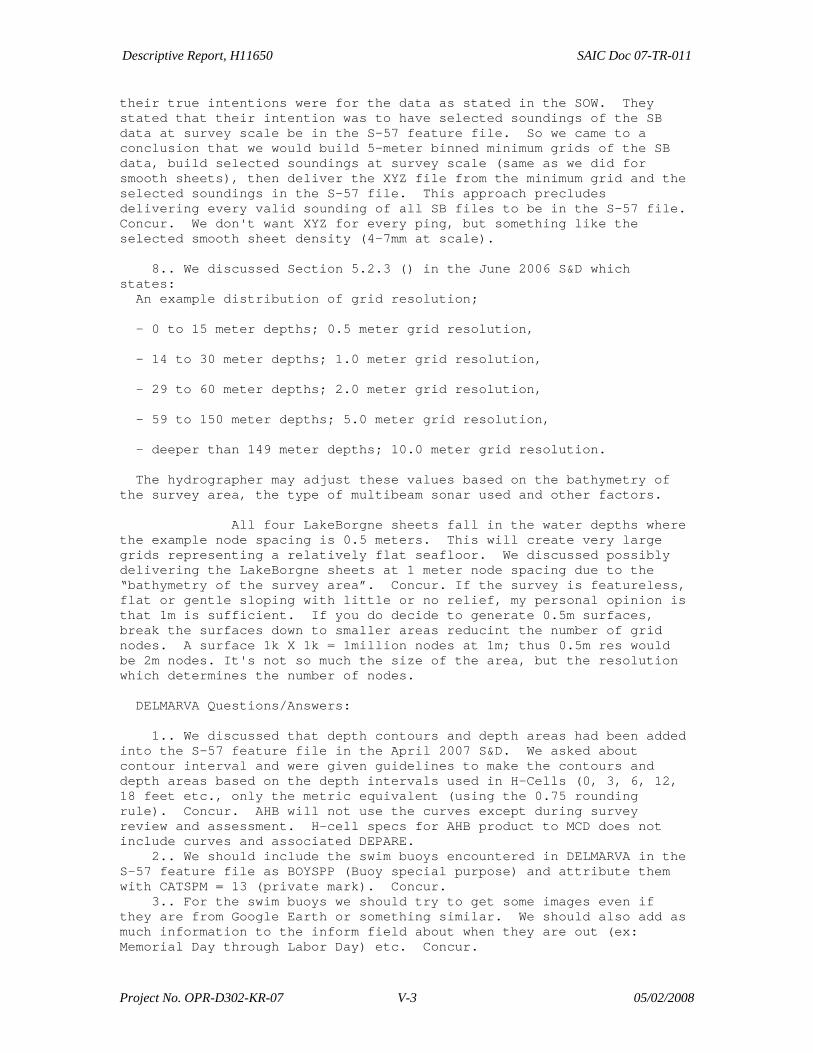
their true intentions were for the data as stated in the SOW. They stated that their intention was to have selected soundings of the SB data at survey scale be in the S-57 feature file. So we came to a conclusion that we would build 5-meter binned minimum grids of the SB data, build selected soundings at survey scale (same as we did for smooth sheets), then deliver the XYZ file from the minimum grid and the selected soundings in the S-57 file. This approach precludes delivering every valid sounding of all SB files to be in the S-57 file. Concur. We don't want XYZ for every ping, but something like the selected smooth sheet density (4-7mm at scale). 8.. We discussed Section 5.2.3 () in the June 2006 S&D which states: An example distribution of grid resolution; - 0 to 15 meter depths; 0.5 meter grid resolution, - 14 to 30 meter depths; 1.0 meter grid resolution, - 29 to 60 meter depths; 2.0 meter grid resolution, - 59 to 150 meter depths; 5.0 meter grid resolution, - deeper than 149 meter depths; 10.0 meter grid resolution. The hydrographer may adjust these values based on the bathymetry of the survey area, the type of multibeam sonar used and other factors. All four LakeBorgne sheets fall in the water depths where the example node spacing is 0.5 meters. This will create very large grids representing a relatively flat seafloor. We discussed possibly delivering the LakeBorgne sheets at 1 meter node spacing due to the “bathymetry of the survey area”. Concur. If the survey is featureless, flat or gentle sloping with little or no relief, my personal opinion is that 1m is sufficient. If you do decide to generate 0.5m surfaces, break the surfaces down to smaller areas reducint the number of grid nodes. A surface 1k X 1k = 1million nodes at 1m; thus 0.5m res would be 2m nodes. It's not so much the size of the area, but the resolution which determines the number of nodes. DELMARVA Questions/Answers: 1.. We discussed that depth contours and depth areas had been added into the S-57 feature file in the April 2007 S&D. We asked about contour interval and were given guidelines to make the contours and depth areas based on the depth intervals used in H-Cells (0, 3, 6, 12, 18 feet etc., only the metric equivalent (using the 0.75 rounding rule). Concur. AHB will not use the curves except during survey review and assessment. H-cell specs for AHB product to MCD does not include curves and associated DEPARE. 2.. We should include the swim buoys encountered in DELMARVA in the S-57 feature file as BOYSPP (Buoy special purpose) and attribute them with CATSPM = 13 (private mark). Concur. 3.. For the swim buoys we should try to get some images even if they are from Google Earth or something similar. We should also add as much information to the inform field about when they are out (ex: Memorial Day through Labor Day) etc. Concur.
Project No. OPR-D302-KR-07 V-3 05/02/2008

Descriptive Report, H11650 SAIC Doc 07-TR-011
General things we should/can change for all submissions: 1.. We can just include the AWOIS descriptions in the AWOIS database in Appendix 2 of the DR. In Section D of the DR we will just say “see AWOIS database in Appendix 2”. That way the information is only presented once. We do not need to include the Uncertainty value for the sounding in the AWOIS data base if it is presented elsewhere (in the Excel list of features for example). Once the appendix 2 is established, the reference note could include the page number within Appendix 2. 2.. We should put the DTN reports that AHB submit to MCD in Appendix 1 (Danger to Navigation Reports). We may (should) include our original DTN reports in Appendix 5 (Supplemental survey Records and Correspondence). AHB would like us to do this since they have to add in their submissions if we don’t. Concur. AHB will include SAIC on the AHB Danger submissions. Thus this can happen. Agree with inclusion of SAIC DtoN submission and place in supplemental correspondance with Appendix 5. 3.. We discussed that all four Lake Borgne sheets fall in the water depths where the recommended node spacing is 0.5 meters. This will create very large grids. AHB are OK with us having to break up sheets due to grid file sizes. They stated that we should break our survey areas down to what ever size works for us and if they have to they can break it down even further. Concur. IT would be in the best interest of all to keep the grids between 500mb and 1gb. As always, the smaller file sizes make the grids easier to work with. Grids over 1GB are more difficult to work with. · · Overall, your right on track and this is what I remember. If you have any other questions, please respond. · · Thanks for your efforts and continued support with NOAA charting program. · Regards, Gene ______________________________________ Rebecca Quintal Data Processing Manager Science Applications International Corporation 221 Third Street Newport, RI 02840 USA 401.847.4210 401.849.1585 (fax) From: Mark.T.Lathrop [mailto:[email protected]] Sent: Friday, April 11, 2008 1:46 PM To: Quintal, Rebecca T. Cc: Crescent Moegling; Evans, Rhodri E.; gene_parker Subject: Re: Seeking clarification on the April 2007 Specs regarding the S-57 Feature File Rebecca, After feedback from Gene at AHB, we've concluded that we will not require depth contours in the S-57 feature file. If you did choose to
Project No. OPR-D302-KR-07 V-4 05/02/2008

Descriptive Report, H11650 SAIC Doc 07-TR-011
include them for QC they would be used for review and validation of the survey data, but AHB will generate their own contours anyway. Mark Quintal, Rebecca T. wrote: Crescent and Mark, We would like to seek clarification on the requirements for the S-57 feature files to be delivered for the Mid-Atlantic Corridor – OPR-D302-KR-07 sheets (H11647, H11649, H11649 and H11650). In the June 2006 S&D, the last paragraph of section 8.2. S-57 Feature File states “General soundings, contours and depth areas will NOT be included in the S-57 feature file since these objects will be derived from the final BAGs during chart compilation. In rare cases, an isolated sounding may be part of the S-57 feature file if it needs a danger circle and/or additional attributions.” This paragraph is exactly the same in the April 2007 S&D. However, in the April 2007 S&D there were the following additions in Section 8.2.1. S-57 Attribution under “A list of the more common objects and attributions that may be used during a typical hydrographic survey is given below.” … DEPCNT (Depth Contour) Objects Contours and depth areas including surveyed “0” curve and the MHW-MLLW intertidal DEPARE needed for creating ledges and reefs. Mandatory Attributes: • VALDCO (Value of depth contour) DEPARE (Depth Area) Objects Depth Areas correspond to the area between the contours. Mandatory Attributes: • DRVAL1 (Depth range value 1) – The minimum (shoalest) value of the depth area. • DRVAL2 (Depth range value 2) – The maximum (deepest) value of the depth area. Please confirm if Depth Contours and/or Depth Areas are to be delivered as part of the S-57 Feature File. Thank you, -Rebecca ______________________________________ Rebecca Quintal Data Processing Manager Science Applications International Corporation 221 Third Street Newport, RI 02840 USA 401.847.4210 401.849.1585 (fax)
Project No. OPR-D302-KR-07 V-5 05/02/2008
Descriptive Report, H11650 SAIC Doc 07-TR-011
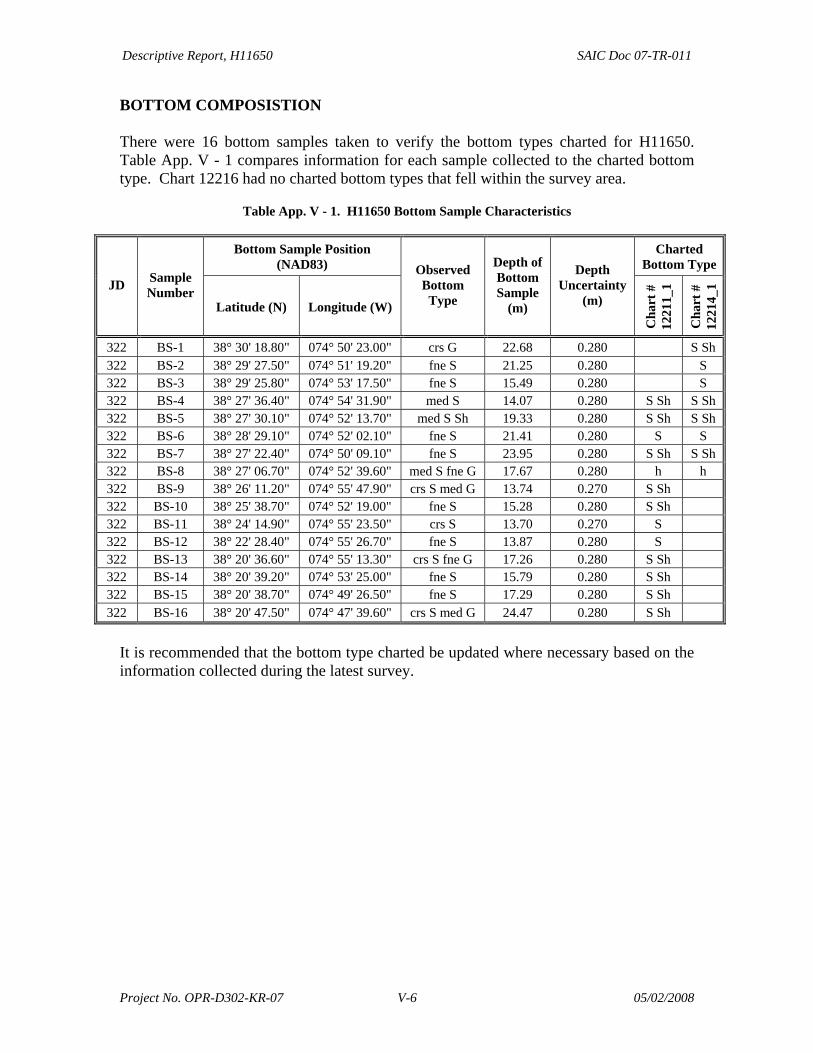
BOTTOM COMPOSISTION There were 16 bottom samples taken to verify the bottom types charted for H11650. Table App. V - 1 compares information for each sample collected to the charted bottom type. Chart 12216 had no charted bottom types that fell within the survey area.
Table App. V - 1. H11650 Bottom Sample Characteristics
Bottom Sample Position (NAD83)
Charted Bottom Type
JD Sample Number
Latitude (N) Longitude (W)
Observed Bottom Type
Depth of Bottom Sample
(m)
Depth Uncertainty
(m)
Cha
rt #
12
211_
1
Cha
rt #
12
214_
1
322 BS-1 38° 30' 18.80" 074° 50' 23.00" crs G 22.68 0.280 S Sh 322 BS-2 38° 29' 27.50" 074° 51' 19.20" fne S 21.25 0.280 S 322 BS-3 38° 29' 25.80" 074° 53' 17.50" fne S 15.49 0.280 S 322 BS-4 38° 27' 36.40" 074° 54' 31.90" med S 14.07 0.280 S Sh S Sh 322 BS-5 38° 27' 30.10" 074° 52' 13.70" med S Sh 19.33 0.280 S Sh S Sh 322 BS-6 38° 28' 29.10" 074° 52' 02.10" fne S 21.41 0.280 S S 322 BS-7 38° 27' 22.40" 074° 50' 09.10" fne S 23.95 0.280 S Sh S Sh 322 BS-8 38° 27' 06.70" 074° 52' 39.60" med S fne G 17.67 0.280 h h 322 BS-9 38° 26' 11.20" 074° 55' 47.90" crs S med G 13.74 0.270 S Sh 322 BS-10 38° 25' 38.70" 074° 52' 19.00" fne S 15.28 0.280 S Sh 322 BS-11 38° 24' 14.90" 074° 55' 23.50" crs S 13.70 0.270 S 322 BS-12 38° 22' 28.40" 074° 55' 26.70" fne S 13.87 0.280 S 322 BS-13 38° 20' 36.60" 074° 55' 13.30" crs S fne G 17.26 0.280 S Sh 322 BS-14 38° 20' 39.20" 074° 53' 25.00" fne S 15.79 0.280 S Sh 322 BS-15 38° 20' 38.70" 074° 49' 26.50" fne S 17.29 0.280 S Sh 322 BS-16 38° 20' 47.50" 074° 47' 39.60" crs S med G 24.47 0.280 S Sh
It is recommended that the bottom type charted be updated where necessary based on the information collected during the latest survey.
Project No. OPR-D302-KR-07 V-6 05/02/2008
H11650
ATLANTIC HYDROGRAPHIC BRANCH EVALUATION REPORT to Accompany
Surveys H11650 (2007)
This Evaluation Report has been written to supplement and/or clarify the original Descriptive Report. Sections in this report refer to the corresponding sections of the Descriptive Report. B. DATA ACQUISITION AND PROCESSING B.1 DATA PROCESSING
The following software was used to process and review data at the Atlantic Hydrographic Branch (AHB):
CARIS HIPS/SIPS version 6.1 CARIS BASE Manager 2.1 CARIS HOM ENC 3.3 PYDRO, version 8.7 CARIS S-57 Composer 2.0
B.2 QUALITY CONTROL
H-Cells
The AHB source depth grid was generated as a 5m
resolution BASE surface. Survey scale soundings were extracted from AHB generated 5m Base surface at a 1:20000 scale using a radius of 1.75m. Soundings were selected for charting using the latest raster charts 12211 and 12214. Soundings were then checked for conflicts, corrected to remove conflicts, and edited to allow for proper sounding compilation placement with respect to existing charted depths outside the survey area. The BASE surface was referenced when selecting the chart scale soundings, to ensure that the selected soundings portrayed the bathymetry within the common area.
Depth curves were drawn from the Base surface. The
contours are included in the final H-Cell product. The curves were utilized during chart scale sounding selection at AHB.

H11650
The compilation products and Stand Alone HOB Files (SAHOB) are detailed in the Compilation Process Log of this document. All individual SAHOB files were assembled in BASE Editor during H-Cell compilation.
The completed H-Cell was exported as a Base Cell File (ENC.000) in S-57 format with all values in metric units. The metric equivalent ENC.000 file was then converted to NOAA chart units (ENC_CS.000) with all values measured in feet following NOAA sounding rounding rules.
The H11650 CARIS H-Cell final deliverables include the following products: H11650_CS.000 1:80,000
Scale H11650 Selected Soundings (Chart Scale)
H11650_SS.000 1:20,000 Scale
H11650 Selected Soundings (Survey Scale)
JUNCTIONS H11555 (2006) to the east H11648 (2007) to the north H11649 (2007) to the west Survey H11555 (2006) junctions with the present survey to the east. Present survey soundings are 1 foot deeper than survey H11555 (2006). Survey H11648 (2007) junctions with the present survey to the north. Present survey soundings are 1 foot shoaler than survey H11648 (2007). Survey H11649 (2007) junctions with the present survey to the west. Present survey soundings are 1 foot shoaler than survey H11649 (2007). C. VERTICAL AND HORIZONTAL CONTROL Final vertical correction processing was completed by the field unit with no additional corrections required by Atlantic Hydrographic Branch personnel. The field unit applied verified water levels in conjunction with the preliminary tidal zoning which was accepted and approved by N/OPSI CO-OPS as the final zoning for H11650. Sounding datum is Mean Lower Low Water (MLLW). Vertical datum is Mean High Water (MHW).

H11650
Horizontal control used for this survey during data acquisition is based upon the North American Datum of 1983 (NAD83), UTM projection zone 18. Office ENC processing of this survey required translating the datum to meet S-57 ENC requirements. The horizontal geodetic datum was translated to Latitude and Longitude (LLDG) World Geodetic System-84 (WGS-84) during CARIS Base Manager processing. D. RESULTS AND RECOMMENDATIONS
Chart Comparison 12211 (43rd. Edition, Oct. /07__ Corrected through NM, Oct. 20/07 Corrected through LNM, Oct. 16/07
Scale 1:80,000
Chart Comparison 12214 (48th. Edition, Oct. /07__ Corrected through NM, Oct. 20/07 Corrected through LNM, Oct. 9/07
Scale 1:80,000 ENC Comparison US5MD50M
Fenwick Island to Chincoteague Inlet Edition 1
Update Application Date 2008-12-08 Issue Date 2008-12-08 References: Charts 12211
ENC Comparison US4DE11M
Cape May to Fenwick Island Edition 13
Update Application Date 2008-04-03 Issue Date 2008-09-26 References: Charts 12214
Hydrography
The charted Hydrography originates with prior surveys and requires no further consideration. The hydrographer makes adequate chart comparisons in Section D. of the Descriptive Report.
The present survey is adequate to supersede the charted bathymetry within the common area. Any features not specifically addressed either in the H-Cell File or the
Adequacy of Survey

H11650
4
Blue Notes should be retained as charted. Refer to the Descriptive Report for further survey requirements recommended by the hydrographer.
Miscellaneous
Chart compilation was done by Atlantic Hydrographic Branch personnel, in Norfolk, Virginia. Compilation data will be forwarded to Marine Chart Division, Silver Spring, Maryland. See Section D.1. of this report for a list of the Raster Charts and Electronic Navigation Charts (ENC) used for compiling the present survey.
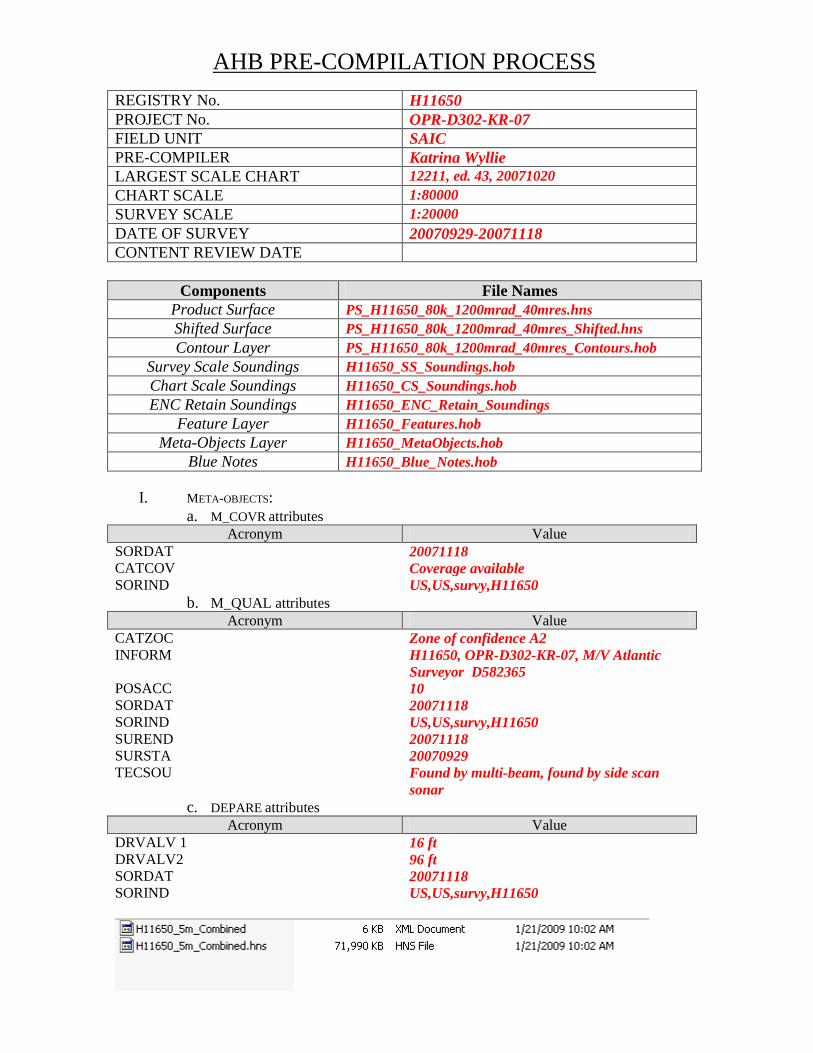
AHB PRE-COMPILATION PROCESS
REGISTRY No. H11650 PROJECT No. OPR-D302-KR-07 FIELD UNIT SAIC PRE-COMPILER Katrina Wyllie LARGEST SCALE CHART 12211, ed. 43, 20071020 CHART SCALE 1:80000 SURVEY SCALE 1:20000 DATE OF SURVEY 20070929-20071118 CONTENT REVIEW DATE
Components File Names Product Surface PS_H11650_80k_1200mrad_40mres.hns Shifted Surface PS_H11650_80k_1200mrad_40mres_Shifted.hns Contour Layer PS_H11650_80k_1200mrad_40mres_Contours.hob
Survey Scale Soundings H11650_SS_Soundings.hob Chart Scale Soundings H11650_CS_Soundings.hob ENC Retain Soundings H11650_ENC_Retain_Soundings
Feature Layer H11650_Features.hob Meta-Objects Layer H11650_MetaObjects.hob
Blue Notes H11650_Blue_Notes.hob
I. META-OBJECTS: a. M_COVR attributes
Acronym Value SORDAT 20071118 CATCOV Coverage available SORIND US,US,survy,H11650
b. M_QUAL attributes Acronym Value
CATZOC Zone of confidence A2 INFORM H11650, OPR-D302-KR-07, M/V Atlantic
Surveyor D582365 POSACC 10 SORDAT 20071118 SORIND US,US,survy,H11650 SUREND 20071118 SURSTA 20070929 TECSOU Found by multi-beam, found by side scan
sonar c. DEPARE attributes
Acronym Value DRVALV 1 16 ft DRVALV2 96 ft SORDAT 20071118 SORIND US,US,survy,H11650
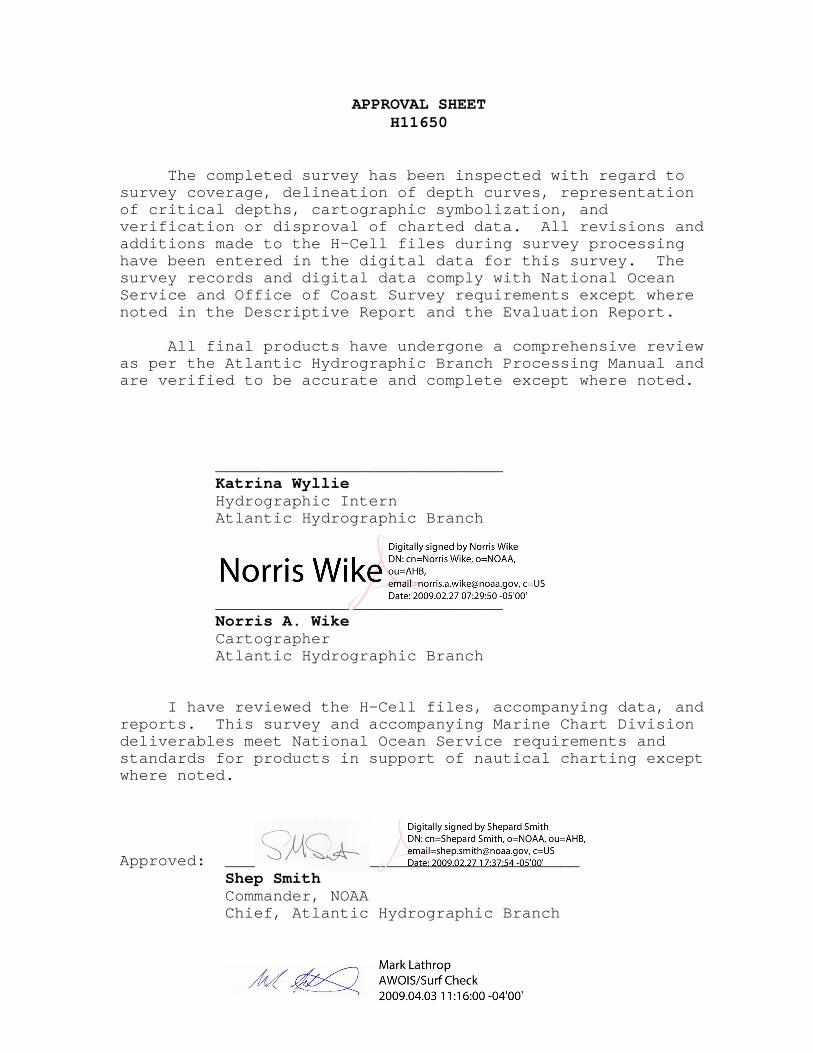
APPROVAL SHEET H11650
The completed survey has been inspected with regard to survey coverage, delineation of depth curves, representation of critical depths, cartographic symbolization, and verification or disproval of charted data. All revisions and additions made to the H-Cell files during survey processing have been entered in the digital data for this survey. The survey records and digital data comply with National Ocean Service and Office of Coast Survey requirements except where noted in the Descriptive Report and the Evaluation Report. All final products have undergone a comprehensive review as per the Atlantic Hydrographic Branch Processing Manual and are verified to be accurate and complete except where noted. ______________________________ Katrina Wyllie
Hydrographic Intern Atlantic Hydrographic Branch
______________________________ Norris A. Wike
Cartographer Atlantic Hydrographic Branch
I have reviewed the H-Cell files, accompanying data, and reports. This survey and accompanying Marine Chart Division deliverables meet National Ocean Service requirements and standards for products in support of nautical charting except where noted. Approved: _____________________________________ Shep Smith
Commander, NOAA Chief, Atlantic Hydrographic Branch