noaa fisheries, southwest region protected resources division santa rosa, california science,...
TRANSCRIPT

NOAA Fisheries, Southwest RegionProtected Resources Division
Santa Rosa, California
Science, Service, Stewardship
Melanie D. Harrison, Ph.DTechnical Advisory Committee (TAC)
March 6, 2013
Water Quality Metricsand Assessment Methods

Introduction
Science, Service, Stewardship
Numerous designated beneficial uses for the Russian River
Goal is to protect existing and future beneficial uses for humans and the environment.
Numerous metrics have been used to predict changes in water quality due to ecological restoration.
Need to link the appropriate response metrics with key drivers in the watershed to meet water quality objectives.
Develop evaluation tools to assess the response of variables to changes in water quality over time.

Water Quality Metrics
Scale Site Reach Watershed
Can vary depending protecting designated beneficial use of interest Ex. Cold water habitat for listed species Ex. Municipal and domestic supply
Can vary depending on pollutant of interest Nutrients Metals
Science, Service, Stewardship
Most common metric categories include multi-metric approach:
Water Quality parameters
Biological parameters
Hydrologic parameters

Common Water Quality Metrics
Science, Service, Stewardship
Variables
Water temperature (°C)
Dissolved Oxgyen (mg/L)
pH
Turbidity
Specific Conductance (µS/cm
Sulfate (mg/L)
Total Suspended Solids (mg/L)
Total Nitrogen (mg/L)
Total Phosphorus ( mg/L)
Organophosphate (mg/L)
Organic Carbon (mg/L
Total Mercury (Hg) (mg/L)
Methyl-mercury (MeHg) (µ/L)
Aluminum (mg/L)
Soil oxygen demand (SOD)
Biological oxygen demand (BOD)
Pollution-Specific Metrics
Maximum concentrations
Minimum concentrations
Average and or weighted concentrations
Standard deviations
10th percentile concentrations
25th percentile concentrations
50th percentile concentrations
75th percentile concentrations
90th percentile concentrations
LCD50, and EC50
Response
Biotic sensitive to physical changes in stream temperatures
Biotic community sensitive to changes in DO, chemical transformation occur
Sensitive indicator of habitat conditions
nutrient impairments
inorganic pollutants
toxicity
Indicator of stream capacity to support anaeobic conditions
Variables
Barium
Sediment (kg/mg)
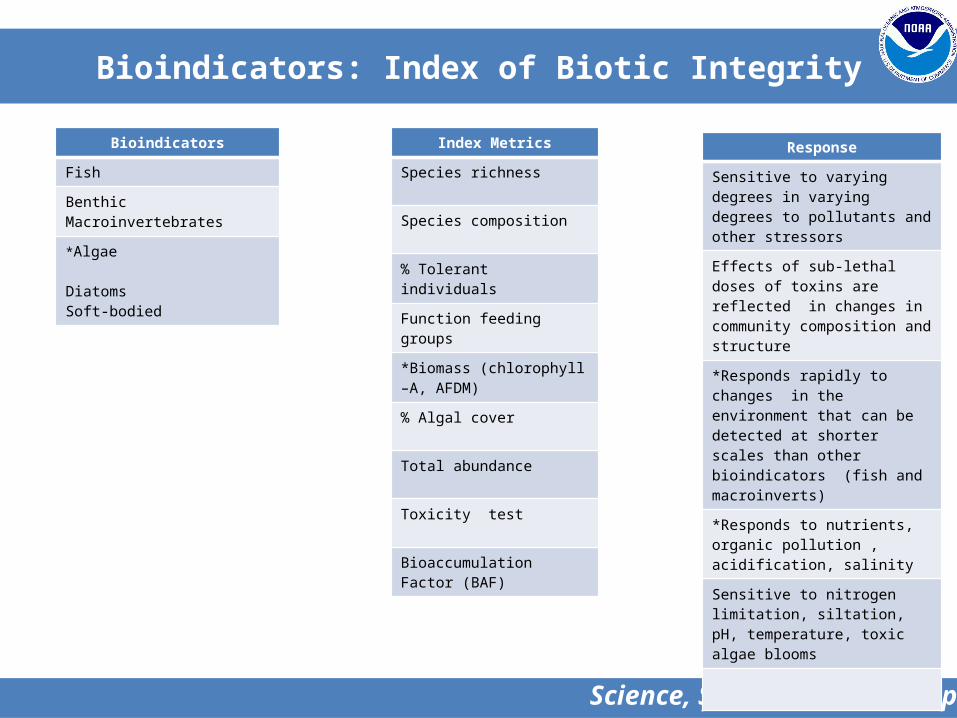
Bioindicators: Index of Biotic Integrity
Science, Service, Stewardship
Response
Sensitive to varying degrees in varying degrees to pollutants and other stressors
Effects of sub-lethal doses of toxins are reflected in changes in community composition and structure
*Responds rapidly to changes in the environment that can be detected at shorter scales than other bioindicators (fish and macroinverts)
*Responds to nutrients, organic pollution , acidification, salinity
Sensitive to nitrogen limitation, siltation, pH, temperature, toxic algae blooms
Index Metrics
Species richness
Species composition
% Tolerant individuals
Function feeding groups
*Biomass (chlorophyll –A, AFDM)
% Algal cover
Total abundance
Toxicity test
Bioaccumulation Factor (BAF)
Bioindicators
Fish
Benthic Macroinvertebrates
*Algae
DiatomsSoft-bodied

Hydrologic Metrics
Science, Service, Stewardship
Hydrology is a key controllers of biogeochemical processes in a watershed.
Hotspots are created where hydrological flow paths converge with substrates or other flow paths containing complementary or missing nutrients.
Example: Overland flow produced by storm runoff in the semi-isolated Hanson Ponds input Hg and P into the system.
Application that ‘connectivity’ is important for floodplain biogeochemistry.
Increase frequency and duration of connectivity
Controls on DO, temperature, organic matter processing, and etc.

Hydrological metrics
Science, Service, Stewardship
Watershed/ Hydrodynamics
Stream flow velocity (ft/s)
River discharge (cfs)
Metrics
Maximum Peak flowMedian flowMinimum flow
Duration of high-flowFrequency of high-flow events
Loading rates (mass/unit time)
Water residence time (t)
Frequency of connectivity and/or floodplain inundation (n)
Duration of connectivity (d)
Water depth (m)
ResponseControls flux of nutrients and, chemicals, and sediment
Alters distribution, form and quality of constituents
Channel form response rapidly to changes in flows

Other Metrics
Science, Service, Stewardship
Land use/Land cover
Agricultural (distal)
Extent of riparian vegetation/buffer (% riparian cover) (proximal)
Water velocities Nutrient processing Sediment distribution
Climate Precipitation Temperature

Water Quality Assessment Methods/Tools
Existing Water Quality Standards Water Quality-based assessment
thresholds Numeric thresholds for chemical
constituents and water quality parameters Ex. California and Federal
Drinking standards Ex. California Toxic Rules to
Protect Human Health and Aquatic Life
Water Quality ObjectivesNumeric Narrative
North Coast Index Biotic Integrity (IBI)
Existing data SWAMP Data Base
Water Quality Models AQUATOX WASP7
Hydrodynamics Models Nutrients
Sediment Transport Models Fate and Transport
Metals
Use to provide a more detailed assessment of the fate and transport of nutrients and metals and predict changes in water quality due to controlling variables.

Thank You/Questions
Science, Service, Stewardship
North Coast Regional Water Quality Control Board Stephen Bargsten Steve Butkus Mark Neely
Permit Resource and Management Department: Amy Lyle
Endangered Habitat Conservancy: Michael Beck and Nancy Schaefer
NMFS: John McKeon, Brian Cluer, and Michael Donahue