no.338 / july 2010 a new database of parliamentary … · parliamentary debates in dail ... of all...
TRANSCRIPT

Institute for International Integration Studies
IIIS Discussion Paper
No.338 / July 2010
A new Database of Parliamentary Debates in Ireland, 1922--2008
Slava MikhaylovLondon School of Economics, Institute for InternationalIntegration Studies, Trinity College Dublin
Alexander HerzogNew York University

IIIS Discussion Paper No. 338
A new Database of Parliamentary Debates in Ireland, 1922--2008 Slava Mikhaylov London School of Economics, Institute for International Integration Studies, Trinity College Dublin Alexander Herzog New York University Disclaimer Any opinions expressed here are those of the author(s) and not those of the IIIS. All works posted here are owned and copyrighted by the author(s). Papers may only be downloaded for personal use only.

A new Database of Parliamentary Debates inIreland, 1922–2008∗
Alexander HerzogNew York University
Slava MikhaylovLondon School of Economics
July 26, 2010
Abstract
We present a new database of parliamentary debates and written answers in DailEireann for the entire time period from the third Dail in 1922 to the thirtieth Dail in2008. This database was built from the Official Records of the Houses of the Oireach-tas. Unlike its original version, our database integrates information about debates andinformation about deputies into a single database. This database therefore allows tosearch and retrieve contributions from individual deputies of the Dail (Teachta Dala orTD) and to combine information about TDs’ parties and constituencies with the historyof political speeches and written answers. In addition, our database facilitates the appli-cation of content analysis software such as Wordscore (Laver, Benoit and Garry, 2003)or Wordfish (Slapin and Proksch, 2008) and makes it possible to estimate TDs’ policypreferences from speeches. In this paper we document the structure of the database andhow it was generated. We furthermore demonstrate how political debates can be usedin social science research through a series of examples. These include an analysis ofthe policy agenda in all budget speeches from 1922 to today, the estimation of speak-ers’ policy positions in the 2008 budget debate, and the estimation of ministers’ policypositions in the 26th government in 2002.
Key Words: Parliamentary debates, policy point estimation, budget speeches, text anal-ysis
∗Note: This manuscript is still work in progress — comments are welcome and we urge you to wait untilwe declare a final version before citing it. This research was supported in part by the Irish Research Councilfor Humanities and the Social Sciences. We thank Patrick Honohan for invaluable comments at various stagesof this project. We also thank the Institute for International Integration Studies (IIIS) at Trinity College Dublinfor providing research facilities during this project. Authors’ names are listed in alphabetical order. Authorshave contributed equally to all work.

1 Introduction
Almost all political decisions and political opinions are, in one way or the other, expressed
in written or spoken text. Leaders in history became famous for their ability to motivate
masses with their speeches; parties publish policy programmes before elections in order
to provide information about their policy objectives; parliamentary decisions are discussed
and deliberated on the floor in order to exchange opinions; members of the executive in most
political systems are legally obliged to provide written or verbal answers to questions from
legislators; and citizens express their opinions about political events in internet blogs or in
public online chats. Political texts and speeches are everywhere where people express their
political preferences.
It is not until recently that social scientist have discovered the potential of analysing po-
litical texts to test theories of political behavior. One reason is that systematically processing
texts to retrieve information is technically challenging. New approaches in computerised
content analysis have greatly facilitated this task. Statistical techniques such as Wordscore
(Benoit and Laver, 2003; Laver, Benoit and Garry, 2003) or Wordfish (Slapin and Proksch,
2008) now enable researchers to systematically compare documents with each other and
to extract relevant information from them. Applied to party manifestos, for which most of
these techniques have been developed, these methods can be used to evaluate the similarity
or dissimilarity between manifestos, which then can be used to derive estimates of parties’
policy preferences and their distance to each other.
One area of research that increasingly makes use of quantitative text methods are stud-
ies of legislative behaviour (Giannetti and Laver, 2005; Laver and Benoit, 2002; Monroe,
Colaresi and Quinn, 2008; Proksch and Slapin, 2009b; Yu, Kaufmann and Diermeier, 2008;
2

Charbonneau, 2009; Galli, Grembi and Padovano, 2009; Imbeau, 2009; Hopkins and King,
2010; Quinn et al., 2010; Grimmer, 2010). Only a few parliaments in the world use roll-
call votes (the recording of each legislator’s decision in a floor vote) that allow to monitor
individual members’ behaviour. In all other cases, contributions to debates are the only out-
come that can be observed from individual members. Using such debates for social science
research, however, is often limited by data availability. Although most parliaments keep
written records of parliamentary debates and often make such records electronically avail-
able, they are never published in formats that facilitate social science research. A significant
amount of labour is usually required to collect, clean and organise parliamentary records
before they can be used for statistical purposes, often requiring technical skills that many
social scientists lack.
The purpose of this paper is to present a new database of parliamentary debates to over-
come this hurdle. Our database contains all debates as well as questions and answers from
the third to the thirtieth Dail Eireann (1922–2009), covering almost a century of political
discourse. These debates are organised in a way that allows users to search them by date,
topics or speaker. More importantly, and lacking in the official records of parliamentary
debates, we have identified all speakers and linked their debate contributions to the informa-
tion on party affiliation and constituencies from the official members database. This enables
researchers to retrieve member-specific speeches on particular topics or within a particular
time frame, which is necessary to apply computerised content analysis software. Further-
more, all data can be retrieved and stored in formats that can be accessed using commonly
used statistical software packages.
In addition to documenting this database, we also present three applications in which
we make use of the new data (Section 3). In the first study, we analyse budget speeches
3

delivered by all finance ministers from 1922 to 2008 (Section 3.1) and show how the policy
agenda and ministers’ policy preferences have changed over time (Section 3.2). In the sec-
ond application we compare contributions that were made on one particular topic: the 2008
budget debate (Section 3.3). Here we demonstrate how computerised content methods can
be used to estimate members’ policy preferences on a dimension that represents pro- versus
anti-government attitudes. Finally, we estimate all contributions from members of the 26th
government that formed as a coalition between Fianna Fail and the Progressive Democrats
in 2002. Here we estimate the policy positions of all cabinet ministers on a pro- versus anti-
spending dimension and show that positions on this dimension are highly correlated with
actual spending levels of each ministers’ department (Section 3.4).
2 Overview of Database Content
Parliamentary debates in Dail Eireann are collected by the Oireachtas Debates Office and
published as the Official Record. The Debates Office records and transcribes all debates and
makes them available in both printed and digital form. Electronic versions of debates are
published as single HTML files on the Houses of Oireachtas website.1 At the moment of
writing, the official debates website contains 549,292 HTML files. The content of all these
HTML files forms the data source for our database. It is obviously impossible to hand-code
that much information. We therefore wrote a computer script that automated the processing
of all files.2 This script is able to find all debate contributions and the names of all speakers
in each file. In addition, it retrieves the date as well as the topic of each debate.
1Official records are available at http://debates.oireachtas.ie/Main.aspx (last accessed on 17 De-cember 2009). More detailed information about the Debates Office’s work can be found athttp://www.oireachtas.ie/viewdoc.asp?fn=/documents/Organisation/debatesoffice2.htm (last accessed on 17December 2009).
2The computer script consists of multiple syntax files that were written in the computer language Python.
4

The officially published debate files contain the name of each speaker. These names,
however, are “hard coded” into the HTML files and not linked to the information in the
official members database. In addition, speaker names are not coded consistently, hence
making it difficult to collect speeches from a particular deputy.3 Our goal was to identify
every single speaker name that appears in the Official Record and to integrate parliamentary
speeches with information about deputies’ party affiliation, constituency, age and profession
from the official members database into a single database. We therefore used an automated
record-linkage procedure to identify every speaker. 4
The final database contains all debates and written answers from the first meeting of
the 3rd Dail on 9 September 1922 through the end of 2008, covering every Dail that has
met during this period. In total, the database contains 7,006 parliamentary sessions with a
total of 440,223 individual contributions. Taking all debates together, our database contains
434,018,123 words with an average length of about 1,000 words per contribution. The data is
organised in a way that facilitates the application of computerised content analysis software.
Every row in the data set is one contribution with columns containing information on the
following variables:5
3More recent parliamentary debates are made available in a dynamic framework on the Oireachtas’ web-site. This new interface allows to retrieve speaker-specific information and to retrieve speeches from a singlemember. However, this only applies to debates since 2007.
4Record-linkage is a common technique that is used to link entries from two databases that share the samecontent but differ in how entries are coded. The basic idea of this procedure is to compare every entry fromone database (in our case, the complete list of all speaker names) with every entry from the second database(in our case, the official members database), using some pre-defined algorithm to determine which two entriesare most similar to each other. Different record-linkage algorithms have been developed and, after comparingseveral algorithms, we found the “longest common sub-string” procedure to work particularly well with ourdata. (See Christen (2006) for an overview and comparison of different record-linkage procedures.) Thecomputer code we applied comes from Febrl, a Python environment that was developed by the ANU DataMining Group at the Australian National University (http://datamining.anu.edu.au/linkage). We thank HolgerDoring for making us aware of Febrl.
5The data is actually stored in a relational database in order to avoid recording redundant information.However, almost all statistical software packages require data that are organised in spreadsheet format. Thatis, with rows containing observations and columns containing information on variables. Here we describe theformat of the spreadsheet files as these are the files that users will download and use for their analyses.
5

• the first name and surname of the speaker,
• the speaker’s party affiliation and constituency,
• the Dail and volume number from the official records,
• the day, month and year of the debate,
• the topic of the debate,
• a number representing the place of the contribution in the order of all contributions
that were made during a particular debate.
The following page shows a small sample of the data set for speeches from finance
minister Brian Lenihan.
6

Asa
mpl
eof
the
data
with
spee
ches
from
finan
cem
inis
ter
Bri
anLe
niha
n
Firs
tna
me
Sur-
nam
ePa
rty
Con
stit-
uenc
yD
ail
Volu
me
Year
Mon
thD
ayTo
pic
Ord
erC
ontr
ibut
ion
Bri
anL
enih
anFF
Dub
linW
est
3066
320
0810
14B
udge
tD
ebat
e20
092
We
find
ours
elve
sin
one
ofth
em
ostd
ifficu
ltan
dun
-ce
rtai
ntim
esin
livin
gm
emor
y.Tu
rmoi
lin
the
finan
-ci
alm
arke
tsan
dst
eep
incr
ease
sin
com
mod
itypr
ices
have
pute
norm
ous
pres
sure
son
econ
omie
sth
roug
h-ou
tthe
wor
ld.
Her
eat
hom
ew
efa
ceth
em
ostc
hal-
leng
ing
fisca
land
econ
omic
posi
tion
ina
gene
ratio
n.[..
.]B
rian
Len
ihan
FFD
ublin
Wes
t30
663
2008
1014
Wri
tten
Ans
wer
–Pu
blic
Sect
orPa
y2
The
Gov
ernm
entc
ontin
ues
tobe
com
mitt
edto
safe
-gu
ardi
ngth
eta
xpay
er’s
mon
eyby
ensu
ring
that
de-
liver
yof
publ
icse
rvic
esin
the
mos
teffi
cien
tand
ef-
fect
ive
man
ner.
The
rece
ntR
evie
wan
dTr
ansi
tiona
lA
gree
men
tund
erTo
war
ds20
16,w
hich
has
yett
obe
ratifi
ed,
reco
gnis
esth
atth
ePu
blic
Serv
ice
mus
tre
-vi
ewco
ntin
uous
lyits
syst
ems,
proc
esse
san
dpr
oce-
dure
s,to
ensu
reth
atit
isre
spon
sive
and
effic
ient
and
that
itpr
ovid
eshi
ghqu
ality
,val
uefo
rmon
eyse
rvic
es.
[...]
Bri
anL
enih
anFF
Dub
linW
est
3066
320
0810
14W
ritte
nA
n-sw
er–
Nat
iona
lD
evel
opm
ent
Plan
2Fu
ndin
gun
dert
heN
DP
(200
7-20
13)i
n20
09an
dsu
b-se
quen
tyea
rsis
anis
sue
that
will
bead
dres
sed
inth
e20
09B
udge
tbei
ngpr
esen
ted
toth
eD
ailt
oday
.
......
......
......
......
......
...
Bri
anL
enih
anFF
Dub
linW
est
3066
520
0810
30A
djou
rnm
entD
e-ba
te.
-Fi
nanc
ial
Inst
itutio
nsSu
p-po
rtSc
hem
e
2D
eput
yB
urto
nha
sra
ised
the
issu
eof
the
seri
ous
fi-na
ncia
lco
nseq
uenc
esto
the
Stat
ear
isin
gfr
omth
egu
aran
tee
sche
me
toba
nks
and
[628
]cr
edit
inst
itu-
tions
.In
the
cour
seof
her
cont
ribu
tion
she
rais
eda
num
ber
ofis
sues
whi
chdo
not
aris
ew
ithin
the
term
sof
the
Adj
ourn
men
tm
atte
r.H
owev
er,
Iw
illbe
plea
sed
tode
alw
ithth
ese
byw
ayof
are
ply
toa
parl
iam
enta
ryqu
estio
n.[..
.]
......
......
......
......
......
...
7

By default (that is, in the data sets that we make available online) contributions are
sorted by members, making it very easy to apply computerised content analysis software
that requires text being organised by individuals. Contributions can also be sorted by any
other column, e.g. by parties which would allow to compare contributions from members
of one party to that of another. In addition, we provide a variable “order” that indicates
the order in which contributions were made during a debate, hence making it possible to
reconstruct the precise sequence of a debate or question and answer session.
3 Analysing the Content of Parliamentary Debates
In the previous section, we have explained the structure of the database. In the following
three sections we demonstrate how the data can be used for social science research. We
do this by demonstrating three different applications. In the first application, we analyse
the budget speeches of all finance ministers from 1922 to 2008. The resulting data set
resembles a time series because we observe a single speech per year but over a long time
period. 6 Analysing this data, we show how policy agenda and ministers’ fiscal preferences
have changed over time. In the second application, we construct a data set that resembles
a cross-sectional analysis because we retrieve all speeches from one particular year and
on one particular topic from our database: the 2008 budget debate. This data structure
enables us to estimate the policy positions of all speakers who contributed to the budget
debate and to compare how similar or dissimilar their preferences were. We find that policy
positions are clustered into two groups: the government and the opposition; but we also find
considerable variation within each group. Finally, we take all contributions that were made
6An exception are emergency budgets which obviously increase the number of budget speeches in a year.
8

during the term of one government and use the data to estimate the policy positions of all
cabinet members on a dimension representing pro- versus anti-spending. We demonstrate
the validity of estimated policy positions by comparing them against actual spending levels
of each cabinet ministers’ department and show that the two measures are almost perfectly
correlated with each other.
3.1 The Content of Budget Speeches in Historical Perspective
The quantitative analysis of text is primarily based on the proposition that preference profiles
of speakers can be constructed from their word frequencies (Baayen, 2001; Bybee, 2001).
This makes word frequencies the most important data input to almost all existing methods
of text analysis. Word frequencies can be easily visualised as word clouds. These word
clouds show the most frequently used words in a text with font size being proportional
to frequency of appearance. This method is popular with political pundits and has been
popularised over the last presidential election in the US, where it was used to “visualize some
of the most pressing issues that the presidential candidates would like to imprint upon voters’
minds” (Yao, 2008). This method has also been used by mainstream media to analyse a
wide variety of policies. For example, Obama’s statements in the health care debate (Gavin,
2009); verbal duelling of Obama and Cheney on national security (Condon, 2009); Obama’s
inauguration speech (Day, 2009); and policy priorities of David Cameron (Williams, 2008).
The Washington Post has now started a dedicated project that analyses the frequency of
words in all speeches made by President Obama using word clouds.7
Here we show how word frequencies can be used to analyse speeches made by Irish
Ministers for Finance. We have extracted the budget speeches of all finance ministers from
7http://projects.washingtonpost.com/obama-speeches/ (Accessed 2010-01-27)
9

our database, the first being Cosgrave’s speech in April 1923, and the latest being Leni-
han’s speech in October 2008. In total, there are 90 speeches given by 23 different finance
ministers for whom we have generated word clouds as shown in Figure 1.
[∗∗∗∗ FIGURE 1 ABOUT HERE ∗∗∗∗]
Each individual word cloud panel presents a snap shot into the preference profiles of
individual ministers. With taxation being the key instrument of fiscal policy it is not sur-
prising that the word “tax” is on average the most frequently used word across all Ministers
for Finance. We can also discern that the frequency of references to “government” has been
uneven over time with a relatively high usage in the 1960s to 1980s and then a subsequent
decline (apart from Quinn’s tenure) until Cowen and particularly Lenihan’s speeches.
What is more clearly evident is the change in the number of unique words used by
different ministers. This reflects the fact that some budget speeches were very short, while
others were long and covered many distinct topics. The easiest example is to compare
speeches by two consecutive ministers, e.g. for Cowen and Lenihan. Word clouds reflect
the sheer multitude of problems facing the country that needed to be addressed by Lenihan
compared to the relatively “quieter” (on average) three budgets delivered by Cowen.
Overall, while being catchy, word clouds can only be used as easy first-cut visualisations
of the data. One thing that becomes readily apparent from Figure 1 is that word clouds
do not facilitate systematic comparison of documents and their content with each other.
Pundits usually interpret word clouds simply by pointing out prominent features (i.e., the
most high-frequency words) (e.g. Condon, 2009). Very often word clouds are presented
for consumption with a suggestion to “[t]ake a look for yourself” (Gavin, 2009) or “[t]ake
from this what you will” (Yao, 2008). Recent advances in text analysis allow us to go
10

further than simple punditry. In the next section we demonstrate how our data facilitates the
application of text analysis techniques to answer more complex empirical questions without
the ambiguity in interpretation that is inherent in word clouds.
3.2 Estimation of Finance Ministers’ Policy Positions
Wordfish (Slapin and Proksch, 2008) is a method that combines Item Response Theory (e.g.
Clinton, Jackman and Rivers, 2004) with text classification. Wordfish assumes that there is
a latent policy dimension and that each author has a position on this dimension. Words are
assumed to be distributed over this dimension such that yi jt ∼ Poisson(λi jt), where yi jt is the
count of word j in document i at time t. The functional form of the model is assumed to be
λi jt = exp(αit +ψ j +β jωit)
where αit are fixed effects to control for differences in the length of speeches and ψ j are
fixed effects to control for the fact that some words are used more often than other words
in all documents. ωit are the estimates of authors’ position on the latent dimension and β j
are estimates of word-weights that are determined by how important specific words are in
discriminating documents from each other. In this model each document is treated as a sep-
arate actor’s position and all positions are estimated simultaneously. If a minister maintains
a similar position from one budget speech to the next, it means that the minister used words
with similar frequencies over time. At the same time, any movement detected by the model
towards a position held by, for example, his predecessor, means that minister’s word choice
is now much closer to his predecessor than to his own word usage in the previous budget
speech. The identification strategy for the model also sets the mean of all positions to 0
11

and the standard deviation to 1, thus allowing over time change in positions relative to the
mean with the total variance of all positions over time fixed (Slapin and Proksch, 2008).
Effectively this standardises the results and allows comparison of positions over time on a
comparable scale.
Before including documents in the analysis, we have removed all numbers, punctuation
marks, and stop words. In addition, we followed the advice in Proksch and Slapin (2009a)
and deleted words that appear in less than 20% of all speeches. We do this in order to prevent
words that are specific to a small time period (and hence only appear in a few speeches) to
have a too large impact on discriminating speeches from each other.
Figure 2 shows the results of estimation, including a line representing fitted values from
a linear regression.
[∗∗∗∗ FIGURE 2 ABOUT HERE ∗∗∗∗]
The results in Figure 2 indicate a policy agenda shift over time. We can also observe that
some ministers have similar preference profiles while others differ significantly. For exam-
ple, Ahern and Reynolds are very similar in their profile but differ from a group consisting
of Quinn, McCreevy, Cowen and Lenihan who are very close to each other. There also
appears to be a dramatic shift in agenda between the tenures of Lynch and Haughey (and
also during Taoiseach Lynch’s delivery of the budget speech for the Minister for Finance
Charles Haughey in 1970). Overall, it appears that topics covered in budget speeches de-
velop in waves, with clear bands formed by, for example, Lenihan, Cowen, McCreevy and
Quin; Ahern and Reynolds; MacSharry, Dukes, Bruton, Fitzgerald, O’Kennedy and Col-
ley; R.Ryan, Colley, Lynch (for Haughey); MacEntee, McGilligan and Aiken; Blythe and
MacEntee.
12

The shift in positions of individual Ministers observed in Figure 2 can be explained
in terms of the changing economic environment in the country (thus capturing the policy
agenda shift) or in terms of individual idiosyncrasies of Ministers. We consider the relation-
ship between estimated policy positions of Minsters and three core economic indicators: un-
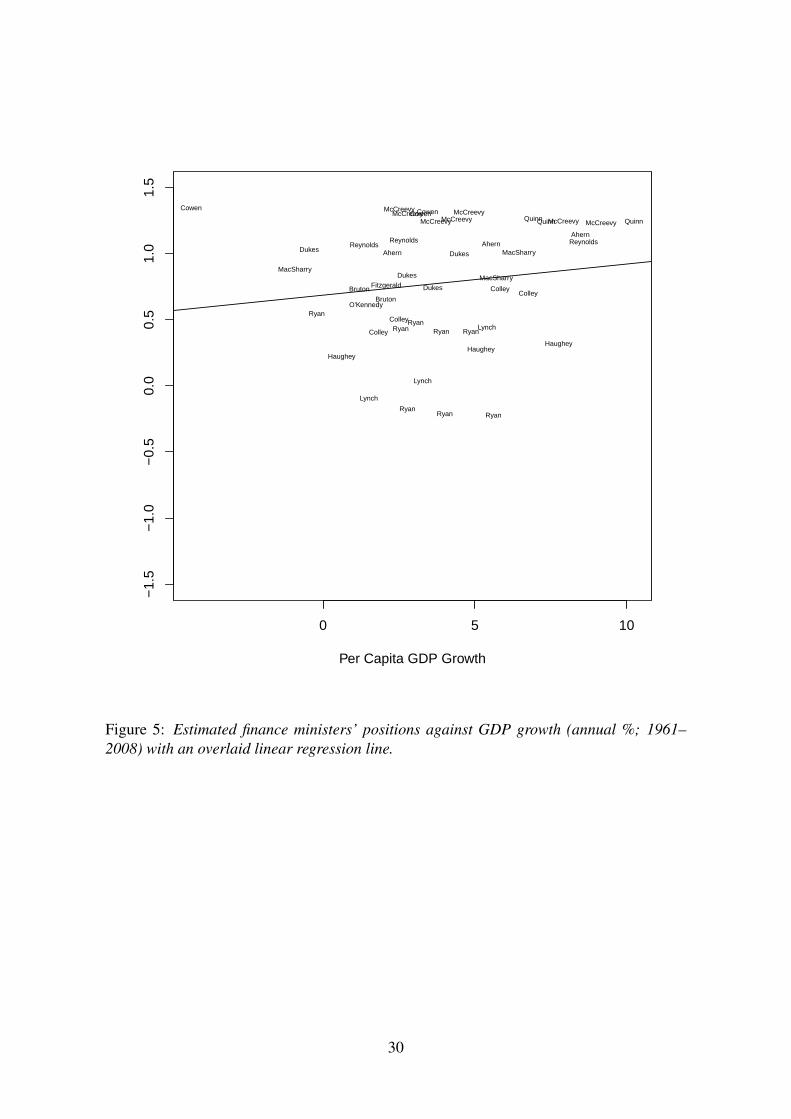
employment, inflation, and per capita GDP growth rates. Figure 3 shows the three economic
indicators, inflation (1923–2008), GDP growth (annual %; 1961–2008) and unemployment
rate (1956–2008), over time. Figures 4, 5 and 6 show Ministers’ estimated positions plotted
against the three indicators.
[∗∗∗∗ FIGURE 4 ABOUT HERE ∗∗∗∗]
[∗∗∗∗ FIGURE 5 ABOUT HERE ∗∗∗∗]
[∗∗∗∗ FIGURE 6 ABOUT HERE ∗∗∗∗]
As expected, the results show that policy positions of some Ministers can be explained
by the contemporaneous economic situation in the country. However, the fact that some of
the Ministers are clear outliers highlights the effect of individual characteristics on policy-
making. One of the avenues for research that arises from this exercise is to analyse the
determinants of these individual idiosyncrasies, possibly looking at education, class, and
previous ministerial career. We claim that this and related questions can now be easily
investigated by researchers using our database.
3.3 Speakers’ Policy Position in the 2008 Budget Debate
In the previous section, we used budget speeches from each year and compared them over
time. In this section, we restrict the analysis to a single year but take multiple speeches
13

made on the same topic. More precisely, we estimate the preferences of all speakers who
participated in the debate over the 2008 budget. We extract these speeches from the database
by selecting all contributions with topic “Financial Resolution” in year 2007.8 This leaves
us with a total of 22 speakers from all five parties. Table 1 shows the speeches included in
the analysis.
[∗∗∗∗ TABLE 1 ABOUT HERE ∗∗∗∗]
To estimate speakers’ position we use Wordscore, a computer algorithm developed by
Laver, Benoit and Garry (2003). In a similar application, Laver, Benoit and Garry (2003)
have already demonstrated that Wordscore can be effectively used to derive estimates of TDs
policy positions.9 As in the example above, we pre-processed documents by removing all
numbers and interjections.
Wordscore uses two documents with well known positions as reference texts. The po-
sitions of all other documents are then estimated by comparing them to these reference
documents. The underlying idea is that a document that, in terms of word frequencies, is
similar to a reference document was produced by an author with similar preferences. The se-
lection of reference documents furthermore determines the (assumed) underlying dimension
for which documents’ positions are estimated. For example, using two opposing documents
on climate change would scale documents on the underlying dimension “climate politics”.
It has also been shown that under certain assumptions the Wordscore algorithm is related to
the Wordfish algorithm that we used in the previous section (Lowe, 2008). Kluver (2009),
furthermore, showed that the results of both procedures are highly correlated.
8The debates for the 2008 budget were held in December 2007.9Laver and Benoit (2002) successfully used Wordscore to estimate TDs position in the 1991 confidence
debate on the future of the Fianna Fail–PD coalition government.
14

We assume that contributions in budget debates have the underlying dimension of being
either pro or contra the current government. Our interpretation from reading the speeches
is that, apart from the budget speech itself, all other contributions to a large extent either
attack or defend the incumbent government. We therefore can use contributions during the
budget debate as an indicator for how much a speaker is supporting or opposing the current
government, here consisting of Fianna Fail and the Green Party. As our reference texts
we therefore chose the speeches by Bertie Ahern (Taoiseach) and Enda Kenny (FG party
leader). The former should obviously be strongly supportive of the government while the
latter, as party leader of the largest opposition party, should strongly oppose it. Figure 7
shows estimated positions for all speakers grouped by party affiliation.
[∗∗∗∗ FIGURE 7 ABOUT HERE ∗∗∗∗]
The estimated positions are clustered into two groups, one representing the government
and one the opposition. Within the government cluster, Deputy Batt O’Keeffe (Minister of
State at the Department of Environment, Heritage and Local Government) is estimated to be
the most supportive speaker for the government, while Deputy Pat Carey (Minister of State
at the Department of Community, Rural and Gaeltacht Affairs) and Deputy Sean Ardagh are
estimated to be relatively closer to the opposition. Deputy John Gormley, leader of the Green
party and Minister for the Environment, Heritage and Local Government in the FF-Green
coalition, is estimated to be in the centre of the government cluster. Among all positions in
the opposition cluster, the speech of Roisın Shortall is the closest to the government side,
with Neville being the farthest out.
15

3.4 Ministers Policy Position in the 26th Government
The government cabinet in parliamentary democracies is at the core of political decision-
making, yet it is difficult to model intra-cabinet bargaining as the preferences of most cab-
inet members are unknown. Cabinet decisions are usually made behind closed doors and
the doctrine of joint cabinet responsibility prevents ministers from publicly opposing deci-
sions, even if they disagree with them. Using ministers’ speeches and their responses during
question times offer a unique opportunity to infer their preferences on policy dimensions of
interest. In our final application we estimate policy positions for all cabinet members in the
26th government. The dimension on which positions are estimated represents pro- versus
contra-government spending. We show that estimated positions are highly correlated with
departments’ actual spending, which means that estimated positions are not only meaningful
but also can be used to predict actual policy-making.
The 26th government was formed as a coalition between Fianna Fail and the Progressive
Democrats after the election for the 29th Dail in 2002. The cabinet was reshuffled on 29
September 2004 and we only include ministers’ speeches until that date. Table 2 lists all
cabinet members (and their portfolios) included in our analysis.
[∗∗∗∗ TABLE 2 ABOUT HERE ∗∗∗∗]
To estimate ministers’ policy positions, we retrieve the complete record of each minis-
ter’s contribution in parliament from the first meeting on 6 June 2002 until the date of the
reshuffle. On average, each minister made 3,643 contributions with an average number of
587,077 words. Table 3 provides summary statistics for all ministers, sorted by total word
count.
[∗∗∗∗ TABLE 3 ABOUT HERE ∗∗∗∗]
16

We again use Wordscore (Benoit and Laver, 2003; Laver, Benoit and Garry, 2003) to
estimate positions as it allows us to define the underlying policy dimension by choosing
appropriate reference texts. We estimate positions on a social-economic left-right dimension
that reflects pro- versus contra-government spending. We therefore use contributions by
Mary Coughlan (Minister for Social and Family Affairs) and Charlie McCreevy (Minister
for Finance) as reference texts, assuming that the former is more in favor of spending than
the latter.
Figure 8 shows the results of estimation grouped by the two parties.
[∗∗∗∗ FIGURE 8 ABOUT HERE ∗∗∗∗]
As expected, we find that the two PD members, Mary Harney and Michael McDowell,
are at the right side of the dimension. We estimate the most left-wing members to be Eamon
O Cuıv (Minister for Community, Rural and Gaeltacht Affairs), Noel Dempsey (Minister
for Education and Science) and Micheal Martin (Minister for Health and Children). The
most right-wing members are John O’Donoghue (Minister for Arts, Sport and Tourism)
and Charlie McCreevy (whose contributions we used as right-wing reference text), Michael
Smith (Minister for Defence).
How valid are these estimated positions? In order to have substantive meaning, our
estimates should be able to predict political decisions on the same policy dimension. We
therefore use ministers’ estimated positions to predict their departmental spending level (see
Giannetti and Laver, 2005, for a similar analysis with data from Italy). Our dependent
variable is each department’s spending as share of the total budget in 2004. Our indepen-
dent variable is the vector of estimated policy positions. We conjecture that more left-wing
ministers should have higher spending levels than right-wing ministers, which we test by
17

estimating
ˆspending = β0 + β1policy position (1)
via ordinary least-square regression.
Figures 9 and 10 show the two variables plotted against each other together with the
estimated regression line from equation 1. In Figure 9 we include all cabinet members. In
Figure 10 we exclude non-spending departments with small budgets, such as the office of
the Taoiseach or the Department of Foreign Affairs.10
[∗∗∗∗ FIGURE 9 ABOUT HERE ∗∗∗∗]
[∗∗∗∗ FIGURE 10 ABOUT HERE ∗∗∗∗]
Figure 9 reveals that there is a negative, albeit weak relationship between estimated
positions and spending, with more left-wing cabinet members having higher spending levels
than right-wing members. The correlation between the two variables is -0.53 (p = 0.0523)
but which is not significant at the 0.05 level. However, if we only take members from high-
spending departments into account (Figure 10) we find an almost perfect linear relationship
between the two variables with a correlation coefficient of -0.95 (p = 0.0002). This result
demonstrates that our estimated positions are indeed meaningful and can be used to predict
behavior on political decisions on the same dimension.11
10The eight high-spending departments we include are, in decreasing order of budget share, the Departmentof Health and Children, Department of Education and Science, Department of Social and Family Affairs,Department of the Environment and Local Government, Department of Transport, Department of Enterprise,Trade and Employment, Department of Defence, and the Department of Arts, Sport and Tourism. These eightdepartments together account for more than 95 per cent of the total budget in 2004.
11These results also open up an intriguing question about the endogeneity of observable policy preferencesof ministers. Do higher spending portfolios receive more left-leaning ministers or do ministers adapt theirpolicy preferences after appointment and literally grow into the job? This and related questions are outside thescope of this paper and will be pursued by authors in future research.
18

4 Conclusion
Policy preferences of individual politicians (ministers or TDs in general), are inherently un-
observable. However, we have abundant data on speeches made by political actors. The
latest developments in automated text analysis techniques allow us to estimate policy posi-
tions of individual actors from these speeches.
In relation to Irish political actors such estimation has been hindered by the structure of
the available data. While all speeches made in Dail Eireann are dutifully recorded, the archi-
tecture of the data set, where digitised versions of speeches are stored, makes it impossible
to apply any of the existing text analysis software. Speeches are currently stored by the Dail
Eireann in more than half a million separate HTML files with entries that are not related to
each other.
In this paper we present a new database of speeches that was created with the purpose
of allowing the estimation of policy preferences of individual politicians. For that reason
we created a relational database where speeches are related to the members database and
structured in terms of dates, topics of debates, and names of speakers, their constituency and
party affiliation. This gives the necessary flexibility to use available text scaling methods in
order to estimate policy positions of actors.
We also present several examples for which this data can be used. We show how to es-
timate policy positions of all Irish Ministers for Finance, and highlight how this can lead to
interesting research question in estimating the determinants of their positions. We show that
for some ministers the position can be explained by the economic performance of Ireland,
while preferences of other ministers seem to be idiosyncratic. In another example we esti-
mate positions of individual TDs in a budget debate, followed by the estimation of policy
19

positions of cabinet members of the 26th Government.
With the introduction of our database, we aim to make text analysis an easy and ac-
cessible tool for social scientist doing empirical research on policy-making in Ireland that
requires estimation of policy preferences of political actors.
20

ReferencesBaayen, R.H. 2001. Word frequency distributions. Vol. 18 of Text, Speech and Language
Technology Springer.
Benoit, K. and M. Laver. 2003. “Estimating Irish party positions using computer wordscor-ing: The 2002 elections.” Irish Political Studies 17(2):97–107.
Bybee, J.L. 2001. Phonology and language Use. Cambridge University Press Cambridge.
Charbonneau, Etienne. 2009. Talking Like a Tax Collector or a Social Guardian? The Useof Administrative Discourse by US State Lottery Agencies. In Do They Walk Like TheyTalk?: Speech and Action in Policy Processes, ed. Louis Imbeau. Springer pp. 223–241.
Christen, Peter. 2006. A Comparison of Personal Name Matching: Techniques and PracticalIssues. Joint computer science technical report series Department of Computer Science,The Australian National University.
Clinton, J. D., S. Jackman and D. Rivers. 2004. “The Statistical Analysis of Roll Call Voting:A Unified Approach.” American Political Science Review 98(2):355–370.
Condon, Stephanie. 2009. “Word Cloud Of Obama And Cheney Speeches.” CBS News, May21 .
Day, Kate. 2009. “Barack Obama’s inauguration speech as a tag cloud.” Telegraph, January20 .
Galli, Emma, Veronica Grembi and Fabio Padovano. 2009. Whould You Trust an ItalianPolitician? Evidence from Italian Regional Politics. In Do They Walk Like They Talk?:Speech and Action in Policy Processes, ed. Louis Imbeau. Springer pp. 109–131.
Gavin, Patrick. 2009. “Word Cloud: Obama’s Speech.” Politico.com, September 9 .
Giannetti, Daniela and Michael Laver. 2005. “Policy positions and jobs in the government.”European Journal of Political Research 44(1):91–120.
Grimmer, Justin. 2010. “A Bayesian Hierarchical Topic Model for Political Texts: Measur-ing Expressed Agendas in Senate Press Releases.” Political Analysis 18(1):1–35.
Hopkins, Daniel and Gary King. 2010. “A Method of Automated Nonparametric ContentAnalysis for Social Science.” American Journal of Political Science 54(1):229–247.
Imbeau, Louis. 2009. Dissonance in Fiscal Policy: A Power Approach. In Do They WalkLike They Talk?: Speech and Action in Policy Processes, ed. Louis Imbeau. Springerpp. 167–185.
Kluver, H. 2009. “Measuring interest group influence using quantitative text analysis.” Eu-ropean Union Politics 10(4):535–549.
Laver, M., K. Benoit and J. Garry. 2003. “Extracting policy positions from political textsusing words as data.” American Political Science Review 97(2):311–331.
21

Laver, Michael and Kenneth Benoit. 2002. “Locating TDs in policy spaces: WordscoringDail speeches.” Irish Political Studies 17(1):59–73.
Lowe, W. 2008. “Understanding Wordscores.” Political Analysis 16(4):356–371.
Monroe, Burt L., Michael P. Colaresi and Kevin M. Quinn. 2008. “Fightin’ words: Lexicalfeature selection and evaluation for identifying the content of political conflict.” PoliticalAnalysis 16(4):372–403.
Proksch, Sven-Oliver and Jonathan B. Slapin. 2009a. “How to avoid pitfalls in statisticalanalysis of political texts: The case of Germany.” German Politics 18(3):323–344.
Proksch, Sven-Oliver and Jonathan B. Slapin. 2009b. “Position taking in European Parlia-ment speeches.” British Journal of Political Science forthcoming.
Quinn, K. M., B. L. Monroe, M. Colaresi, M. Crespin and D. R. Radev. 2010. “How toAnalyze Political Attention with Minimal Assumptions and Costs.” American Journal ofPolitical Science 54(1):209–228.
Slapin, J. B. and S.-O. Proksch. 2008. “A scaling model for estimating time-series partypositions from texts.” American Journal of Political Science 52(3):705–722.
Williams, Marc. 2008. “Analysing Cameron’s 400,000 words.” BBC Political Research Unit,October 1 .
Yao, Laura. 2008. “We’ve Looked at Clouds From Both Sides Now.” The Washington Post,August 3 .
Yu, Bei, Stefan Kaufmann and Daniel Diermeier. 2008. “Classifying party affiliation frompolitical speech.” Journal of Information Technology & Politics 5(1):33–48.
22

according account actual adjustment administration amount amounted anticipated army arrangement arrangements attack balance basis beginning borrowing
britain british business capital central circulated circumstances close collected comment compensation conditions connection considerable
consideration council country course credit customs day debt depend deputies desire destruction details doubt due duty dáil economiceconomies effected eireann estimate estimated estimates exchequer excise
expenditure extent failed figure figures financial found free fund
government hand hoped increase issues items main march matters military namely past pay payment people periodpreferential propose public rates receipts regarded result revenuesaorstát services shown
statement subject supply system tax taxes time total
Cosgrave (1923)abnormal act additional advances agricultural amount army basis beer britain british budget burden capital change charges commission committee compensation conditions
consumption cost country course customs debt due duties duty dáil economic effect estate estimate estimated estimates exchequer existing
expenditure extent figure finance financial fund government hand income increase increased industry items
land loan loans local loss matter means money months national net normal obtained paid past people period position profits property propose proposed provision public raterates reduced reduction regard relief required respect result revenue road saorstát savings services substantial sugar sum
tax taxation time total various view vote yield
Blythe (1924−1931)
accordingly account act acts additional advances allowance amount amounted annuities
assets authorities balance bounties brought budget capital certificates circumstances connection costcountry course credit current customs debt due duties duty dáil effect employment
estimate estimates exchequer existing expenditure external
figure figures finance financial fund government house housing income
increase increased industrial industry items land liabilities loan loans localmarch matter minister national net paid pensions people position propose provide
provided provision public purposes question rate reduce reduction refer regard relief required
respect revenuesavings schemes services set sugar sum
supply surplus tax taxation time tobacco total unemployment value view yield
MacEntee (1932−1939)additional agricultural allowances amount authorities available bill budget capital circumstances civil coming
community companies company compared conditions considerable corporation cost countrycourse current customs day deputies development due duties duty economic effect emergencyemployment estimate estimated estimates excess exchequer excise existing expected
expenditure extent figure figures finance financial fund government heavy
hope imports income increase increased local march matter minister months
national net past people period position post price prices production profits propose
provision public rate rates regard respect result revenuesavings schemes
service services social standard supplies supply tax taxation time tobacco
total trade unemployment value various war yield
O'Kelly (1939−1945)
add additional agricultural amount assets authorities available balance banks basis bill borrow buy
capital charges corporation cost course current debt development duties dutyeconomic economy effect employment enable estimated estimates excess exchequer existing expenditure farmers
figure figures finance financial foreign fuel fund future home hope house houses housing incomeincrease increased industrial items land living loans local materials meet money nationalnet output pay people period price prices production profits propose provide provision
public raise rate rates reasonable reduction relief respect revenue savings scheme schemes servicesstandard supply surplus tax time tobacco total trade transition turf value volume war wish
Aiken (1946−1947)act additional advances agricultural aid allowance amount assets authorities availablebalance bank bill budget capital central charges compared consumption cost country
credit current debt deficit development dollar domestic duties dutyeconomic effect estimate estimated estimates exchequer expected
expenditure exports extent external finance financial fundgovernment grants housing imports improvement including incomeincrease increased increases investment ireland irish issues
level loan local march meet national net outlay output payments prices private
production profits programme propose provided provision public purposes rate rates receipts
relief resources respect result revenue savings services social sterling supply taxtaxation time total trade united value volume yield
McGilligan (1948−1951)
accordingly account act actual additional agricultural agriculture amount available balance budgetcapital consumption cost country course current deficit development due duties duty
economic economy effect employment estimate estimates exchequer expenditure export exports external figure
figures finance financial fund funds government home imports improvement incomeincrease increased increases industrial industries industry investment irish issue level living loan means meet
money national net outlay output past pay payments people position price prices production programme propose
provide provided provision public rate receipts recent reduced reduction relief resources revenue rise saving
savings services social sterling substantial sum tax taxation time total trade volume war
MacEntee (1952−1954)account act additional advances agricultural allowance authorities available balance banks borrowing budget
capital cattle change circumstances cost current decline deficit developmentduties duty earnings economic economy effect employment essential estimate estimated
estimates exchequer existing expenditure exports external figure figures
finance financed financial fund future government hope housing import imports improved improvement
income increase increased increases industrial investment irish issues
level living loan local measures meet national net output payments price prices production progress
propose provide provision public raise rate rates recent relief resources result revenue riseroad saving savings services stocks tax taxation time total towards trade volume world yield
Sweetman (1955−1956)
Figure 1: Word clouds of all Finance Ministers’ budget speeches, 1922–2008
23

account additional agricultural agriculture allowance amount assistance available balance bill budget capital civil committee
community conditions cost countries country course current deficit development direct duties duty economiceconomy effect employment estimated exchequer existing expansion expected expenditure export exports external
farmers finance financial form fund government growth income incomes increaseincreased increases industrial industry investment irish level local national net output paper pay payments
pensions period position price prices production productive profits programme propose provide provided provision publicpurposes rate rates recent reduction relief reliefs revenue rise savings service services social special substantial
tax taxation time tobacco total trade various white
J.Ryan (1957−1964)account act additional agricultural allowance amount assistance available balance bank banks benefit benefits bill borrowing british
budget capital central change civil community companies consideration continue corporation cost countries course credit
currency current deficit department development duties duty economic economy effect employment expected
expenditure exports external finance financial government growth hope
income incomes increase increased increases industrial ireland irish level means
money national operation pay payments position price prices production profits programme propose
provide provided provision public rate rates recent relief report resources result revenue review rise savings service
services social special substantial system tax taxation time total trade united welfare
Lynch (1965−1966)
account additional age agricultural agriculture allowance allowances assistance available balance
benefit budget capital children community cost countries course current decided deficit
development economic economy education effect employment estimated
exchequer existing expansion expenditure exports farmers finance financial free
future government grant growth health hope income incomes
increase increased increases industrial industry international
introduced investment irish land level main measures milk national output pay payments pensions
people period policy position price prices production programme progress propose provide
provided provision public rate rates recent relief report resources revenue rise savings schemeservice services social special substantial system tax taxation time total trade
welfare
Haughey (1967−1969)additional age agricultural agriculture aid allowance allowances amount assistance authorities available balancebenefits budget capital changes children community continue cost costs countries course current
decade deficit development economic economy education effect
employment estimated exchequer existing expansion expenditure exports free
government grants growing growth health improvement incomeincomes increase increased increases increasing
industrial industry inflation international investment irish level living local national operation paid
past pay payments pensioners persons policy prices programme provide provided provision
public rate rates relief report revenue rise scheme service servicessocial special substantial system tax taxation ten time total trade training value various view week
welfare
Lynch (for the Minister for Finance) (1970)
account additional age agreement agricultural agriculture allowance allowances assistance available balance
budget budgetary capital children circumstances community companies company continue contributory
cost costs country course credit current decided deficit dependent development duty
economic economy eec effect employment estimated exchequer existing expected
expenditure farmers financial free government growth health
improvement improvements income incomes increase increasedincreases industrial industry inflation inflationary investment level measures national october
past pay payable payments pensioners pensions period persons policy position price prices profits
programme propose provide provided public rate rates recent relief revenue rise
scheme schemes service services social special substantial system tax taxation time
total
Colley (1971−1972)account additional agreement agricultural allowance allowances amount april available basis benefits bill borrowing budget capital changes charges children
community continue cost costs course current decided deficit development duty economic economy eec effect employment ensure
estimated exchequer existing expenditure extra farmers finance financial future government growth health
improvements income incomes increase increased increases industry inflation investment irish level local major
means measures months national pay payments period personal policy price prices profits programme propose proposed provide provided provision provisions
public rate rates recent relief respect revenue rise scheme sector service services social special substantial system
tax taxation time total value welfare
R.Ryan (1973−1977)
account additional allowance allowances announced assistance available basis benefit borrowing budget building capitalchanges children community construction continue contribution cost course creation current decided deficit development direct domestic
economic economy effect employment ensure estimate estimated estimates european exchequer
expenditure extra farmers finance government growth improvement
income incomes increase increased increases industrial industry inflation investment irish
job jobs level measures national paper particular pay payments people policies policy posts price private programme propose provided
provision public rate rates reduction relief requirement respect result revenue scheme schemes sector service
services social special system target tax taxation time total unemployment week welfare white
Colley (1978−1979)additional allowance allowances amount announced apply average balance basis benefit borrowing budget burden capital changes children circumstances community cost costs couples course current decided
deficit development duty economic economy eec effect employed employment ensure equity estimated exchequer excise expenditure farm farmers finance government growth
income incomes increase increased increases industrial introduced investment level liability major married measures national oil paid particularly past pay paye
payment payments pensions people persons policy price proposals propose proposed provide provision public rate rates reduce relief result revenue scheme service services single
social special substantial system tax taxation taxpayer taxpayers time towards weekly welfare yield
O'Kennedy (1980)
Figure 1: Word clouds of all budget speeches made by Ministers for Finance, 1922–2008(cont’d).
24

additional agricultural agriculture allowance allowances amount announced apply april available average balance basis benefit borrowing budgetcapital commission community continue cost course current date decided deficit development difficulties disabled due economiceconomy eec effect employment estimated exchequer expected expenditure external farm farmers finance
financial government growth improvements income incomes
increase increased increases industrial industry international investment irish level major married
measures national particularly pay paye payment payments period persons plan policy price private propose provide
provision public rate rates recent relief respect result revenue scheme sector services single socialspecial support system tax taxation term time understanding unemployment week welfare
Fitzgerald (1981)additional allowance arrangements balance basis benefit benefits bill borrowing budget capital change changes charges child circumstances community cost credit
current debt decided deficit development duty economic economy effect employment ensure estimated estimates exchequer excise existing expected
expenditure extra farmers finance finances financial foreign future government growth immediate improvements
income increase increased increases investment irish level major measures minister money motor national pay payments people policy
position price private programme proposals propose proposed provide provided provision public rate rates reduce reform relief respect revenue road scheme
sector services situation social special spending substantial system tax taxation time total vat welfare yield
Bruton (1981−1982)
achieve additional agency allocation allocations allowance allowances announced apply approach authorities authority available balance basis benefit borrowing bring
budget building capital change changes charge children community continue corporation cost current date decided
deficit details development dublin economic economy effect employment estimated exchequer expenditure extra finance financial gains
government house imports improvements income increase increased increases investment january levy
local married measures national office payment payments period persons prices programme progress proposals propose proposed provide providedproviding provision public rate rates relief requirement result revenue scheme services set single social special substantial taxtaxation term total unemployment urban vat welfare yield
MacSharry (1982)account additional allowance allowances amount announced apply april arrangements available basis benefit benefits bill borrowing budget burden capital change changes continue
cost course current decided deficit development due duty economic economy effect employment estimated estimates exchequer excise exemption existing expenditure finance
financial gnp government growth income increase increased increases introduced irish level major measures national net outturn
overall pay payment payments period persons plan policy programme propose provide provided provision public published rate rates recent reduce reduced reduction relief
requirement revenue scheme service services set social special substantial system tax taxation taxpayers term time total unemployment vat week
welfare yield
Dukes (1983−1986)
additional allowances announced apply arrangements assessment available basis benefit borrowing budget capital changes collection commitment community continue contribution
corporation cost course current debt decided development duty economic economy effect employed employment essential estimates exchequer existing
expected expenditure farmers features finance finances financial gnp government growth health improvement
income increase increased increases insurance investment level major measures national pay payments persons policy previous
programme proposed provide provision public published rate rates recent recovery reduce reduced reduction reductions relief requirement result
revenue review scheme schemes sector self service services significant social spending substantial system tax taxation taxpayers term time
total week welfare
MacSharry (1987−1988)additional allowance announced apply assessment available basis benefit borrowing budget capital changes child children community continue contribution
cost costs couple current debt decided details development duty economic economy effect employment estimated estimates exchequer exemption expenditurefinancial fund funds gnp government growth health help improvements income increase increased increases investment irish
level low major married measures minister national overall particular pay payments people policy position programme progress provision
public published rate rates recovery reduce reduction relief resources respect result revenue scheme self service services set significant single socialspecial standard system tax taxation taxpayers term time total towards vat week welfare
Reynolds (1989−1991)
account additional announced apply arrangements available basis benefit bill borrowing budget budgetary business capital change changes community companies cost costs
current debt decided details development duty economic economy effect employment ensure estimated european exchequer excise exemption existing expenditure
finance fund funds government growth income increase increased increases investment ireland irish jobs level market measure measures
national overall particular pay payments policy position programme progress propose provide provided providing provision public rate rates recent reform
relief resources respect revenue scheme schemes sector service services set significant single social special standard substantial system tax taxation taxpayers
term time total unemployment vat welfare
Ahern (1992−1994)addition additional agreement allowance announced annual annum arrangements average basis benefit budget budgetary business capital
changes child children community companies competitiveness continue cost current decided details economic economy effect employmentensure enterprise european existing expenditure family features finance future gains gdp government growth improvements including
income increase increased increases inflation introduced investment ireland irish level local low management measures minister
partnership pay payment payments people policy position principal process programme progress propose provide providing prsi public rate rates real
relief scheme service services set single social society special spending standard system tax term third time unemployed
unemployment union week welfare
Quinn (1995−1997)
Figure 1: Word clouds of all budget speeches made by Ministers for Finance, 1922–2008(cont’d).
25

account additional age allowance allowances announced annum apply april benefit bill billion budget capital care changes child children cost current decided details
development economic economy effect employment ensure exchequer expenditure family finance fund funding future government growth health inclusion incomeincrease increased increases increasing inflation investment ireland level low major married measures national net paid pay payment pension people period personal persons policy
programme progress propose provide provided providing provision public rate rates reduce relief resources revenue scheme service services set significant single social special
spending standard substantial summary surplus system tax taxation taxpayers term time total vat week welfare
McCreevy (1998−2004)additional age announced announcing annual average benefit billion bring budget business capital care changes child childcare children commitment
continue cost country credit current details development disability duty economic economy education energy environment expenditure extra finance fund funding
future government growth health help home house improvements income increase increased increases
increasing infrastructure investment ireland level major measures minister national pay payments pension people persons plan policy programme
progress provide provided providing provision public quality rate rates recent relief reliefs resources scheme sector service services set significant single
social society spending strategy success summary support system tax time total value week welfare
Cowen (2005−2008)
action additional agency assets available banking banks basis benefit billion bring budget capital change changes circumstances
commission confidence continue cost costs country credit current decided details development economic economyeducation employment energy ensure enterprise expenditure finances financial fiscal forward future global
government growth health house income increase increased increases
investment ireland jobs level levy local means measures minister pay payments pension people plan prices private
programme property protect provide public rate rates recent reduce reduction reductions relief resources revenue review savings
scheme sector service services set significant social spending stability staff summary support system taxtaxation time value week welfare
Lenihan (2009−NA)
Figure 1: Word clouds of all budget speeches made by Ministers for Finance, 1922–2008(cont’d).
26

Estimated position
−1.5 −1.0 −0.5 0.0 0.5 1.0 1.5
192319251927192919311933193519371939194119431945194719491951195319551957195919611963196519671969197119731975197719791981198219831985198719891991199319951997199920012003200520082009
CosgraveBlythe
BlytheBlythe
BlytheBlytheBlythe
BlytheBlythe
MacEnteeMacEnteeMacEntee
MacEnteeMacEntee
MacEnteeMacEntee
OCeallaighOCeallaigh
OCeallaighOCeallaigh
OCeallaighOCeallaigh
OCeallaighAiken
AikenMcGilligan
McGilliganMcGilligan
McGilliganMacEntee
MacEnteeMacEntee
SweetmanSweetman
RyanRyan
RyanRyan
RyanRyan
RyanRyan
LynchLynch
HaugheyHaughey
HaugheyLynch
ColleyColley
RyanRyan
RyanRyan
RyanColley
ColleyO'Kennedy
FitzgeraldBruton
BrutonMacSharry
DukesDukes
DukesDukes
MacSharryMacSharry
ReynoldsReynolds
ReynoldsAhern
AhernAhern
QuinnQuinn
QuinnMcCreevyMcCreevyMcCreevy
McCreevyMcCreevy
McCreevyMcCreevy
CowenCowen
CowenLenihan
Lenihan
Figure 2: Finance ministers’ policy positions as estimated from all budget speeches (1922–2009) with an overlaid linear regression line.
27

Inflation
1920 1930 1940 1950 1960 1970 1980 1990 2000 2010
−5
05
1015
20Per Capita GDP Growth (annual %)
1960 1970 1980 1990 2000 2008
−4
−2
02
46
810
Unemployment Rate
1956 1970 1980 1990 2000 2008
46
810
1214
16
Figure 3: The Irish economy over time: Inflation (1923–2008), Per Capita GDP growth(annual %; 1961–2008) and unemployment rate (1956–2008).
28

−5 0 5 10 15 20
−1.
5−
1.0
−0.
50.
00.
51.
0
Inflation
Blythe BlytheBlytheBlytheBlythe
BlytheBlythe
Blythe
MacEntee MacEntee
MacEntee
MacEnteeMacEnteeMacEntee
MacEntee
OCeallaigh
OCeallaighOCeallaigh
OCeallaighOCeallaigh
OCeallaigh
OCeallaighAikenAiken
McGilligan
McGilliganMcGilliganMcGilligan
MacEntee
MacEnteeMacEntee
Sweetman
Sweetman
Ryan
RyanRyan
RyanRyan
RyanRyan
Ryan
Lynch
LynchHaugheyHaughey
HaugheyLynch
Colley
ColleyRyan
Ryan Ryan
Ryan
RyanColley
Colley
O'Kennedy
Fitzgerald
Bruton
Bruton
MacSharry
Dukes
DukesDukes
Dukes
MacSharry
MacSharryReynoldsReynolds
ReynoldsAhern
Ahern
AhernQuinnQuinnQuinnMcCreevy McCreevy
McCreevyMcCreevyMcCreevy
McCreevyMcCreevyCowen
CowenCowen
Lenihan
Figure 4: Estimated finance ministers’ positions against inflation (1923–2008) with an over-laid linear regression line.
29
0 5 10
−1.
5−
1.0
−0.
50.
00.
51.
01.
5
Per Capita GDP Growth
RyanRyan
Ryan
Lynch
Lynch
HaugheyHaughey
Haughey
LynchColley
Colley
RyanRyan
Ryan Ryan
Ryan
ColleyColley
O'Kennedy
Fitzgerald
Bruton
Bruton
MacSharry
Dukes
Dukes
DukesDukes
MacSharry
MacSharry
ReynoldsReynoldsReynolds
AhernAhern
Ahern
Quinn QuinnQuinnMcCreevyMcCreevyMcCreevy
McCreevyMcCreevyMcCreevy
McCreevyCowenCowenCowen
Figure 5: Estimated finance ministers’ positions against GDP growth (annual %; 1961–2008) with an overlaid linear regression line.
30

4 6 8 10 12 14 16
−1.
5−
1.0
−0.
50.
00.
51.
01.
5
Unemployment rate
Ryan
Ryan
RyanRyan
RyanRyan
RyanRyan
Lynch
Lynch
HaugheyHaughey
Haughey
LynchColley
Colley
RyanRyan
Ryan Ryan
Ryan
ColleyColley
O'Kennedy
Fitzgerald
Bruton
Bruton
MacSharry
Dukes
Dukes
DukesDukes
MacSharry
MacSharry
Reynolds ReynoldsReynolds
AhernAhern
Ahern
QuinnQuinnQuinnMcCreevyMcCreevyMcCreevy
McCreevyMcCreevyMcCreevy
McCreevyCowenCowenCowen
Figure 6: Estimated finance ministers’ positions against unemployment rate (1956–2008)with an overlaid linear regression line.
31

Estimated position on pro− versus anti−government dimension
−2 −1 0 1 2
SFSF
LABLAB
FGFGFGFGFGFGFGFG
Green
FFFFFFFFFFFFFFFFFF B. AhernD. Ahern
M. AhernArdagh
BrutonBurke
Carey
CowenDempsey
Devins
Gilmore
Gormley
HoganKenny
Morgan
Neville
OCaolain
ODonnell
OKeeffe
Reilly
Shortall
Varadkar
Figure 7: Estimated positions of all speakers in the 2008 budget debate. Estimated di-mension represents pro- versus anti-government positions. Scaling of x-axis is arbitrarily.Speeches of Bertie Ahern (FF, Taoiseach) and Enda Kenny (FG party leader) were usedas reference texts for being respectively pro- or anti-government. Observations are jitteredalong the y-axis to prevent names from overlapping.
32

Estimated position on pro versus contra government spending
−3 −2 −1 0 1
FFFFFFFFFFFFFFFFFFFFFFFF
PDPD
B. AhernCowen
McCreevy
D. Ahern
OCuiv
ODonoghue
CullenCoughlan
HarneyMcDowell
Smith
Martin
DempseyBrennan
Figure 8: Estimated positions for all cabinet members in the 26th government ( 29th Dail)using Wordscore. Positions are jittered along the y-axis. Estimation is based on each min-ister’s contribution in Dail Eireann before the cabinet reshuffle on 29 September 2004.Speeches by Mary Coughlan (Minister for Social and Family Affairs) and Charlie McCreevy(Minister for Finance) are used as left and right reference texts, respectively
33

−3 −2 −1 0 1
0.00
0.05
0.10
0.15
0.20
0.25
0.30
All cabinet members
Estimated policy position
Dep
artm
enta
l spe
ndin
g (s
hare
of t
otal
bud
get i
n 20
04)
AhernCowen McCreevy
AhernOCuivODonoghue
Cullen
Coughlan
Harney
McDowell
Smith
Martin
Dempsey
Brennan
Figure 9: Cabinet ministers’ policy position plotted departmental spending as share of totalgovernment budget in 2004.
34

−1.5 −1.0 −0.5 0.0 0.5 1.0
0.05
0.10
0.15
0.20
0.25
0.30
Cabinet members in high−spending government departments
Estimated policy position
Dep
artm
enta
l spe
ndin
g (s
hare
of t
otal
bud
get i
n 20
04)
Martin
Dempsey
Coughlan
Cullen
Brennan
Harney
SmithODonoghue
Figure 10: Cabinet ministers’ policy position plotted against departmental spending asshare of total government budget in 2004. Low-spending departments such as the officeof the Taoiseach or the Department of Foreign Affairs have been excluded. The remainingeight departments together account for more than 95 per cent of the total budget in 2004.
35

Table 1: Speakers in the 2008 budget debate.
Name Party Governmentparty
Length of speech innumber of words
Ahern, Bertie1 FF Yes 3,959Ahern, Dermot FF Yes 2,700Ahern, Michael FF Yes 1,190Ardagh, Sean FF Yes 1,015Carey, Pat FF Yes 942Cowen, Brian2 FF Yes 8,733Dempsey, Noel FF Yes 1,438Devins, Jimmy FF Yes 1,090O’Keeffe, Batt FF Yes 715
Gormley, John Green Yes 4,306
Bruton, Richard FG No 10,817Burke, Ulick FG No 714Hogan, Phil FG No 1,438Kenny, Enda3 FG No 3,924Neville, Dan FG No 1,210O’Donnell, Kieran FG No 1,182Reilly, James FG No 1,683Varadkar Leo FG No 1,876
Gilmore, Eamon Labour No 5,141Shortall, Roisin Labour No 2,662
Morgan, Arthur SF No 6,158O’Caolain, Caoimhghin SF No 1,438
Notes: 1–Taoiseach, 2–Minister for Finance, 3–FG Party Leader. The budget debatefor the 2008 budget was held in December 2007.
36

Table 2: Members of the 26th government (29th Dail), 6 June 2002–29 September 2004
Name Party Office
Bertie Ahern FF TaoiseachMary Harney PD Tanaiste and Minister for Enterprise, Trade and
EmploymentMichael Smith FF Minister for DefenceJoe Walsh FF Minister for Agriculture and FoodCharlie McCreevy FF Minister for FinanceBrian Cowen FF Minister for Foreign AffairsNoel Dempsey FF Minister for Education and ScienceDermot Ahern FF Minister for Communications, Marine and Natural
ResourcesJohn O’Donoghue FF Minister for Arts, Sport and TourismMicheal Martin FF Minister for Health and ChildrenSeamus Brennan FF Minister for TransportMichael McDowell PD Minister for Justice, Equality and Law ReformMartin Cullen FF Minster for the Environment and Local GovernmentEamon O Cuıv FF Minister for Community, Rural and Gaeltacht AffairsMary Coughlan FF Minister for Social and Family Affairs
Source: Houses of the Oireachtas (http://www.oireachtas.ie/viewdoc.asp?DocID=2935).
37

Table 3: Summary statistics for ministers’ contributions in the 26th government, 6 June 2002– 29 September 2004, sorted by total word count
Name Party Number ofcontributions
Total word count
Noel Dempsey FF 8,066 1,273,835Michael McDowell PD 6,290 1,038,527Bertie Ahern FF 6,505 790,964Dermot Ahern FF 3,047 755,471Charlie McCreevy FF 3,249 657,010Brian Cowen FF 2,444 652,062Martin Cullen FF 5,826 574,464Seamus Brennan FF 3,324 513,938Mary Coughlan FF 2,627 503,413Mary Harney PD 3,357 418,745Michael Smith FF 2,464 330,575Eamon O Cuıv FF 1,459 286,194John O’Donoghue FF 1,553 282,154Micheal Martin FF 789 141,721
Note: Only speeches before the cabinet reshuffle on 29 September 2004 are included.
38

Institute for International Integration StudiesThe Sutherland Centre, Trinity College Dublin, Dublin 2, Ireland