no slide title/media/files/eventdocuments/international/... · " revista portos e navios,...
TRANSCRIPT

1
November 2013
2
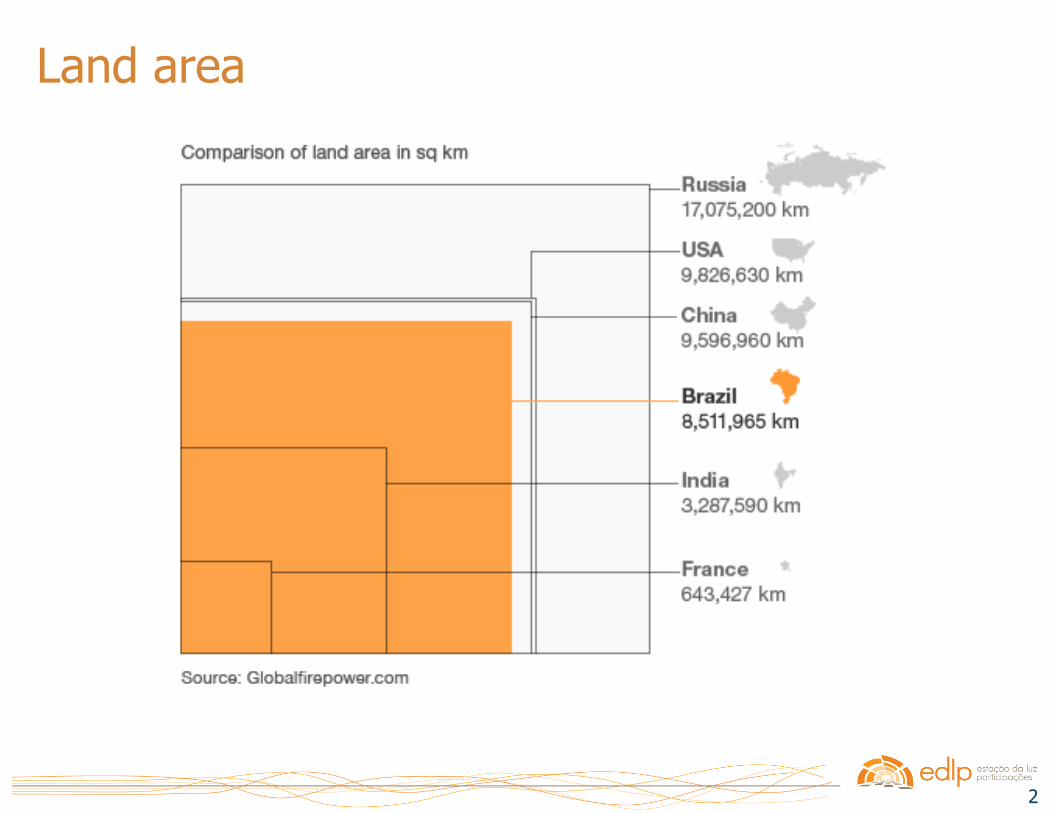
Land area

3
Brazil GDP

4
Scenario
5
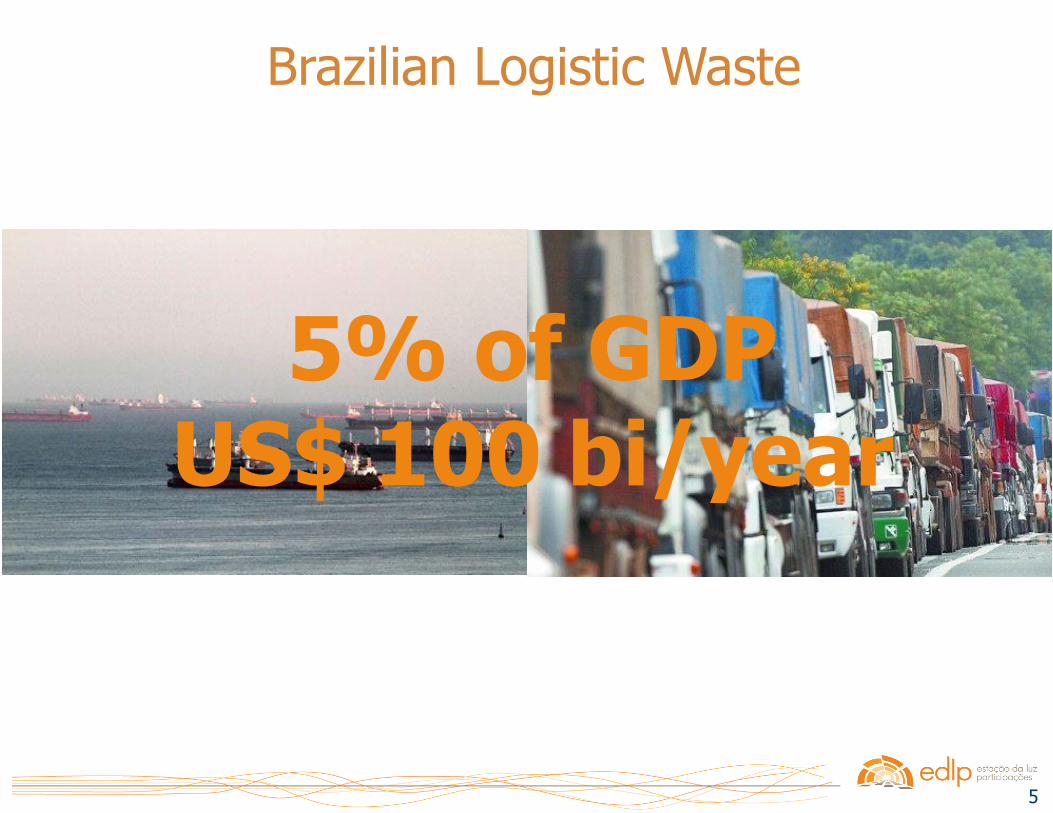
Brazilian Logistic Waste
5% of GDP US$ 100 bi/year

6
GDP vs. Infra quality

7
Brazilian Logistic Moment
Railroads Roads Waterways
25% 58% 17%
10% 71% 19%
43% 32% 25%
Logistic (%GDP) Transport Matrix
Without ore
Overhead Warehouse Stock Transport

8
Ports
9
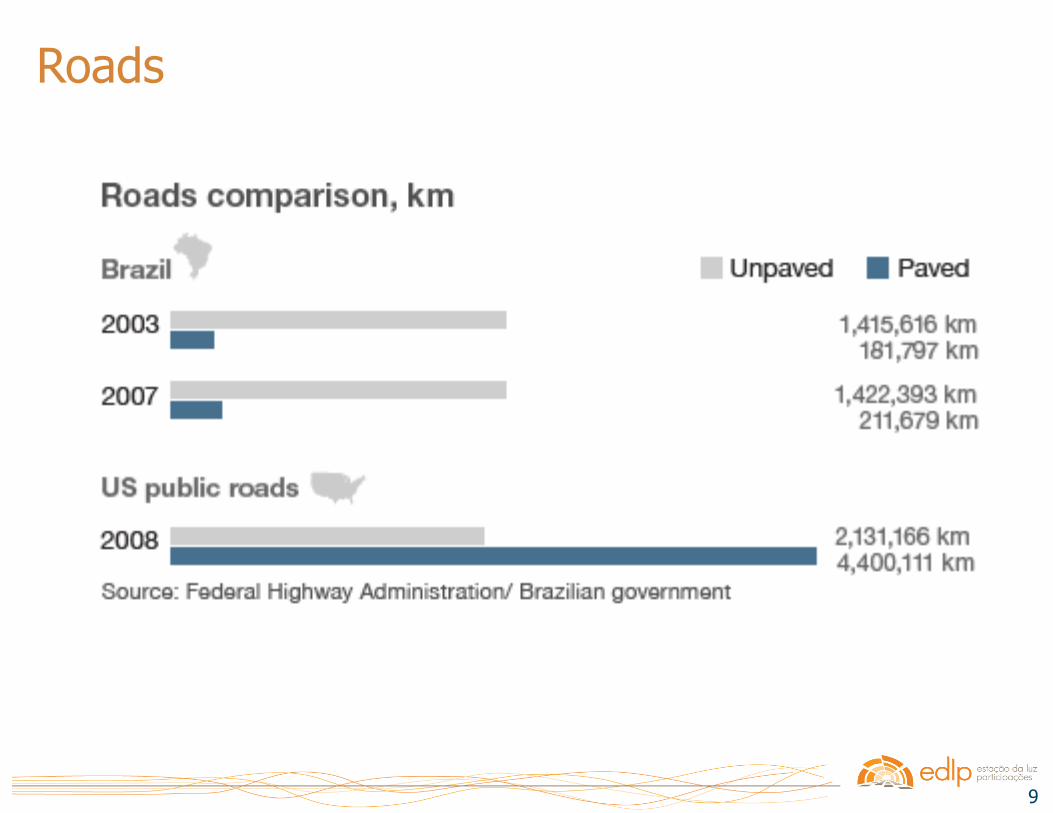
Roads
10
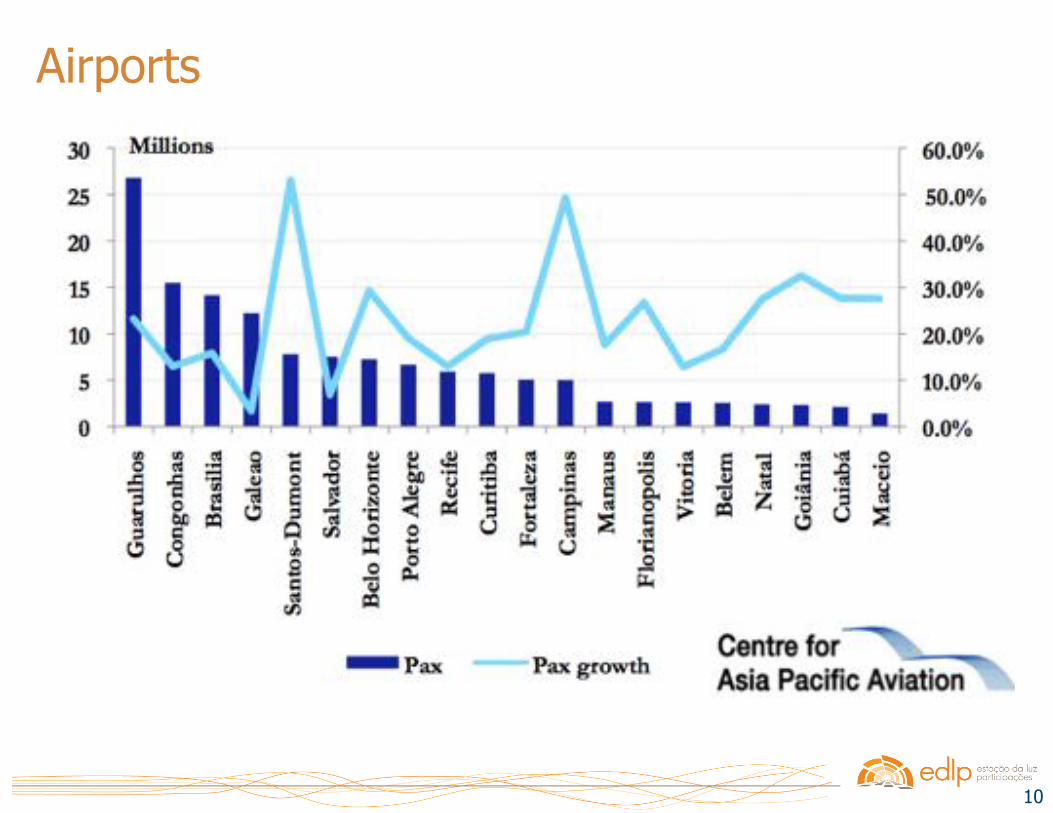
Airports
11
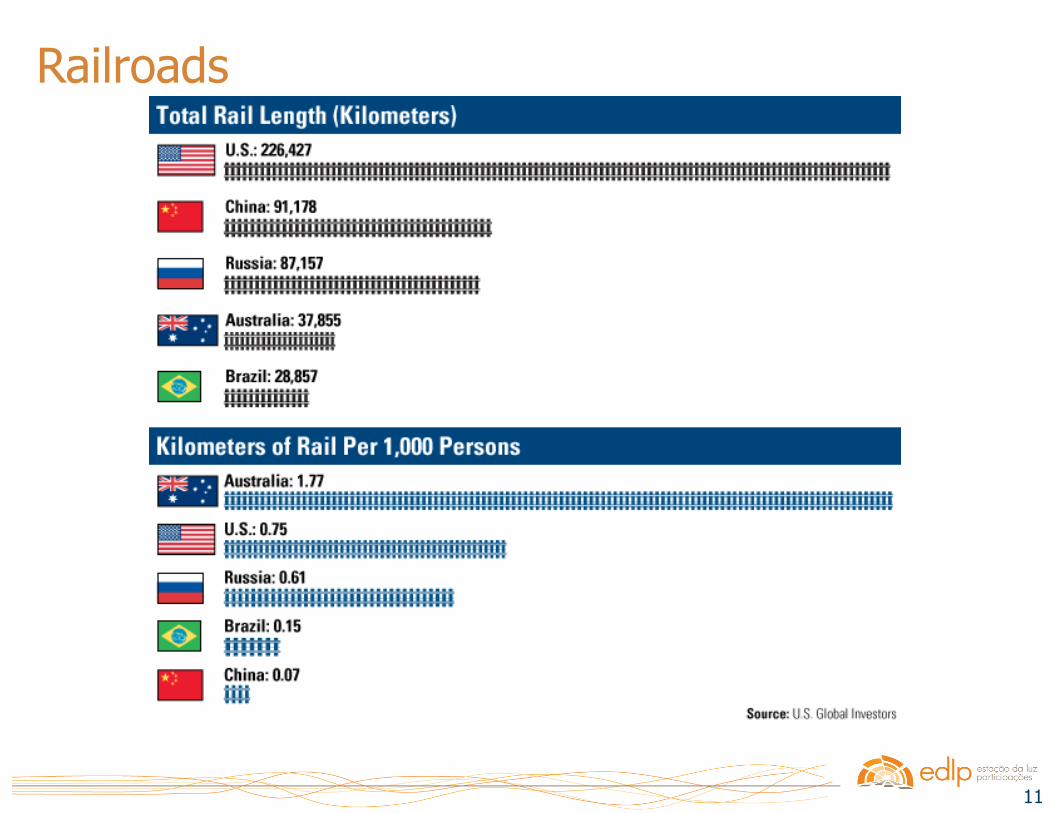
Railroads
12
EDLP is an entirely devoted company, specialized in developing transformational logistics projects. Our role is either as a consultant firm or as an investor and always includes several steps of a project, from planning up to execution. The goals are the continuous search for high operational performance, profit and sustainability.
Our focus:

13
Febrasa
Ferrovias Brasileiras S.A.
Trens Intercidades de São Paulo
EDLP – What we do in Logistics
14
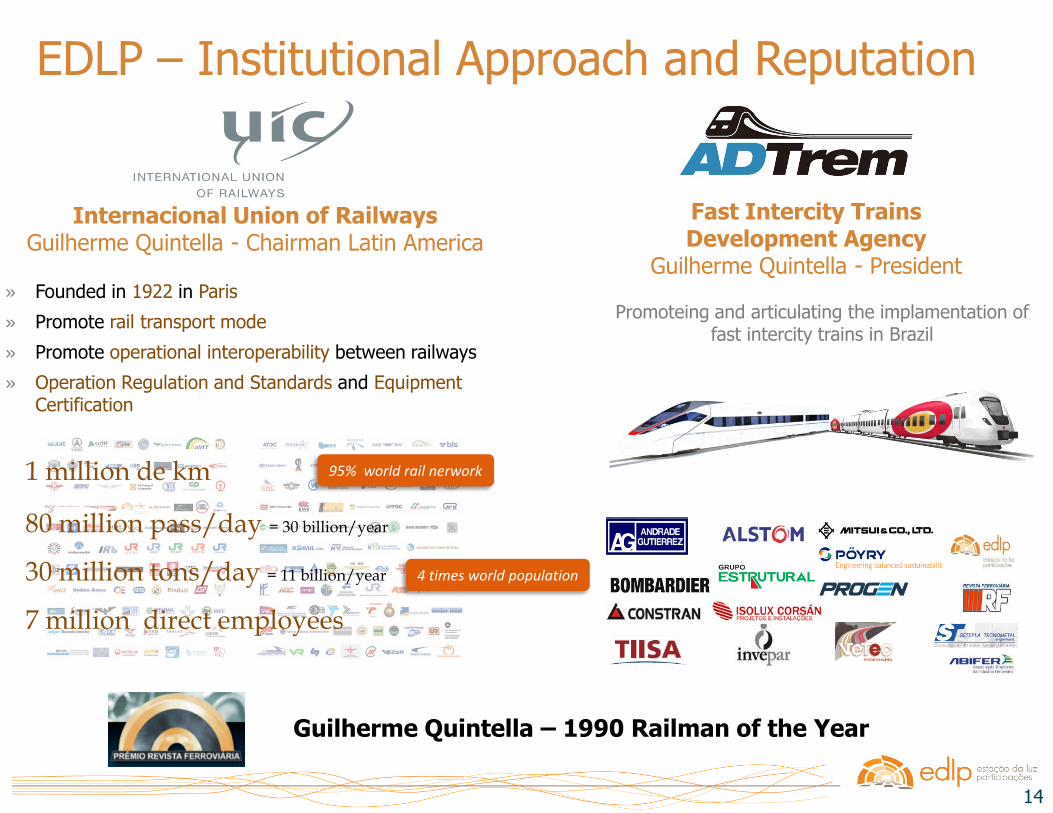
EDLP – Institutional Approach and Reputation
Internacional Union of Railways Guilherme Quintella - Chairman Latin America
Fast Intercity Trains Development Agency
Guilherme Quintella - President
Promoteing and articulating the implamentation of fast intercity trains in Brazil
» Founded in 1922 in Paris
» Promote rail transport mode
» Promote operational interoperability between railways
» Operation Regulation and Standards and Equipment Certification
Guilherme Quintella – 1990 Railman of the Year
1 million de km 95% world rail nerwork
80 million pass/day = 30 billion/year
4 times world population 30 million tons/day = 11 billion/year
7 million direct employees

15
EDLP – Structuring Logistic Businesses
• Rail Freight
• Rail Passenger
• Ports
• Waterways
• Intermodal

16
EDLP – What we do in Logistics
• Business Development
• Company start up
• Greenfield Projects
• Business Modeling
• Logistics Real Estate
• Merge & Acquisitions
• Public RFP
• Advisory

17
On going Projects

18
Trens
Intercidades
19
The Trens Intercidades (Intercity Trains) is a 450km passenger project, that EDLP presented to São Paulo State Govern trough a request for proposal (RFP). Besides its intrinsic importance the project post sound numbers across the board.
Trens Intercidades
20 20
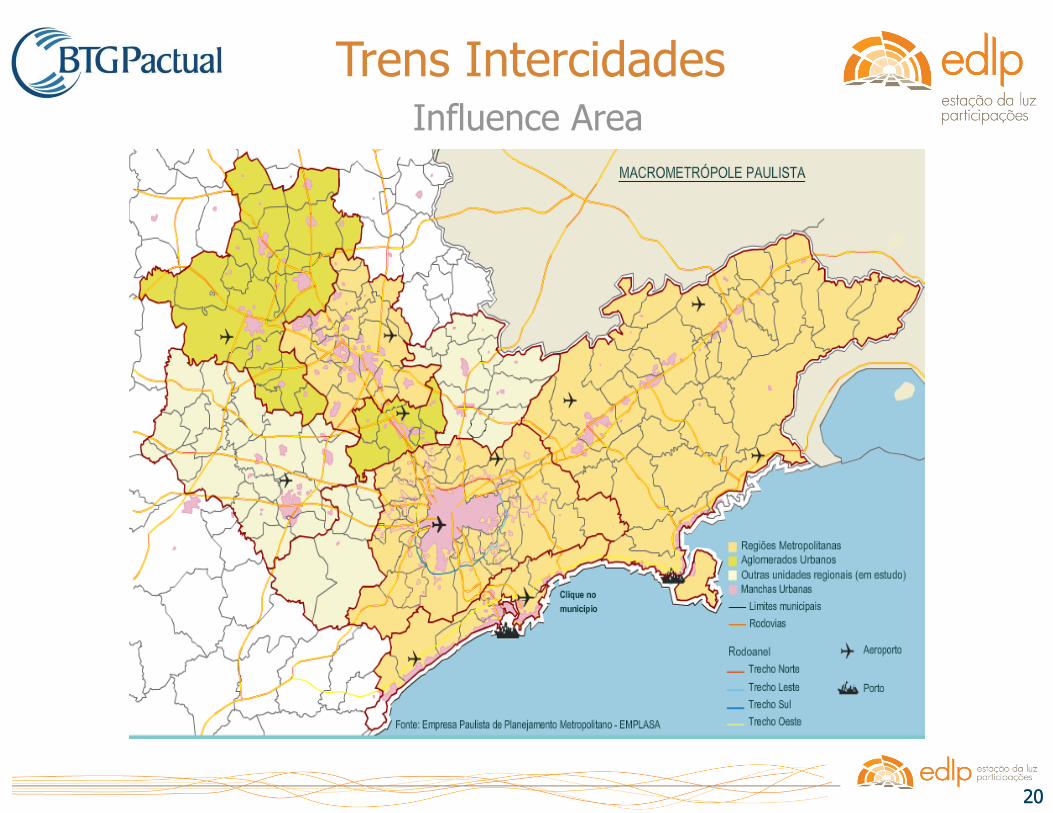
Trens Intercidades Influence Area
21 21
Influence Area
Trens Intercidades
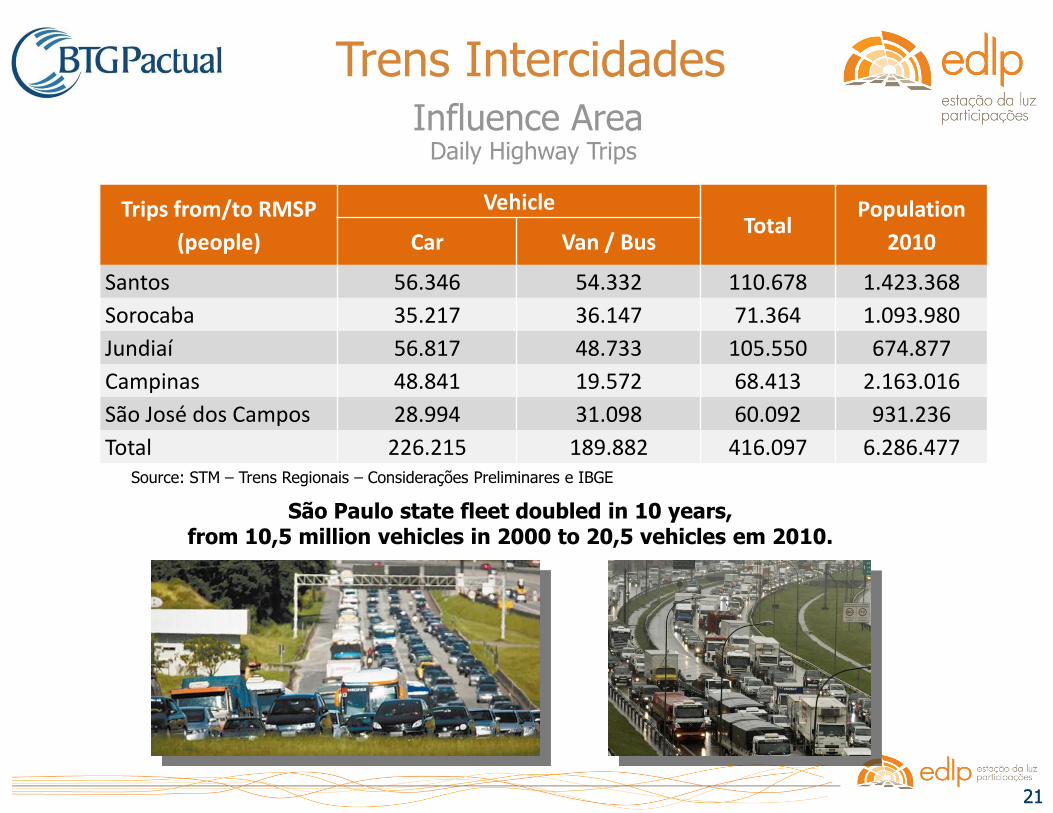
Daily Highway Trips
Trips from/to RMSP
(people)
Vehicle Total
Population
2010 Car Van / Bus
Santos 56.346 54.332 110.678 1.423.368
Sorocaba 35.217 36.147 71.364 1.093.980
Jundiaí 56.817 48.733 105.550 674.877
Campinas 48.841 19.572 68.413 2.163.016
São José dos Campos 28.994 31.098 60.092 931.236
Total 226.215 189.882 416.097 6.286.477
São Paulo state fleet doubled in 10 years, from 10,5 million vehicles in 2000 to 20,5 vehicles em 2010.
Source: STM – Trens Regionais – Considerações Preliminares e IBGE

22 22
Trens Intercidades
This will happen much earlier if economy grows faster.
At all cases, highways systems around São Paulo Metropolis will be saturated on the short term.
With moderate economy, growth transport demand will double in 20 years.
Influence Area

23
Americana
Santos
Pindamonhangaba
Sorocaba
Campinas
Jundiaí
São Caetano do Sul
Santo André
Cubatão
São Paulo
São José dos Campos
Jacareí
São Roque
Viracopos
Cumbica
Taubaté
23
Trens Intercidades Proposed System
Population (million) 26
Lines (km) 450
Passengers/day (thousand) 465
Average ticket (R$/Pass) 7,45
Investiments (R$ Billion) 18,50
State counterpart (R$ Billion) 5,70
24 24
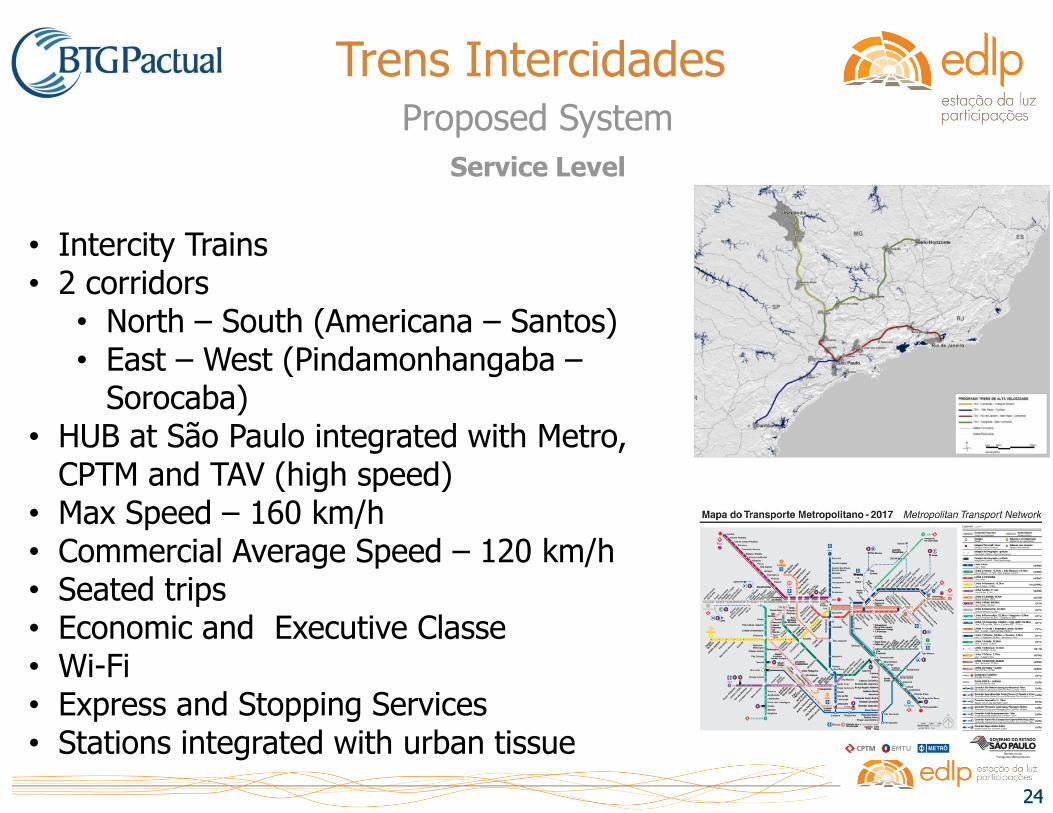
Service Level
Trens Intercidades
• Intercity Trains • 2 corridors
• North – South (Americana – Santos) • East – West (Pindamonhangaba –
Sorocaba) • HUB at São Paulo integrated with Metro,
CPTM and TAV (high speed) • Max Speed – 160 km/h • Commercial Average Speed – 120 km/h • Seated trips • Economic and Executive Classe • Wi-Fi • Express and Stopping Services • Stations integrated with urban tissue
Proposed System

25
26
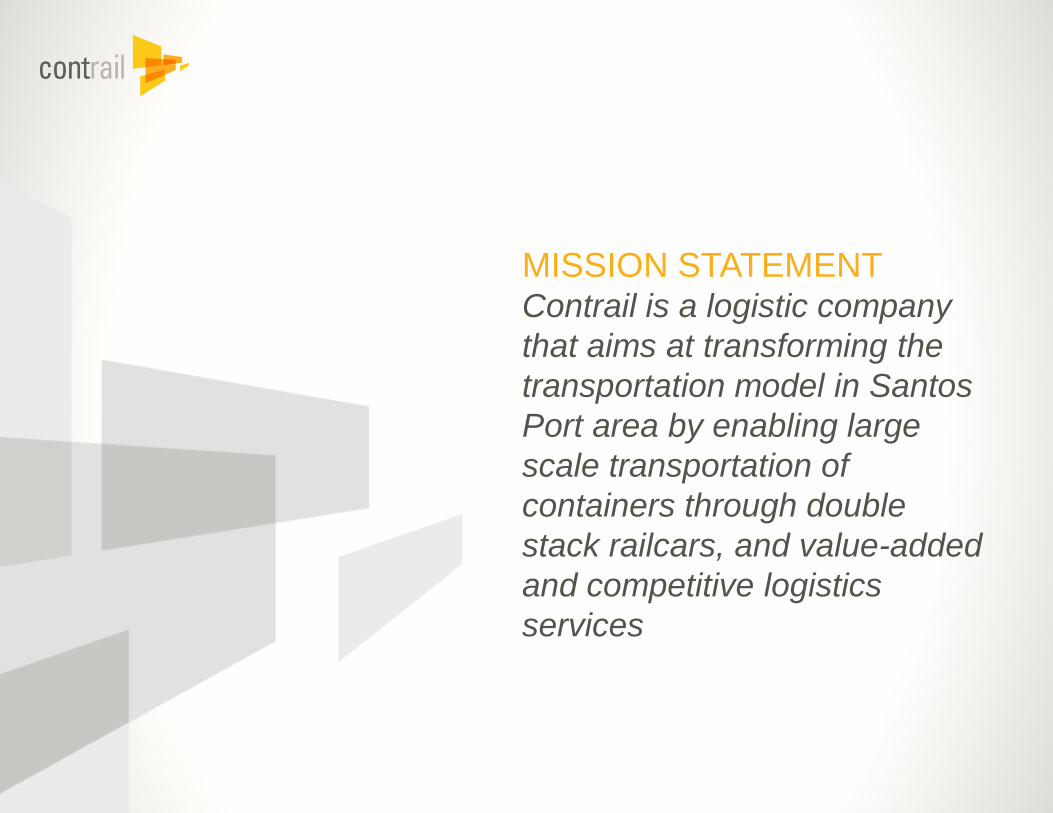
MISSION STATEMENT Contrail is a logistic company
that aims at transforming the
transportation model in Santos
Port area by enabling large
scale transportation of
containers through double
stack railcars, and value-added
and competitive logistics
services
27
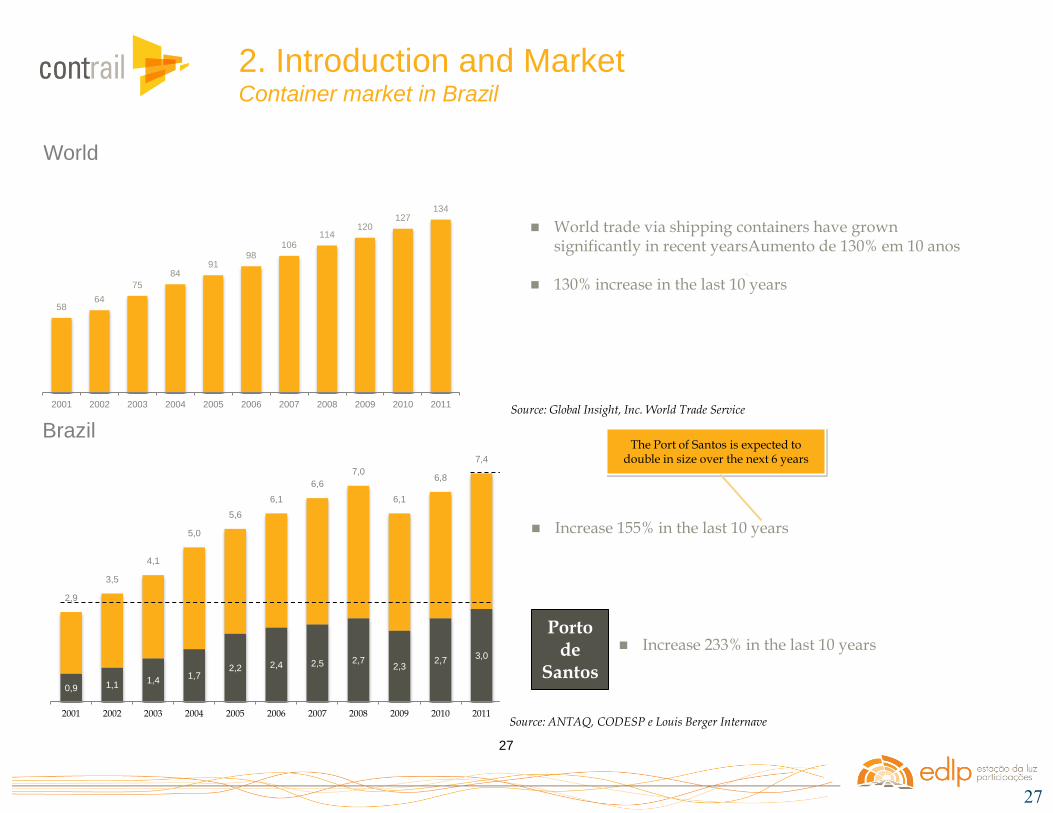
World trade via shipping containers have grown significantly in recent yearsAumento de 130% em 10 anos
130% increase in the last 10 years
58 64
75
84 91
98 106
114 120
127 134
2001 2002 2003 2004 2005 2006 2007 2008 2009 2010 2011
World
0,9 1,1 1,4
1,7 2,2 2,4 2,5 2,7
2,3 2,7
3,0 3,2 3,7
4,3 4,7
5,1 5,5
5,9 6,4
6,9 7,4
2,9
3,5
4,1
5,0
5,6
6,1
6,6
7,0
6,1
6,8
7,4
2001 2002 2003 2004 2005 2006 2007 2008 2009 2010 2011 2012 2013 2014 2015 2016 2017 2018 2019 2020 2021
Brazil
Porto de
Santos
Source: Global Insight, Inc. World Trade Service
Source: ANTAQ, CODESP e Louis Berger Internave
27
Increase 155% in the last 10 years
Increase 233% in the last 10 years
The Port of Santos is expected to double in size over the next 6 years
2. Introduction and Market Container market in Brazil

28
2011 2017 Container Market Share 5,5 MM TEU
2,9 MM TEU
2. Introduction and Market Port of Santos
Port of Santos - The main port in South America
- 100 million tones per year
- 31 million tones in conteiner – 2,9 Mililon Teus
- Represents 40% of the conteiners handled in Brazil
1,5
0,8
0,5
The actual container terminals
Starts operation in 2013
29
1.5%
27.7%
12.0%
20.0%19.0%
31.0%
20.0%
Union
Pacific
Burlington
Nothern
Norfolk
Southern
Canadian
NationalCSX
Canadian
PacificMRS
Average (3): 22 %
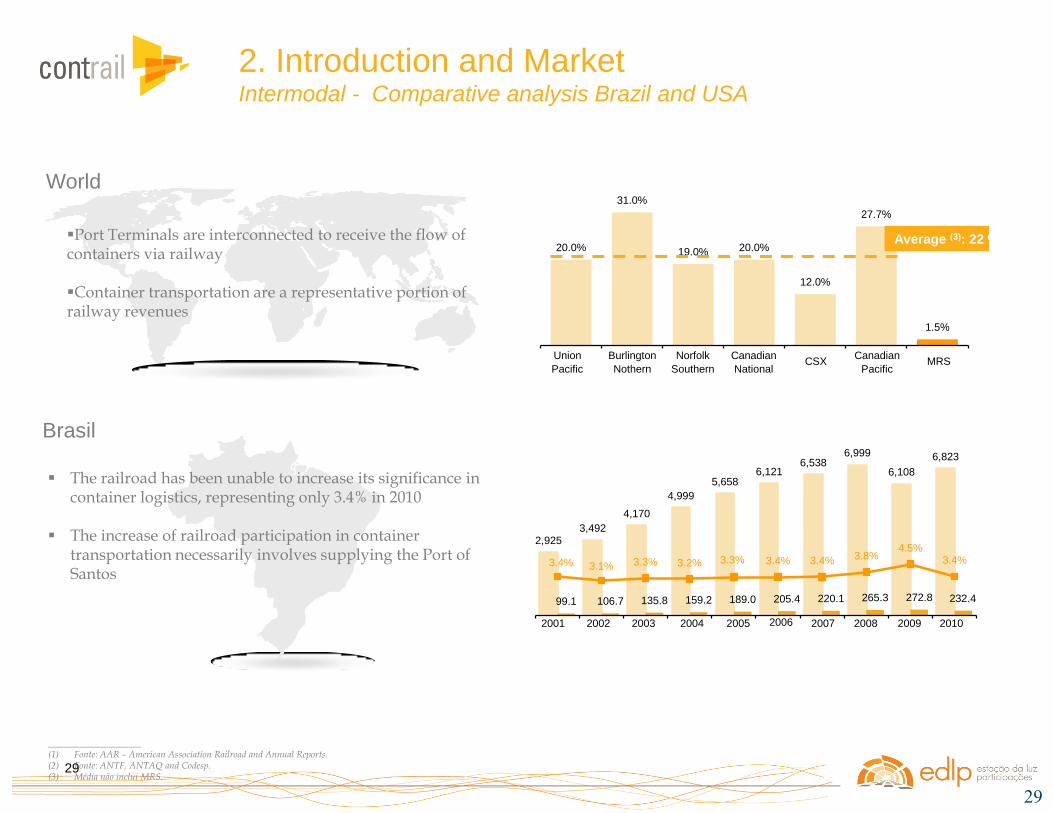
The railroad has been unable to increase its significance in
container logistics, representing only 3.4% in 2010 The increase of railroad participation in container
transportation necessarily involves supplying the Port of Santos
____________________ (1) Fonte: AAR – American Association Railroad and Annual Reports. (2) Fonte: ANTF, ANTAQ and Codesp. (3) Média não inclui MRS.
6,1216,538
6,999
6,108
6,823
205.4 220.1 265.3 272.8 232.4
5,658
4,999
4,170
3,4922,925
189.0159.2135.8106.799.1
3.4% 3.4% 3.8%4.5%
3.4%3.3%3.2%3.3%3.1%3.4%
2001 2002 2003 2004 2005 2006 2007 2008 2009 2010
29
Port Terminals are interconnected to receive the flow of containers via railway Container transportation are a representative portion of railway revenues
World
Brasil
2. Introduction and Market Intermodal - Comparative analysis Brazil and USA

30
Multimodal transportation
Existence of hubs on ports
Marine terminals are
interconnected to railroads
Large operators consolidate
cargo for railway transportation No cargo consolidators for railway
logistics and transportation
97% concentration on highways
No rail Hubs
Depots do not give support or
serve railroads
Developed
Countries
BRAZIL
Depots perform logistics of empty
containers along the railroad
Use of double-stack rail cars
Operational inefficiencies
between railroad and ports
Use of single-stack rail
cars
____________________ Fonte: Codesp. (1) Referente ao Porto de Santos.
30
2. Introduction and Market Intermodal - Comparative analysis Brazil and USA

31
Porto de Santos: complete chaos "Port of Santos should experience a period of total chaos from April to October, which will extend to all roads linking the Planalto to the access routes and within the port range. This is the drainage period of grain harvest and sugar ... With the harvest of grains, the forecast of the Sindicato das Empresas de Transporte de Carga do Litoral Paulista (Sindisan) is that there will be over 15 000 trucks moving a day on local roads, when the flow is typically 10
to 11 thousand. " Revista Portos e Navios, April 25, 2011
Interview - We must change the transportation matrix "The capacity of some ports will double, as is the case of Santos, when refering to containers ... What is required in order to avoid a queue of ships on the Brazilian coast is the facilitation of access to the pier, through massive investments in roads, railways and waterways. Therefore, using European countries which are champion in logistics infrastructure, such as Germany, Sweden, Netherlands and Luxembourg as example, it is possible to conclude that Brazil needs to direct resources to ensure the intermodal transportation.” Brasil Econômico, April 14, 2011
Port suffers from a 'chronic‘ disease "The Port of Santos broke the record of cargo transportation in August ... The landmark, which should be celebrated ..., drew attention to an increasingly serious situation: a chronic problem of infrastructure. In the Santos channel, ships queue up waiting for a place to dock on one of the terminals, the traffic on highways and in the city is hell because of the accumulation of trucks trying to load or unload their cargo." Rede Anhanguera de Noticias, October 10, 2010
Main bottleneck is the lack of access to ports "According to former Minister of Ports, Pedro Brito, the lack of access to Brazilian ports is the main bottleneck to boost exports ... an example is the Port of Santos, responsible for most of the volume transported in and out of Brazil... But how can we think of a circulation of 15 000 trucks per day, which by 2014 will increase to 45 thousand trucks a day?, he questions. He points out that the only viable solution is the improvement of the railway
and waterway. " Revista Portos e Navios, March 22, 2011
31
2. Introduction and Market Santos Port Acess – Lack of Infrastructure
32
Mission 1
Market 2
Contrail 3
33
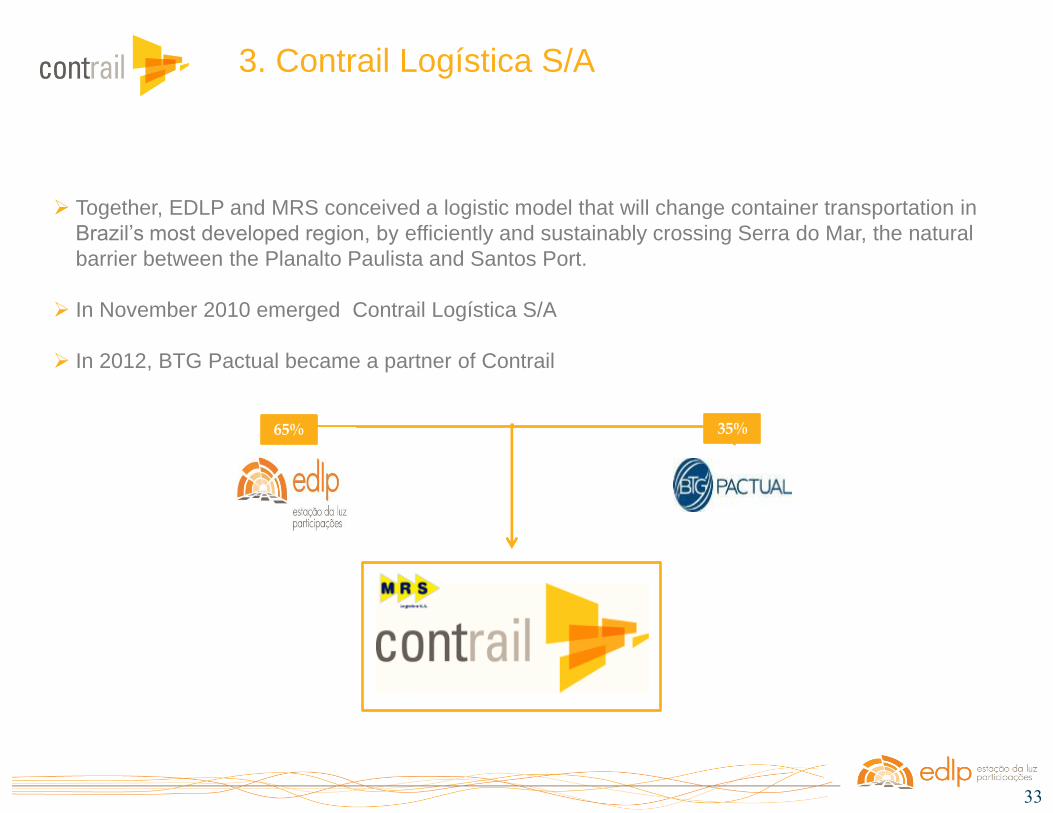
Contrail
EDLP (65%)
BTG Pactual (35%)
MRS Logística
65%
Together, EDLP and MRS conceived a logistic model that will change container transportation in
Brazil’s most developed region, by efficiently and sustainably crossing Serra do Mar, the natural
barrier between the Planalto Paulista and Santos Port.
In November 2010 emerged Contrail Logística S/A
In 2012, BTG Pactual became a partner of Contrail
3. Contrail Logística S/A
35%
34
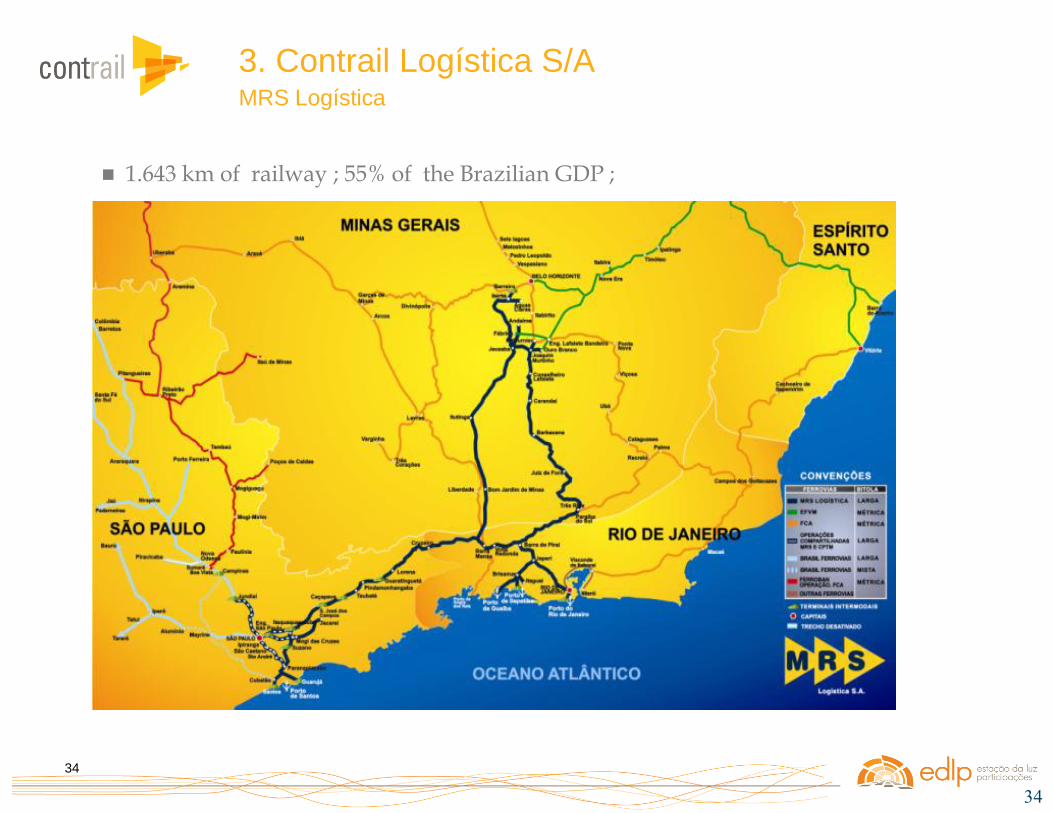
1.643 km of railway ; 55% of the Brazilian GDP ;
34
3. Contrail Logística S/A MRS Logística

35 35
DOUBLE-STACK RAILCAR RAIL HUB
TIPS – Intermodal Terminal of Santos Port
3. Contrail Logística S/A
A new logistics concepts

36
Port of Santos
TIPS RAIL HUB
Client 11 Client 12 Client 13
Mooca N
Client 14 Client 21 Client 22 Client 23 Client 24 Client N1 Client N2 Client N3 Client N4
Left Bank Right
Bank
São José dos
Campos
Inland Train
Shuttle Train
36
3. Contrail Logística S/A Operation concept

37
Standard Train – Approximately 800m
80 to 130 TEUs
160 to 200 TEUs
Single Stack Railcar Double Stack
Contrail
Capacity per trip
(TEUs)
37
More capacity, the same space
3. Contrail Logística S/A Double Stak Railcar
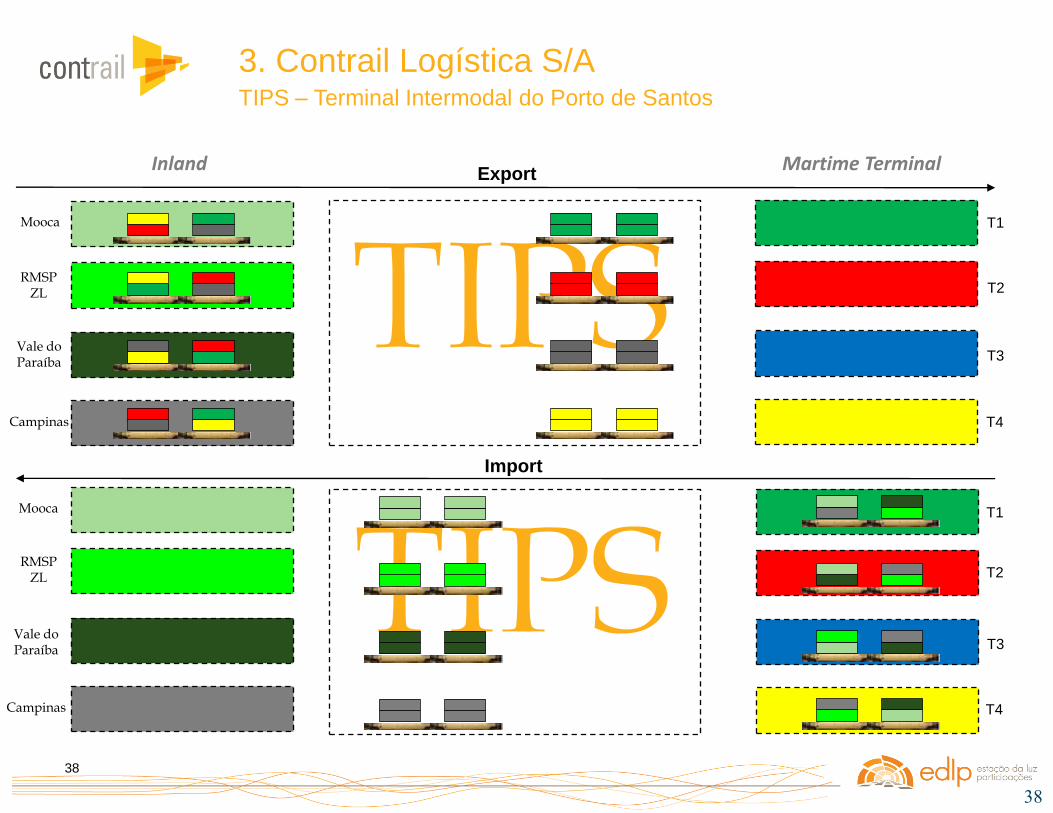
38
Inland Martime Terminal
Mooca
RMSP ZL
Vale do Paraíba
Campinas
Mooca
RMSP ZL
Vale do Paraíba
Campinas
T1
T2
T3
T4
T1
T2
T3
T4
Export
Import
38
3. Contrail Logística S/A TIPS – Terminal Intermodal do Porto de Santos

39
Ilha dos Bagres
Ilha de Piaçaguera
Ilha de Barnabe
MRS Logística ALL – América Latina Logística
TIPS- HUB
39
Capacity: 1,2 MM TEUS/YEAR
Area: 300.000m²
TIPS - Santos Port Railway HUB’s strategic
location allows the regulation of the flow of
containers and serves both banks of the Port
3. Contrail Logística S/A TIPS – Terminal Intermodal do Porto de Santos
More capacity, the same rail assets

40
Porto de Santos
Rio Grande da Serra
Brás
Lapa
Perus
Suzano Estudantes
Port of Santos - Market Share
3%
97%
Ferrovia Rodovia
25%
75%
Ferrovia Rodovia
2010 2017
Manoel Feio
MRS Logística
CPTM
MRS Logística/CPTM
Jundiaí
East Segregation: Suzano to Manoel Feio: 12km
Southeast Segregation: Rio Grande da Serra to Mooca: 33km
Ferroanel Norte Perus to Manoel Feio: 44km
Northwest Segregation Lapa to Jundiaí: 54km
Cograil: Increasing the capacity Start Operation: Jan 2013
Jundiaí e Campinas Starts: 2015
ABC, Mooca e Lapa Starts: 2nd Semester 2014
Zona Leste e Vale do Paraíba Starts: 1st Semester 2014
3. Contrail Logística S/A Infrastructure and Deployment

41
Febrasa Ferrovias Brasileiras S.A.
42
In the new cargo railway Brazilian model EDLP, in partnership with leading private sector players, is contributing alongside the Federal Govern to establish the new set of rules.
Febrasa

43
PNLF
Lines under evaluation
PAC under Execution
PNLF – National Railroad Logistics Plan

44
How to materialize?
New regulation EPL
Rebalancing the Transport Matrix
30%
35%
35%
58%
25%
17%
Public Funding BNDES
Planning ans systemic vision
EPL
Private Equity and Management

45
• Concession Model
• Builts permanent way • Maintenance of Permanent Way • Manages traffic control • Financed by BNDES • Full capacity sold to Valec
Operators
“Open Access” Model
• Buy capacity from Valec • Invest in rolling stock • Train operation • Sell freight transportation to final customers
New Regulation
Infrastructure Manager (GIF)
Existing Concessionary
Independent Operator Cargo owner
46
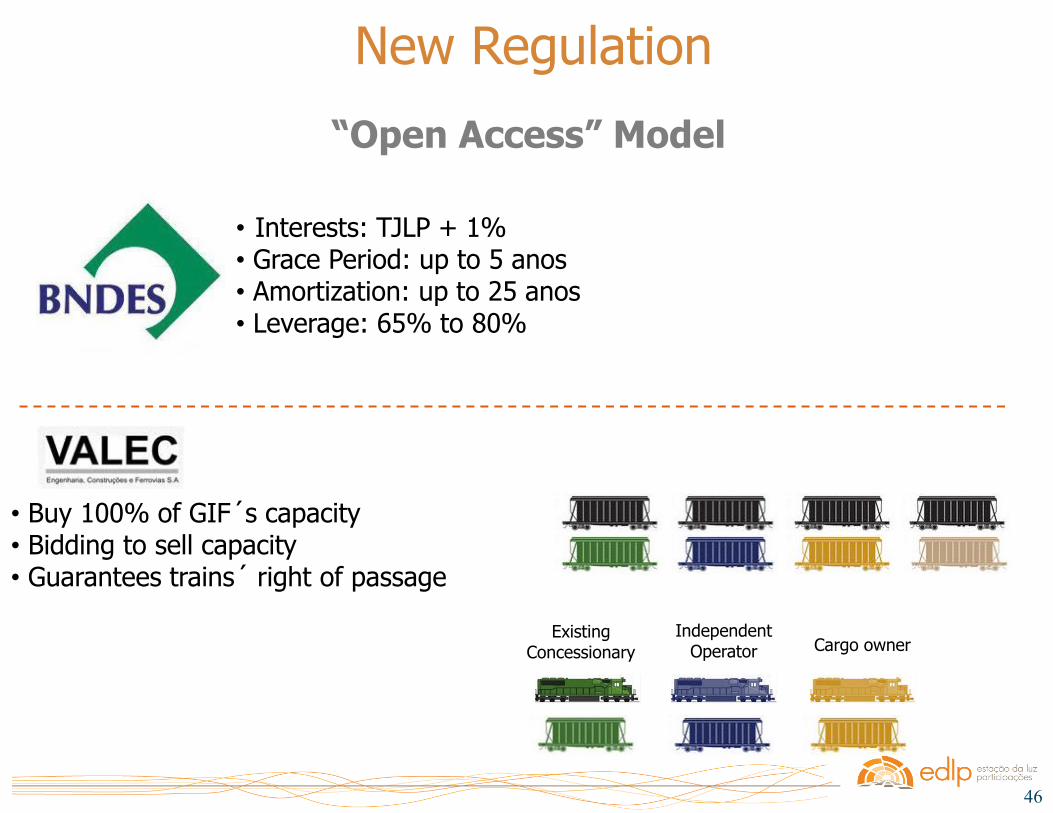
“Open Access” Model
New Regulation
• Interests: TJLP + 1% • Grace Period: up to 5 anos • Amortization: up to 25 anos • Leverage: 65% to 80%
Existing Concessionary
Independent Operator
• Buy 100% of GIF´s capacity • Bidding to sell capacity • Guarantees trains´ right of passage
Cargo owner

47
Febrasa
will be a big Train Independent Operator (OFI), supported by cargo owners, based on a high
operational efficiency and with low structural cost model, aiming to reduce drastically the
transport costs with high service levels
Febrasa
47

48
Febrasa
48
• Operate its own trains with its own freight • Operate its own trains with third parties’ freight
• Deal and purchase rail freights from other companies
Introduction – Institutional Presentation Main activities
49
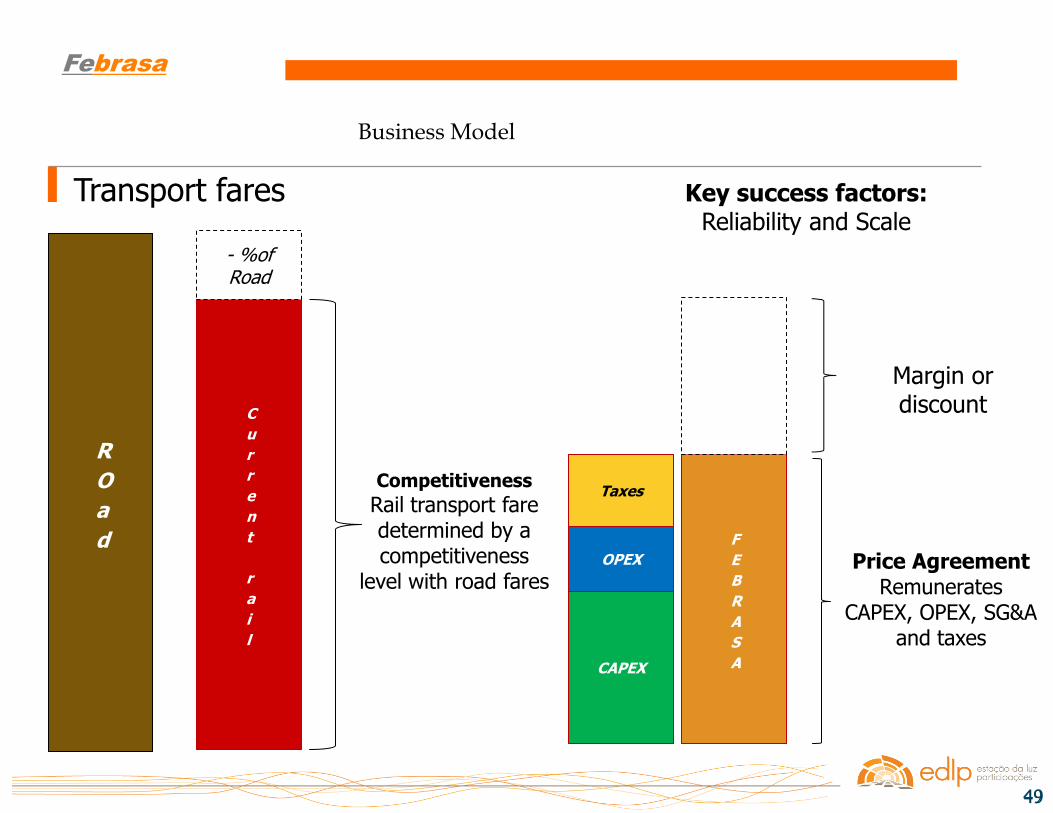
CAPEX
OPEX
Taxes
Febrasa
49
R
O
a
d
C
u
r
r
e
n
t
r
a
i
l
- %of Road
F
E
B
R
A
S
A
Transport fares
Competitiveness
Rail transport fare determined by a competitiveness
level with road fares Price Agreement
Remunerates CAPEX, OPEX, SG&A
and taxes
Margin or discount
Key success factors: Reliability and Scale
Business Model
50
Febrasa
50
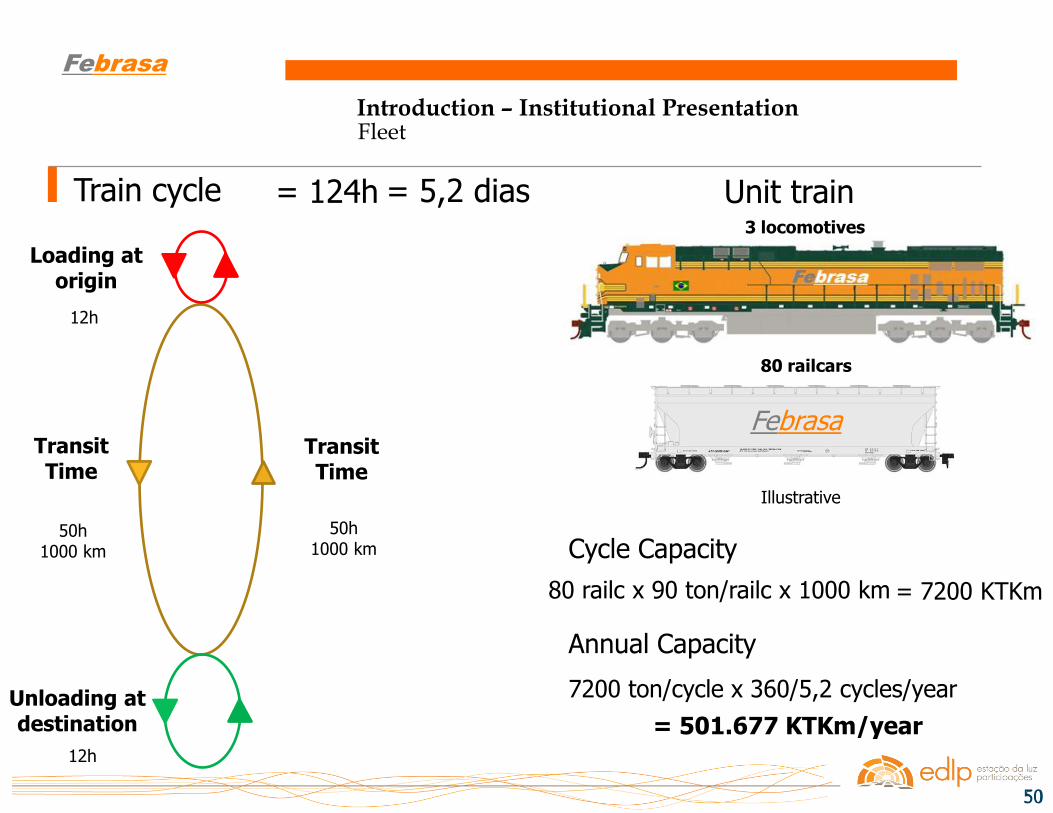
Train cycle
Loading at origin
Transit Time
Transit Time
Unloading at destination
12h
12h
50h 1000 km
50h 1000 km
= 124h = 5,2 dias Unit train
Febrasa
Illustrative
3 locomotives
80 railcars
Cycle Capacity
80 railc x 90 ton/railc x 1000 km = 7200 KTKm
Annual Capacity
7200 ton/cycle x 360/5,2 cycles/year
= 501.677 KTKm/year
Introduction – Institutional Presentation Fleet

51
Thank you

52
Comercial Quintella
Waterway inland transport
Loading
Transhipment
Rail Transport
Arrival at Port Back

53
Reordering logistcs of sugar exports with
significant cost reductions.
• Volume: 13 million tons/year;
• ALL/Rumo Logística Contract 17+30 years;
• Investiment (CAPEX): R$ 1,2 billion:
• Rolling Stock R$ 435 MM;
• Permanent Way: R$ 524MM;
• Terminals: R$ 314 MM.
Rumo Logística
Back
54
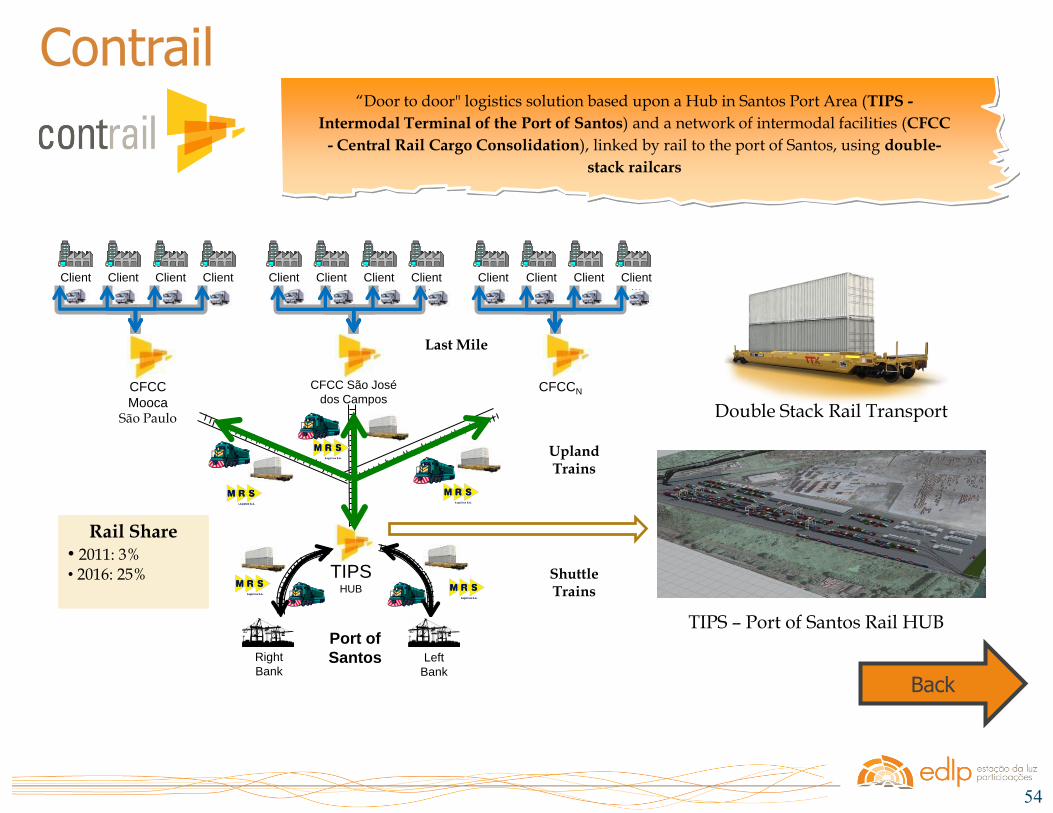
“Door to door" logistics solution based upon a Hub in Santos Port Area (TIPS -
Intermodal Terminal of the Port of Santos) and a network of intermodal facilities (CFCC
- Central Rail Cargo Consolidation), linked by rail to the port of Santos, using double-
stack railcars
Contrail
Back
Double Stack Rail Transport
Port of
Santos
TIPS HUB
Client 11
Client 12
Client 13
CFCC
Mooca São Paulo
CFCCN
Client 14
Client 21
Client 22
Client 23
Client 24
Client N1
Client N2
Client N3
Client N4
Left
Bank
Right
Bank
CFCC São José
dos Campos
Upland Trains
Shuttle Trains
TIPS – Port of Santos Rail HUB
Last Mile
Rail Share • 2011: 3% • 2016: 25%

55
FIC=TAVBrasil
Investment Fund Structure, with financial resources for TAV Brasil HS Project and creation of other funds for real estate associated opportunities investments along
Rio de Janeiro – São Paulo – Campinas HS Alignment
Back

56
Intermodality in container and general cargo logistics, offering additional
capacity to the Port of Santos
• Increase of logistic competitiveness and reliability;
• 140.000 m² area;
• Business Net Revenue of R$ 280 million.
TEVAL – Terminal Valongo Before
After
Back

57
Brasil Ferrovias Acquisition
Main Operational Synergies
• Biggest company on commodity logistic sector
• Logistic Operator for industrial cargo • Optimized capital structure
• Professional Team
• Shareholders Stocks Liquidity
• Main financial figures combined
Back
58
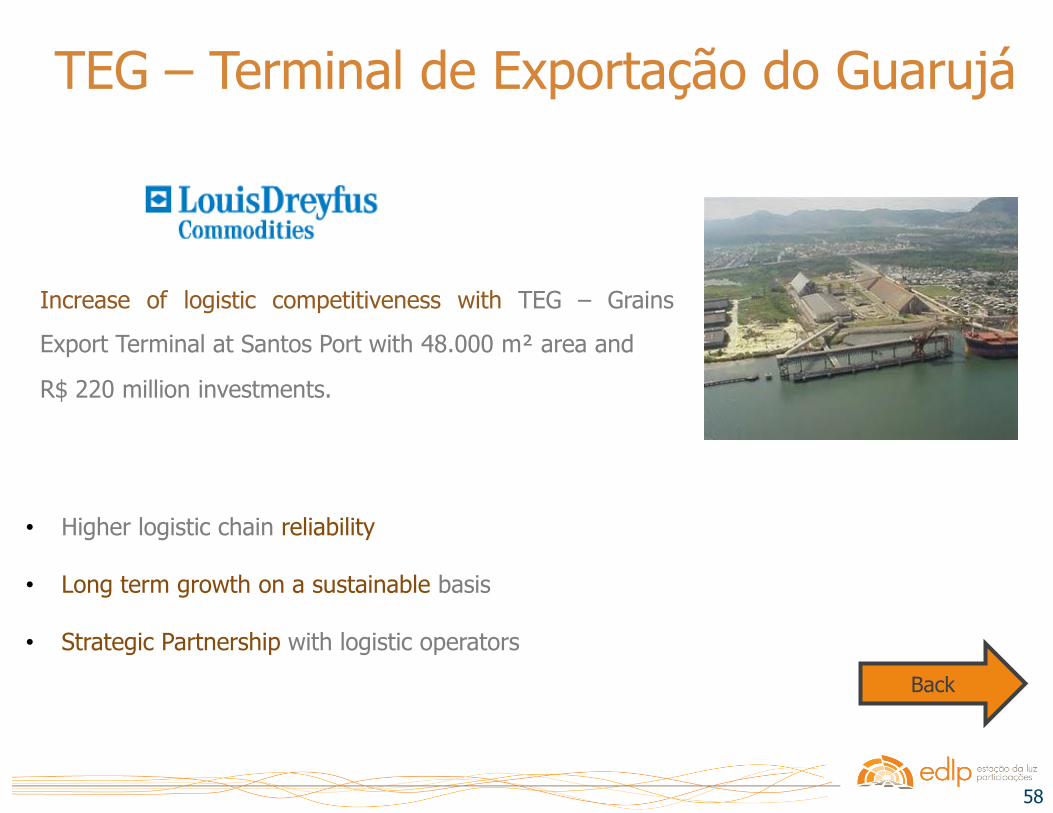
Increase of logistic competitiveness with TEG – Grains
Export Terminal at Santos Port with 48.000 m² area and
R$ 220 million investments.
TEG – Terminal de Exportação do Guarujá
• Higher logistic chain reliability
• Long term growth on a sustainable basis
• Strategic Partnership with logistic operators
Back